Leukocyte Telomere Length and Neuregulin-4 Levels in Female Patients with Acromegaly: The Relationship between Disease Activity and Body Fat Distribution

 ,
,
Abstract
:1. Introduction
2. Materials and Methods
2.1. Case Selection
2.2. Ethical Approval
2.3. Body Composition Analysis
2.4. Laboratory Measurements
2.5. Statistical Analysis
3. Results
4. Discussion
5. Conclusions
Author Contributions
Funding
Institutional Review Board Statement
Informed Consent Statement
Data Availability Statement
Conflicts of Interest
References
- Ribeiro-Oliveira, A.; Barkan, A. The Changing Face of Acromegalyg—Advances in Diagnosis and Treatment. Nat. Rev. Endocrinol. 2012, 8, 605–611. [Google Scholar] [CrossRef] [PubMed]
- Katznelson, L.; Laws, E.R.; Melmed, S.; Molitch, M.E.; Murad, M.H.; Utz, A.; Wass, J.A.H. Acromegaly: An Endocrine Society Clinical Practice Guideline. J. Clin. Endocrinol. Metab. 2014, 99, 3933–3951. [Google Scholar] [CrossRef] [PubMed]
- Ayuk, J.; Sheppard, M.C. Does Acromegaly Enhance Mortality? Rev. Endocr. Metab. Disord. 2008, 9, 33–39. [Google Scholar] [CrossRef] [PubMed]
- Bolfi, F.; Neves, A.F.; Boguszewski, C.L.; Nunes-Nogueira, V.S. Mortality in Acromegaly Decreased in the Last Decade: A Systematic Review and Meta-Analysis. Eur. J. Endocrinol. 2018, 179, 59–71. [Google Scholar] [CrossRef] [Green Version]
- Griffith, J.D.; Comeau, L.; Rosenfield, S.; Stansel, R.M.; Bianchi, A.; Moss, H.; De Lange, T. Mammalian Telomeres End in a Large Duplex Loop. Cell 1999, 97, 503–514. [Google Scholar] [CrossRef] [Green Version]
- Kong, C.M.; Lee, X.W.; Wang, X. Telomere Shortening in Human Diseases. FEBS J. 2013, 280, 3180–3193. [Google Scholar] [CrossRef]
- Turner, K.; Vasu, V.; Griffin, D. Telomere Biology and Human Phenotype. Cells 2019, 8, 73. [Google Scholar] [CrossRef] [Green Version]
- Brenner, K.A.; Nandakumar, J. Consequences of Telomere Replication Failure: The Other End-Replication Problem. Trends Biochem. Sci. 2022, 47, 506–517. [Google Scholar] [CrossRef]
- Zvereva, M.I.; Shcherbakova, D.M.; Dontsova, O.A. Telomerase: Structure, Functions, and Activity Regulation. Biochemistry 2010, 75, 1563–1583. [Google Scholar] [CrossRef] [PubMed]
- Liu, J.-P.; Wang, L.; Wang, Z.; Liu, J.-P. Roles of Telomere Biology in Cell Senescence, Replicative and Chronological Ageing. Cells 2019, 8, 54. [Google Scholar] [CrossRef] [Green Version]
- Fasching, C.L. Telomere Length Measurement as a Clinical Biomarker of Aging and Disease. Crit. Rev. Clin. Lab. Sci. 2018, 55, 443–465. [Google Scholar] [CrossRef] [PubMed]
- Gao, X.; Li, S.; Dong, S.; Li, J.; Yan, Y.; Zhang, T.; Chen, W. Association between Body Weight and Telomere Length Is Predominantly Mediated through C-Reactive Protein. J. Clin. Endocrinol. Metab. 2021, 106, E4634–E4640. [Google Scholar] [CrossRef] [PubMed]
- Brown, L.; Needham, B.; Ailshire, J. Telomere Length Among Older U.S. Adults: Differences by Race/Ethnicity, Gender, and Age. J. Aging Health 2017, 29, 1350–1366. [Google Scholar] [CrossRef] [PubMed]
- Cheng, F.; Carroll, L.; Joglekar, M.V.; Januszewski, A.S.; Wong, K.K.; Hardikar, A.A.; Jenkins, A.J.; Ma, R.C.W. Diabetes, Metabolic Disease, and Telomere Length. Lancet Diabetes Endocrinol. 2021, 9, 117–126. [Google Scholar] [CrossRef]
- Waters, M.J.; Brooks, A.J. Growth Hormone and Cell Growth. Endocr. Dev. 2012, 23, 86–95. [Google Scholar] [CrossRef] [PubMed]
- Barbieri, M.; Paolisso, G.; Kimura, M.; Gardner, J.P.; Boccardi, V.; Papa, M.; Hjelmborg, J.V.; Christensen, K.; Brimacombe, M.; Nawrot, T.S.; et al. Higher Circulating Levels of IGF-1 Are Associated with Longer Leukocyte Telomere Length in Healthy Subjects. Mech. Ageing Dev. 2009, 130, 771–776. [Google Scholar] [CrossRef]
- Villarroya, F.; Gavaldà-Navarro, A.; Peyrou, M.; Villarroya, J.; Giralt, M. The Lives and Times of Brown Adipokines. Trends Endocrinol. Metab. 2017, 28, 855–867. [Google Scholar] [CrossRef]
- Tutunchi, H.; Ostadrahimi, A.; Hosseinzadeh-Attar, M.J.; Miryan, M.; Mobasseri, M.; Ebrahimi-Mameghani, M. A Systematic Review of the Association of Neuregulin 4, a Brown Fat–Enriched Secreted Factor, with Obesity and Related Metabolic Disturbances. Obes. Rev. 2020, 21, e12952. [Google Scholar] [CrossRef]
- Pfeifer, A. NRG4: An Endocrine Link between Brown Adipose Tissue and Liver. Cell Metab. 2015, 21, 13–14. [Google Scholar] [CrossRef] [Green Version]
- Altinova, A.E. Beige Adipocyte as the Flame of White Adipose Tissue: Regulation of Browning and Impact of Obesity. J. Clin. Endocrinol. Metab. 2022, 107, E1778–E1788. [Google Scholar] [CrossRef]
- Wang, G.X.; Zhao, X.Y.; Meng, Z.X.; Kern, M.; Dietrich, A.; Chen, Z.; Cozacov, Z.; Zhou, D.; Okunade, A.L.; Su, X.; et al. The Brown Fat-Enriched Secreted Factor Nrg4 Preserves Metabolic Homeostasis through Attenuation of Hepatic Lipogenesis. Nat. Med. 2014, 20, 1436–1443. [Google Scholar] [CrossRef]
- Cai, C.; Lin, M.; Xu, Y.; Li, X.; Yang, S.; Zhang, H. Association of Circulating Neuregulin 4 with Metabolic Syndrome in Obese Adults: A Cross-Sectional Study. BMC Med. 2016, 14, 165. [Google Scholar] [CrossRef] [PubMed] [Green Version]
- Strosberg, J.; El-Haddad, G.; Wolin, E.; Hendifar, A.; Yao, J.; Chasen, B.; Mittra, E.; Kunz, P.L.; Kulke, M.H.; Jacene, H.; et al. Phase 3 Trial of 177 Lu-Dotatate for Midgut Neuroendocrine Tumors. N. Engl. J. Med. 2017, 376, 125–135. [Google Scholar] [CrossRef] [PubMed]
- Chen, Z.; Wang, G.X.; Ma, S.L.; Jung, D.Y.; Ha, H.; Altamimi, T.; Zhao, X.Y.; Guo, L.; Zhang, P.; Hu, C.R.; et al. Nrg4 Promotes Fuel Oxidation and a Healthy Adipokine Profile to Ameliorate Diet-Induced Metabolic Disorders. Mol. Metab. 2017, 6, 863–872. [Google Scholar] [CrossRef]
- Chen, L.L.; Peng, M.M.; Zhang, J.Y.; Hu, X.; Min, J.; Huang, Q.L.; Wan, L.M. Elevated Circulating Neuregulin4 Level in Patients with Diabetes. Diabetes/Metab. Res. Rev. 2017, 33, e2870. [Google Scholar] [CrossRef] [PubMed]
- Wolf, P.; Salenave, S.; Durand, E.; Young, J.; Kamenicky, P.; Chanson, P.; Maione, L. Treatment of Acromegaly Has Substantial Effects on Body Composition: A Long-Term Follow-up Study. Eur. J. Endocrinol. 2021, 186, 173–181. [Google Scholar] [CrossRef]
- Giustina, A.; Barkan, A.; Beckers, A.; Biermasz, N.; Biller, B.M.K.; Boguszewski, C.; Bolanowski, M.; Bonert, V.; Bronstein, M.D.; Casanueva, F.F.; et al. A Consensus on the Diagnosis and Treatment of Acromegaly Comorbidities: An Update. J. Clin. Endocrinol. Metab. 2020, 105, E937–E946. [Google Scholar] [CrossRef]
- Peng, X.; Huang, J.; Xia, S.; Yang, Y.; Dong, K. Association of Leukocyte Telomere Length with Metabolic Syndrome in Type 2 Diabetes Mellitus. J. Res. Med. Sci. 2021, 26, 43. [Google Scholar] [CrossRef]
- Masoro, E.J.; Austad, S.N. Handbook of the Biology of Aging; Elsevier Inc.: Amsterdam, The Netherlands, 2011; ISBN 9780123786388. [Google Scholar]
- McDonald, R.B.; Horwitz, B.A. Brown Adipose Tissue Thermogenesis during Aging and Senescence. J. Bioenerg. Biomembr. 1999, 31, 507–516. [Google Scholar] [CrossRef]
- Rana, K.S.; Arif, M.; Hill, E.J.; Aldred, S.; Nagel, D.A.; Nevill, A.; Randeva, H.S.; Bailey, C.J.; Bellary, S.; Brown, J.E. Plasma Irisin Levels Predict Telomere Length in Healthy Adults. Age 2014, 36, 995–1001. [Google Scholar] [CrossRef] [Green Version]
- Gardner, M.; Bann, D.; Wiley, L.; Cooper, R.; Hardy, R.; Nitsch, D.; Martin-Ruiz, C.; Shiels, P.; Sayer, A.A.; Barbieri, M.; et al. Gender and Telomere Length: Systematic Review and Meta-Analysis. Exp. Gerontol. 2014, 51, 15–27. [Google Scholar] [CrossRef]
- Mercado, M.; Abreu, C.; Vergara-López, A.; González-Virla, B.; Espinosa-De-los-Monteros, A.L.; Sosa- Eroza, E.; Cadena-Obando, D.; Cuevas-Ramos, D.; Portocarrero-Ortiz, L.A.; Pérez-Reyes, S.P.; et al. Surgical and Pharmacological Outcomes in Acromegaly: Real-Life Data from the Mexican Acromegaly Registry. J. Clin. Endocrinol. Metab. 2020, 105, e4567. [Google Scholar] [CrossRef] [PubMed]
- Astuti, Y.; Wardhana, A.; Watkins, J.; Wulaningsih, W. Cigarette Smoking and Telomere Length: A Systematic Review of 84 Studies and Meta-Analysis. Environ. Res. 2017, 158, 480–489. [Google Scholar] [CrossRef] [PubMed]
- Cawthon, R.M. Telomere Measurement by Quantitative PCR. Nucleic Acids Res. 2002, 30, e47. [Google Scholar] [CrossRef] [Green Version]
- Cawthon, R.M. Telomere Length Measurement by a Novel Monochrome Multiplex Quantitative PCR Method. Nucleic Acids Res. 2009, 37, e21. [Google Scholar] [CrossRef] [Green Version]
- Gasco, V.; Caputo, M.; Lanfranco, F.; Ghigo, E.; Grottoli, S. Management of GH Treatment in Adult GH Deficiency. Best Pract. Res. Clin. Endocrinol. Metab. 2017, 31, 13–24. [Google Scholar] [CrossRef]
- Ho, K.K.Y.; O’Sullivan, A.J.; Hoffman, D.M. Metabolic Actions of Growth Hormone in Man. Endocr. J. 1996, 43, S57–S63. [Google Scholar] [CrossRef] [PubMed] [Green Version]
- Freda, P.U.; Shen, W.; Heymsfield, S.B.; Reyes-Vidal, C.M.; Geer, E.B.; Bruce, J.N.; Gallagher, D. Lower Visceral and Subcutaneous but Higher Intermuscular Adipose Tissue Depots in Patients with Growth Hormone and Insulin-like Growth Factor I Excess Due to Acromegaly. J. Clin. Endocrinol. Metab. 2008, 93, 2334–2343. [Google Scholar] [CrossRef] [PubMed] [Green Version]
- Katznelson, L. Alterations in Body Composition in Acromegaly. Pituitary 2009, 12, 136–142. [Google Scholar] [CrossRef]
- Kaji, H.; Sugimoto, T.; Nakaoka, D.; Okimura, Y.; Kaji, H.; Abe, H.; Chihara, K. Bone Metabolism and Body Composition in Japanese Patients with Active Acromegaly. Clin. Endocrinol. 2001, 55, 175–181. [Google Scholar] [CrossRef]
- Gil, J.; Marques-Pamies, M.; Sampedro, M.; Webb, S.M.; Serra, G.; Salinas, I.; Blanco, A.; Valassi, E.; Carrato, C.; Picó, A.; et al. Data Mining Analyses for Precision Medicine in Acromegaly: A Proof of Concept. Sci. Rep. 2022, 12, 8979. [Google Scholar] [CrossRef]
- Saeidi, A.; Shishvan, S.R.; Soltani, M.; Tarazi, F.; Doyle-Baker, P.K.; Shahrbanian, S.; Mollabashi, S.S.; Khosravi, N.; Laher, I.; Moriarty, T.A.; et al. Differential Effects of Exercise Programs on Neuregulin 4, Body Composition and Cardiometabolic Risk Factors in Men With Obesity. Front. Physiol. 2022, 12, 797574. [Google Scholar] [CrossRef]
- Guerrero-Romero, F.; Simental-Mendía, L.E.; González-Ortiz, M.; Martínez-Abundis, E.; Ramos-Zavala, M.G.; Hernández-González, S.O.; Jacques-Camarena, O.; Rodríguez-Morán, M. The Product of Triglycerides and Glucose, a Simple Measure of Insulin Sensitivity. Comparison with the Euglycemic-Hyperinsulinemic Clamp. J. Clin. Endocrinol. Metab. 2010, 95, 3347–3351. [Google Scholar] [CrossRef] [Green Version]
- Kang, Y.E.; Kim, J.M.; Choung, S.; Joung, K.H.; Lee, J.H.; Kim, H.J.; Ku, B.J. Comparison of Serum Neuregulin 4 (Nrg4) Levels in Adults with Newly Diagnosed Type 2 Diabetes Mellitus and Controls without Diabetes. Diabetes Res. Clin. Pract. 2016, 117, 1–3. [Google Scholar] [CrossRef]
- Tutunchi, H.; Mobasseri, M.; Aghamohammadzadeh, N.; Hooshyar, J.; Naeini, F.; Najafipour, F. Serum Neuregulin 4 (NRG-4) Level and Non-Alcoholic Fatty Liver Disease (NAFLD): A Case-Control Study. Int. J. Clin. Pract. 2021, 75, e14555. [Google Scholar] [CrossRef]
- Yan, P.; Xu, Y.; Wan, Q.; Feng, J.; Li, H.; Yang, J.; Zhong, H.; Zhang, Z. Plasma Neuregulin 4 Levels Are Associated with Metabolic Syndrome in Patients Newly Diagnosed with Type 2 Diabetes Mellitus. Dis. Markers 2018, 2018, 6974191. [Google Scholar] [CrossRef] [PubMed] [Green Version]
- Liu, Y.; Chen, M. Neuregulin 4 as a Novel Adipokine in Energy Metabolism. Front. Physiol. 2023, 13, 2796. [Google Scholar] [CrossRef] [PubMed]
- Wieduwilt, M.J.; Moasser, M.M. The Epidermal Growth Factor Receptor Family: Biology Driving Targeted Therapeutics. Cell. Mol. Life Sci. 2008, 65, 1566–1584. [Google Scholar] [CrossRef] [PubMed] [Green Version]
- South, J.C.M.; Blackburn, E.; Brown, I.R.; Gullick, W.J. The Neuregulin System of Ligands and Their Receptors in Rat Islets of Langerhans. Endocrinology 2013, 154, 2385–2392. [Google Scholar] [CrossRef] [PubMed] [Green Version]
- Zhang, Y.; Zhu, Y.; Wang, J.; Jin, L.; Guo, M.; Chen, L.; Zhang, L.; Li, Y.; Wan, B.; Zhang, R.; et al. Neuregulin4 Acts on Hypothalamic ErBb4 to Excite Oxytocin Neurons and Preserve Metabolic Homeostasis. Adv. Sci. 2023, 14, 2204824. [Google Scholar] [CrossRef] [PubMed]
- Higashi, Y.; Sukhanov, S.; Anwar, A.; Shai, S.Y.; Delafontaine, P. Aging, Atherosclerosis, and IGF-1. J. Gerontol.-Ser. A Biol. Sci. Med. Sci. 2012, 67, 626–639. [Google Scholar] [CrossRef] [PubMed] [Green Version]
- Yeap, B.B.; Hui, J.; Knuiman, M.W.; Paul Chubb, S.A.; Ho, K.K.Y.; Flicker, L.; Divitini, M.L.; Arscott, G.M.; Twigg, S.M.; Almeida, O.P.; et al. Associations of Plasma IGF1, IGFBP3 and Estradiol with Leucocyte Telomere Length, a Marker of Biological Age, in Men. Eur. J. Endocrinol. 2019, 182, 23–33. [Google Scholar] [CrossRef] [PubMed]
- Higashi, Y.; Gautam, S.; Delafontaine, P.; Sukhanov, S. IGF-1 and Cardiovascular Disease. Growth Horm. IGF Res. 2019, 45, 6–16. [Google Scholar] [CrossRef]
- Laughlin, G.A.; Barrett-Connor, E.; Criqui, M.H.; Kritz-Silverstein, D. The Prospective Association of Serum Insulin-Like Growth Factor I (IGF-I) and IGF-Binding Protein-1 Levels with All Cause and Cardiovascular Disease Mortality in Older Adults: The Rancho Bernardo Study. J. Clin. Endocrinol. Metab. 2004, 89, 114–120. [Google Scholar] [CrossRef] [PubMed] [Green Version]
- Matsumoto, R.; Fukuoka, H.; Iguchi, G.; Odake, Y.; Yoshida, K.; Bando, H.; Suda, K.; Nishizawa, H.; Takahashi, M.; Yamada, S.; et al. Accelerated Telomere Shortening in Acromegaly; IGF-I Induces Telomere Shortening and Cellular Senescence. PLoS ONE 2015, 10, e0140189. [Google Scholar] [CrossRef] [Green Version]
- Vilar, L.; Vilar, C.F.; Lyra, R.; Lyra, R.; Naves, L.A. Acromegaly: Clinical Features at Diagnosis. Pituitary 2017, 20, 22–32. [Google Scholar] [CrossRef]
- Esposito, D.; Ragnarsson, O.; Johannsson, G.; Olsson, D.S. Prolonged Diagnostic Delay in Acromegaly Is Associated with Increased Morbidity and Mortality. Eur. J. Endocrinol. 2020, 182, 523–531. [Google Scholar] [CrossRef]
- Petrossians, P.; Daly, A.F.; Natchev, E.; Maione, L.; Blijdorp, K.; Sahnoun-Fathallah, M.; Auriemma, R.; Diallo, A.M.; Hulting, A.L.; Ferone, D.; et al. Acromegaly at Diagnosis in 3173 Patients from the Liège Acromegaly Survey (LAS) Database. Endocr.-Relat. Cancer 2017, 24, 505–518. [Google Scholar] [CrossRef]
- Caron, P.; Brue, T.; Raverot, G.; Tabarin, A.; Cailleux, A.; Delemer, B.; Renoult, P.P.; Houchard, A.; Elaraki, F.; Chanson, P. Signs and Symptoms of Acromegaly at Diagnosis: The Physician’s and the Patient’s Perspectives in the ACRO-POLIS Study. Endocrine 2019, 63, 120–129. [Google Scholar] [CrossRef] [Green Version]
- Menendez, J.A.; Rubio, M.A.; Campisi, J.; Lupu, R. Heregulin, a New Regulator of Telomere Length in Human Cells. Oncotarget 2015, 6, 39422–39436. [Google Scholar] [CrossRef] [Green Version]
- Allende, M.; Molina, E.; González-Porras, J.R.; Toledo, E.; Lecumberri, R.; Hermida, J. Short Leukocyte Telomere Length Is Associated with Cardioembolic Stroke Risk in Patients with Atrial Fibrillation. Stroke 2016, 47, 863–865. [Google Scholar] [CrossRef] [PubMed] [Green Version]

| Acromegaly (n = 40) | Controls (n = 39) | p | AA (n = 17) | CA (n = 23) | p | |
|---|---|---|---|---|---|---|
| Age (year) | 46.10 ± 8.79 | 42.82 ± 6.99 | 0.071 | 44.7 ± 9.88 | 47.13 ± 7.96 | 0.396 |
| BMI (kg/m2) | 29.61 ± 5.63 | 27.40 ± 4.18 | 0.520 | 28.06 ± 4.94 | 30.76 ± 5.93 | 0.136 |
| Fat (%) | 32.99 ± 7.61 | 34.99 ± 5.85 | 0.203 | 29.73 ± 8.88 | 35.35 ± 5.64 | 0.023 |
| Fat mass (kg) | 25.34 ± 9.07 | 25.21 ± 7.86 | 0.945 | 21.92 ± 9.06 | 27.83 ± 8.42 | 0.046 |
| Lean body mass (kg) | 49.56 ± 5.58 | 45.21 ± 3.80 | <0.001 | 49.67 ± 5.30 | 49.47 ± 5.72 | 0.914 |
| Lean body mass (%) | 66.70 ± 7.50 | 65.08 ± 5.84 | 0.296 | 69.80 ± 8.69 | 64.45 ± 5.70 | 0.028 |
| Visceral fat (%) | 10.28 ± 4.36 | 9.01 ± 3.55 | 0.166 | 8.68 ± 4.37 | 11.36 ± 4.37 | 0.075 |
| Truncal fat (%) | 40.41 ± 8.90 | 38.74 ± 6.88 | 0.362 | 37.41 ± 11.44 | 41.16 ± 10.47 | 0.075 |
| Fasting glucose (mg/dL) | 104.5 (78–388) | 88 (54–100) | <0.001 | 105 (75–338) | 104 (74–270) | 0.787 |
| Creatinine (mg/dL) | 0.61 ± 0.11 | 0.63 ± 0.08 | 0.354 | 0.61 ± 0.12 | 0.61 ± 0.10 | 0.909 |
| GH (ng/mL) | 1.17 (0.05–62.50) | - | - | 3.74 (1.01–62.5) | 0.58 (0.05–5.36) | <0.001 |
| IGF-1 (ng/mL) | 199 (46–704) | - | - | 410 (240–704) | 142 (46–241) | <0.001 |
| TChol (mg/dL) | 217.07 ± 51.72 | 219.74 ± 41.77 | 0.802 | 210.41 ± 55.33 | 222.00 ± 49.56 | 0.491 |
| LDL cholesterol (mg/dL) | 132.85 ± 40.07 | 141.00 ± 33.59 | 0.331 | 127.35 ± 43.41 | 136.81 ± 37.88 | 0.463 |
| HDL cholesterol (mg/dL) | 53.30 ± 10.54 | 58.71 ± 11.47 | 0.032 | 52.94 ± 11.56 | 53.56 ± 9.99 | 0.856 |
| TG (mg/dL) | 139 (69–387) | 91 (44–232) | <0.001 | 145 (69–359) | 138 (75–387) | 0.850 |
| TyG index | 4.72 (4.37–5.76) | 4.47 (4.03–4.99) | <0.001 | 4.83 ± 0.33 | 4.82 ± 0.33 | 0.887 |
| hs-CRP (ng/mL) | 813.2 (459.2–2062) | 876.6 (486.8–2422) | 0.224 | 630.2 (459.2–1868.0) | 876.6 (459.2–2062) | 0.045 |
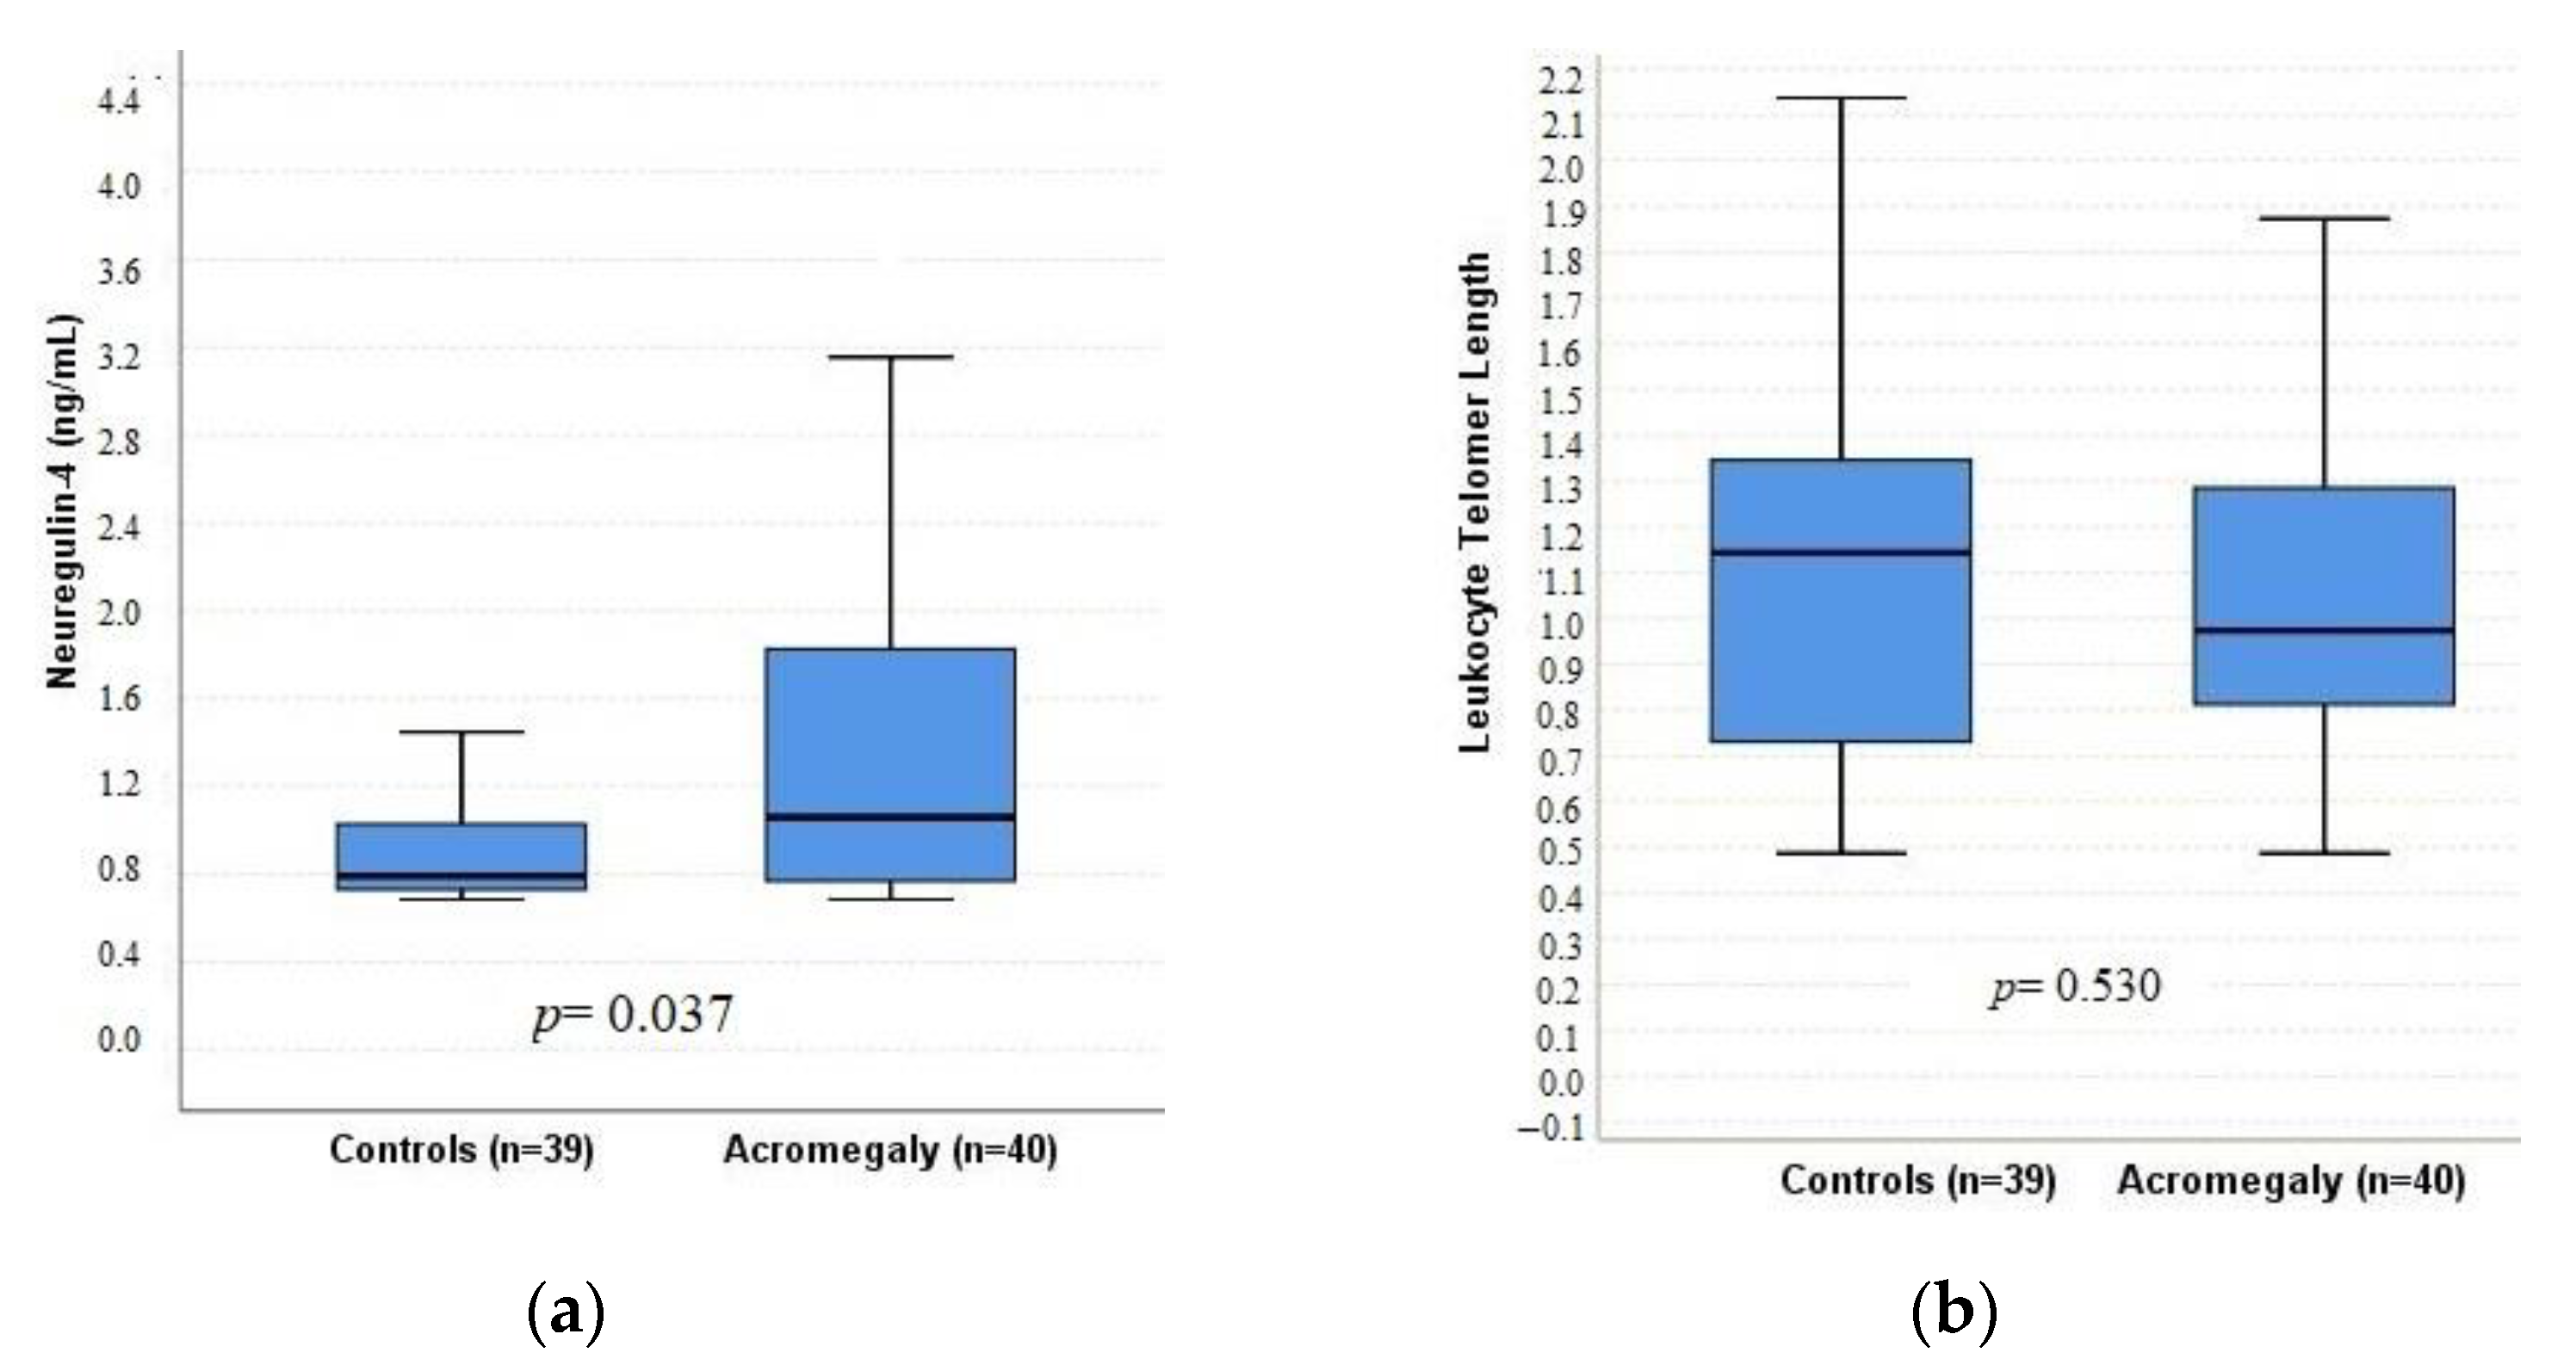
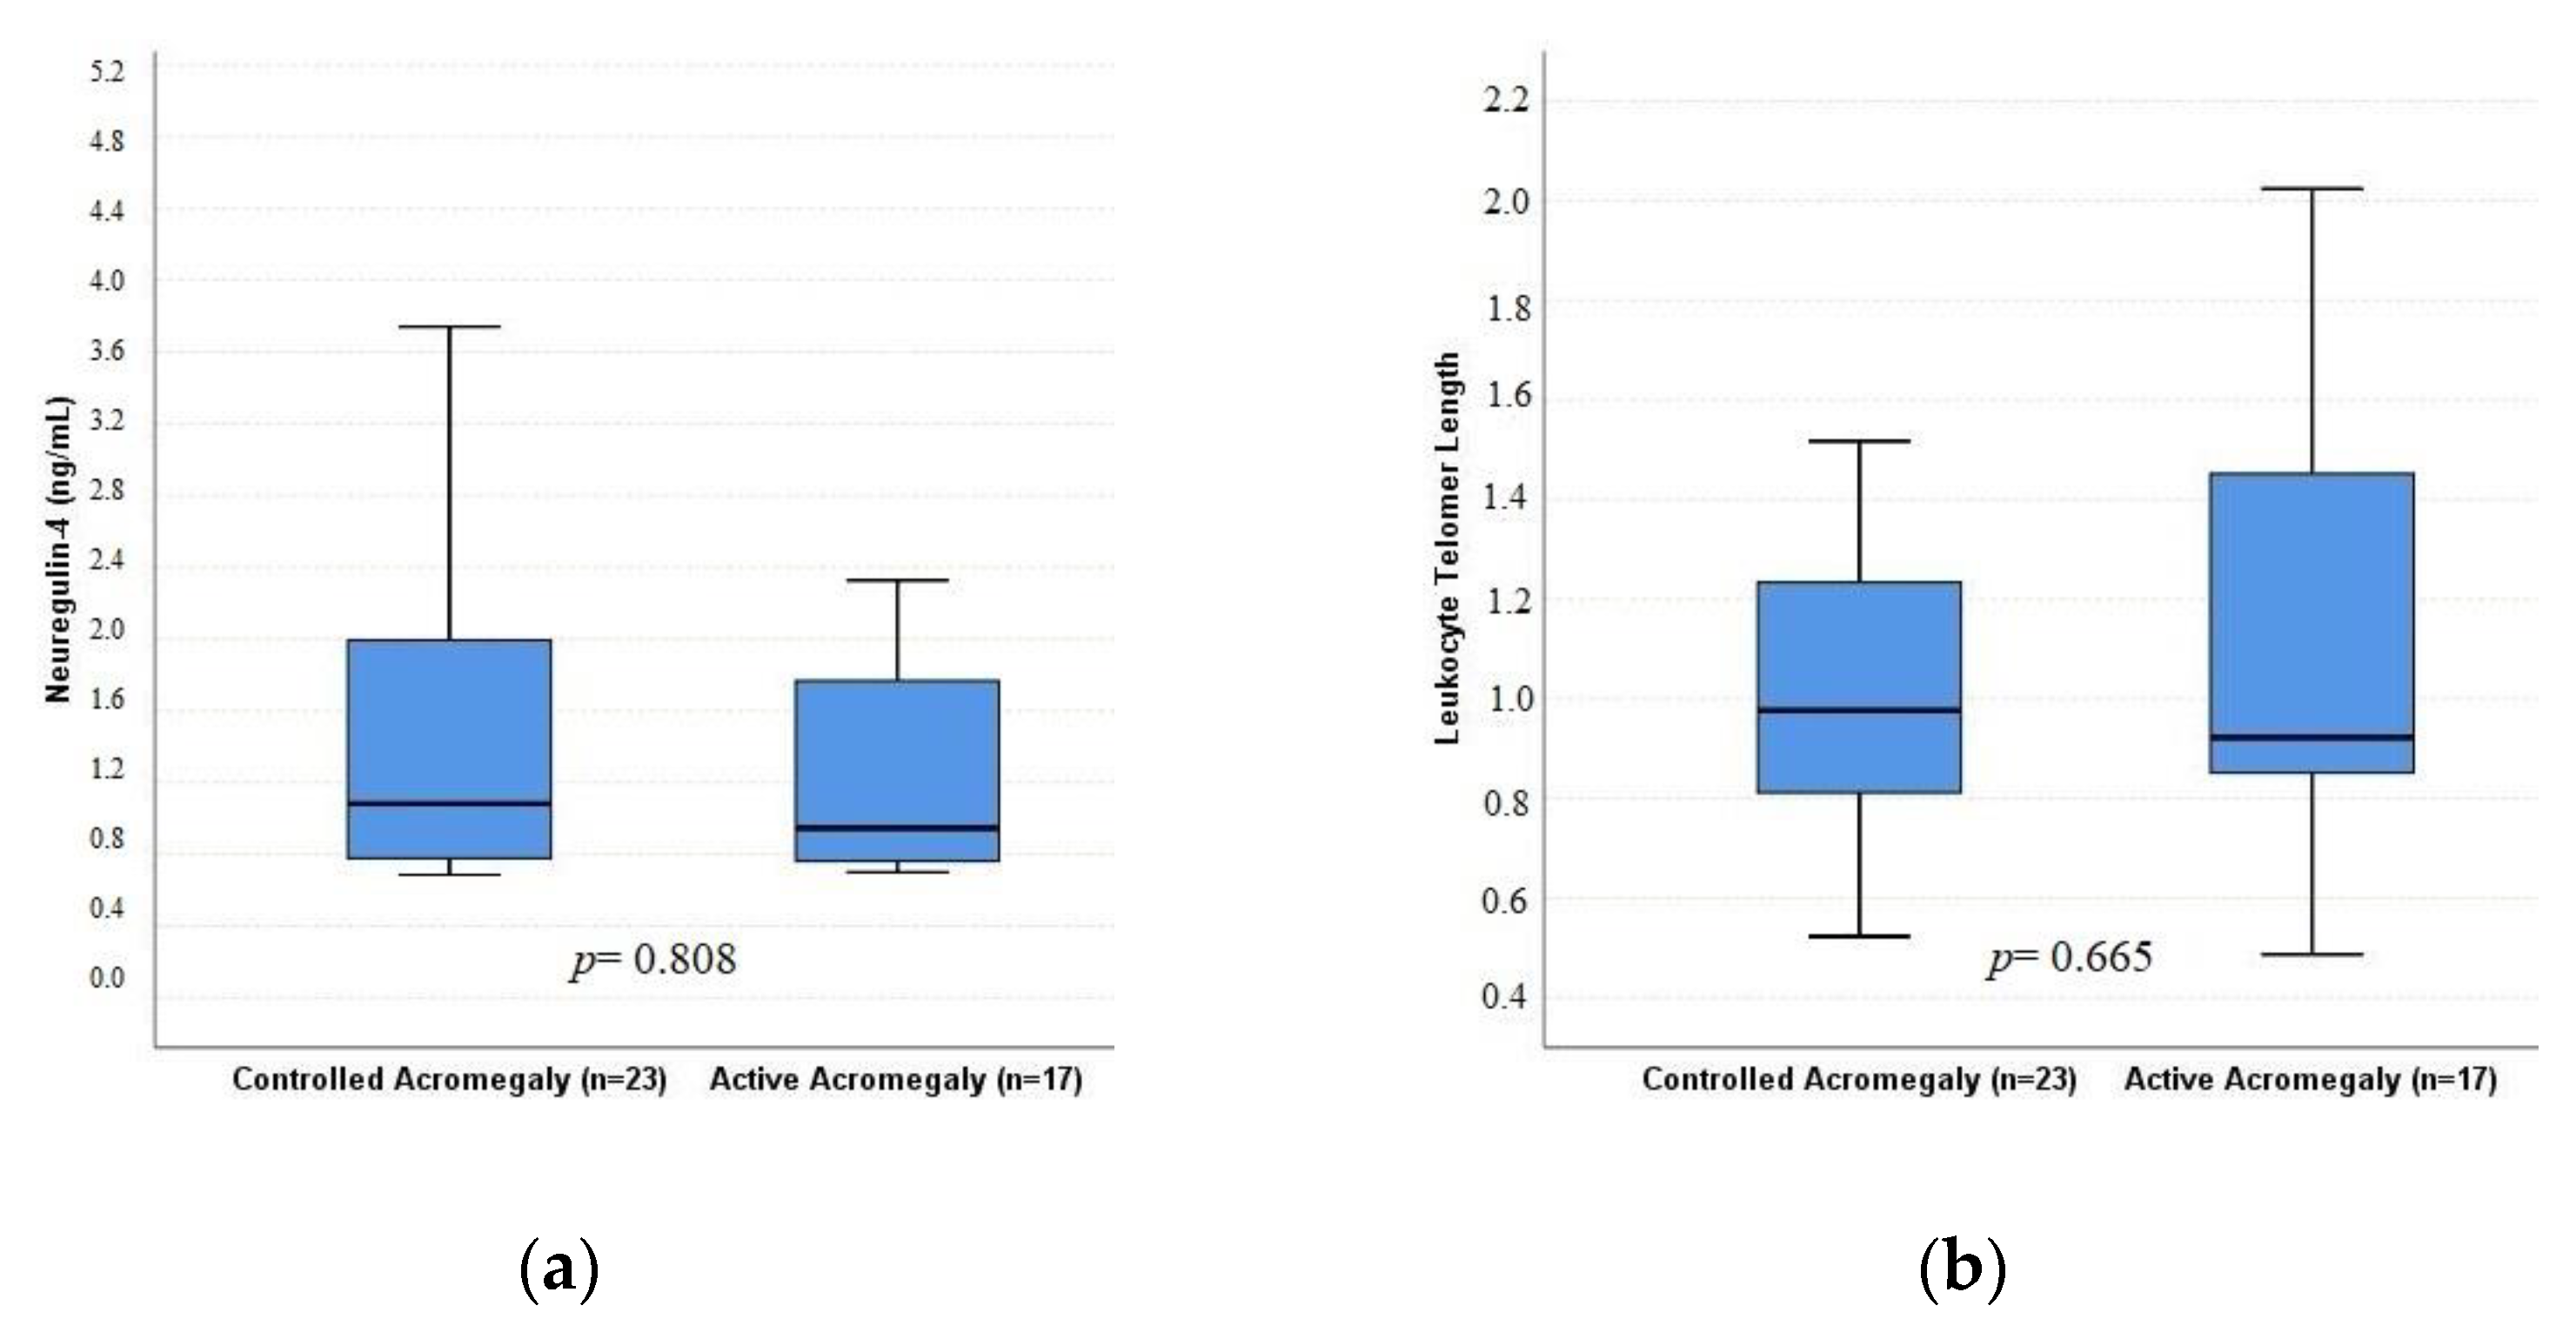
| LTL | 0.973 (0.48–2.02) | 1.14 (0.48–2.28) | 0.530 | 0.92 (0.48–2.02) | 0.97 (0.52–1.87) | 0.665 |
| T/S < 1 (%) | 60 | 43 | 0.144 | 52.9 | 65.2 | 0.522 |
| Neuregulin-4 (ng/mL) | 1.06 (0.68–4.81) | 0.79 (0.68–3.17) | 0.037 | 0.94 (0.70–3.62) | 1.08 (0.68–4.81) | 0.808 |
| Beta Coefficients | p | |
|---|---|---|
| BMI | −0.085 | 0.543 |
| Age | −0.047 | 0.696 |
| Lean body mass | 0.105 | 0.465 |
| HDL cholesterol | −0.128 | 0.291 |
| Log fasting glucose | 0.108 | 0.412 |
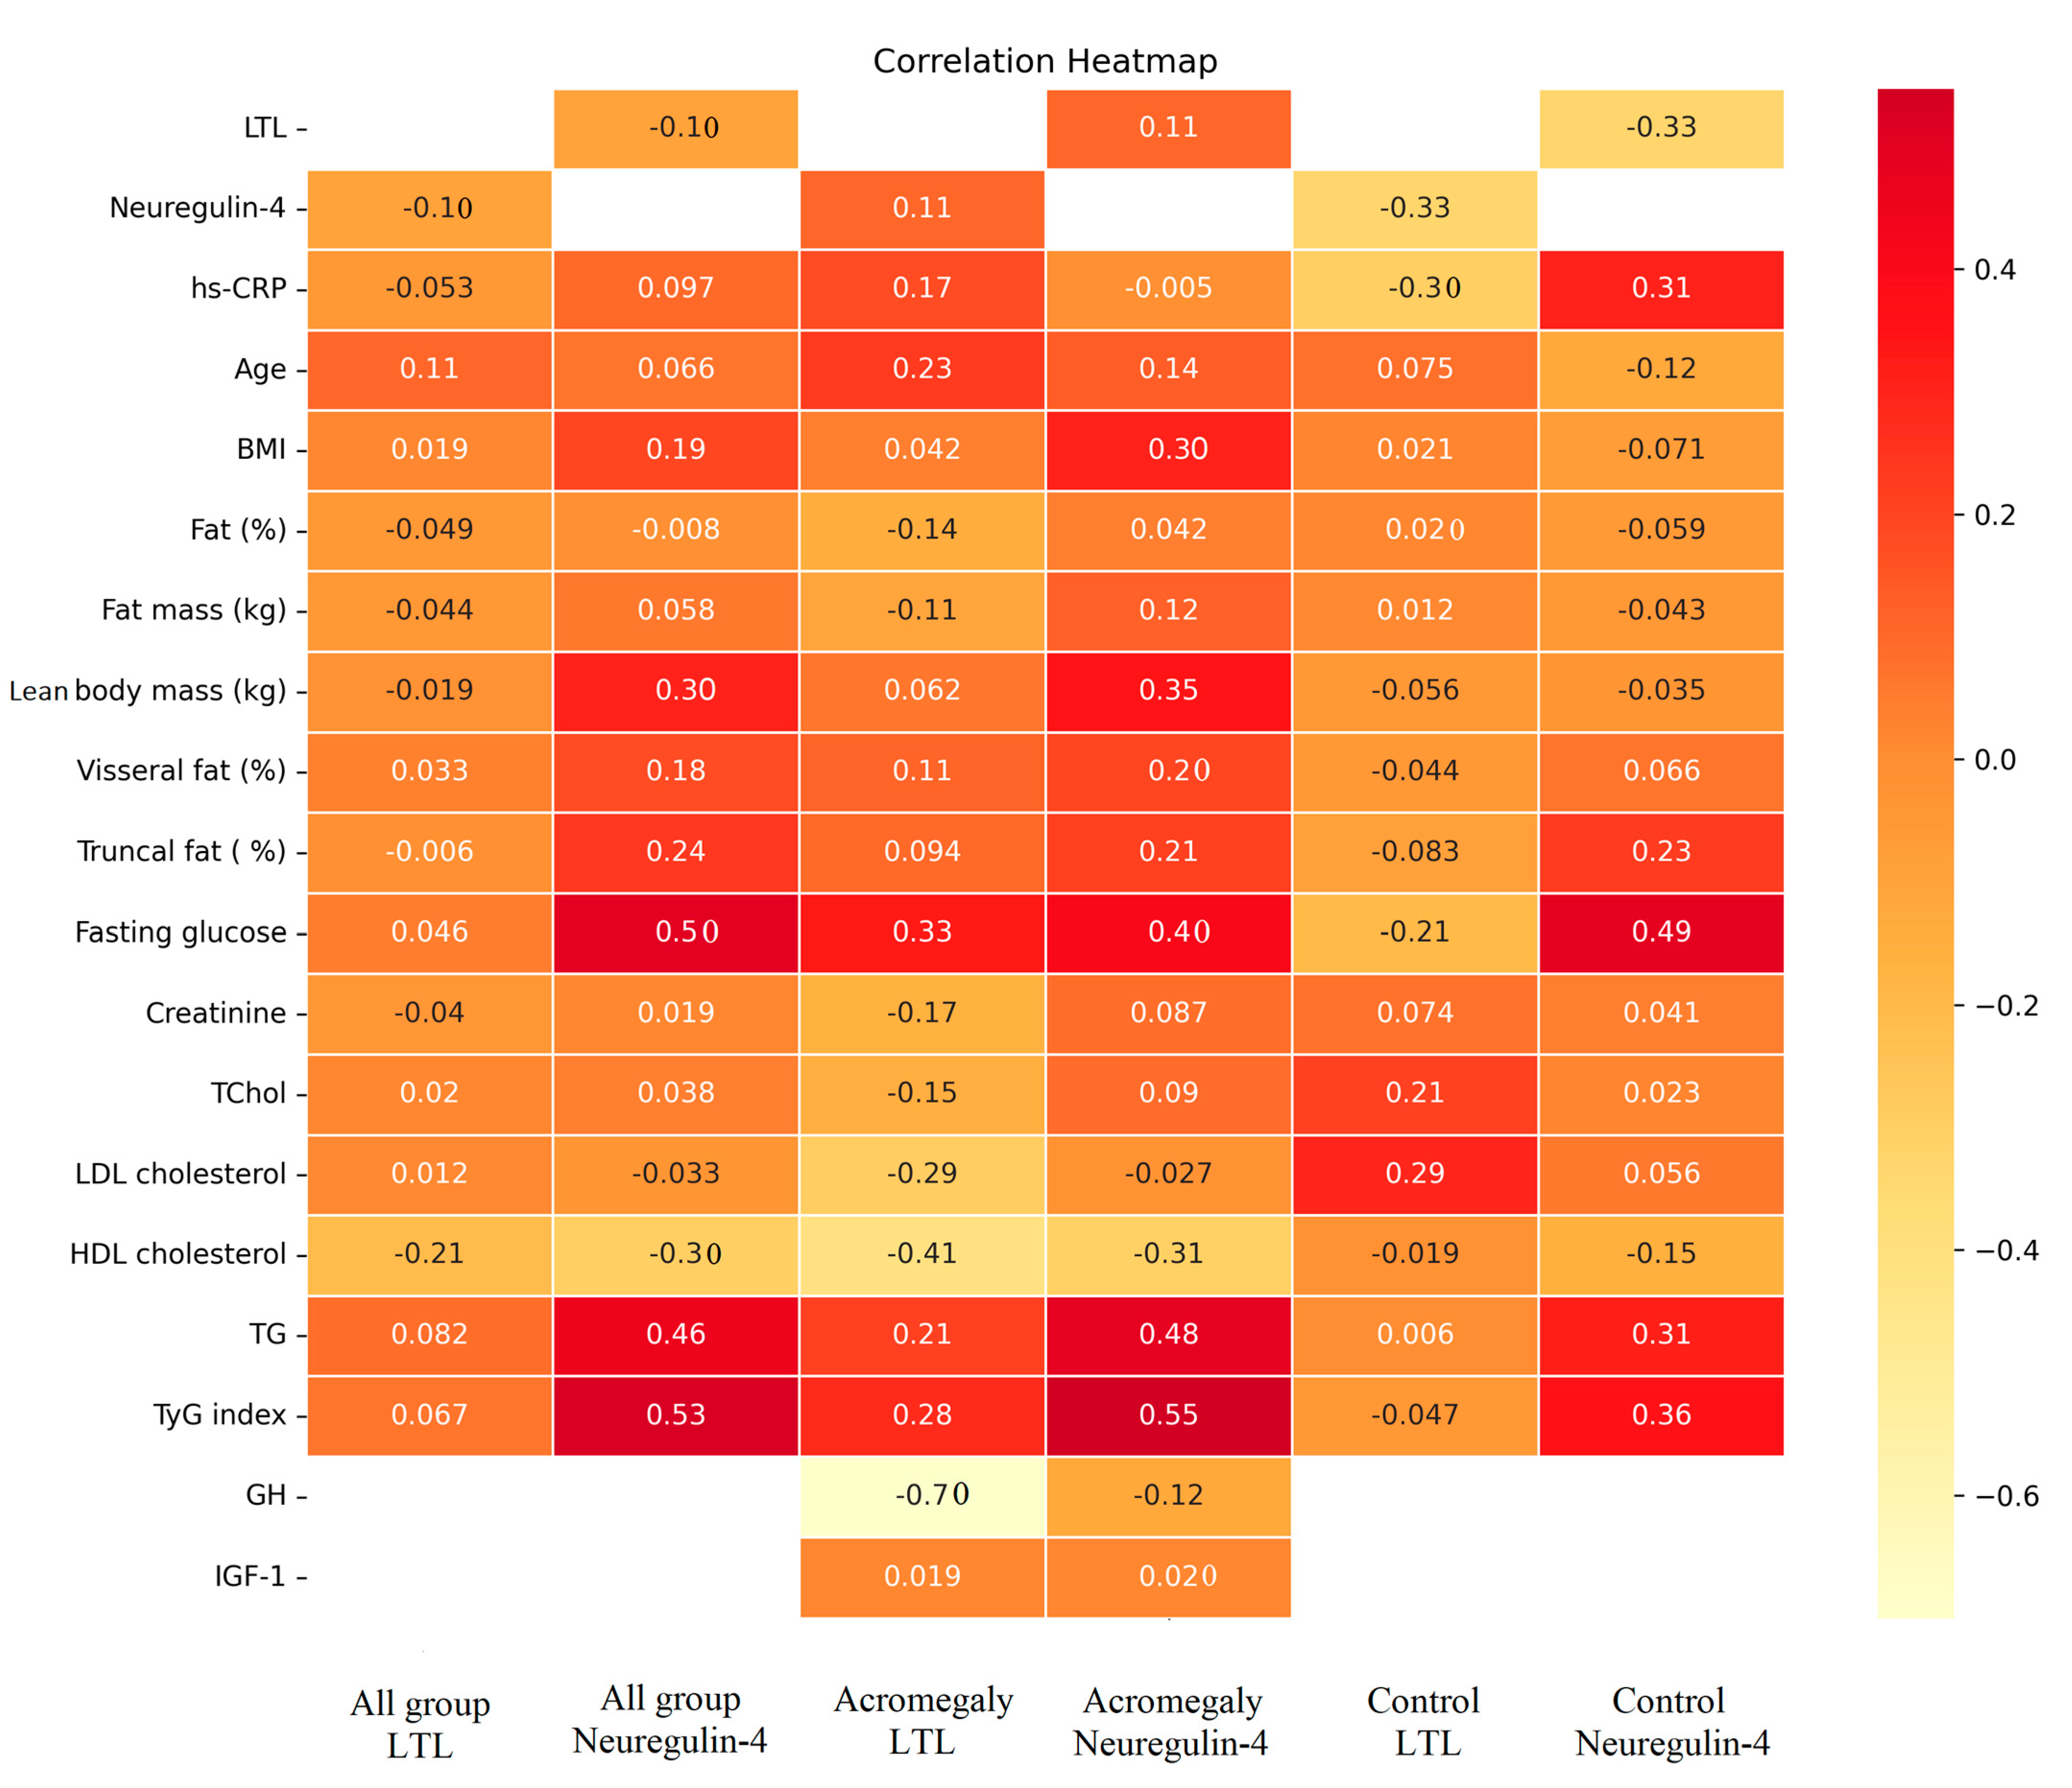
| Log TG | 0.316 | 0.025 |
Disclaimer/Publisher’s Note: The statements, opinions and data contained in all publications are solely those of the individual author(s) and contributor(s) and not of MDPI and/or the editor(s). MDPI and/or the editor(s) disclaim responsibility for any injury to people or property resulting from any ideas, methods, instructions or products referred to in the content. |
© 2023 by the authors. Licensee MDPI, Basel, Switzerland. This article is an open access article distributed under the terms and conditions of the Creative Commons Attribution (CC BY) license (https://creativecommons.org/licenses/by/4.0/).
Share and Cite
Coskun, M.; Altinova, A.E.; Babayeva, A.; Sel, A.T.; Yapar, D.; Karaca, M.; Yalcin, M.M.; Akturk, M.; Toruner, F.B.; Karakoc, M.A.; et al. Leukocyte Telomere Length and Neuregulin-4 Levels in Female Patients with Acromegaly: The Relationship between Disease Activity and Body Fat Distribution. J. Clin. Med. 2023, 12, 4108. https://doi.org/10.3390/jcm12124108
Coskun M, Altinova AE, Babayeva A, Sel AT, Yapar D, Karaca M, Yalcin MM, Akturk M, Toruner FB, Karakoc MA, et al. Leukocyte Telomere Length and Neuregulin-4 Levels in Female Patients with Acromegaly: The Relationship between Disease Activity and Body Fat Distribution. Journal of Clinical Medicine. 2023; 12(12):4108. https://doi.org/10.3390/jcm12124108
Chicago/Turabian StyleCoskun, Meric, Alev Eroglu Altinova, Afruz Babayeva, Aydin Tuncer Sel, Dilek Yapar, Mine Karaca, Mehmet Muhittin Yalcin, Mujde Akturk, Fusun Balos Toruner, Mehmet Ayhan Karakoc, and et al. 2023. "Leukocyte Telomere Length and Neuregulin-4 Levels in Female Patients with Acromegaly: The Relationship between Disease Activity and Body Fat Distribution" Journal of Clinical Medicine 12, no. 12: 4108. https://doi.org/10.3390/jcm12124108
APA StyleCoskun, M., Altinova, A. E., Babayeva, A., Sel, A. T., Yapar, D., Karaca, M., Yalcin, M. M., Akturk, M., Toruner, F. B., Karakoc, M. A., & Yetkin, I. (2023). Leukocyte Telomere Length and Neuregulin-4 Levels in Female Patients with Acromegaly: The Relationship between Disease Activity and Body Fat Distribution. Journal of Clinical Medicine, 12(12), 4108. https://doi.org/10.3390/jcm12124108