
Influence of Sociodemographic, Premorbid, and Injury-Related Factors on Post-Traumatic Stress, Anxiety, and Depression after Traumatic Brain Injury
 , ,
, ,  , ,
, ,  ,
, 
Abstract
1. Introduction
2. Methods
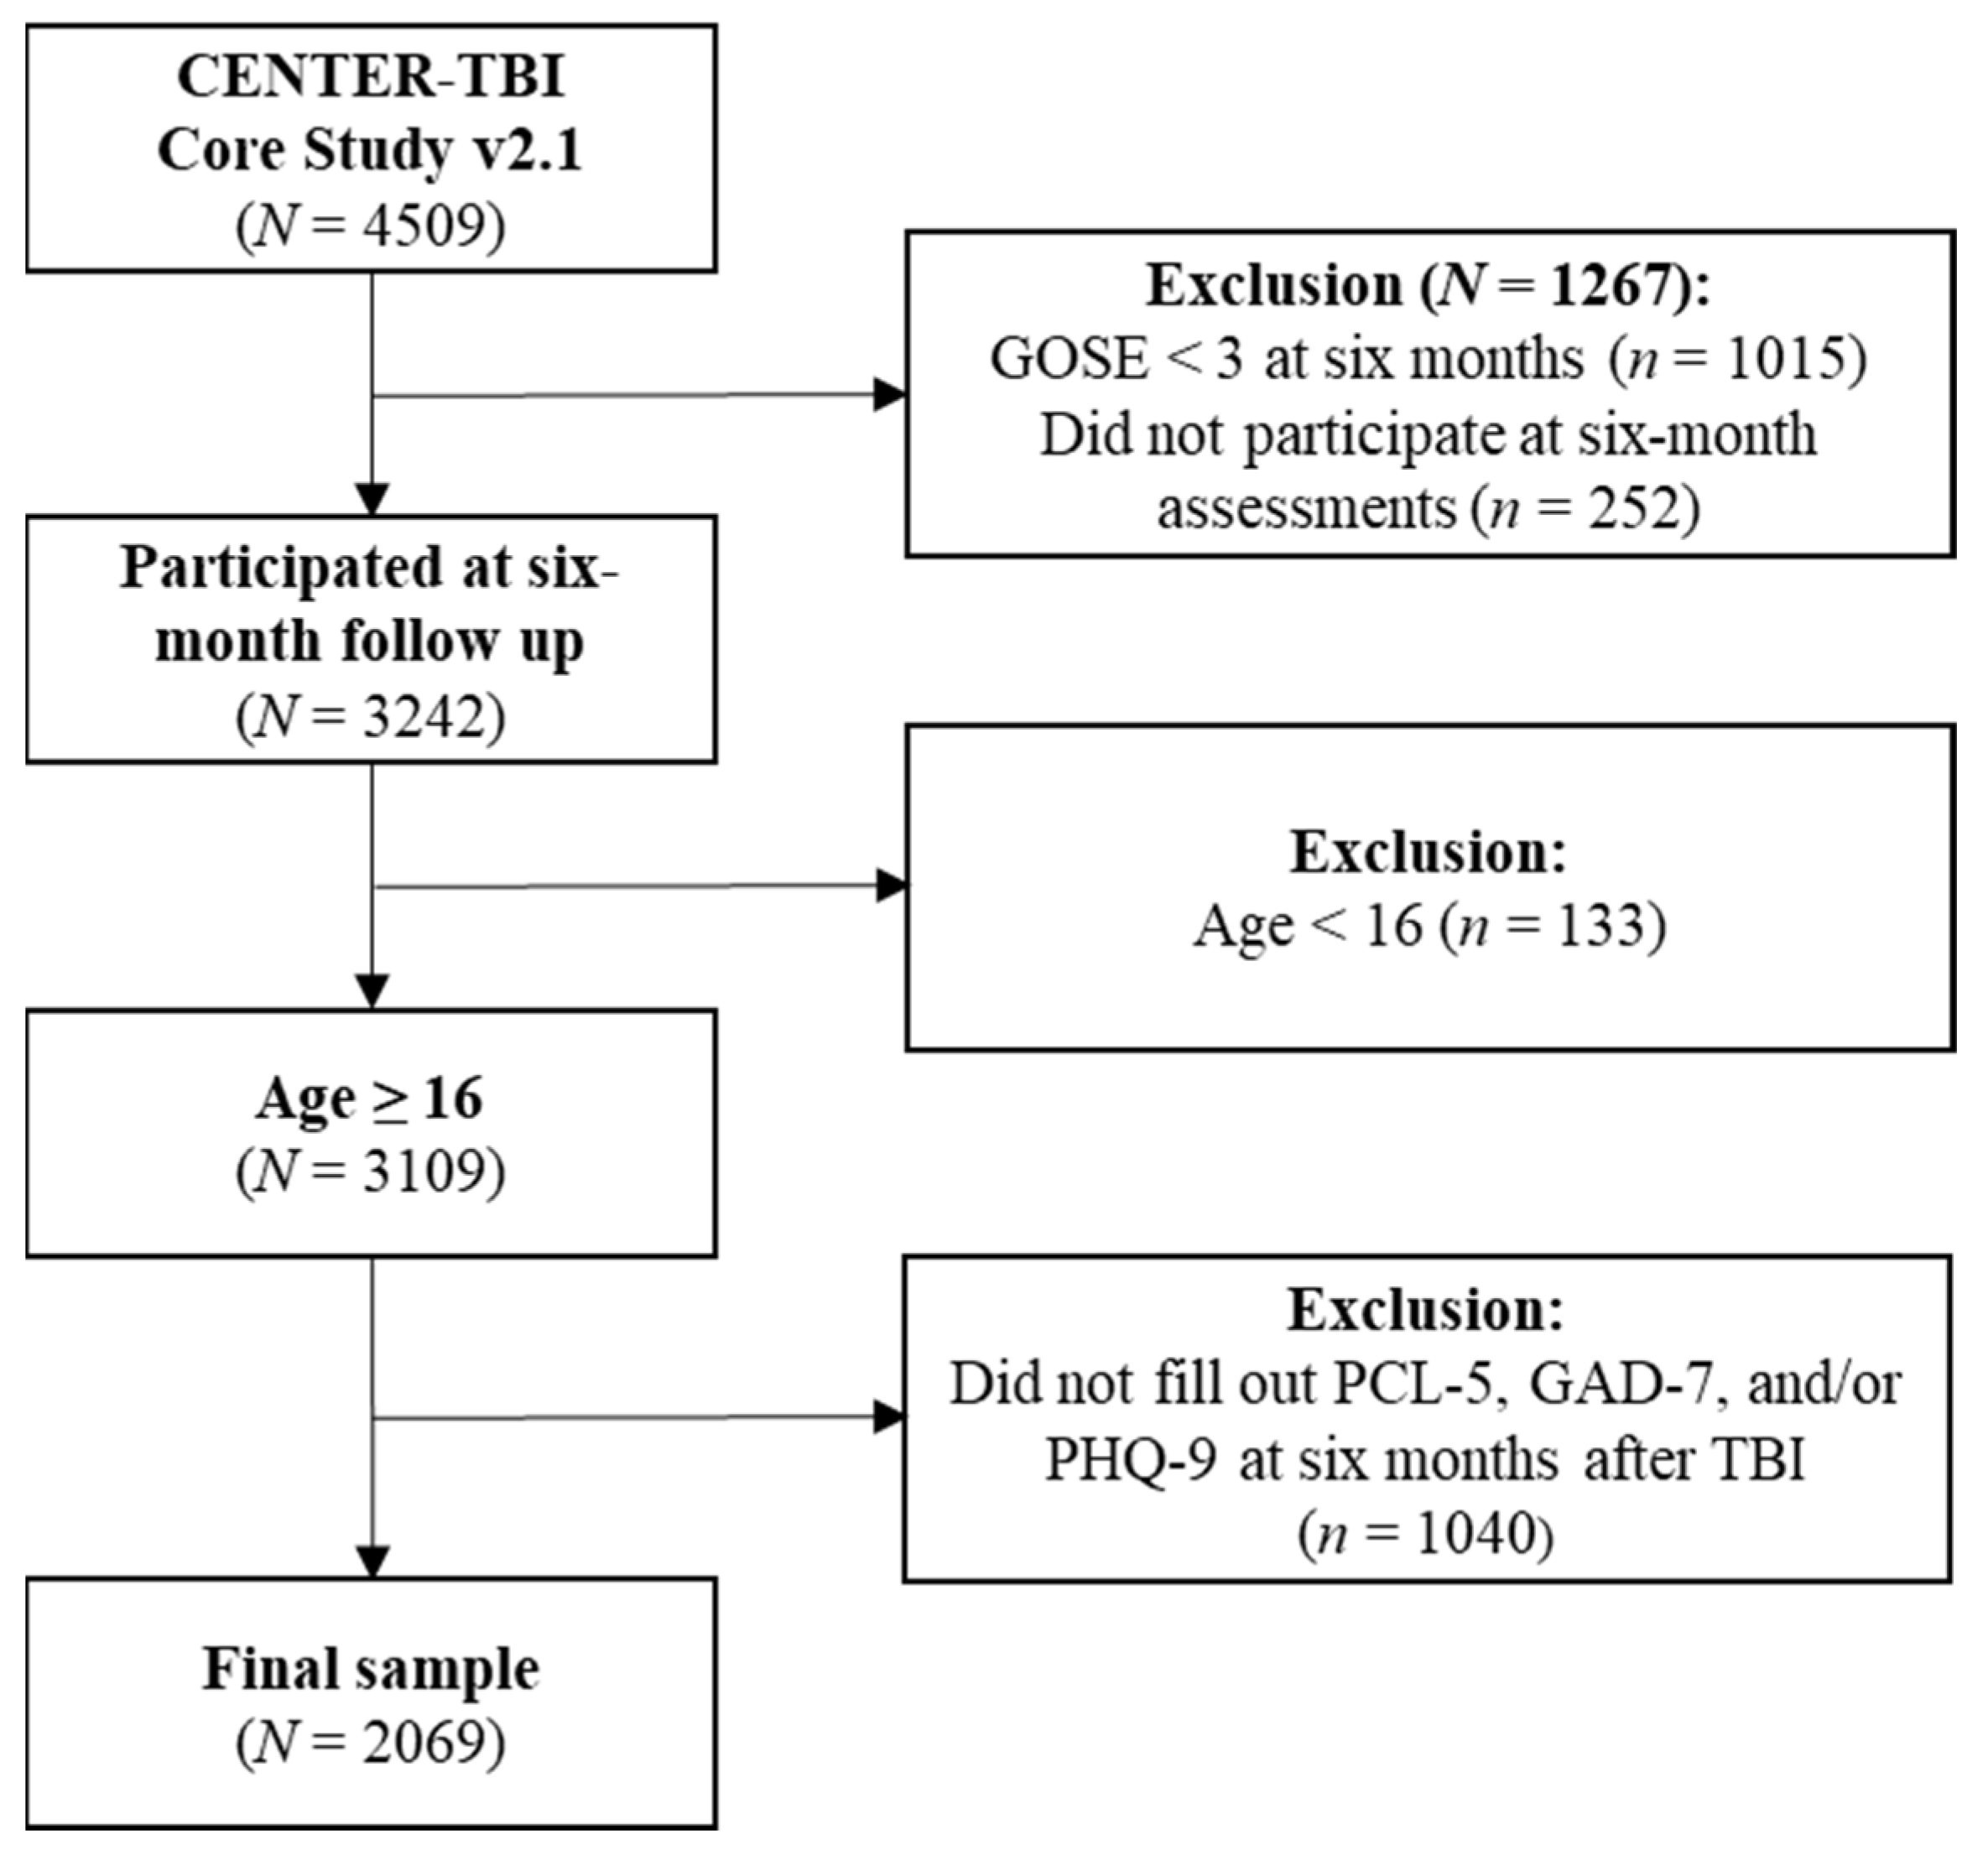
2.1. Participant Data
2.2. Ethical Approval
2.3. Instruments
2.3.1. Sociodemographic, Premorbid, and Injury-Related Factors
2.3.2. PROM Screenings for Psychopathological Symptoms
2.4. Statistical Analyses
2.4.1. Correlational Analyses
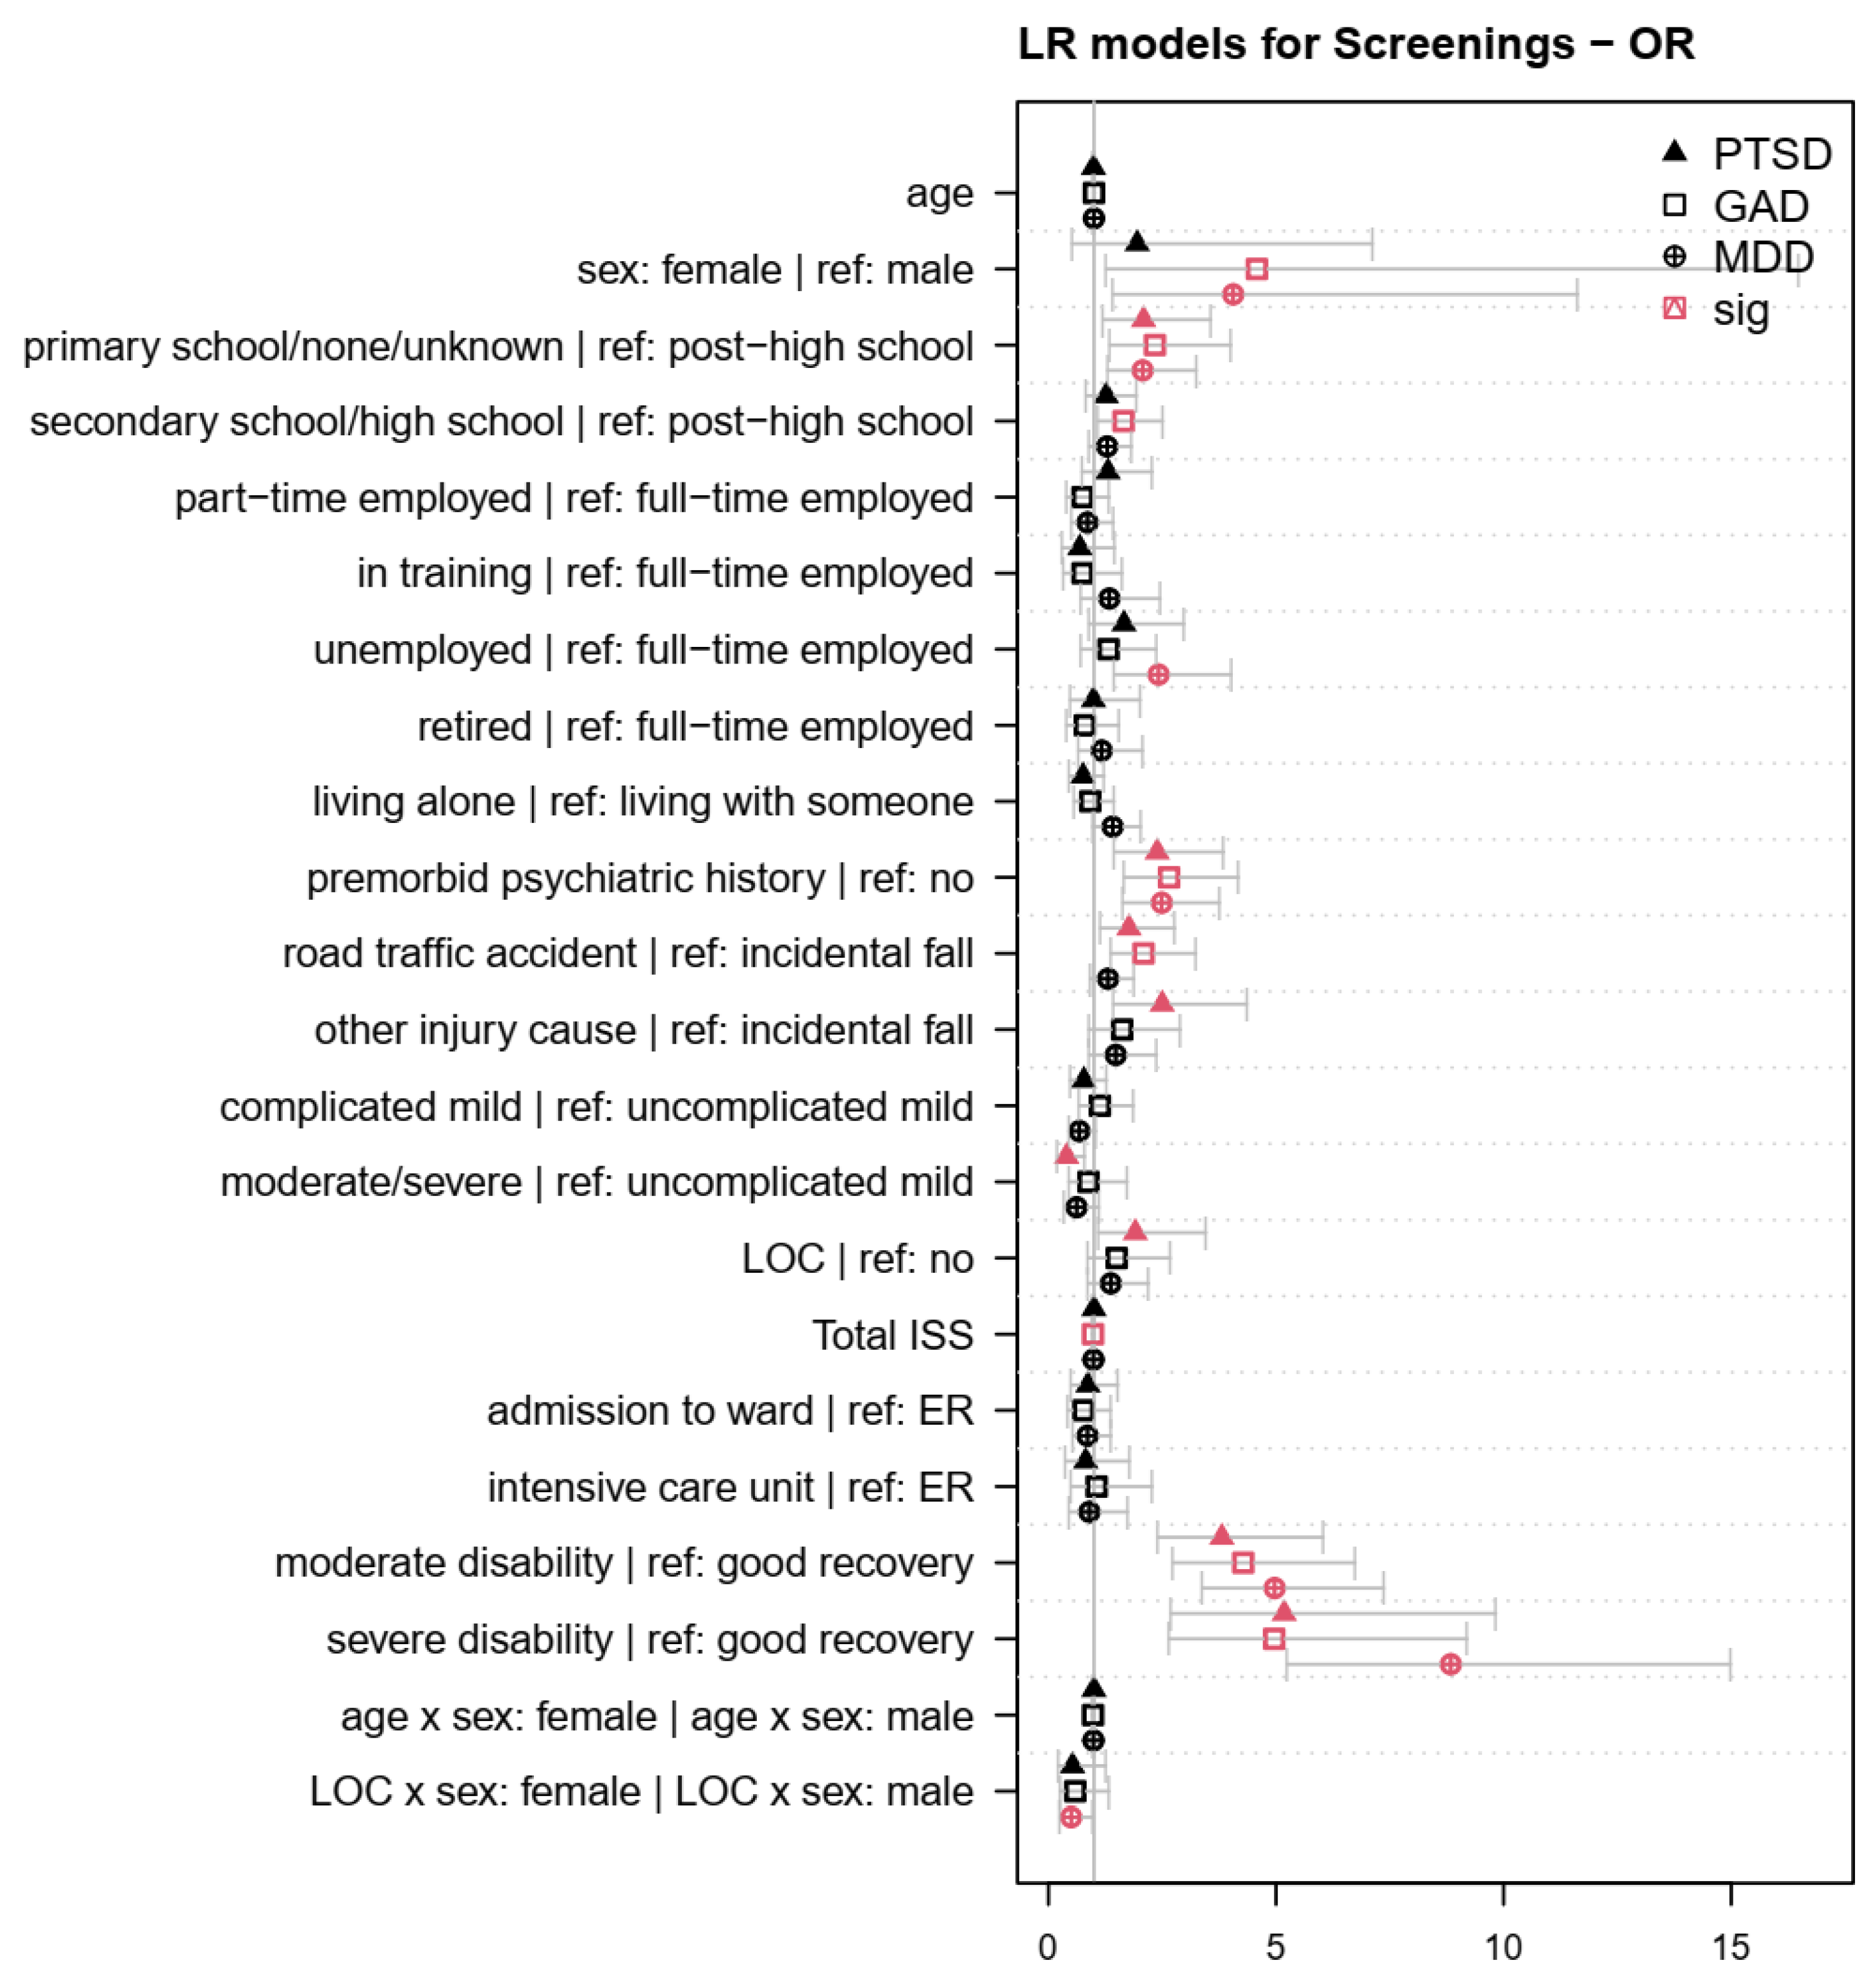
2.4.2. Regression Models
3. Results
3.1. Sample Characteristics
3.2. Regression Models
4. Discussion
4.1. Within-Subject Factors
4.2. Between-Subjects Factors
4.3. Strengths and Limitations
5. Conclusions
Supplementary Materials
Author Contributions
Funding
Institutional Review Board Statement
Informed Consent Statement
Data Availability Statement
Acknowledgments
Conflicts of Interest
Appendix A

| Factor|Reference | b | SE | z | p | OR | 95% CI |
|---|---|---|---|---|---|---|
| age | −0.01 | 0.01 | −1.53 | 0.13 | 0.99 | 0.97–1.00 |
| female|male | 0.67 | 0.67 | 1.00 | 0.32 | 1.95 | 0.52–7.12 |
| none/primary school|college/university | 0.74 | 0.28 | 2.65 | 0.01 | 2.09 | 1.20–3.57 |
| secondary/high school|college/university | 0.24 | 0.22 | 1.11 | 0.27 | 1.27 | 0.83–1.94 |
| part-time|full-time employed | 0.27 | 0.29 | 0.95 | 0.34 | 1.31 | 0.74–2.28 |
| in training|full-time employed | −0.37 | 0.40 | −0.94 | 0.35 | 0.69 | 0.30–1.46 |
| unemployed|full-time employed | 0.51 | 0.30 | 1.67 | 0.09 | 1.66 | 0.90–2.98 |
| retired|full-time employed | −0.01 | 0.36 | −0.02 | 0.99 | 0.99 | 0.48–2.02 |
| living alone|with someone | −0.27 | 0.25 | −1.08 | 0.28 | 0.76 | 0.46–1.23 |
| premorbid psychiatric history | 0.87 | 0.25 | 3.52 | <0.001 | 2.39 | 1.45–3.85 |
| road traffic accident|incidental fall | 0.57 | 0.23 | 2.51 | 0.01 | 1.77 | 1.14–2.78 |
| other injury cause|incidental fall | 0.92 | 0.28 | 3.23 | <0.001 | 2.50 | 1.43–4.36 |
| complicated mild|uncomplicated mild TBI | −0.24 | 0.25 | −0.96 | 0.34 | 0.78 | 0.48–1.28 |
| moderate/severe|uncomplicated mild TBI | −0.93 | 0.36 | −2.59 | 0.01 | 0.40 | 0.20–0.80 |
| LOC | 0.65 | 0.29 | 2.23 | 0.03 | 1.91 | 1.10–3.46 |
| extracranial injuries (ISS) | 0.00 | 0.01 | −0.07 | 0.94 | 1.00 | 0.98–1.02 |
| admission to ward|emergency room | −0.14 | 0.29 | −0.49 | 0.63 | 0.87 | 0.50–1.53 |
| intensive care unit|emergency room | −0.19 | 0.39 | −0.49 | 0.62 | 0.82 | 0.38–1.78 |
| moderate disability|good recovery | 1.34 | 0.23 | 5.73 | <0.001 | 3.81 | 2.41–6.04 |
| severe disability|good recovery | 1.64 | 0.33 | 5.00 | <0.001 | 5.18 | 2.69–9.83 |
| age:female|age:male | 0.00 | 0.01 | −0.31 | 0.76 | 1.00 | 0.98–1.02 |
| LOC:female|LOC:male | −0.63 | 0.44 | −1.44 | 0.15 | 0.53 | 0.22–1.26 |
| Factor|Reference | b | SE | z | p | OR | 95% CI |
|---|---|---|---|---|---|---|
| age | 0.00 | 0.01 | 0.41 | 0.68 | 1.00 | 0.99–1.02 |
| female|male | 1.52 | 0.65 | 2.33 | 0.02 | 4.58 | 1.27–16.49 |
| none/primary school|college/university | 0.85 | 0.28 | 3.07 | <0.001 | 2.34 | 1.35–4.01 |
| secondary/high school|college/university | 0.50 | 0.21 | 2.37 | 0.02 | 1.65 | 1.09–2.51 |
| part-time|full-time employed | −0.29 | 0.30 | −0.94 | 0.35 | 0.75 | 0.40–1.34 |
| in training|full-time employed | −0.29 | 0.41 | −0.71 | 0.48 | 0.75 | 0.33–1.62 |
| unemployed|full-time employed | 0.28 | 0.30 | 0.92 | 0.36 | 1.32 | 0.72–2.37 |
| retired|full-time employed | −0.23 | 0.34 | −0.66 | 0.51 | 0.80 | 0.40–1.55 |
| living alone|with someone | −0.09 | 0.24 | −0.37 | 0.71 | 0.92 | 0.57–1.44 |
| premorbid psychiatric history | 0.97 | 0.24 | 4.14 | <0.001 | 2.65 | 1.66–4.18 |
| road traffic accident|incidental fall | 0.74 | 0.22 | 3.37 | <0.001 | 2.09 | 1.37–3.24 |
| other injury cause|incidental fall | 0.48 | 0.30 | 1.60 | 0.11 | 1.62 | 0.89–2.90 |
| complicated mild|uncomplicated mild TBI | 0.12 | 0.26 | 0.46 | 0.65 | 1.13 | 0.68–1.87 |
| moderate/severe|uncomplicated mild TBI | −0.13 | 0.34 | −0.38 | 0.71 | 0.88 | 0.45–1.73 |
| LOC | 0.40 | 0.29 | 1.41 | 0.16 | 1.50 | 0.87–2.68 |
| extracranial injuries (ISS) | −0.02 | 0.01 | −2.09 | 0.04 | 0.98 | 0.96–1.00 |
| admission to ward|emergency room | −0.27 | 0.30 | −0.90 | 0.37 | 0.77 | 0.43–1.37 |
| intensive care unit|emergency room | 0.06 | 0.39 | 0.16 | 0.87 | 1.06 | 0.50–2.28 |
| moderate disability|good recovery | 1.45 | 0.23 | 6.34 | <0.001 | 4.28 | 2.74–6.74 |
| severe disability|good recovery | 1.60 | 0.32 | 5.05 | <0.001 | 4.96 | 2.65–9.20 |
| age:female|age:male | −0.02 | 0.01 | −1.50 | 0.13 | 0.98 | 0.96–1.00 |
| LOC:female|LOC:male | −0.53 | 0.42 | −1.27 | 0.20 | 0.59 | 0.26–1.33 |
| Factor|Reference | b | SE | z | p | OR | 95% CI |
|---|---|---|---|---|---|---|
| age | 0.00 | 0.01 | −0.58 | 0.56 | 1.00 | 0.98–1.01 |
| female|male | 1.40 | 0.54 | 2.61 | 0.01 | 4.06 | 1.42–11.63 |
| none/primary school|college/university | 0.73 | 0.23 | 3.12 | <0.001 | 2.07 | 1.30–3.25 |
| secondary/high school|college/university | 0.25 | 0.18 | 1.41 | 0.16 | 1.29 | 0.90–1.83 |
| part-time|full-time employed | −0.15 | 0.26 | −0.56 | 0.58 | 0.86 | 0.51–1.43 |
| in training|full-time employed | 0.30 | 0.31 | 0.95 | 0.34 | 1.34 | 0.72–2.46 |
| unemployed|full-time employed | 0.88 | 0.26 | 3.40 | <0.001 | 2.42 | 1.45–4.02 |
| retired|full-time employed | 0.16 | 0.29 | 0.55 | 0.58 | 1.17 | 0.66–2.07 |
| living alone|with someone | 0.34 | 0.19 | 1.81 | 0.07 | 1.41 | 0.97–2.03 |
| premorbid psychiatric history | 0.91 | 0.21 | 4.32 | <0.001 | 2.49 | 1.64–3.76 |
| road traffic accident|incidental fall | 0.27 | 0.18 | 1.50 | 0.13 | 1.31 | 0.92–1.88 |
| other injury cause|incidental fall | 0.39 | 0.25 | 1.58 | 0.11 | 1.48 | 0.90–2.38 |
| complicated mild|uncomplicated mild TBI | −0.38 | 0.22 | −1.77 | 0.08 | 0.68 | 0.45–1.04 |
| moderate/severe|uncomplicated mild TBI | −0.47 | 0.29 | −1.60 | 0.11 | 0.62 | 0.35–1.11 |
| LOC | 0.32 | 0.24 | 1.35 | 0.18 | 1.37 | 0.87–2.20 |
| extracranial injuries (ISS) | −0.01 | 0.01 | −1.43 | 0.15 | 0.99 | 0.97–1.00 |
| admission to ward|emergency room | −0.15 | 0.24 | −0.64 | 0.52 | 0.86 | 0.54–1.38 |
| intensive care unit|emergency room | −0.11 | 0.34 | −0.31 | 0.75 | 0.90 | 0.46–1.74 |
| moderate disability|good recovery | 1.60 | 0.20 | 8.06 | <0.001 | 4.97 | 3.38–7.37 |
| severe disability|good recovery | 2.18 | 0.27 | 8.14 | <0.001 | 8.84 | 5.24–14.99 |
| age:female|age:male | −0.01 | 0.01 | −1.57 | 0.12 | 0.99 | 0.97–1.00 |
| LOC:female|LOC:male | −0.70 | 0.35 | −2.01 | 0.04 | 0.50 | 0.25–0.98 |
Appendix B
| Factor|Reference | Zero Part | Count Part | ||||||||||
|---|---|---|---|---|---|---|---|---|---|---|---|---|
| b | SE | z | p | OR | 95% CI | b | SE | z | p | RR | 95% CI | |
| age | −0.01 | 0.02 | −0.35 | 0.72 | 0.99 | 0.97–1.02 | −0.01 | 0.00 | −1.56 | 0.12 | 0.99 | 0.99–1.00 |
| female|male | −1.67 | 1.04 | −1.60 | 0.11 | 0.19 | 0.02–1.45 | 0.39 | 0.29 | 1.36 | 0.17 | 1.47 | 0.84–2.58 |
| none/primary school|college/university | −0.44 | 0.52 | −0.84 | 0.40 | 0.64 | 0.23–1.80 | 0.43 | 0.13 | 3.40 | <0.001 | 1.54 | 1.20–1.97 |
| secondary/high school|college/university | −0.64 | 0.38 | −1.68 | 0.09 | 0.53 | 0.25–1.11 | 0.01 | 0.09 | 0.15 | 0.88 | 1.01 | 0.85–1.21 |
| part-time|full-time employed | 0.03 | 0.41 | 0.08 | 0.93 | 1.03 | 0.46–2.31 | −0.02 | 0.13 | −0.13 | 0.90 | 0.98 | 0.77–1.26 |
| in training|full-time employed | −0.71 | 0.75 | −0.95 | 0.34 | 0.49 | 0.11–2.12 | −0.26 | 0.17 | −1.59 | 0.11 | 0.77 | 0.55–1.06 |
| unemployed|full-time employed | −1.58 | 1.50 | −1.05 | 0.29 | 0.21 | 0.01–3.90 | 0.15 | 0.14 | 1.06 | 0.29 | 1.16 | 0.88–1.53 |
| retired|full-time employed | −0.64 | 0.58 | −1.10 | 0.27 | 0.53 | 0.17–1.65 | −0.07 | 0.15 | −0.51 | 0.61 | 0.93 | 0.70–1.24 |
| living alone|with someone | 0.03 | 0.39 | 0.09 | 0.93 | 1.03 | 0.49–2.20 | 0.07 | 0.10 | 0.71 | 0.48 | 1.07 | 0.88–1.31 |
| premorbid psychiatric history | −1.69 | 0.92 | −1.84 | 0.07 | 0.18 | 0.03–1.11 | 0.26 | 0.11 | 2.27 | 0.02 | 1.29 | 1.04–1.61 |
| road traffic accident|incidental fall | −0.77 | 0.38 | −2.05 | 0.04 | 0.46 | 0.22–0.97 | 0.25 | 0.09 | 2.69 | 0.01 | 1.28 | 1.07–1.53 |
| other injury cause|incidental fall | −0.92 | 0.60 | −1.52 | 0.13 | 0.40 | 0.12–1.30 | 0.27 | 0.13 | 2.14 | 0.03 | 1.32 | 1.02–1.69 |
| complicated mild|uncomplicated mild TBI | −0.17 | 0.41 | −0.40 | 0.69 | 0.85 | 0.38–1.90 | −0.11 | 0.11 | −1.01 | 0.31 | 0.90 | 0.73–1.11 |
| moderate/severe|uncomplicated mild TBI | −0.04 | 0.90 | −0.04 | 0.97 | 0.96 | 0.17–5.61 | −0.38 | 0.15 | −2.57 | 0.01 | 0.68 | 0.51–0.91 |
| LOC | −0.50 | 0.38 | −1.32 | 0.19 | 0.60 | 0.29–1.27 | 0.19 | 0.11 | 1.75 | 0.08 | 1.21 | 0.98–1.51 |
| extracranial injuries (ISS) | −0.01 | 0.03 | −0.34 | 0.73 | 0.99 | 0.94–1.04 | 0.00 | 0.00 | 0.02 | 0.99 | 1.00 | 0.99–1.01 |
| admission to ward|emergency room | −0.77 | 0.36 | −2.12 | 0.03 | 0.46 | 0.23–0.94 | −0.19 | 0.12 | −1.51 | 0.13 | 0.83 | 0.65–1.06 |
| intensive care unit|emergency room | −1.00 | 0.77 | −1.30 | 0.19 | 0.37 | 0.08–1.65 | −0.12 | 0.17 | −0.71 | 0.48 | 0.89 | 0.64–1.23 |
| moderate disability|good recovery | −2.51 | 1.37 | −1.83 | 0.07 | 0.08 | 0.01–1.20 | 0.60 | 0.10 | 6.02 | <0.001 | 1.82 | 1.50–2.22 |
| severe disability|good recovery | −15.81 | 1644.50 | −0.01 | 0.99 | NA * | NA * | 0.61 | 0.14 | 4.50 | <0.001 | 1.84 | 1.41–2.41 |
| age:female|age:male | 0.03 | 0.02 | 1.66 | 0.10 | 1.03 | 0.99–1.07 | 0.00 | 0.00 | −0.67 | 0.50 | 1.00 | 0.99–1.01 |
| LOC:female|LOC:male | 0.56 | 0.65 | 0.87 | 0.39 | 1.75 | 0.49–6.23 | −0.19 | 0.18 | −1.04 | 0.30 | 0.83 | 0.58–1.18 |
| Factor|Reference | Zero Part | Count Part | ||||||||||
|---|---|---|---|---|---|---|---|---|---|---|---|---|
| b | SE | z | p | OR | 95% CI | b | SE | z | p | RR | 95% CI | |
| age | 0.02 | 0.01 | 2.68 | 0.01 | 1.02 | 1.00–1.03 | 0.00 | 0.00 | 1.37 | 0.17 | 1.00 | 1.00–1.01 |
| female|male | 0.09 | 0.51 | 0.18 | 0.86 | 1.09 | 0.40–2.96 | 0.35 | 0.15 | 2.35 | 0.02 | 1.42 | 1.06–1.90 |
| none/primary school|college/university | −0.55 | 0.23 | −2.41 | 0.02 | 0.58 | 0.37–0.90 | 0.16 | 0.06 | 2.61 | 0.01 | 1.18 | 1.04–1.33 |
| secondary/high school|college/university | 0.02 | 0.16 | 0.11 | 0.91 | 1.02 | 0.75–1.38 | 0.04 | 0.05 | 0.92 | 0.36 | 1.05 | 0.95–1.15 |
| part-time|full-time employed | 0.01 | 0.22 | 0.04 | 0.97 | 1.01 | 0.65–1.55 | −0.03 | 0.07 | −0.43 | 0.67 | 0.97 | 0.85–1.11 |
| in training|full-time employed | 0.20 | 0.29 | 0.70 | 0.48 | 1.23 | 0.69–2.17 | −0.10 | 0.09 | −1.12 | 0.26 | 0.91 | 0.76–1.08 |
| unemployed|full-time employed | −1.15 | 0.40 | −2.92 | <0.001 | 0.32 | 0.15–0.68 | 0.00 | 0.07 | 0.02 | 0.98 | 1.00 | 0.87–1.15 |
| retired|full-time employed | −0.06 | 0.24 | −0.24 | 0.81 | 0.94 | 0.59–1.50 | −0.13 | 0.08 | −1.67 | 0.10 | 0.88 | 0.75–1.02 |
| living alone|with someone | 0.02 | 0.17 | 0.11 | 0.92 | 1.02 | 0.72–1.43 | −0.03 | 0.05 | −0.54 | 0.59 | 0.97 | 0.88–1.08 |
| premorbid psychiatric history | −1.00 | 0.30 | −3.37 | <0.001 | 0.37 | 0.21–0.66 | 0.17 | 0.06 | 2.94 | <0.001 | 1.19 | 1.06–1.33 |
| road traffic accident|incidental fall | −0.16 | 0.16 | −1.02 | 0.31 | 0.85 | 0.63–1.16 | 0.13 | 0.05 | 2.69 | 0.01 | 1.14 | 1.04–1.26 |
| other injury cause|incidental fall | 0.36 | 0.21 | 1.71 | 0.09 | 1.43 | 0.95–2.17 | 0.17 | 0.07 | 2.49 | 0.01 | 1.19 | 1.04–1.36 |
| complicated mild|uncomplicated mild TBI | −0.21 | 0.17 | −1.22 | 0.22 | 0.81 | 0.57–1.14 | −0.06 | 0.06 | −1.04 | 0.30 | 0.94 | 0.84–1.05 |
| moderate/severe|uncomplicated mild TBI | −0.06 | 0.27 | −0.23 | 0.82 | 0.94 | 0.55–1.60 | −0.08 | 0.08 | −0.96 | 0.34 | 0.93 | 0.79–1.08 |
| LOC | 0.12 | 0.18 | 0.68 | 0.50 | 1.13 | 0.79–1.62 | 0.01 | 0.06 | 0.19 | 0.85 | 1.01 | 0.90–1.14 |
| extracranial injuries (ISS) | 0.00 | 0.01 | 0.09 | 0.93 | 1.00 | 0.99–1.02 | 0.00 | 0.00 | −1.39 | 0.17 | 1.00 | 0.99–1.00 |
| admission to ward|emergency room | 0.02 | 0.19 | 0.08 | 0.94 | 1.02 | 0.70–1.47 | −0.02 | 0.06 | −0.35 | 0.73 | 0.98 | 0.86–1.11 |
| intensive care unit|emergency room | −0.21 | 0.29 | −0.72 | 0.47 | 0.81 | 0.46–1.42 | 0.00 | 0.09 | 0.05 | 0.96 | 1.00 | 0.84–1.19 |
| moderate disability|good recovery | −0.77 | 0.19 | −4.13 | <0.001 | 0.46 | 0.32–0.67 | 0.24 | 0.05 | 4.79 | <0.001 | 1.27 | 1.15–1.41 |
| severe disability|good recovery | −1.27 | 0.33 | −3.79 | <0.001 | 0.28 | 0.15–0.54 | 0.25 | 0.07 | 3.45 | <0.001 | 1.29 | 1.12–1.49 |
| age:female|age:male | 0.00 | 0.01 | −0.50 | 0.62 | 1.00 | 0.98–1.01 | 0.00 | 0.00 | −1.26 | 0.21 | 1.00 | 0.99–1.00 |
| LOC:female|LOC:male | −0.54 | 0.31 | −1.72 | 0.09 | 0.58 | 0.32–1.08 | −0.19 | 0.09 | −2.02 | 0.04 | 0.83 | 0.69–0.99 |
| Factor|Reference | Zero Part | Count Part | ||||||||||
|---|---|---|---|---|---|---|---|---|---|---|---|---|
| b | SE | z | p | OR | 95% CI | b | SE | z | p | RR | 95% CI | |
| age | 0.01 | 0.01 | 0.99 | 0.32 | 1.01 | 0.99–1.03 | 0.00 | 0.00 | −0.95 | 0.34 | 1.00 | 0.99–1.00 |
| female|male | −1.16 | 0.78 | −1.49 | 0.14 | 0.31 | 0.07–1.44 | 0.16 | 0.14 | 1.13 | 0.26 | 1.18 | 0.89–1.56 |
| none/primary school|college/university | −0.29 | 0.30 | −0.96 | 0.34 | 0.75 | 0.41–1.36 | 0.17 | 0.06 | 2.77 | 0.01 | 1.18 | 1.05–1.33 |
| secondary/high school|college/university | 0.17 | 0.21 | 0.81 | 0.42 | 1.19 | 0.78–1.80 | 0.05 | 0.05 | 1.08 | 0.28 | 1.05 | 0.96–1.15 |
| part-time|full-time employed | 0.07 | 0.32 | 0.22 | 0.83 | 1.07 | 0.57–2.00 | −0.05 | 0.07 | −0.83 | 0.41 | 0.95 | 0.83–1.08 |
| in training|full-time employed | 0.46 | 0.36 | 1.27 | 0.20 | 1.58 | 0.78–3.19 | 0.03 | 0.08 | 0.38 | 0.71 | 1.03 | 0.88–1.21 |
| unemployed|full-time employed | −0.53 | 0.49 | −1.08 | 0.28 | 0.59 | 0.22–1.54 | 0.09 | 0.07 | 1.31 | 0.19 | 1.10 | 0.96–1.26 |
| retired|full-time employed | 0.05 | 0.32 | 0.14 | 0.89 | 1.05 | 0.56–1.96 | 0.00 | 0.07 | 0.02 | 0.99 | 1.00 | 0.87–1.15 |
| living alone|with someone | −0.08 | 0.24 | −0.32 | 0.75 | 0.93 | 0.58–1.47 | 0.12 | 0.05 | 2.45 | 0.01 | 1.13 | 1.02–1.24 |
| premorbid psychiatric history | −1.13 | 0.50 | −2.28 | 0.02 | 0.32 | 0.12–0.85 | 0.27 | 0.06 | 4.71 | <0.001 | 1.30 | 1.17–1.46 |
| road traffic accident|incidental fall | −0.05 | 0.22 | −0.21 | 0.83 | 0.96 | 0.63–1.46 | 0.09 | 0.05 | 2.06 | 0.04 | 1.10 | 1.00–1.20 |
| other injury cause|incidental fall | 0.32 | 0.28 | 1.15 | 0.25 | 1.38 | 0.80–2.36 | 0.08 | 0.07 | 1.26 | 0.21 | 1.09 | 0.96–1.23 |
| complicated mild|uncomplicated mild TBI | −0.14 | 0.23 | −0.60 | 0.55 | 0.87 | 0.56–1.36 | −0.05 | 0.05 | −0.94 | 0.35 | 0.95 | 0.85–1.06 |
| moderate/severe|uncomplicated mild TBI | −0.16 | 0.40 | −0.40 | 0.69 | 0.85 | 0.39–1.86 | −0.13 | 0.07 | −1.76 | 0.08 | 0.88 | 0.76–1.01 |
| LOC | 0.14 | 0.24 | 0.59 | 0.56 | 1.15 | 0.72–1.84 | 0.04 | 0.06 | 0.66 | 0.51 | 1.04 | 0.93–1.16 |
| extracranial injuries (ISS) | −0.01 | 0.01 | −0.91 | 0.36 | 0.99 | 0.96–1.01 | 0.00 | 0.00 | −1.04 | 0.30 | 1.00 | 0.99–1.00 |
| admission to ward|emergency room | 0.06 | 0.25 | 0.24 | 0.81 | 1.06 | 0.65–1.73 | −0.01 | 0.06 | −0.22 | 0.83 | 0.99 | 0.87–1.11 |
| intensive care unit|emergency room | −0.03 | 0.40 | −0.09 | 0.93 | 0.97 | 0.44–2.12 | −0.03 | 0.08 | −0.34 | 0.73 | 0.97 | 0.82–1.15 |
| moderate disability|good recovery | −1.69 | 0.38 | −4.45 | <0.001 | 0.18 | 0.09–0.39 | 0.39 | 0.05 | 7.95 | <0.001 | 1.48 | 1.34–1.63 |
| severe disability|good recovery | −3.44 | 1.95 | −1.77 | 0.08 | 0.03 | 0.00–1.45 | 0.50 | 0.07 | 7.31 | <0.001 | 1.65 | 1.45–1.89 |
| age:female|age:male | 0.01 | 0.01 | 0.50 | 0.62 | 1.01 | 0.98–1.03 | 0.00 | 0.00 | −0.49 | 0.62 | 1.00 | 0.99–1.00 |
| LOC:female|LOC:male | 0.33 | 0.50 | 0.66 | 0.51 | 1.39 | 0.52–3.71 | −0.11 | 0.09 | −1.23 | 0.22 | 0.89 | 0.75–1.07 |
Appendix C
| Factor|Reference | b | SE | z | p | RR | 95% CI |
|---|---|---|---|---|---|---|
| age | 0.00 | 0.00 | −1.33 | 0.19 | 1.00 | 0.99–1.00 |
| female|male | 0.52 | 0.22 | 2.36 | 0.02 | 1.68 | 1.08–2.64 |
| none/primary school|college/university | 0.35 | 0.10 | 3.68 | <0.001 | 1.42 | 1.18–1.72 |
| secondary/high school|college/university | 0.08 | 0.07 | 1.18 | 0.24 | 1.09 | 0.95–1.25 |
| part-time|full-time employed | −0.05 | 0.10 | −0.49 | 0.62 | 0.95 | 0.79–1.16 |
| in training|full-time employed | −0.15 | 0.12 | −1.23 | 0.22 | 0.86 | 0.67–1.10 |
| unemployed|full-time employed | 0.19 | 0.12 | 1.58 | 0.11 | 1.21 | 0.96–1.54 |
| retired|full-time employed | 0.01 | 0.11 | 0.06 | 0.95 | 1.01 | 0.81–1.25 |
| living alone|with someone | 0.06 | 0.08 | 0.83 | 0.41 | 1.07 | 0.92–1.25 |
| premorbid psychiatric history | 0.35 | 0.10 | 3.57 | <0.001 | 1.42 | 1.18–1.74 |
| road traffic accident|incidental fall | 0.28 | 0.07 | 4.08 | <0.001 | 1.33 | 1.16–1.52 |
| other injury cause|incidental fall | 0.27 | 0.10 | 2.72 | 0.01 | 1.31 | 1.08–1.60 |
| complicated mild|uncomplicated mild TBI | −0.04 | 0.08 | −0.51 | 0.61 | 0.96 | 0.82–1.12 |
| moderate/severe|uncomplicated mild TBI | −0.28 | 0.12 | −2.45 | 0.01 | 0.75 | 0.60–0.95 |
| LOC | 0.19 | 0.08 | 2.21 | 0.03 | 1.21 | 1.02–1.42 |
| extracranial injuries (ISS) | 0.00 | 0.00 | −0.22 | 0.83 | 1.00 | 0.99–1.01 |
| admission to ward|emergency room | 0.02 | 0.09 | 0.24 | 0.81 | 1.02 | 0.85–1.22 |
| intensive care unit|emergency room | 0.12 | 0.13 | 0.91 | 0.36 | 1.12 | 0.87–1.45 |
| moderate disability|good recovery | 0.64 | 0.08 | 8.08 | <0.001 | 1.90 | 1.63–2.21 |
| severe disability|good recovery | 0.68 | 0.12 | 5.78 | <0.001 | 1.97 | 1.58–2.49 |
| age:female|age:male | −0.01 | 0.00 | −1.53 | 0.13 | 0.99 | 0.99–1.00 |
| LOC:female|LOC:male | −0.20 | 0.14 | −1.47 | 0.14 | 0.82 | 0.62–1.07 |
| Factor|Reference | b | SE | z | p | RR | 95% CI |
|---|---|---|---|---|---|---|
| age | 0.00 | 0.00 | −1.28 | 0.20 | 1.00 | 0.99–1.00 |
| female|male | 0.52 | 0.25 | 2.06 | 0.04 | 1.69 | 1.02–2.82 |
| none/primary school|college/university | 0.47 | 0.11 | 4.26 | <0.001 | 1.60 | 1.28–1.99 |
| secondary/high school|college/university | 0.09 | 0.08 | 1.17 | 0.24 | 1.10 | 0.94–1.29 |
| part-time|full-time employed | −0.08 | 0.12 | −0.72 | 0.47 | 0.92 | 0.74–1.16 |
| in training|full-time employed | −0.28 | 0.15 | −1.93 | 0.05 | 0.75 | 0.57–1.01 |
| unemployed|full-time employed | 0.21 | 0.14 | 1.51 | 0.13 | 1.23 | 0.94–1.62 |
| retired|full-time employed | −0.07 | 0.13 | −0.58 | 0.56 | 0.93 | 0.72–1.20 |
| living alone|with someone | 0.00 | 0.09 | 0.05 | 0.96 | 1.00 | 0.84–1.20 |
| premorbid psychiatric history | 0.50 | 0.11 | 4.52 | <0.001 | 1.66 | 1.33–2.07 |
| road traffic accident|incidental fall | 0.26 | 0.08 | 3.22 | <0.001 | 1.30 | 1.10–1.52 |
| other injury cause|incidental fall | 0.10 | 0.12 | 0.86 | 0.39 | 1.10 | 0.88–1.39 |
| complicated mild|uncomplicated mild TBI | 0.07 | 0.09 | 0.80 | 0.43 | 1.08 | 0.90–1.29 |
| moderate/severe|uncomplicated mild TBI | −0.11 | 0.13 | −0.82 | 0.41 | 0.90 | 0.69–1.17 |
| LOC | 0.02 | 0.10 | 0.21 | 0.83 | 1.02 | 0.84–1.24 |
| extracranial injuries (ISS) | −0.01 | 0.00 | −1.64 | 0.10 | 0.99 | 0.99–1.00 |
| admission to ward|emergency room | −0.05 | 0.11 | −0.45 | 0.66 | 0.95 | 0.78–1.17 |
| intensive care unit|emergency room | 0.08 | 0.15 | 0.55 | 0.58 | 1.09 | 0.81–1.45 |
| moderate disability|good recovery | 0.65 | 0.09 | 7.14 | <0.001 | 1.92 | 1.61–2.29 |
| severe disability|good recovery | 0.80 | 0.13 | 5.96 | <0.001 | 2.23 | 1.72–2.91 |
| age:female|age:male | 0.00 | 0.00 | −1.20 | 0.23 | 1.00 | 0.99–1.00 |
| LOC:female|LOC:male | −0.07 | 0.16 | −0.41 | 0.68 | 0.94 | 0.68–1.29 |
| Factor|Reference | b | SE | z | p | RR | 95% CI |
|---|---|---|---|---|---|---|
| age | 0.00 | 0.00 | −1.54 | 0.12 | 1.00 | 0.99–1.00 |
| female|male | 0.54 | 0.20 | 2.65 | 0.01 | 1.71 | 1.14–2.56 |
| none/primary school|college/university | 0.31 | 0.09 | 3.51 | <0.001 | 1.36 | 1.14–1.62 |
| secondary/high school|college/university | 0.05 | 0.06 | 0.71 | 0.48 | 1.05 | 0.92–1.19 |
| part-time|full-time employed | −0.07 | 0.09 | −0.71 | 0.48 | 0.94 | 0.78–1.12 |
| in training|full-time employed | −0.11 | 0.12 | −0.92 | 0.36 | 0.90 | 0.72–1.13 |
| unemployed|full-time employed | 0.26 | 0.11 | 2.38 | 0.02 | 1.30 | 1.05–1.61 |
| retired|full-time employed | 0.08 | 0.10 | 0.81 | 0.42 | 1.09 | 0.89–1.32 |
| living alone|with someone | 0.20 | 0.07 | 2.81 | <0.001 | 1.22 | 1.06–1.40 |
| premorbid psychiatric history | 0.45 | 0.09 | 5.11 | <0.001 | 1.57 | 1.32–1.88 |
| road traffic accident|incidental fall | 0.13 | 0.06 | 1.95 | 0.05 | 1.13 | 1.00–1.29 |
| other injury cause|incidental fall | 0.07 | 0.09 | 0.77 | 0.44 | 1.07 | 0.90–1.29 |
| complicated mild|uncomplicated mild TBI | −0.07 | 0.07 | −0.96 | 0.34 | 0.93 | 0.80–1.08 |
| moderate/severe|uncomplicated mild TBI | −0.20 | 0.11 | −1.90 | 0.06 | 0.82 | 0.66–1.01 |
| LOC | 0.08 | 0.08 | 0.96 | 0.33 | 1.08 | 0.92–1.26 |
| extracranial injuries (ISS) | 0.00 | 0.00 | −0.83 | 0.41 | 1.00 | 0.99–1.00 |
| admission to ward|emergency room | −0.01 | 0.08 | −0.14 | 0.89 | 0.99 | 0.84–1.17 |
| intensive care unit|emergency room | 0.01 | 0.12 | 0.09 | 0.93 | 1.01 | 0.80–1.28 |
| moderate disability|good recovery | 0.80 | 0.07 | 11.09 | <0.001 | 2.23 | 1.94–2.57 |
| severe disability|good recovery | 1.01 | 0.11 | 9.55 | <0.001 | 2.75 | 2.24–3.40 |
| age:female|age:male | −0.01 | 0.00 | −1.58 | 0.11 | 0.99 | 0.99–1.00 |
| LOC:female|LOC:male | −0.21 | 0.13 | −1.63 | 0.10 | 0.81 | 0.63–1.05 |
References
- Menon, D.K.; Schwab, K.; Wright, D.W.; Maas, A.I. Position Statement: Definition of Traumatic Brain Injury. Arch. Phys. Med. Rehabil. 2010, 91, 1637–1640. [Google Scholar] [CrossRef]
- Hyder, A.A.; Wunderlich, C.A.; Puvanachandra, P.; Gururaj, G.; Kobusingye, O.C. The Impact of Traumatic Brain Injuries: A Global Perspective. NeuroRehabilitation 2007, 22, 341–353. [Google Scholar] [CrossRef] [PubMed]
- Dewan, M.C.; Rattani, A.; Gupta, S.; Baticulon, R.E.; Hung, Y.-C.; Punchak, M.; Agrawal, A.; Adeleye, A.O.; Shrime, M.G.; Rubiano, A.M.; et al. Estimating the Global Incidence of Traumatic Brain Injury. J. Neurosurg. 2018, 130, 1080–1097. [Google Scholar] [CrossRef]
- Frost, R.B.; Farrer, T.J.; Primosch, M.; Hedges, D.W. Prevalence of Traumatic Brain Injury in the General Adult Population: A Meta-Analysis. Neuroepidemiology 2013, 40, 154–159. [Google Scholar] [CrossRef]
- Peeters, W.; van den Brande, R.; Polinder, S.; Brazinova, A.; Steyerberg, E.W.; Lingsma, H.F.; Maas, A.I.R. Epidemiology of Traumatic Brain Injury in Europe. Acta Neurochir. 2015, 157, 1683–1696. [Google Scholar] [CrossRef] [PubMed]
- Maas, A.I.R.; Menon, D.K.; Adelson, P.D.; Andelic, N.; Bell, M.J.; Belli, A.; Bragge, P.; Brazinova, A.; Büki, A.; Chesnut, R.M.; et al. Traumatic Brain Injury: Integrated Approaches to Improve Prevention, Clinical Care, and Research. Lancet Neurol. 2017, 16, 987–1048. [Google Scholar] [CrossRef] [PubMed]
- Perry, D.C.; Sturm, V.E.; Peterson, M.J.; Pieper, C.F.; Bullock, T.; Boeve, B.F.; Miller, B.L.; Guskiewicz, K.M.; Berger, M.S.; Kramer, J.H.; et al. Association of Traumatic Brain Injury with Subsequent Neurological and Psychiatric Disease: A Meta-Analysis. J. Neurosurg. 2016, 124, 511–526. [Google Scholar] [CrossRef]
- Zgaljardic, D.J.; Seale, G.S.; Schaefer, L.A.; Temple, R.O.; Foreman, J.; Elliott, T.R. Psychiatric Disease and Post-Acute Traumatic Brain Injury. J. Neurotrauma 2015, 32, 1911–1925. [Google Scholar] [CrossRef]
- Kiraly, M.A.; Kiraly, S.J. Traumatic Brain Injury and Delayed Sequelae: A Review—Traumatic Brain Injury and Mild Traumatic Brain Injury (Concussion) Are Precursors to Later-Onset Brain Disorders, Including Early-Onset Dementia. Sci. World J. 2007, 7, 1768–1776. [Google Scholar] [CrossRef]
- Borg, J.; Holm, L.; Peloso, P.; Cassidy, J.D.; Carroll, L.; von Holst, H.; Paniak, C.; Yates, D. Non-Surgical Intervention and Cost for Mild Traumatic Brain Injury: Results of the Who Collaborating Centre Task Force on Mild Traumatic Brain Injury. J. Rehabil. Med. 2004, 36, 76–83. [Google Scholar] [CrossRef]
- McGarry, L.J.; Thompson, D.; Millham, F.H.; Cowell, L.; Snyder, P.J.; Lenderking, W.R.; Weinstein, M.C. Outcomes and Costs of Acute Treatment of Traumatic Brain Injury. J. Trauma Inj. Infect. Crit. Care 2002, 53, 1152–1159. [Google Scholar] [CrossRef] [PubMed]
- Rockhill, C.M.; Jaffe, K.; Zhou, C.; Fan, M.-Y.; Katon, W.; Fann, J.R. Health Care Costs Associated with Traumatic Brain Injury and Psychiatric Illness in Adults. J. Neurotrauma 2012, 29, 1038–1046. [Google Scholar] [CrossRef] [PubMed]
- Andelic, N.; Røe, C.; Tenovuo, O.; Azouvi, P.; Dawes, H.; Majdan, M.; Ranta, J.; Howe, E.I.; Wiegers, E.J.A.; Tverdal, C.; et al. Unmet Rehabilitation Needs after Traumatic Brain Injury across Europe: Results from the CENTER-TBI Study. J. Clin. Med. 2021, 10, 1035. [Google Scholar] [CrossRef]
- Quatrano, L.A.; Cruz, T.H. Future of Outcomes Measurement: Impact on Research in Medical Rehabilitation and Neurologic Populations. Arch. Phys. Med. Rehabil. 2011, 92, S7–S11. [Google Scholar] [CrossRef] [PubMed]
- Van Praag, D.L.G.; Cnossen, M.C.; Polinder, S.; Wilson, L.; Maas, A.I.R. Post-Traumatic Stress Disorder after Civilian Traumatic Brain Injury: A Systematic Review and Meta-Analysis of Prevalence Rates. J. Neurotrauma 2019, 36, 3220–3232. [Google Scholar] [CrossRef] [PubMed]
- Osborn, A.J.; Mathias, J.L.; Fairweather-Schmidt, A.K. Prevalence of Anxiety Following Adult Traumatic Brain Injury: A Meta-Analysis Comparing Measures, Samples and Postinjury Intervals. Neuropsychology 2016, 30, 247–261. [Google Scholar] [CrossRef] [PubMed]
- Osborn, A.J.; Mathias, J.L.; Fairweather-Schmidt, A.K. Depression Following Adult, Non-Penetrating Traumatic Brain Injury: A Meta-Analysis Examining Methodological Variables and Sample Characteristics. Neurosci. Biobehav. Rev. 2014, 47, 1–15. [Google Scholar] [CrossRef]
- Rogers, J.M.; Read, C.A. Psychiatric Comorbidity Following Traumatic Brain Injury. Brain Inj. 2007, 21, 1321–1333. [Google Scholar] [CrossRef]
- von Steinbuechel, N.; Rauen, K.; Covic, A.; Krenz, U.; Bockhop, F.; Mueller, I.; Cunitz, K.; Polinder, S.; Steyerberg, E.W.; Vester, J.; et al. Sensitivity of Outcome Instruments in a Priori Selected Patient Groups after Traumatic Brain Injury: Results from the CENTER-TBI Study. PLoS ONE 2023, 18, e0280796. [Google Scholar] [CrossRef]
- Cnossen, M.C.; Steyerberg, E.W.; Lingsma, H.F. Methods for Prediction Research in Mild Traumatic Brain Injury. J. Neurotrauma 2017, 34, 540. [Google Scholar] [CrossRef]
- Tambs, K.; Moum, T. How Well Can a Few Questionnaire Items Indicate Anxiety and Depression? Acta Psychiatr. Scand. 1993, 87, 364–367. [Google Scholar] [CrossRef] [PubMed]
- Casson, R.J.; Farmer, L.D. Understanding and Checking the Assumptions of Linear Regression: A Primer for Medical Researchers: Assumptions of Linear Regression. Clin. Experiment. Ophthalmol. 2014, 42, 590–596. [Google Scholar] [CrossRef] [PubMed]
- Steyerberg, E.W.; Mushkudiani, N.; Perel, P.; Butcher, I.; Lu, J.; McHugh, G.S.; Murray, G.D.; Marmarou, A.; Roberts, I.; Habbema, J.D.F.; et al. Predicting Outcome after Traumatic Brain Injury: Development and International Validation of Prognostic Scores Based on Admission Characteristics. PLoS Med. 2008, 5, e165. [Google Scholar] [CrossRef]
- Deyi, B.A.; Kosinski, A.S.; Snapinn, S.M. Power Considerations When a Continuous Outcome Variable Is Dichotomized. J. Biopharm. Stat. 1998, 8, 337–352. [Google Scholar] [CrossRef] [PubMed]
- Mushkudiani, N.A.; Hukkelhoven, C.W.P.M.; Hernández, A.V.; Murray, G.D.; Choi, S.C.; Maas, A.I.R.; Steyerberg, E.W. A Systematic Review Finds Methodological Improvements Necessary for Prognostic Models in Determining Traumatic Brain Injury Outcomes. J. Clin. Epidemiol. 2008, 61, 331–343. [Google Scholar] [CrossRef]
- Zeldovich, M.; Wu, Y.-J.; Gorbunova, A.; Mikolic, A.; Polinder, S.; Plass, A.; Covic, A.; Asendorf, T.; Andelic, N.; Voormolen, D.; et al. Influence of Sociodemographic, Premorbid, and Injury-Related Factors on Post-Concussion Symptoms after Traumatic Brain Injury. J. Clin. Med. 2020, 9, 1931. [Google Scholar] [CrossRef] [PubMed]
- Maas, A.I.R.; Menon, D.K.; Steyerberg, E.W.; Citerio, G.; Lecky, F.; Manley, G.T.; Hill, S.; Legrand, V.; Sorgner, A. Collaborative European NeuroTrauma Effectiveness Research in Traumatic Brain Injury (CENTER-TBI): A Prospective Longitudinal Observational Study. Neurosurgery 2015, 76, 67–80. [Google Scholar] [CrossRef]
- Steyerberg, E.W.; Wiegers, E.; Sewalt, C.; Buki, A.; Citerio, G.; De Keyser, V.; Ercole, A.; Kunzmann, K.; Lanyon, L.; Lecky, F.; et al. Case-Mix, Care Pathways, and Outcomes in Patients with Traumatic Brain Injury in CENTER-TBI: A European Prospective, Multicentre, Longitudinal, Cohort Study. Lancet Neurol. 2019, 18, 923–934. [Google Scholar] [CrossRef]
- von Steinbuechel, N.; Rauen, K.; Bockhop, F.; Covic, A.; Krenz, U.; Plass, A.; Cunitz, K.; Polinder, S.; Wilson, L.; Steyerberg, E.; et al. Psychometric Characteristics of the Patient-Reported Outcome Measures Applied in the CENTER-TBI Study. J. Clin. Med. 2021, 10, 2396. [Google Scholar] [CrossRef]
- von Steinbuechel, N.; Rauen, K.; Krenz, U.; Wu, Y.-J.; Covic, A.; Plass, A.; Cunitz, K.; Mueller, I.; Bockhop, F.; Polinder, S.; et al. Translation and Linguistic Validation of Outcome Instruments for Traumatic Brain Injury Research and Clinical Practice: A Step-by-Step Approach within the Observational CENTER-TBI Study. J. Clin. Med. 2021, 10, 2863. [Google Scholar] [CrossRef]
- Teymoori, A.; Real, R.; Gorbunova, A.; Haghish, E.F.; Andelic, N.; Wilson, L.; Asendorf, T.; Menon, D.; von Steinbüchel, N. Measurement Invariance of Assessments of Depression (PHQ-9) and Anxiety (GAD-7) across Sex, Strata and Linguistic Backgrounds in a European-Wide Sample of Patients after Traumatic Brain Injury. J. Affect. Disord. 2020, 262, 278–285. [Google Scholar] [CrossRef]
- Bockhop, F.; Zeldovich, M.; Cunitz, K.; Van Praag, D.; van der Vlegel, M.; Beissbarth, T.; Hagmayer, Y.; von Steinbuechel, N.; CENTER-TBI participants and investigators; Åkerlund, C.; et al. Measurement Invariance of Six Language Versions of the Post-Traumatic Stress Disorder Checklist for DSM-5 in Civilians after Traumatic Brain Injury. Sci. Rep. 2022, 12, 16571. [Google Scholar] [CrossRef] [PubMed]
- Teasdale, G.; Jennett, B. Assessment of Coma and Impaired Consciousness. A Practical Scale. Lancet 1974, 2, 81–84. [Google Scholar] [CrossRef] [PubMed]
- Godoy, D.A.; Rubiano, A.; Rabinstein, A.A.; Bullock, R.; Sahuquillo, J. Moderate Traumatic Brain Injury: The Grey Zone of Neurotrauma. Neurocrit. Care 2016, 25, 306–319. [Google Scholar] [CrossRef]
- Wilson, J.T.L.; Pettigrew, L.E.L.; Teasdale, G. Structured Interviews for the Glasgow Outcome Scale and the Extended Glasgow Outcome Scale: Guidelines for Their Use. J. Neurotrauma 1998, 15, 573–585. [Google Scholar] [CrossRef]
- Blevins, C.A.; Weathers, F.W.; Davis, M.T.; Witte, T.K.; Domino, J.L. The Posttraumatic Stress Disorder Checklist for DSM-5 (PCL-5): Development and Initial Psychometric Evaluation. J. Trauma Stress 2015, 28, 489–498. [Google Scholar] [CrossRef] [PubMed]
- Ashbaugh, A.R.; Houle-Johnson, S.; Herbert, C.; El-Hage, W.; Brunet, A. Psychometric Validation of the English and French Versions of the Posttraumatic Stress Disorder Checklist for DSM-5 (PCL-5). PLoS ONE 2016, 11, e0161645. [Google Scholar] [CrossRef]
- Spitzer, R.L.; Kroenke, K.; Williams, J.B.W.; Löwe, B. A Brief Measure for Assessing Generalized Anxiety Disorder: The GAD-7. Arch. Intern. Med. 2006, 166, 1092–1097. [Google Scholar] [CrossRef]
- Kroenke, K.; Spitzer, R.L.; Williams, J.B.W. The PHQ-9: Validity of a Brief Depression Severity Measure. J. Gen. Intern. Med. 2001, 16, 606–613. [Google Scholar] [CrossRef]
- R Core Team. A Language and Environment for Statistical Computing; R Foundation for Statistical Computing: Vienna, Austria, 2022. [Google Scholar]
- Wickham, H.; François, R.; Henry, L.; Müller, K. dplyr: A Grammar of Data Manipulation. 2022. Available online: https://CRAN.R-project.org/package=dplyr (accessed on 5 February 2023).
- Zeileis, A.; Kleiber, C.; Jackman, S. Regression Models for Count Data in R. J. Stat. Softw. 2008, 27, 1–25. [Google Scholar] [CrossRef]
- Venables, W.N.; Ripley, B.D.; Venables, W.N. Modern Applied Statistics with S, 4th ed.; Statistics and Computing; Springer: New York, NY, USA, 2002; ISBN 978-0-387-95457-8. [Google Scholar]
- Utzon-Frank, N.; Breinegaard, N.; Bertelsen, M.; Borritz, M.; Eller, N.H.; Nordentoft, M.; Olesen, K.; Rod, N.H.; Rugulies, R.; Bonde, J.P. Occurrence of Delayed-Onset Post-Traumatic Stress Disorder: A Systematic Review and Meta-Analysis of Prospective Studies. Scand. J. Work. Environ. Health 2014, 40, 215–229. [Google Scholar] [CrossRef]
- Silverberg, N.D.; Iaccarino, M.A.; Panenka, W.J.; Iverson, G.L.; McCulloch, K.L.; Dams-O’Connor, K.; Reed, N.; McCrea, M.; Cogan, A.M.; Park Graf, M.J.; et al. Management of Concussion and Mild Traumatic Brain Injury: A Synthesis of Practice Guidelines. Arch. Phys. Med. Rehabil. 2020, 101, 382–393. [Google Scholar] [CrossRef] [PubMed]
- Tortella-Feliu, M.; Fullana, M.A.; Pérez-Vigil, A.; Torres, X.; Chamorro, J.; Littarelli, S.A.; Solanes, A.; Ramella-Cravaro, V.; Vilar, A.; González-Parra, J.A.; et al. Risk Factors for Posttraumatic Stress Disorder: An Umbrella Review of Systematic Reviews and Meta-Analyses. Neurosci. Biobehav. Rev. 2019, 107, 154–165. [Google Scholar] [CrossRef] [PubMed]
- Moreno-Peral, P.; Conejo-Cerón, S.; Motrico, E.; Rodríguez-Morejón, A.; Fernández, A.; García-Campayo, J.; Roca, M.; Serrano-Blanco, A.; Rubio-Valera, M.; Ángel Bellón, J. Risk Factors for the Onset of Panic and Generalised Anxiety Disorders in the General Adult Population: A Systematic Review of Cohort Studies. J. Affect. Disord. 2014, 168, 337–348. [Google Scholar] [CrossRef]
- Perna, G.; Alciati, A.; Daccò, S.; Grassi, M.; Caldirola, D. Personalized Psychiatry and Depression: The Role of Sociodemographic and Clinical Variables. Psychiatry Investig. 2020, 17, 193–206. [Google Scholar] [CrossRef] [PubMed]
- Scholten, A.C.; Haagsma, J.A.; Cnossen, M.C.; Olff, M.; van Beeck, E.F.; Polinder, S. Prevalence of and Risk Factors for Anxiety and Depressive Disorders after Traumatic Brain Injury: A Systematic Review. J. Neurotrauma 2016, 33, 1969–1994. [Google Scholar] [CrossRef] [PubMed]
- Demakis, G.J.; Hammond, F.M.; Knotts, A. Prediction of Depression and Anxiety 1 Year After Moderate-Severe Traumatic Brain Injury. Appl. Neuropsychol. 2010, 17, 183–189. [Google Scholar] [CrossRef] [PubMed]
- Buckman, J.E.J.; Saunders, R.; Stott, J.; Arundell, L.-L.; O’Driscoll, C.; Davies, M.R.; Eley, T.C.; Hollon, S.D.; Kendrick, T.; Ambler, G.; et al. Role of Age, Gender and Marital Status in Prognosis for Adults with Depression: An Individual Patient Data Meta-Analysis. Epidemiol. Psychiatr. Sci. 2021, 30, e42. [Google Scholar] [CrossRef] [PubMed]
- Whelan-Goodinson, R.; Ponsford, J.L.; Schönberger, M.; Johnston, L. Predictors of Psychiatric Disorders Following Traumatic Brain Injury. J. Head Trauma Rehabil. 2010, 25, 320–329. [Google Scholar] [CrossRef] [PubMed]
- Paparrigopoulos, T.; Melissaki, A.; Tzavellas, E.; Karaiskos, D.; Ilias, I.; Kokras, N. Increased Co-Morbidity of Depression and Post-Traumatic Stress Disorder Symptoms and Common Risk Factors in Intensive Care Unit Survivors: A Two-Year Follow-up Study. Int. J. Psychiatry Clin. Pract. 2014, 18, 25–31. [Google Scholar] [CrossRef]
- Neumann, D.; Juengst, S.B.; Bombardier, C.H.; Finn, J.A.; Miles, S.R.; Zhang, Y.; Kennedy, R.; Rabinowitz, A.R.; Thomas, A.; Dreer, L.E. Anxiety Trajectories the First 10 Years After a Traumatic Brain Injury (TBI): A TBI Model Systems Study. Arch. Phys. Med. Rehabil. 2022, 103, 2105–2113. [Google Scholar] [CrossRef]
- Widom, C.S. Are Retrospective Self-Reports Accurate Representations or Existential Recollections? JAMA Psychiatry 2019, 76, 567. [Google Scholar] [CrossRef]
- Haagsma, J.A.; Scholten, A.C.; Andriessen, T.M.J.C.; Vos, P.E.; Van Beeck, E.F.; Polinder, S. Impact of Depression and Post-Traumatic Stress Disorder on Functional Outcome and Health-Related Quality of Life of Patients with Mild Traumatic Brain Injury. J. Neurotrauma 2015, 32, 853–862. [Google Scholar] [CrossRef] [PubMed]
- Ponsford, J.; Draper, K.; Schönberger, M. Functional Outcome 10 Years after Traumatic Brain Injury: Its Relationship with Demographic, Injury Severity, and Cognitive and Emotional Status. J. Int. Neuropsychol. Soc. 2008, 14, 233–242. [Google Scholar] [CrossRef] [PubMed]
- Holeva, V.; Tarrier, N.; Wells, A. Prevalence and Predictors of Acute Stress Disorder and PTSD Following Road Traffic Accidents: Thought Control Strategies and Social Support. Behav. Ther. 2001, 32, 65–83. [Google Scholar] [CrossRef]
- Kennedy, J.E. Posttraumatic Stress Disorder and Posttraumatic Stress Disorder-like Symptoms and Mild Traumatic Brain Injury. J. Rehabil. Res. Dev. 2007, 44, 895–920. [Google Scholar] [CrossRef]
- Tanev, K.S.; Pentel, K.Z.; Kredlow, M.A.; Charney, M.E. PTSD and TBI Co-Morbidity: Scope, Clinical Presentation and Treatment Options. Brain Inj. 2014, 28, 261–270. [Google Scholar] [CrossRef]
- King, N.S. PTSD and Traumatic Brain Injury: Folklore and Fact? Brain Inj. 2008, 22, 1–5. [Google Scholar] [CrossRef]
- Moore, E.L.; Terryberry-Spohr, L.; Hope, D.A. Mild Traumatic Brain Injury and Anxiety Sequelae: A Review of the Literature. Brain Inj. 2006, 20, 117–132. [Google Scholar] [CrossRef]
- Levin, H.S.; Brown, S.A.; Song, J.X.; McCauley, S.R.; Boake, C.; Contant, C.F.; Goodman, H.; Kotrla, K.J. Depression and Posttraumatic Stress Disorder at Three Months After Mild to Moderate Traumatic Brain Injury. J. Clin. Exp. Neuropsychol. 2001, 23, 754–769. [Google Scholar] [CrossRef]
- O’Donnell, M.L.; Creamer, M.; Holmes, A.C.N.; Ellen, S.; McFarlane, A.C.; Judson, R.; Silove, D.; Bryant, R.A. Posttraumatic Stress Disorder After Injury: Does Admission to Intensive Care Unit Increase Risk? J. Trauma Inj. Infect. Crit. Care 2010, 69, 627–632. [Google Scholar] [CrossRef] [PubMed]
- Kim, L.H.; Quon, J.L.; Sun, F.W.; Wortman, K.M.; Adamson, M.M.; Harris, O.A. Traumatic Brain Injury among Female Veterans: A Review of Sex Differences in Military Neurosurgery. Neurosurg. Focus 2018, 45, E16. [Google Scholar] [CrossRef] [PubMed]
- Gupte, R.P.; Brooks, W.M.; Vukas, R.R.; Pierce, J.D.; Harris, J.L. Sex Differences in Traumatic Brain Injury: What We Know and What We Should Know. J. Neurotrauma 2019, 36, 3063–3091. [Google Scholar] [CrossRef] [PubMed]
- Forslund, M.V.; Roe, C.; Sigurdardottir, S.; Andelic, N. Predicting Health-Related Quality of Life 2 Years after Moderate-to-Severe Traumatic Brain Injury. Acta Neurol. Scand. 2013, 128, 220–227. [Google Scholar] [CrossRef] [PubMed]
- Dong, C.; Clarke, D.B.; Yan, X.; Khattak, A.; Huang, B. Multivariate Random-Parameters Zero-Inflated Negative Binomial Regression Model: An Application to Estimate Crash Frequencies at Intersections. Accid. Anal. Prev. 2014, 70, 320–329. [Google Scholar] [CrossRef] [PubMed]
- Steyerberg, E.W. Validation in Prediction Research: The Waste by Data Splitting. J. Clin. Epidemiol. 2018, 103, 131–133. [Google Scholar] [CrossRef] [PubMed]
- Schneider Soares, F.M.; Menezes de Souza, N.; Libório Schwarzbold, M.; Paim Diaz, A.; Costa Nunes, J.; Hohl, A.; Nunes Abreu da Silva, P.; Vieira, J.; Lisboa de Souza, R.; Moré Bertotti, M.; et al. Interleukin-10 Is an Independent Biomarker of Severe Traumatic Brain Injury Prognosis. Neuroimmunomodulation 2012, 19, 377–385. [Google Scholar] [CrossRef]


| Type of Regression | Outcome | Interpretation | Scale of Data | Dependent Variable | Index |
|---|---|---|---|---|---|
| Logistic (LR) | Screening Diagnoses | Effect of factors on the probability of a psychopathological screening diagnosis | Nominal (0: absent, 1: present) | Clinical cutoffs | OR (95%-CI) |
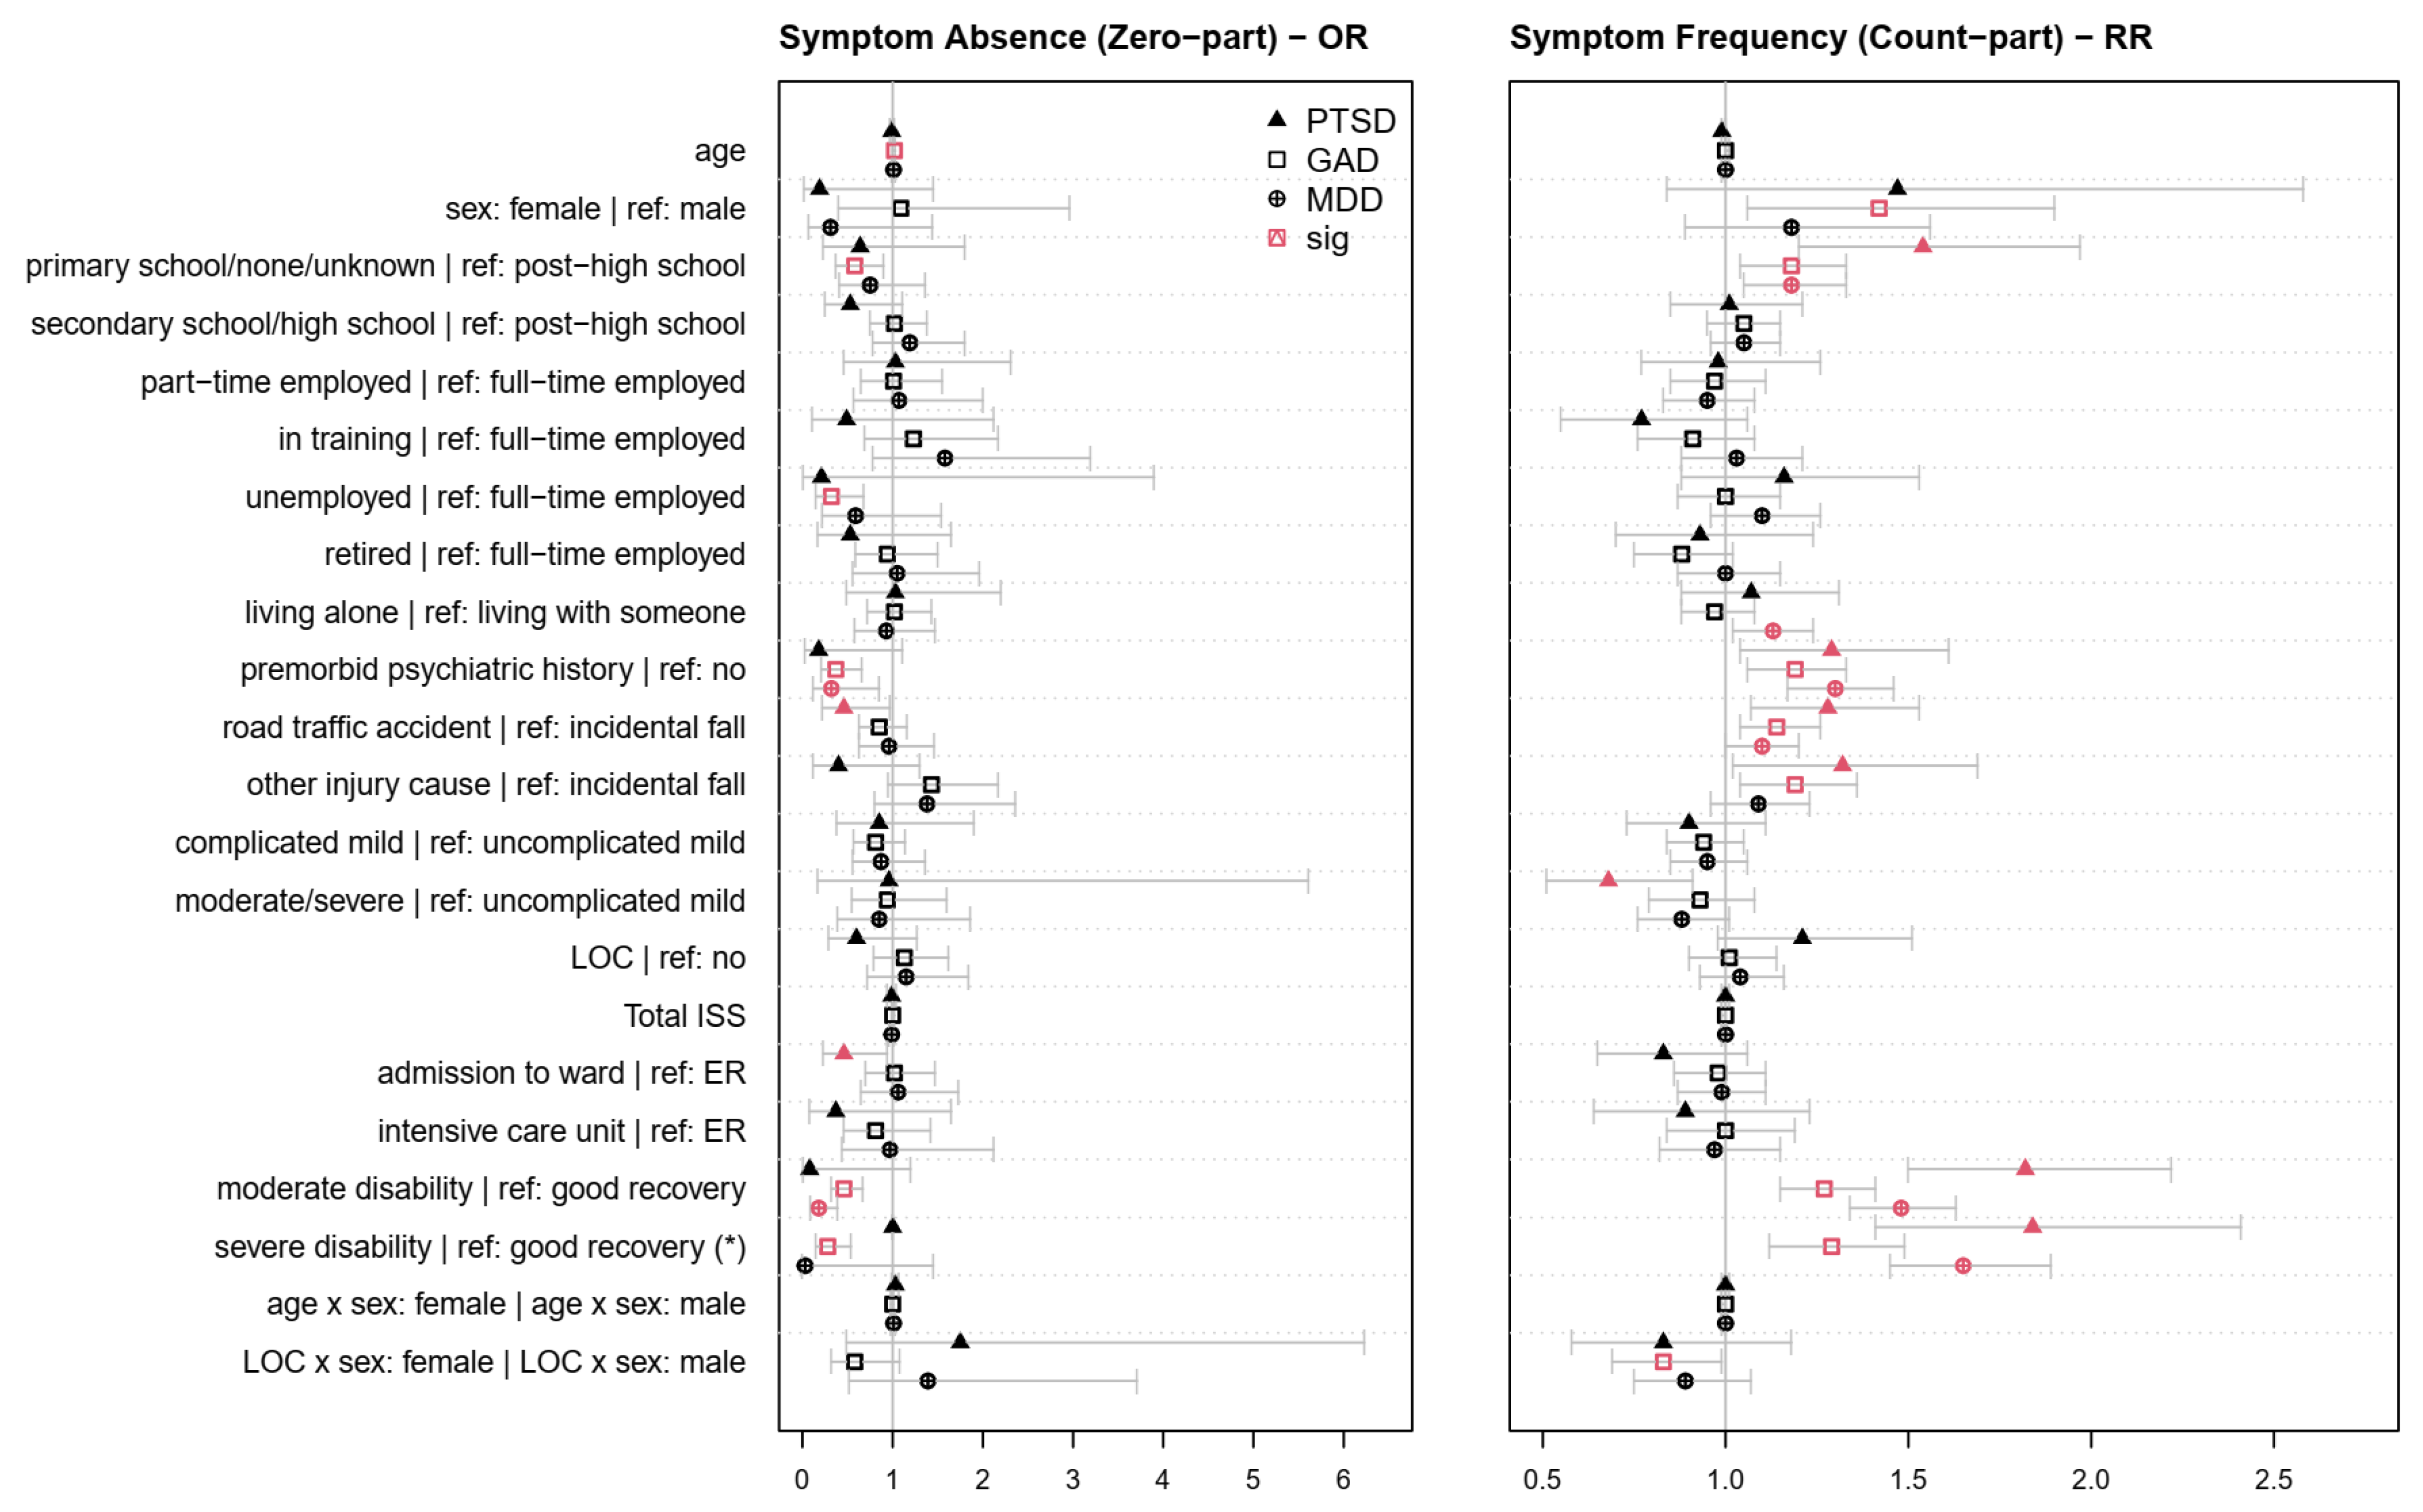
| Zero-inflated Negative Binomial (ZINB) | Occurrence and Frequency of Symptoms | Effect of factors on the probability of the occurrence and frequency of psychopathological symptoms | Occurrence: Nominal Frequency: Count (0–k, where k is the maximum number of items in a PROM) | Number of symptoms rated as at least mild | Occurrence: OR (95%-CI) Frequency: RR (95%-CI) |
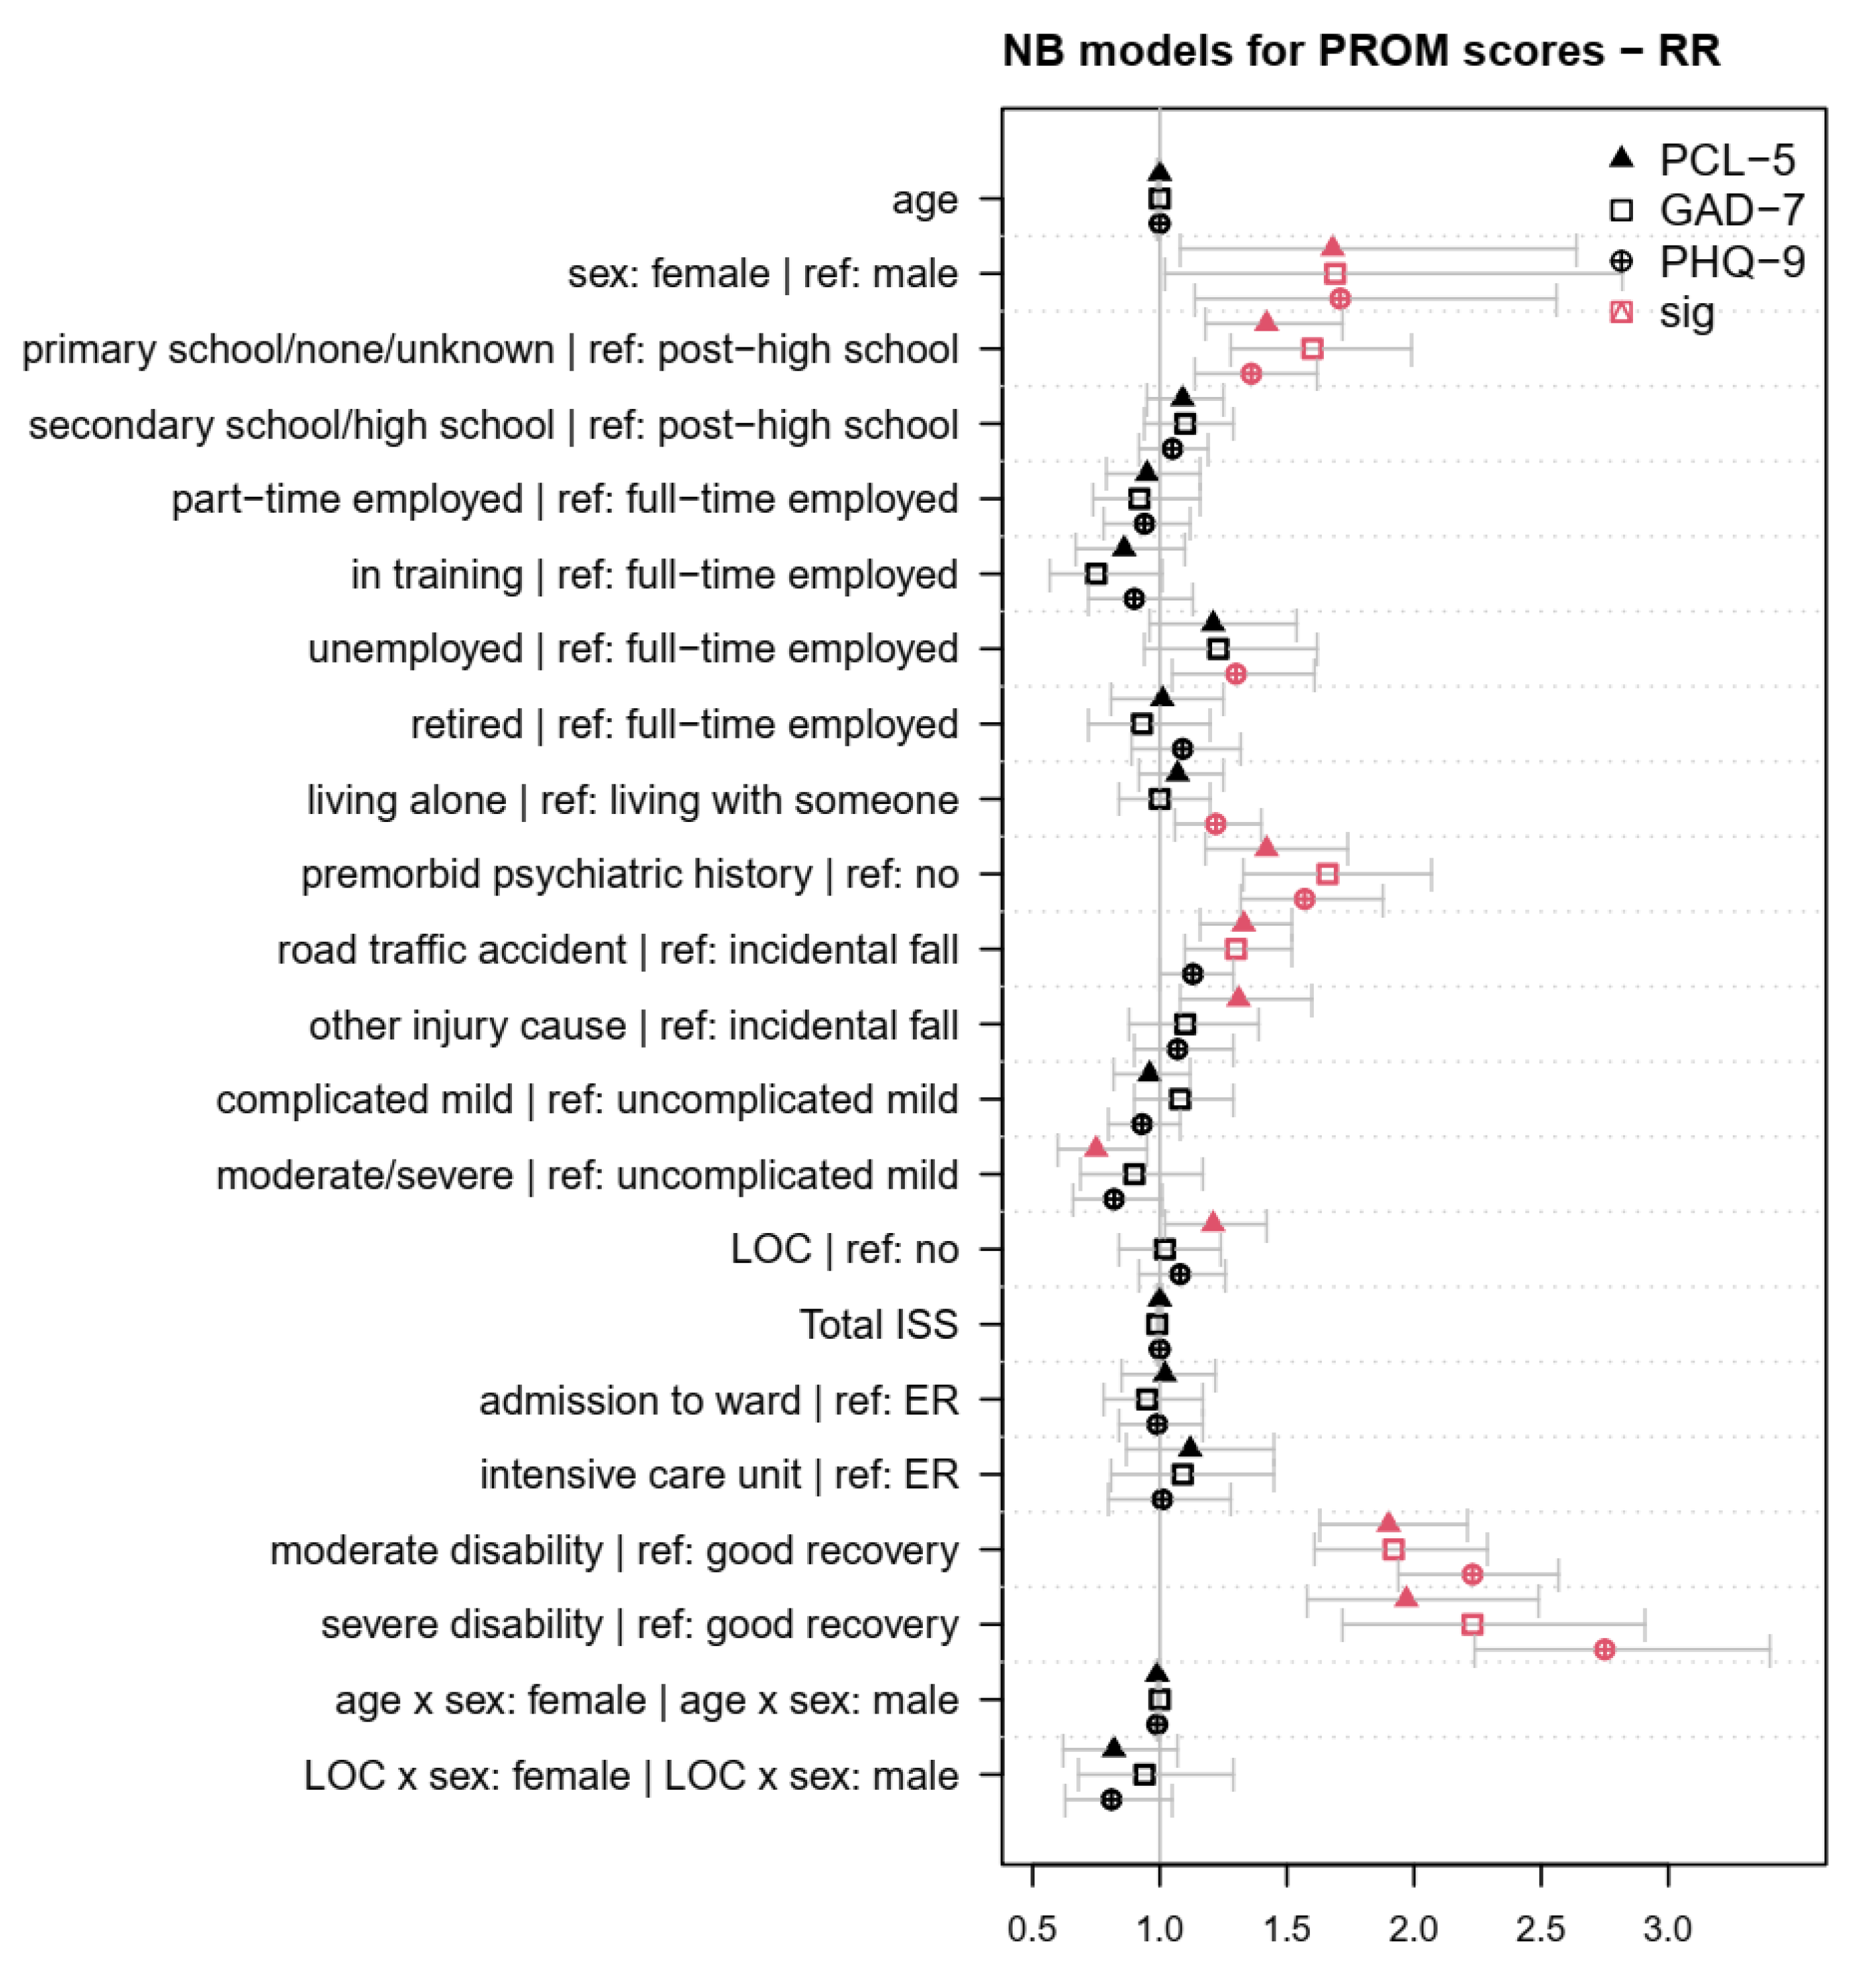
| Negative Binomial (NB) | Intensity of PROM scores | Effect of factors on the intensity of psychopathological symptoms | Metric (0–m, where m is the maximum scale score in a PROM) | Raw PROM score | RR (95%-CI) |
| Group (Reference in Italics) | N (%) | M (SD) | |
|---|---|---|---|
| Age | - | 2069 (100) | 49.09 (19.32) |
| Sex | male | 1352 (65.35) | - |
| female | 717 (34.65) | - | |
| Education | college/university | 967 (46.74) | - |
| secondary/high school | 628 (30.35) | - | |
| none/primary school | 258 (12.47) | - | |
| missing | 216 (10.44) | - | |
| Employment | full-time employed | 883 (42.68) | - |
| part-time employed | 225 (10.87) | - | |
| in training | 193 (9.33) | - | |
| unemployed | 163 (7.88) | - | |
| retired | 477 (23.05) | - | |
| missing | 128 (6.19) | - | |
| Living situation | with someone | 1651 (79.80) | - |
| alone | 417 (20.15) | - | |
| missing | 1 (0.05) | - | |
| Premorbid psychiatric history | no | 1803 (87.14) | - |
| yes | 244 (11.79) | - | |
| missing | 22 (1.06) | - | |
| Injury cause | incidental fall | 900 (43.50) | - |
| road traffic accident | 844 (40.79) | - | |
| other | 286 (13.82) | - | |
| missing | 39 (1.88) | - | |
| TBI severity | uncomplicated mild | 653 (31.56) | - |
| complicated mild | 618 (29.87) | - | |
| moderate/severe | 472 (22.81) | - | |
| missing | 326 (15.76) | - | |
| Loss of consciousness | no | 641 (30.98) | - |
| yes | 1223 (59.11) | - | |
| missing | 205 (9.91) | - | |
| Extracranial injuries (ISS) | - | 2048 (98.99) | 18.58 (15.00) |
| Clinical care pathways | ER | 437 (21.12) | - |
| Ward | 792 (38.28) | - | |
| ICU | 840 (40.60) | - | |
| Recovery (GOSE) | good recovery | 1336 (64.57) | - |
| moderate disability | 198 (9.57) | - | |
| severe disability | 534 (25.81) | - | |
| missing | 1 (0.05) | - | |
| PCL-5 | 3 M | 1630 (78.78) | 12.92 (13.57) |
| 6 M | 2069 (100) | 12.25 (13.64) | |
| GAD-7 | 3 M | 1618 (78.20) | 3.63 (4.46) |
| 6 M | 2069 (100) | 3.59 (4.49) | |
| PHQ-9 | 3 M | 1626 (78.59) | 5.20 (5.21) |
| 6 M | 2069 (100) | 5.00 (5.30) | |
| PTSD Screening Diagnosis | No | 1845 (89.17) | - |
| Yes | 224 (10.83) | - | |
| GAD Screening Diagnosis | No | 1846 (89.22) | - |
| Yes | 223 (10.78) | - | |
| MDD Screening Diagnosis | No | 1702 (82.26) | - |
| Yes | 367 (17.74) | - | |
| Total | - | 2069 (100) | - |
| PTSD | GAD | MDD | |||||||||||
|---|---|---|---|---|---|---|---|---|---|---|---|---|---|
| No. | Factor | Screening a | Intensity b | Occurrence c | Frequency d | Screening a | Intensity b | Occurrence c | Frequency d | Screening a | Intensity b | Occurrence c | Frequency d |
| (1) | Age | ** | |||||||||||
| (2) | Sex | * | * | * | * | ** | ** | ||||||
| (1:2) | Age:Sex | † | |||||||||||
| (3) | Education | ** | *** | † | *** | *** | *** | * | ** | *** | *** | ** | |
| (4) | Employment | † | † | *** | † | *** | * | ||||||
| (5) | Living Situation | † | *** | * | |||||||||
| (6) | Premorbid Psychiatric History | *** | *** | † | * | *** | *** | *** | *** | *** | *** | * | *** |
| (7) | Injury Cause | *** | *** | * | ** | *** | *** | † | ** | * | * | ||
| (8) | Injury Severity | ** | ** | * | † | † | † | ||||||
| (9) | LOC | * | † | ||||||||||
| (9:2) | LOC:Sex | † | * | * | † | ||||||||
| (10) | Extracranial Injuries (ISS) | * | † | ||||||||||
| (11) | Clinical Care Pathway (ER, ADM, ICU) | * | |||||||||||
| (12) | Recovery | *** | *** | † | *** | *** | *** | *** | *** | *** | *** | *** | *** |
Disclaimer/Publisher’s Note: The statements, opinions and data contained in all publications are solely those of the individual author(s) and contributor(s) and not of MDPI and/or the editor(s). MDPI and/or the editor(s) disclaim responsibility for any injury to people or property resulting from any ideas, methods, instructions or products referred to in the content. |
© 2023 by the authors. Licensee MDPI, Basel, Switzerland. This article is an open access article distributed under the terms and conditions of the Creative Commons Attribution (CC BY) license (https://creativecommons.org/licenses/by/4.0/).
Share and Cite
Bockhop, F.; Cunitz, K.; Zeldovich, M.; Buchheim, A.; Beissbarth, T.; Hagmayer, Y.; von Steinbuechel, N., on behalf of the CENTER-TBI Participants and Investigators. Influence of Sociodemographic, Premorbid, and Injury-Related Factors on Post-Traumatic Stress, Anxiety, and Depression after Traumatic Brain Injury. J. Clin. Med. 2023, 12, 3873. https://doi.org/10.3390/jcm12123873
Bockhop F, Cunitz K, Zeldovich M, Buchheim A, Beissbarth T, Hagmayer Y, von Steinbuechel N on behalf of the CENTER-TBI Participants and Investigators. Influence of Sociodemographic, Premorbid, and Injury-Related Factors on Post-Traumatic Stress, Anxiety, and Depression after Traumatic Brain Injury. Journal of Clinical Medicine. 2023; 12(12):3873. https://doi.org/10.3390/jcm12123873
Chicago/Turabian StyleBockhop, Fabian, Katrin Cunitz, Marina Zeldovich, Anna Buchheim, Tim Beissbarth, York Hagmayer, and Nicole von Steinbuechel on behalf of the CENTER-TBI Participants and Investigators. 2023. "Influence of Sociodemographic, Premorbid, and Injury-Related Factors on Post-Traumatic Stress, Anxiety, and Depression after Traumatic Brain Injury" Journal of Clinical Medicine 12, no. 12: 3873. https://doi.org/10.3390/jcm12123873
APA StyleBockhop, F., Cunitz, K., Zeldovich, M., Buchheim, A., Beissbarth, T., Hagmayer, Y., & von Steinbuechel, N., on behalf of the CENTER-TBI Participants and Investigators. (2023). Influence of Sociodemographic, Premorbid, and Injury-Related Factors on Post-Traumatic Stress, Anxiety, and Depression after Traumatic Brain Injury. Journal of Clinical Medicine, 12(12), 3873. https://doi.org/10.3390/jcm12123873