

Effects of Intermittent Fasting on Regulation of Metabolic Homeostasis: A Systematic Review and Meta-Analysis in Health and Metabolic-Related Disorders

 ,
,  and
and
Abstract
1. Introduction
2. Materials and Methods
2.1. Search Strategies
2.2. Eligibility
2.3. Study Selection
2.4. Outcomes Measures
2.5. Data Extraction, Management and Synthesis
2.6. Quality Assessment
3. Results
3.1. Search Results
3.2. Characteristics of Included Studies

3.3. Quality Assessment

| Study Type | Control Conditions | Experimental Conditions | IF Protocol | Duration (Days) | Age (Mean ± SD) | Participants (n and Gender) | Results Overview | |
|---|---|---|---|---|---|---|---|---|
| 1. Guo I, et al., 2021 [32] | RCT | MetS | MetS | ADF 5 + 2 (NC) | 56 | CTL = 42.7 ± 4.1 EG = 36.6 ± 5.7 | CTL—11 M/7 W EG—10 M/12 W | Weight, waist circumference, BMI, triglycerides, insulin resistance and fasting insulin were significantly improved after IF. CTL comprises individuals with MetS maintained their habitual diet and lifestyle. |
| 2. Parvaresh A, et al., 2019 [47] | RCT | - | MetS | ADF 4 + 3 (NC) | 56 | EG = 44.6 ± 9.8 | EG—21 M/14 W | mADF diet is an effective option for managing body weight, waist circumference, systolic blood pressure and fasting plasma glucose when compared with common calorie restriction. CTL comprises individuals with MetS that consumed 75% of their energy needs each day. |
| 3. Gabel K, et al., 2019 [29] | RCT | - | Obesity | ADF 1 + 1 (NC) | 365 | CTL = 43 ± 1 EG = 43 ± 3 | CTL—4 M/11 W EG—9 M/2 W | ADF may produce greater reductions in fasting insulin and insulin resistance compared with caloric restriction in insulin-resistant participants despite similar decreases in body weight. CTL comprises obese individuals that maintained their usual eating and activity habits. |
| 4. Cho A-Ra, et al., 2019 [23] | RCT | - | Overweight | ADF 4 + 3 (NC) | 56 | CTL = 42.6 ± 10.6 EG = 33.5 ± 5 | CTL—3 M/2 W EG—3 M/6 W | Exercise, with or without ADF, improves cholesterol metabolism (serum sterol signatures) and increased physical activity has a greater effect on cholesterol biosynthesis than weight reduction or calorie restriction. CTL comprises overweight individuals that maintained their usual eating and activity habits. |
| 5. Corley BT, et al., 2018 [9] | RCT | - | T2D | ADF 5 + 2 (C) 5 + 2 (NC) | 84 | 62 (44 to 77) * 58 (42 to 74) * | 11 M/7 W 11 M/8 W | IF in a 5 + 2 protocol (both consecutive and non-consecutive) increases the rate of hypoglycaemia in patients with T2D, even after education on this topic and medication adjustments. Yet it improves weight, HbA1c, fasting glucose and quality of life (both protocols). |
| 6. Hutchison AT, et al., 2018 [34] | RCT | Overweight or Obesity | Overweight or Obesity | ADF 4 + 3 (NC) | 70 | CTL 1 = 49 ± 3 CTL 2 = 49 ± 2 EG-IF100 = 51 ± 2 EG-IF70 = 51 ± 2 | CTL 1—11 W CTL 2—11 W EG-IF100—22 W EG-IF70—22 W | IF combined with a 30% caloric restriction is better at improving weight, fat mass, HOMA-IR, fasting glucose, non-esterified fatty acids, total cholesterol, LDL-cholesterol and triglycerides than energy-matched continuous caloric restriction. CTL comprises overweight or obese women maintained under continuous food intake at 100% of baseline energy requirements. |
| 7. Sundfør TM, et al., 2018 [54] | RCT | - | Overweight and MetS | ADF 5 + 2 (NC) | 365 | EG = 49.9 ± 10.1 | EG—28 M/26 W | Both intermittent and continuous energy restriction promoted similar weight loss, maintenance and improvement in cardiovascular risk factors after one year. However, the feelings of hunger, appears to be more pronounced during IF. |
| 8. Trepanowski JF, et al., 2018 [61] | RCT | - | Obesity | ADF 1 + 1 (NC) | 168 | CTL = 44 ± 2 EG = 46 ± 2 | CTL—4 M/21 W EG—3 M/22 W | ADF and CR similarly increased the fat-free mass:total-mass ratio, decreased circulating leptin and did not affect the visceral adipose tissue:subcutaneous adipose tissue ratio or other measured adipokines. Weight loss, rather than the pattern of energy restriction, appeared to be the main driver of these changes. CTL comprises obese individuals that maintained their usual diet. |
| 9. Conley M, et al., 2018 [25] | RCT | - | Obesity | ADF 5 + 2 (NC) | 180 | EG = 68 ± 2.7 | EG—11 M | The 5:2 diet is a feasible weight loss strategy in this older male population. Furthermore, it also indicates that participants were able to follow the diet sufficiently to induce magnitudes of weight loss similar to that of standard dietary modification practices, and the diet did not appear to cause an unbalanced nutritional intake. |
| 10. Li C, et al., 2017 [43] | RCT | T2D | T2D | ADF 1 week fasting | 7 | CTL = 64.4 ± 5.7 EG = 64.7 ± 7 | CTL—16 NS EG—16 NS | A 1-week fasting therapy is promising for the improvement of weight, waist circumference, SBP, DBP and HOMA-IR in T2D patients, when compared with typical T2D medication. CTL comprises T2D individuals that followed the principles of a Mediterranean diet. |
| 11. Catenacci VA et al., 2016 [22] | RCT | - | Obesity | ADF 1 + 1 (NC) | 56 | EG = 39.6 ± 9.5 | EG—3 M/10 W | ADF is a safe and tolerable approach for weight loss, it improved weight, body composition, lipids and insulin sensitivity index at 8 weeks while not increasing the risk for weight regain up-to 24 weeks after completing the intervention. |
| 12. Hoddy KK, et al., 2014 [33] | RCT | - | Obesity | ADF 1 + 1 (NC) | 70 | ADF-L: 45 ± 3 ADF-D: 45 ± 3 ADF-SM: 46 ± 2 | ADF-L: 3 M/17 W ADF-D: 4 M/15 W ADF-SM: 2 M/18 W | This study demonstrated there is flexibility in the timing of the fast day meal during ADF. People with obesity may feed at dinner or as small meals throughout the day, and experience similar weight loss, body composition and cardiovascular benefits as the traditional lunch time approach. |
| 13.Varady KA et al., 2009 [55] | CRS | - | Obesity | ADF 1 + 1 (NC) | 56 | EG = 46 ± 2.4 | EG—4 M/12 W | ADF is a viable diet option to help obese individuals lose weight and decrease coronary artery disease risk. |
| 1. Kotarsky CJ, et al., 2021 [41] | RCT | Overweight or Obesity | Overweight or Obesity | TRF 16 + 8 | 56 | CTL = 44 ± 2 EG = 45 ± 3 | CTL—9 M/1 W EG—9 M/2 W | IF associated with exercise training is a short-term dietary strategy for reducing fat mass and increasing lean mass in overweight and obese adults. CTL comprises overweight or obese individuals that maintained their usual diet. |
| 2. de Oliveira Maranhao Pureza IR, et al., 2021 [26] | RCT | Overweight or Obesity | Overweight or Obesity | TRF 12 + 12 | 365 | 19–44 | EG –31 W | IF may help in the long-term management of obesity. |
| 3. Kunduraci YE, et al., 2020 [7] | RCT | MetS | MetS | TRF 16 + 8 | 84 | EG = 47.44 ± 2.17 | EG—16 M/16 W | Weight, BMI, total cholesterol, LDL, triglycerides, fasting glucose, systolic and diastolic blood pressure, insulin resistance and fasting insulin were significantly improved after IF. |
| 4. Cienfuegos S, et al., 2020 [24] | RCT | - | Obesity | TRF 20 + 4 18 + 6 | 56 | 4 h_TRF: 49 ± 2 6 h_TRF: 46 ± 3 | 4 h_TRF: 2 M/14 W 6 h_TRF: 1 M/18 W | 4- and 6-h TRF regimens lead to similar weight loss over the 2 months in peolple with obesity while also decreasing insulin resistance and oxidative stress. CTL comprises obese individuals that maintained their usual diet. |
| 5. Jones R, et al., 2020 [35] | CCS | Healthy | Healthy | TRF 16 + 8 | 14 | CTL = 23 ± 1 EG = 23 ± 1 | CTL—8 M EG—8 M | Weight showed significant improvement after IF. CTL comprises healthy individuals following a dietary plan provided with all food and beverages that matched the macronutrient composition (45% CHO, 35% fat and 20% protein). |
| 6. Zhao L, et al., 2022 [58] | CRS | Overweight | TRF 14 + 10 | 56 | 63 ± 4 | 15 M | This study demostrated that TRF had a net effect of reducing glycemia and dampening energy-consuming pathways in adipose tissue. | |
| 7. Parr EB, et al., 2020 [46] | CRS | T2D | T2D | TRF 15 + 9 | 28 | 50.2 ± 8.9 | 9 M/10 W | Fasting insulin showed significant improvements after IF. |
| 8. Gabel K, et al., 2020 [30] | CRS | - | Obesity | TRF 16 + 8 | 84 | - | 14 M | This study suggest that the mild weight loss (2%) induced by time restricted eating did not significantly alter the diversity or overall composition of the gut microbiome. |
| 9. Wilkinson MJ, et al., 2020 [56] | CRS | - | MetS | TRF 14 + 10 | 84 | 59 ± 11.4 | 15 M/6 W | TRF mproved cardiometabolic health of patients with metabolic syndrome receiving standard medical care including high rates of statin and anti-hypertensive use. |
| 10. Anton SD, et al., 2019 [19] | CRS | - | Overweight | TRF 16 + 8 | 21 | 77.1 | 4 M/6 W | TRF is an acceptable and feasible eating pattern for overweight, older adults to follow while also promoting short-term weight loss. |
| 11. Kesztyüs D, et al., 2019 [38] | CRS | - | MetS | TRF 16 + 8 | 90 | 49.1± 12,4 | 9 M/31 W | TRE may help to reduce abdominal obesity and hence prevent cardio-metabolic diseases. |
| 12. Arnason FB, et al., 2017 [20] | CRS | - | T2D | TRF 18–20 h fasting per day | 14 | 53.8 ± 9.11 | 1 M/9 W | Weight and BMI were improved after IF. |
| 13. Schroder JD, et al., 2021 [51] | NRCT | Obesity | Obesity | TRF 16 + 8 | 90 | CTL = 42.3 ± 3.5 EG = 36.6 ± 1.6 | CTL—12 W EG—20 W | Weight, waist circumference, BMI, SBP and DBP were improved after IF. CTL comprises obese individuals that maintained their usual diet. |
| 1. Zouhal H, et al., 2020 [59] | RCT | - | Obesity | RF Ramadan | 30 | CTL = 23.8 ± 3.8 EG = 24 ± 3.4 | CTL—14 M EG—14 M | Ramadan fasting improves systemic inflammation biomarkers in males with obesity. CTL comprises obese individuals that did not fast during Ramadan. |
| 2. Zouhal H, et al., 2020 [60] | RCT | - | Obesity | RF Ramadan | 30 | CTL = 23.8 ± 3.7 EG = 24.5 ± 3.8 | CTL—15 M EG—15 M | IF during Ramadan is an effective strategy to modify appetite-regulating hormones, leading to improved body composition indices and reduced obesity. |
| 3. Abdullah K, et al., 2020 [18] | CS | Healthy | Healthy or T2D | RF Ramadan | 30 | CTL = 34.61 ± 4.31 EG = 34.35 ± 3.83 EG = 50.17 ± 12.95 | CTL—31 M EG—37 M EG—30 M | This study compares the effect of IF in patients with T2D, their first-degree relatives and healthy individuals. Leptin, adiponectin, leptin:adiponectin ratio, HOMA-beta and HbA1c were significantly improved in all groups. Fasting blood glucose and growth hormone levels were improved in control and first-degree relatives. C-peptide, HOMA-IR, HOMA-S and insulin levels were improved in T2D patients and first-degree relatives. CTL comprises healthy control with fasting blood glucose <100 mg/dL. |
| 4. Yeoh ECK, et al., 2015 [57] | CS | T2D | RF Ramadan | 30 | 57 ± 11 | 15 M/14 W | Ramadan fasting can be practiced safely with prior patient education and medication adjustment with modest benefits on metabolic profile and body composition, particularly among females. | |
| 5. Feizollahzadeh S, et al., 2014 [28] | CS | - | Healthy with Overweight | RF Ramadan | 30 | 47.88 | 70 M | Weight and BMI were improved after IF although total cholesterol, triglycerides and fasting glucose levels were also increased. |
| 6. Karatoprak C, et al., 2013 [37] | CS | T2D | RF Ramadan | 30 | 57.4 ± 10.1 | 19 M/57 W | Results showed no negative effects of extended fasting on glucose regulation in diabetic patients using certain medications. | |
| 7. McNeil J, et al., 2014 [45] | CCS | Healthy | Obesity | RF Ramadan | 14 | 27 ± 4.5 | 10 M | Data demostrated significant increased of glucose, total cholesterol and LDL-C levels during Ramadan fast in normal-weight and obese men. Dietary restraint scores were also greater during Ramadan. Lastly, changes in anthropometric parameters were related to changes in metabolic profiles, dietary restraint and disinhibition eating behavior trait scores. |
| 8. Kovil R, et al., 2020 [42] | CRS | - | T2D | RF Ramadan | 30 | 21–80 ** | 25 M/25 W | This study did not show any significant changes in the parameters evaluated after IF. |
| 9. Faris E, et al., 2019 [27] | CRS | - | Overweight or Obesity | RF Ramadan | 30 | 36.2 ± 12.5 | 35 M/22 W | Weight, BMI, total cholesterol, triglycerides and SBP were improved after IF although HDL was also decreased. |
| 10. Madkour MI, et al., 2019 [44] | CRS | - | Healthy or Obesity | RF Ramadan | 30 | CTL = 29.8 ± 14 EG = 35.72 ± 12.35 | CTL—6 EG—34 M/22 W | Fasting glucose, insulin, insulin resistance expressed in homeostatic model assessment (HOMA-IR) remained unchanged throughout the study, while significant (p < 0.05) decreases in total cholesterol, triglycerides and HDL cholesterol were observed. |
| 11. Abdessadek M, et al., 2019 [17] | CRS | - | T2D | RF Ramadan | 30 | - | 57 M/93 W | This study showed a significant decrease in glycemic parameters (glycated haemoglobin and fasting blood glucose), and also significant variations in lipid profile before and after Ramadan, respectively. Furthermore, it also demostrated that in well-controlled T2D patients under antidiabetic drugs, the risk of hypoglycaemia is very low and patients may fast safely in Ramadan. |
| 12. Prasetya G, et al., 2018 [48] | CRS | - | Healthy | RF Ramadan | 29 | 24.3 ± 3.7 | 27 M | Weight, waist circumference, BMI, insulin resistance and fasting insulin were improved after IF although HDL levels were also decreased. |
| 13. Kamble S, et al., 2018 [36] | CRS | - | Healthy | RF Ramadan | 39 | 20–35 ** | 30 (NS) | No changes after IF. |
| 14. Sezen Y, et al., 2016 [52] | CRS | - | Obesity | RF Ramadan | 30 | 37 ± 7 | 70 M | Ramadan fasting was beneficial for body composition, but had no effect on arterial stiffness and resting heart rate. |
| 15. Gnanou JV, et al., 2015 [31] | CRS | - | Healthy | RF Ramadan | 39 | 19–23 ** | 20 M | Weight, BMI, fasting glucose, fasting insulin and insulin resistance were improved after IF. |
| 16. Sahin SB, et al., 2013 [49] | CRS | - | T2D | RF Ramadan | 30 | 56.93 ± 9.57 | 40 M/82 W | Fasting during Ramadan did not worsen the glycemic control of T2D patients. |
| 17. Shariatpanahi MV, et al., 2012 [53] | CRS | - | MetS | RF Ramadan | 30 | 40.14 ± 10.8 | 65 M | Change in the number and timing of meals and portioning of the daily energy consumption decreases inflammatory markers in MetS. |
| 18. Salehi M and Neghab M, 2007 [50] | CRS | - | Obesity | RF Ramadan | 29 | 23.4 ± 1.3 | 28 M | Consumption of a medium calorie balanced diet in conjunction with sufficient fluid intake during Ramadan and fasting may significantly decrease serum levels of glucose, cholesterol, as well as weight and BMI. |
| 19. Khaled MB, et al., 2006 [39] | CRS | - | Obesity | RF Ramadan | 29 | 23.4 ± 1.3 | 60 W | Beneficial effect of Ramadan fasting on glucose homeostasis, and an unbalanced profile on lipids. |
| 20. Khatib FA and Shafagoj YA, 2004 [40] | CRS | - | T2D/Obesity | RF Ramadan | 29 | 51 ± 10 | 44 M | Non-insulin dependent T2D patients displayed a trend towards better glycemic control following Ramadan fasting. |
| 21. Bener A, et al., 2018 [21] | CSS | T2D | RF Ramadan | 30 | 55.39 ± 15.3 | 593 M/653 W | Ramadan fasting has positive effects on T2D patients by decreasing blood pressure, blood glucose and HbA1C levels and BMI. It also improved sleep duration and physical activity. | |
| TOTAL | 1551 M/1491 W/ 68 NS |
3.4. Meta-Analysis
3.5. Characterization of Participants Included in Each IF Protocol
3.6. Effects of IF on Regulation of Metabolic Homeostasis
3.6.1. Adiposity
| Moderators | k 1 | Point Estimate | CI Lower | CI Upper | p-Value | Heterogeneity | |||
|---|---|---|---|---|---|---|---|---|---|
| Q-Value | p-Value | I-Squared | |||||||
| Adiposity | Weight (kg) | ||||||||
| All studies | 12 | 5.54 | 4.21 | 6.86 | <0.00001 | 26.92 | 0.008 | 55.00 | |
| Healthy | 0 | - | - | - | - | - | - | - | |
| Obesity | 8 | 5.82 | 4.29 | 7.36 | <0.00001 | 26.68 | 0.0008 | 70.00 | |
| T2D | 2 | 3.67 | −3.71 | 11.04 | 0.33 | 0.00 | 0.99 | 0.00 | |
| MetS | 2 | 4.00 | −0.23 | 8.24 | 0.06 | 0.02 | 0.88 | 0.00 | |
| BMI (kg/m2) | |||||||||
| All studies | 9 | 2.50 | 1.78 | 3.21 | <0.00001 | 18.59 | <0.02 | 57.00 | |
| Healthy | 0 | - | - | - | - | - | - | - | |
| Obesity | 6 | 2.83 | 2.03 | 3.64 | <0.00001 | 13.08 | 0.02 | 62.00 | |
| T2D | 2 | 1.09 | −0.61 | 2.79 | 0.21 | 0.04 | 0.84 | 0.00 | |
| MetS | 1 | 1.70 | 0.18 | 3.22 | 0.03 | - | - | - | |
| Waist circumference (cm) | |||||||||
| All studies | 7 | 5.80 | 3.87 | 7.72 | <0.00001 | 31.19 | <0.00001 | 78.00 | |
| Healthy | 0 | - | - | - | - | - | - | - | |
| Obesity | 3 | 6.67 | 4.24 | 9.10 | <0.00001 | 28.64 | <0.00001 | 90.00 | |
| T2D | 2 | 4.12 | −1.09 | 9.33 | 0.12 | 0.04 | 0.84 | 0.00 | |
| MetS | 2 | 3.52 | −0.06 | 7.10 | 0.05 | 0.15 | 0.70 | 0.00 | |
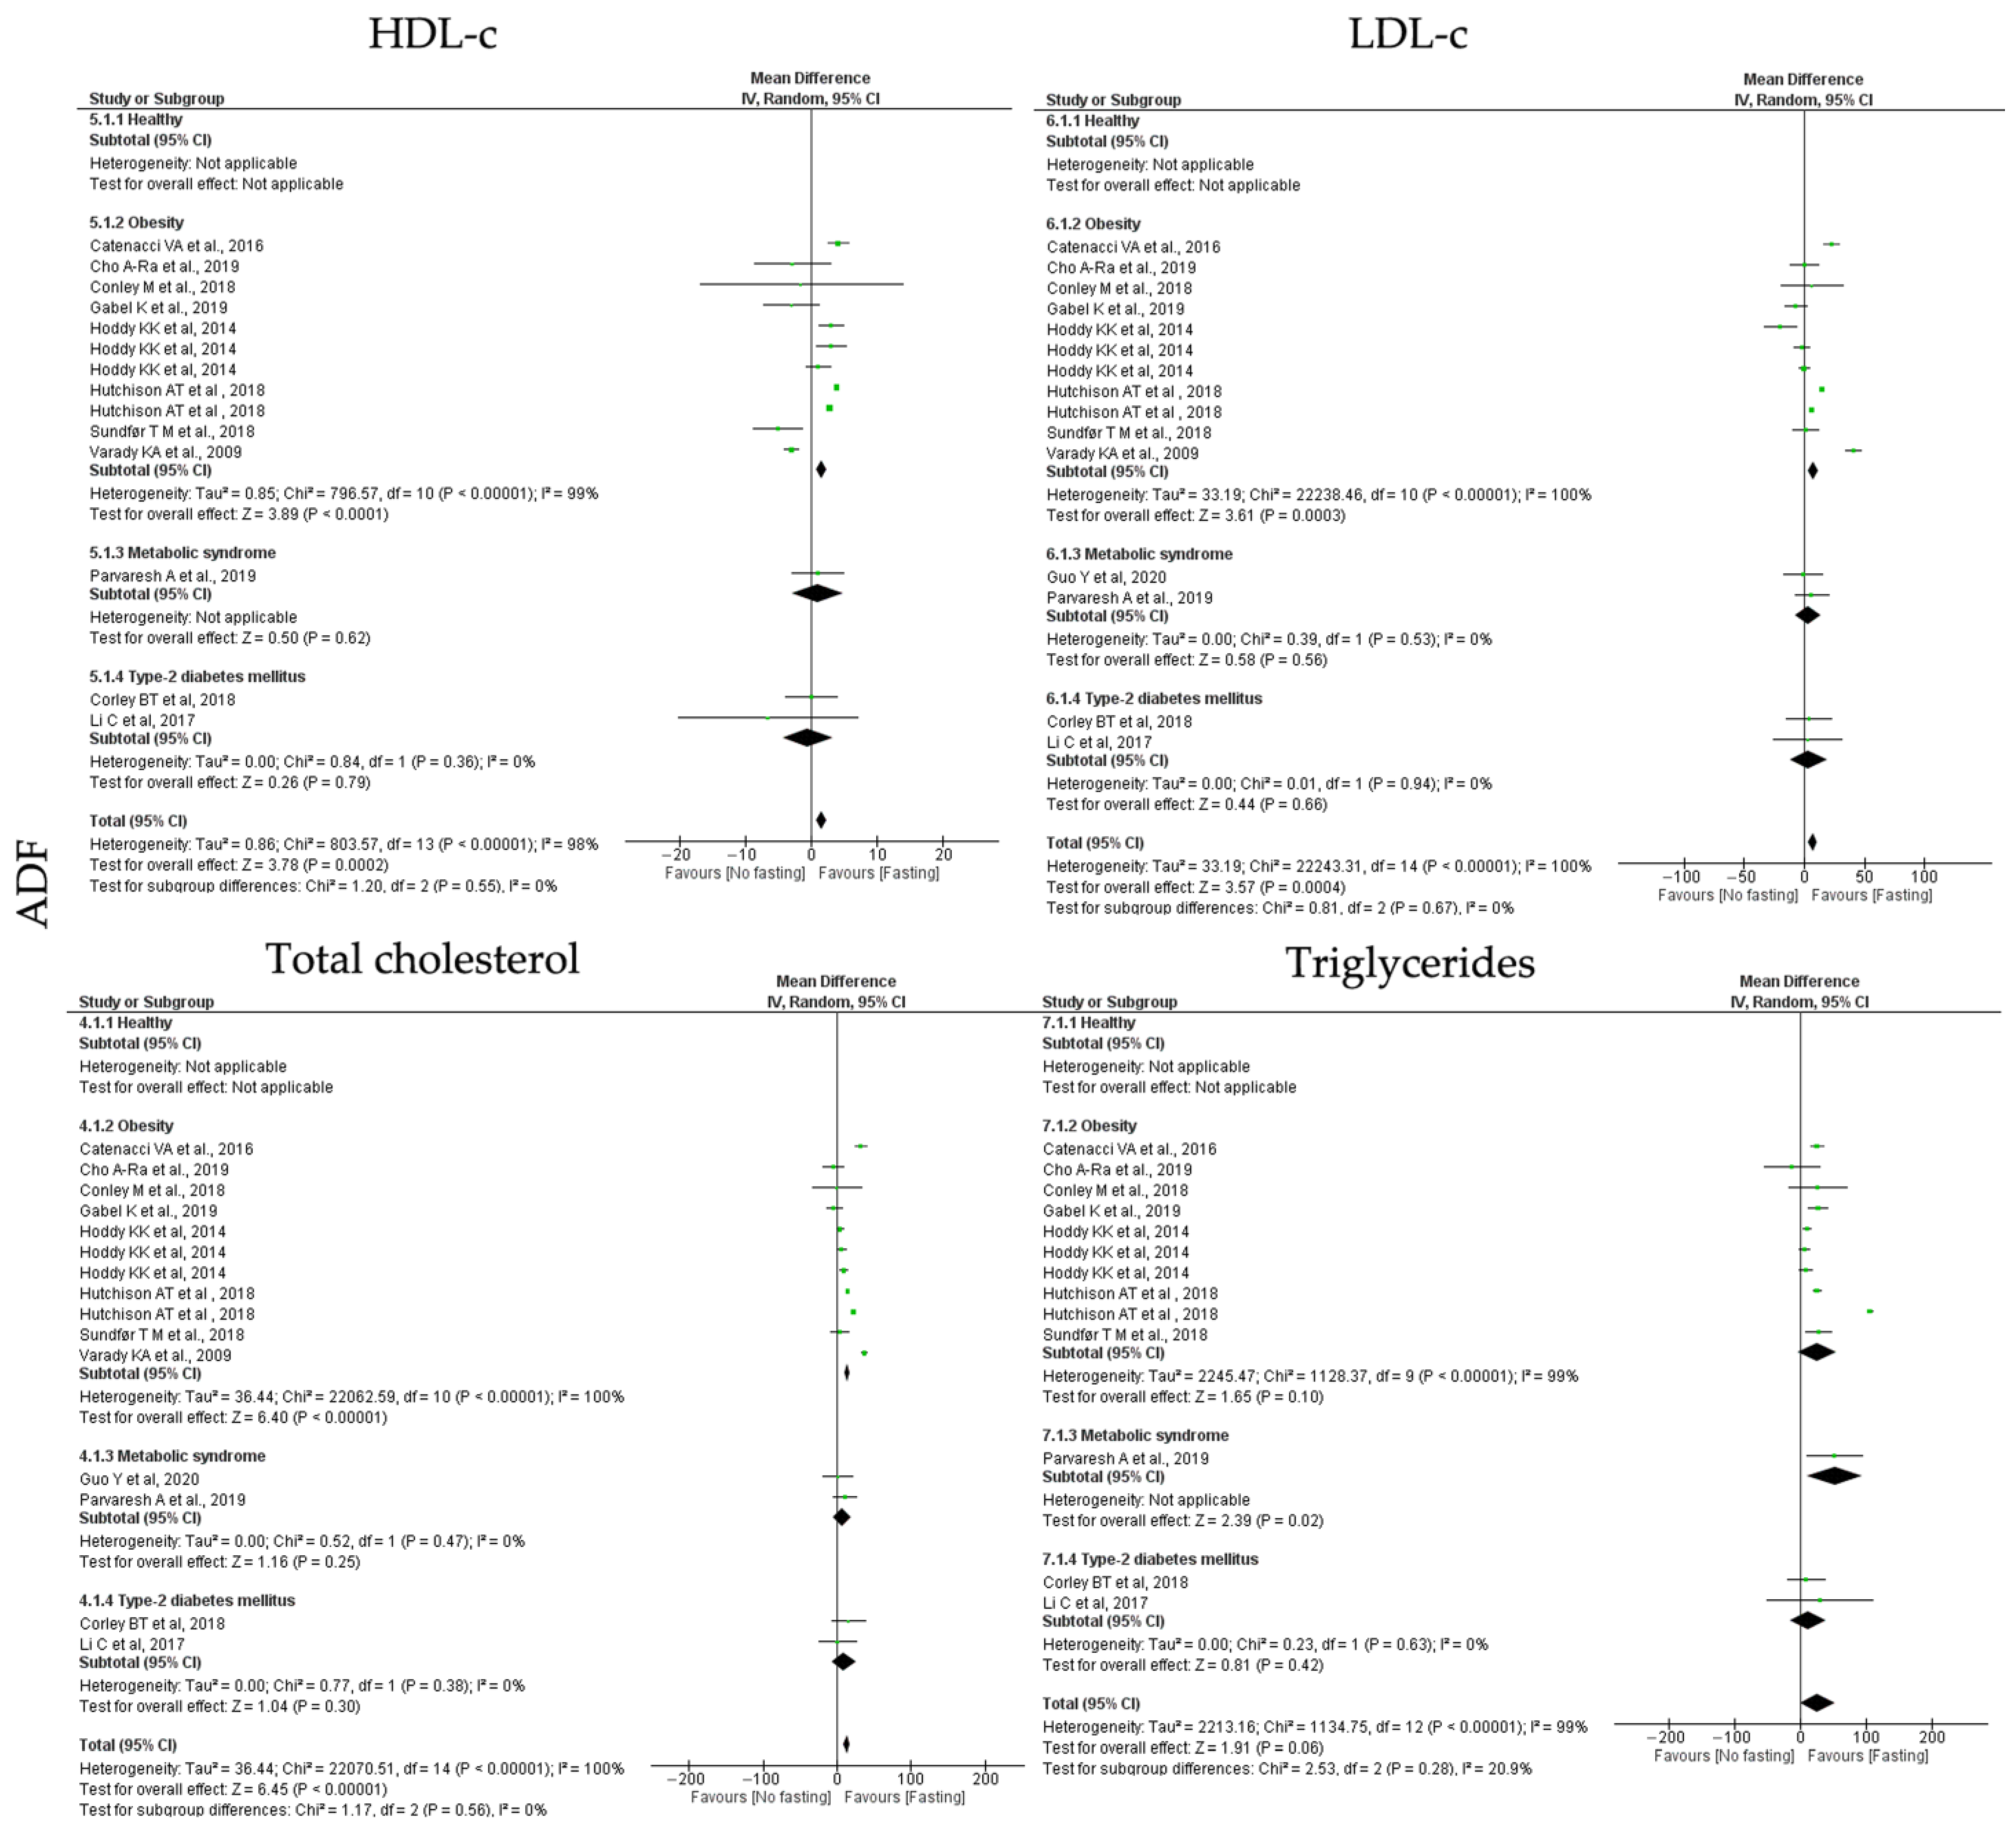
| Lipid homeostasis | HDL-c (mg/dL) | ||||||||
| All studies | 11 | 1.49 | 0.72 | 2.26 | 0.0002 | 803.57 | <0.00001 | 98.00 | |
| Healthy | 0 | - | - | - | - | - | - | - | |
| Obesity | 8 | 1.59 | 0.79 | 2.39 | <0.00001 | 796.57 | <0.00001 | 99.00 | |
| T2D | 2 | −0.51 | −4.25 | 3.24 | 0.79 | 0.84 | 0.36 | 0.00 | |
| MetS | 1 | 1.00 | −2.92 | 4.92 | 0.62 | - | - | - | |
| LDL-c (mg/dL) | |||||||||
| All studies | 12 | 7.06 | 3.19 | 10.93 | 0.0004 | 22,243.31 | <0.00001 | 100.00 | |
| Healthy | 0 | - | - | - | - | - | - | - | |
| Obesity | 8 | 7.67 | 3.51 | 11.83 | 0.0003 | 22,238.46 | <0.00001 | 100.00 | |
| T2D | 2 | 3.49 | −12.02 | 19.00 | 0.66 | 0.01 | 0.94 | 0.00 | |
| MetS | 2 | 3.10 | −7.45 | 13.65 | 0.58 | 0.39 | 0.53 | 0.00 | |
| Total cholesterol (mg/dL) | |||||||||
| All studies | 12 | 13.16 | 3 | 17.16 | <0.00001 | 22,070.51 | <0.00001 | 100.00 | |
| Healthy | 0 | - | - | - | - | - | - | - | |
| Obesity | 8 | 13.87 | 9.62 | 18.12 | <0.00001 | 22,062.59 | <0.00001 | 100.00 | |
| T2D | 2 | 8.84 | −7.79 | 25.48 | 0.30 | 0.77 | 0.38 | 0.00 | |
| MetS | 2 | 7.39 | −5.11 | 19.90 | 0.25 | 0.52 | 0.47 | 0.00 | |
| Triglycerides (mg/dL) | |||||||||
| All studies | 10 | 26.17 | −0.62 | 55.45 | 0.06 | 1134.75 | <0.00001 | 99.00 | |
| Healthy | 0 | - | - | - | - | - | - | - | |
| Obesity | 7 | 25.38 | −4.68 | 55.45 | 0.10 | 1128.37 | <0.00001 | 99.00 | |
| T2D | 2 | 11.20 | −15.84 | 38.24 | 0.42 | 0.23 | 0.63 | 0.00 | |
| MetS | 1 | 52.00 | 9.41 | 94.59 | 0.02 | - | - | - | |
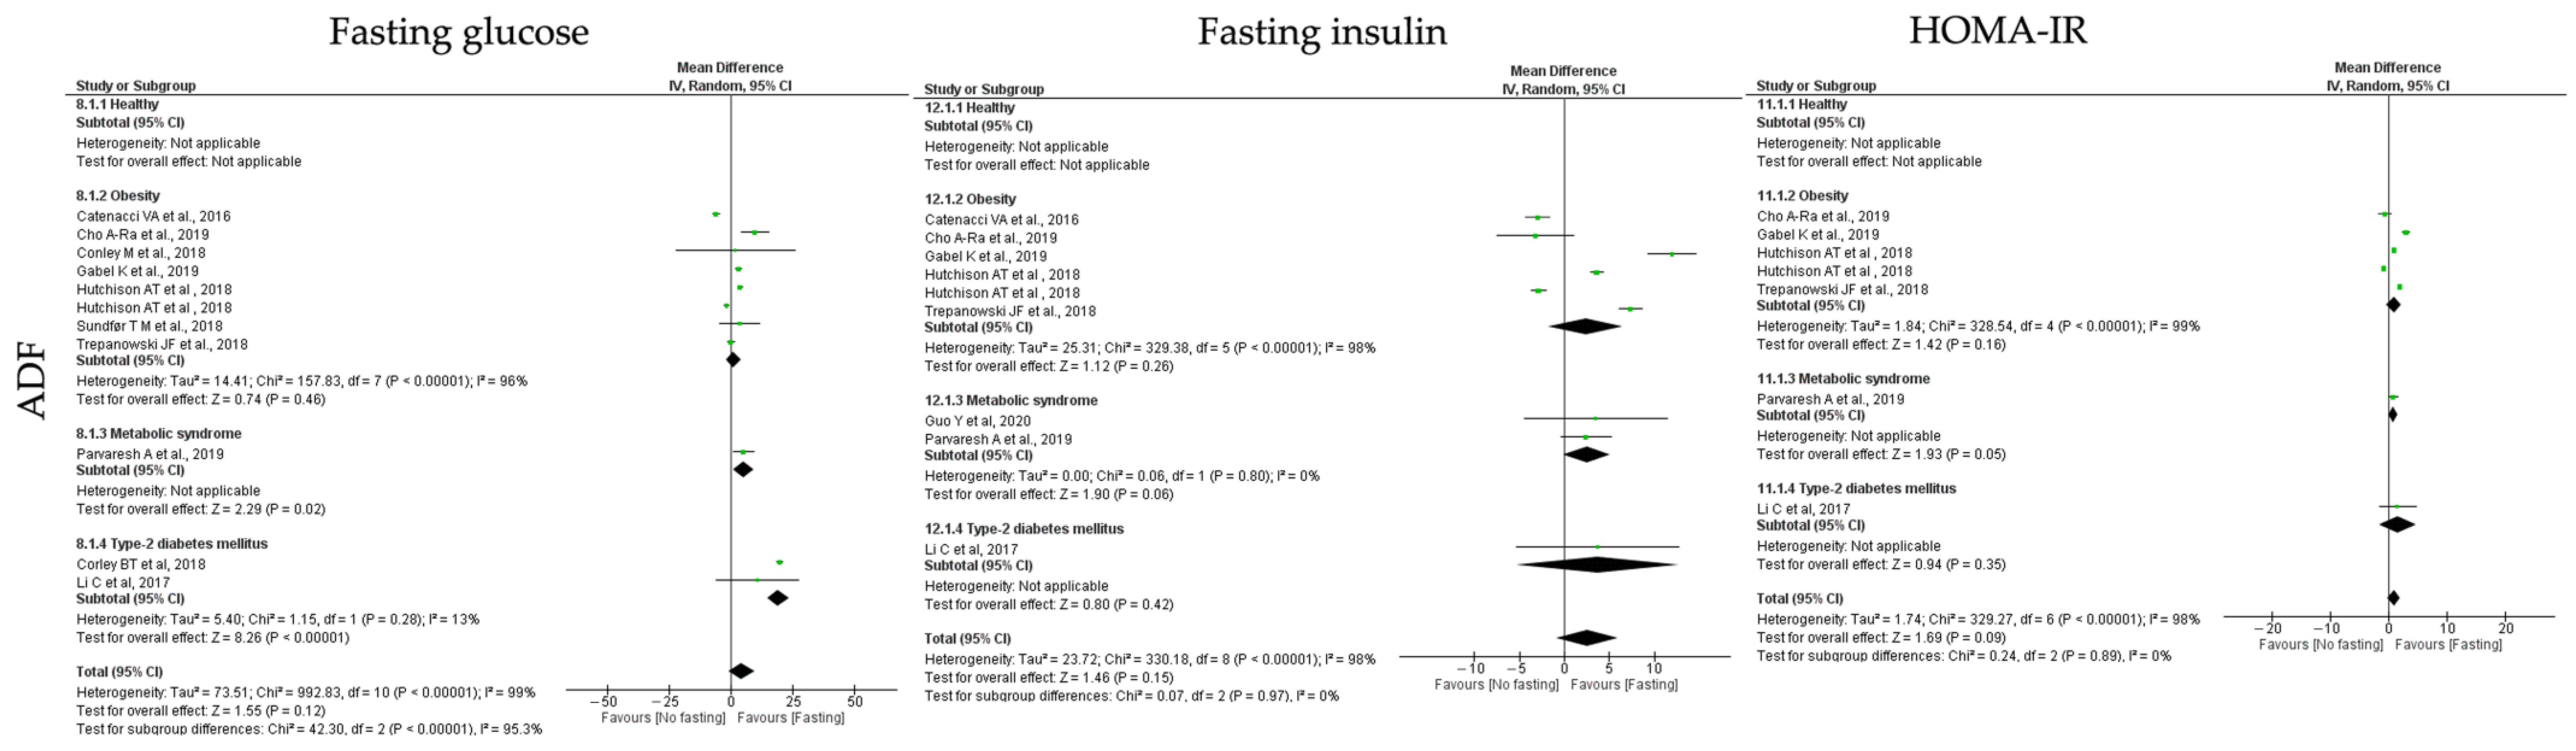
| Insulin homeostasis | Fasting glucose (mg/dL) | ||||||||
| All studies | 10 | 4.33 | −1.14 | 9.79 | 0.12 | 99,283 | <0.00001 | 99.00 | |
| Healthy | 0 | - | - | - | - | - | - | - | |
| Obesity | 7 | 1.14 | −1.89 | 4.17 | 0.46 | 157.83 | <0.00001 | 96.00 | |
| T2D | 2 | 19.17 | 14.63 | 23.72 | <0.00001 | 1.15 | 0.28 | 13.00 | |
| MetS | 1 | 5.00 | 0.71 | 9.29 | 0.02 | - | - | - | |
| Fasting insulin (mU/L) | |||||||||
| All studies | 8 | 2.55 | −0.88 | 5.98 | 0.15 | 330.18 | <0.00001 | 98.00 | |
| Healthy | 0 | - | - | - | - | - | - | - | |
| Obesity | 5 | 2.36 | −1.76 | 6.48 | 0.26 | 329.38 | <0.00001 | 98.00 | |
| T2D | 1 | 3.70 | −5.31 | 12.71 | 0.42 | - | - | - | |
| MetS | 2 | 2.54 | −0.08 | 5.15 | 0.06 | 0.06 | 0.80 | 0.00 | |
| HOMA-IR | |||||||||
| All studies | 6 | 0.90 | −0.14 | 1.95 | 0.09 | 329.27 | <0.00001 | 98.00 | |
| Healthy | 0 | - | - | - | - | - | - | - | |
| Obesity | 4 | 0.88 | −0.33 | 2.10 | 0.16 | 328.54 | <0.00001 | 99.00 | |
| T2D | 1 | 1.50 | −1.63 | 4.63 | 0.53 | - | - | - | |
| MetS | 1 | 0.73 | −0.01 | 1.47 | <0.00001 | - | - | - | |
| Blood pressure | SBP (mmHg) | ||||||||
| All studies | 8 | 6.08 | 4.08 | 8.08 | <0.00001 | 24.27 | 0.004 | 63.00 | |
| Healthy | 0 | - | - | - | - | - | - | - | |
| Obesity | 4 | 5.49 | 3.41 | 7.57 | <0.00001 | 17.68 | 0.003 | 72.00 | |
| T2D | 2 | 8.21 | −1.38 | 17.80 | 0.09 | 1.83 | 0.18 | 45.00 | |
| MetS | 2 | 10.46 | 2.08 | 18.83 | 0.01 | 1.58 | 0.21 | 37.00 | |
| DBP (mmHg) | |||||||||
| All studies | 8 | 3.52 | 2.55 | 4.49 | <0.00001 | 17.14 | 0.05 | 48.00 | |
| Healthy | 0 | - | - | - | - | - | - | - | |
| Obesity | 4 | 3.23 | 2.32 | 4.13 | <0.00001 | 10.19 | 0.07 | 51.00 | |
| T2D | 2 | 5.79 | −0.08 | 11.65 | 0.05 | 1.39 | 0.24 | 28.00 | |
| MetS | 2 | 5.76 | 0.30 | 11.22 | 0.04 | 2.09 | 0.15 | 52.00 | |
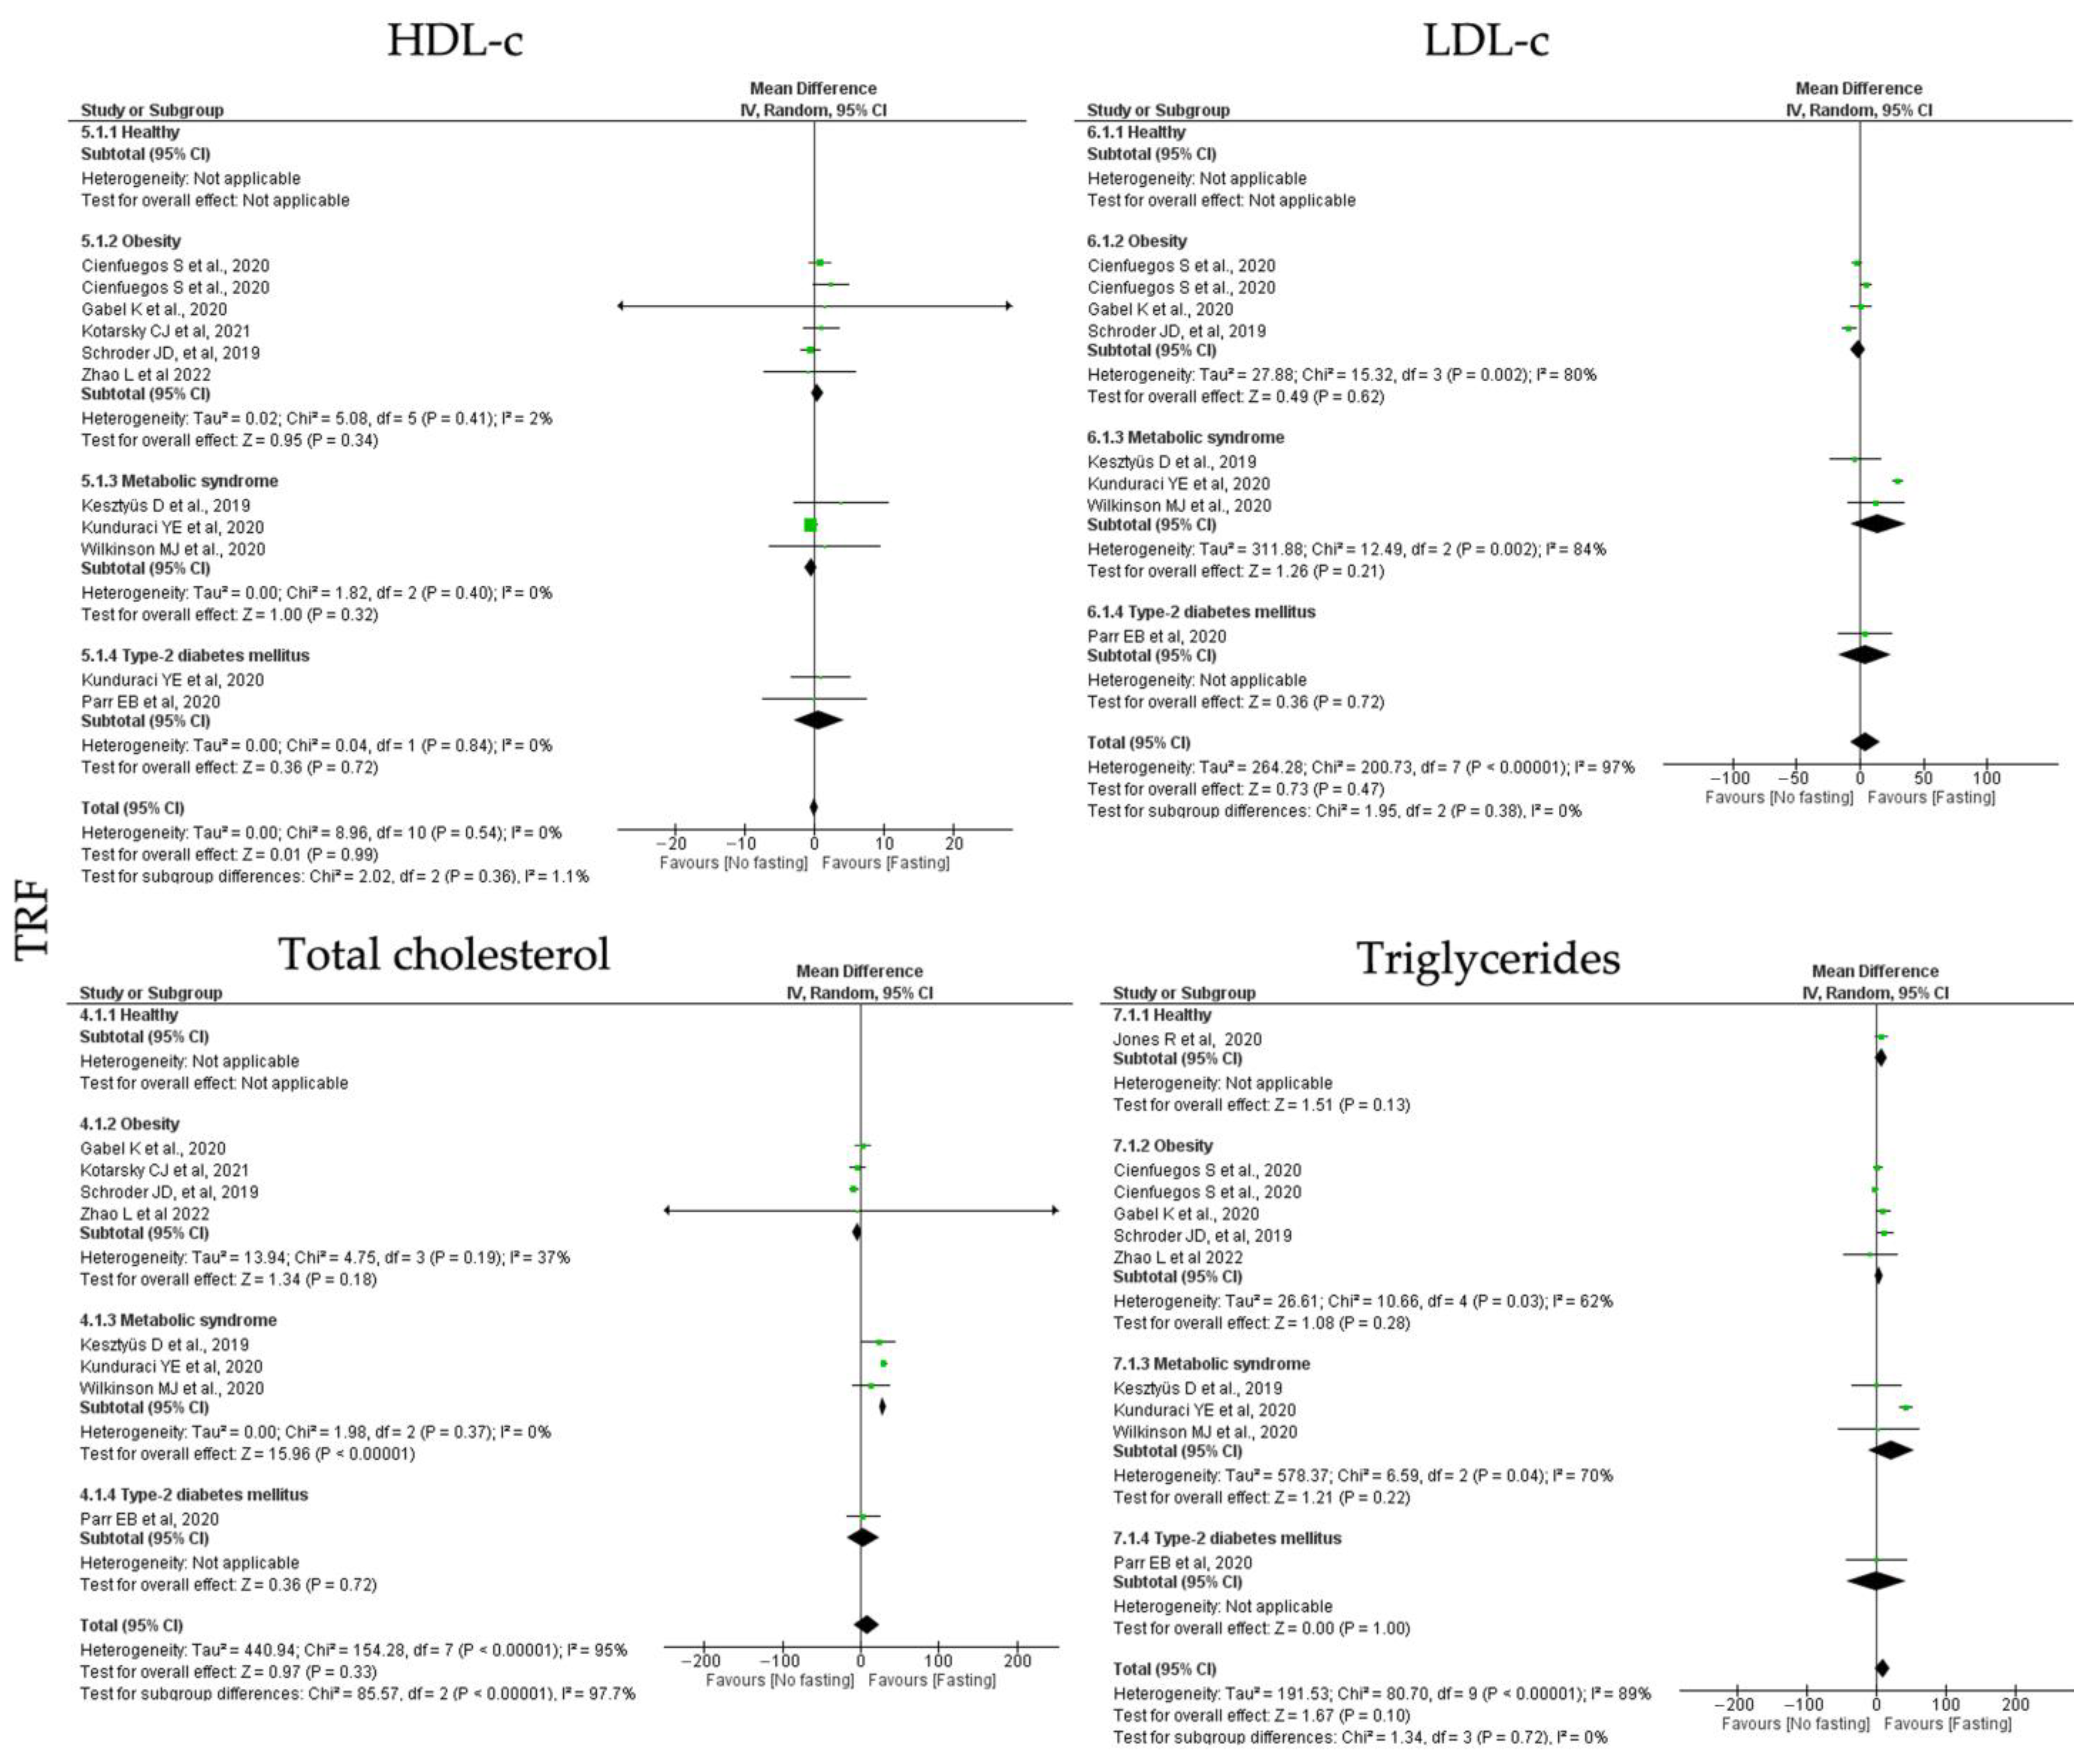
3.6.2. Lipid Homeostasis


| Moderators | k 1 | Point Estimate | CI Lower | CI Upper | p-Value | Heterogeneity | |||
|---|---|---|---|---|---|---|---|---|---|
| Q-Value | p-Value | I-Squared | |||||||
| Adiposity | Weight (kg) | ||||||||
| All studies | 13 | 3.05 | 0.87 | 5.23 | 0.006 | 46.60 | <0.00001 | 72.00 | |
| Healthy | 1 | 1.04 | −1.89 | 3.97 | 0.49 | - | - | - | |
| Obesity | 7 | 2.78 | 1.50 | 4.06 | <0.00001 | 1.37 | 0.99 | 0.00 | |
| T2D | 2 | 0.89 | −6.55 | 8.34 | 0.81 | 0.00 | 0.95 | 0.00 | |
| MetS | 3 | 7.14 | 3.71 | 10.57 | <0.00001 | 2.46 | 0.29 | 19.00 | |
| BMI (kg/m2) | |||||||||
| All studies | 9 | 1.48 | 0.39 | 2.57 | 0.008 | 45.32 | <0.0001 | 82.00 | |
| Healthy | 0 | - | - | - | - | - | - | - | |
| Obesity | 5 | 1.01 | 0.56 | 1.46 | <0.00001 | 2.97 | 0.56 | 0.00 | |
| T2D | 1 | 3.50 | −3.69 | 10.69 | 0.34 | - | - | - | |
| MetS | 3 | 2.01 | 0.24 | 3.78 | 0.03 | 4.92 | 0.09 | 59.00 | |
| Waist circumference (cm) | |||||||||
| All studies | 8 | 3.93 | 2.64 | 5.21 | <0.00001 | 0.98 | 1.00 | 0.00 | |
| Healthy | 0 | - | - | - | - | - | - | - | |
| Obesity | 5 | 3.89 | 2.54 | 5.23 | <0.00001 | 0.57 | 0.97 | 0.00 | |
| T2D | 1 | 1.80 | −7.93 | 11.53 | 0.72 | - | - | - | |
| MetS | 2 | 5.01 | 0.12 | 9.90 | 0.04 | 0.03 | 0.87 | 0.00 | |
| Lipid homeostasis | HDL-c (mg/dL) | ||||||||
| All studies | 8 | 0.00 | −0.60 | 0.61 | 0.99 | 8.96 | 0.44 | 0.00 | |
| Healthy | 0 | - | - | - | - | - | - | - | |
| Obesity | 5 | 0.43 | −0.46 | 1.31 | 0.34 | 5.08 | 0.41 | 2.00 | |
| T2D | 1 | 0.90 | −3.36 | 5.16 | 0.72 | - | - | - | |
| MetS | 3 | −0.44 | −1.29 | 0.42 | 0.32 | 1.82 | 0.40 | 0.00 | |
| LDL-c (mg/dL) | |||||||||
| All studies | 7 | 4.48 | −7.60 | 16.56 | 0.47 | 200.73 | <0.00001 | 97.00 | |
| Healthy | 0 | - | - | - | - | - | - | - | |
| Obesity | 3 | −1.47 | −7.32 | 4.38 | 0.62 | 15.32 | 0.002 | 80.00 | |
| T2D | 1 | 3.87 | −17.06 | 24.80 | 0.72 | - | - | - | |
| MetS | 3 | 14.16 | −7.92 | 36.28 | 0.21 | 12.49 | 0.002 | 84.00 | |
| Total cholesterol (mg/dL) | |||||||||
| All studies | 8 | 8.14 | −8.37 | 24.65 | 0.33 | 154.28 | <0.00001 | 95.00 | |
| Healthy | 0 | - | - | - | - | - | - | - | |
| Obesity | 4 | −4.21 | −10.36 | 1.94 | 0.18 | 4.75 | 0.19 | 37.00 | |
| T2D | 1 | 3.80 | −17.13 | 24.73 | 0.72 | - | - | - | |
| MetS | 3 | 28.80 | 25.26 | 32.34 | <0.00001 | 1.98 | 0.37 | 0.00 | |
| Triglycerides (mg/dL) | |||||||||
| All studies | 9 | 8.93 | −1.58 | 19.45 | 0.10 | 80.70 | <0.00001 | 89.00 | |
| Healthy | 1 | 7.08 | −2.08 | 16.24 | 0.13 | - | - | - | |
| Obesity | 4 | 3.41 | −2.80 | 9.63 | 0.28 | 10.66 | 0.03 | 62.00 | |
| T2D | 1 | 0.00 | −42.34 | 42.34 | 1.00 | - | - | - | |
| MetS | 3 | 20.61 | −12.67 | 53.90 | 0.22 | 6.59 | 0.04 | 70.00 | |
| Insulin homeostasis | Fasting glucose (mg/dL) | ||||||||
| All studies | 10 | 5.89 | 2.52 | 9.26 | 0.0006 | 338.62 | <0.00001 | 97.00 | |
| Healthy | 1 | 0.54 | −1.33 | 2.41 | 0.57 | - | - | - | |
| Obesity | 5 | 4.25 | 0.32 | 8.18 | 0.03 | 102.00 | <0.00001 | 95.00 | |
| T2D | 2 | 7.22 | 3.74 | 10.71 | <0.00001 | 13.45 | 0.0002 | 93.00 | |
| MetS | 2 | 13.75 | 7.99 | 19.50 | <0.00001 | 1.73 | 0.19 | 42.00 | |
| Fasting insulin (mU/L) | |||||||||
| All studies | 9 | 2.34 | 0.17 | 4.51 | 0.003 | 24.85 | 0.0002 | 68.00 | |
| Healthy | 1 | 1.58 | −8.05 | 11.21 | 0.75 | - | - | - | |
| Obesity | 5 | 1.19 | 0.14 | 2.23 | 0.03 | 18.09 | 0.0001 | 78.00 | |
| T2D | 1 | −2.70 | −15.93 | 10.53 | 0.69 | - | - | - | |
| MetS | 2 | 2.27 | 1.04 | 3.51 | 0.0003 | 0.15 | 0.70 | 0.00 | |
| HOMA-IR | |||||||||
| All studies | 5 | 0.75 | 0.35 | 1.15 | 0.0002 | 15.54 | 0.0008 | 68.00 | |
| Healthy | 0 | - | - | - | - | - | - | - | |
| Obesity | 2 | 0.57 | 0.21 | 0.93 | 0.002 | 4.14 | 0.13 | 52.00 | |
| T2D | 1 | 0.40 | −1.98 | 2.78 | 0.74 | - | - | - | |
| MetS | 2 | 1.29 | 0.99 | 1.60 | <0.00001 | 0.03 | 0.86 | 0.00 | |
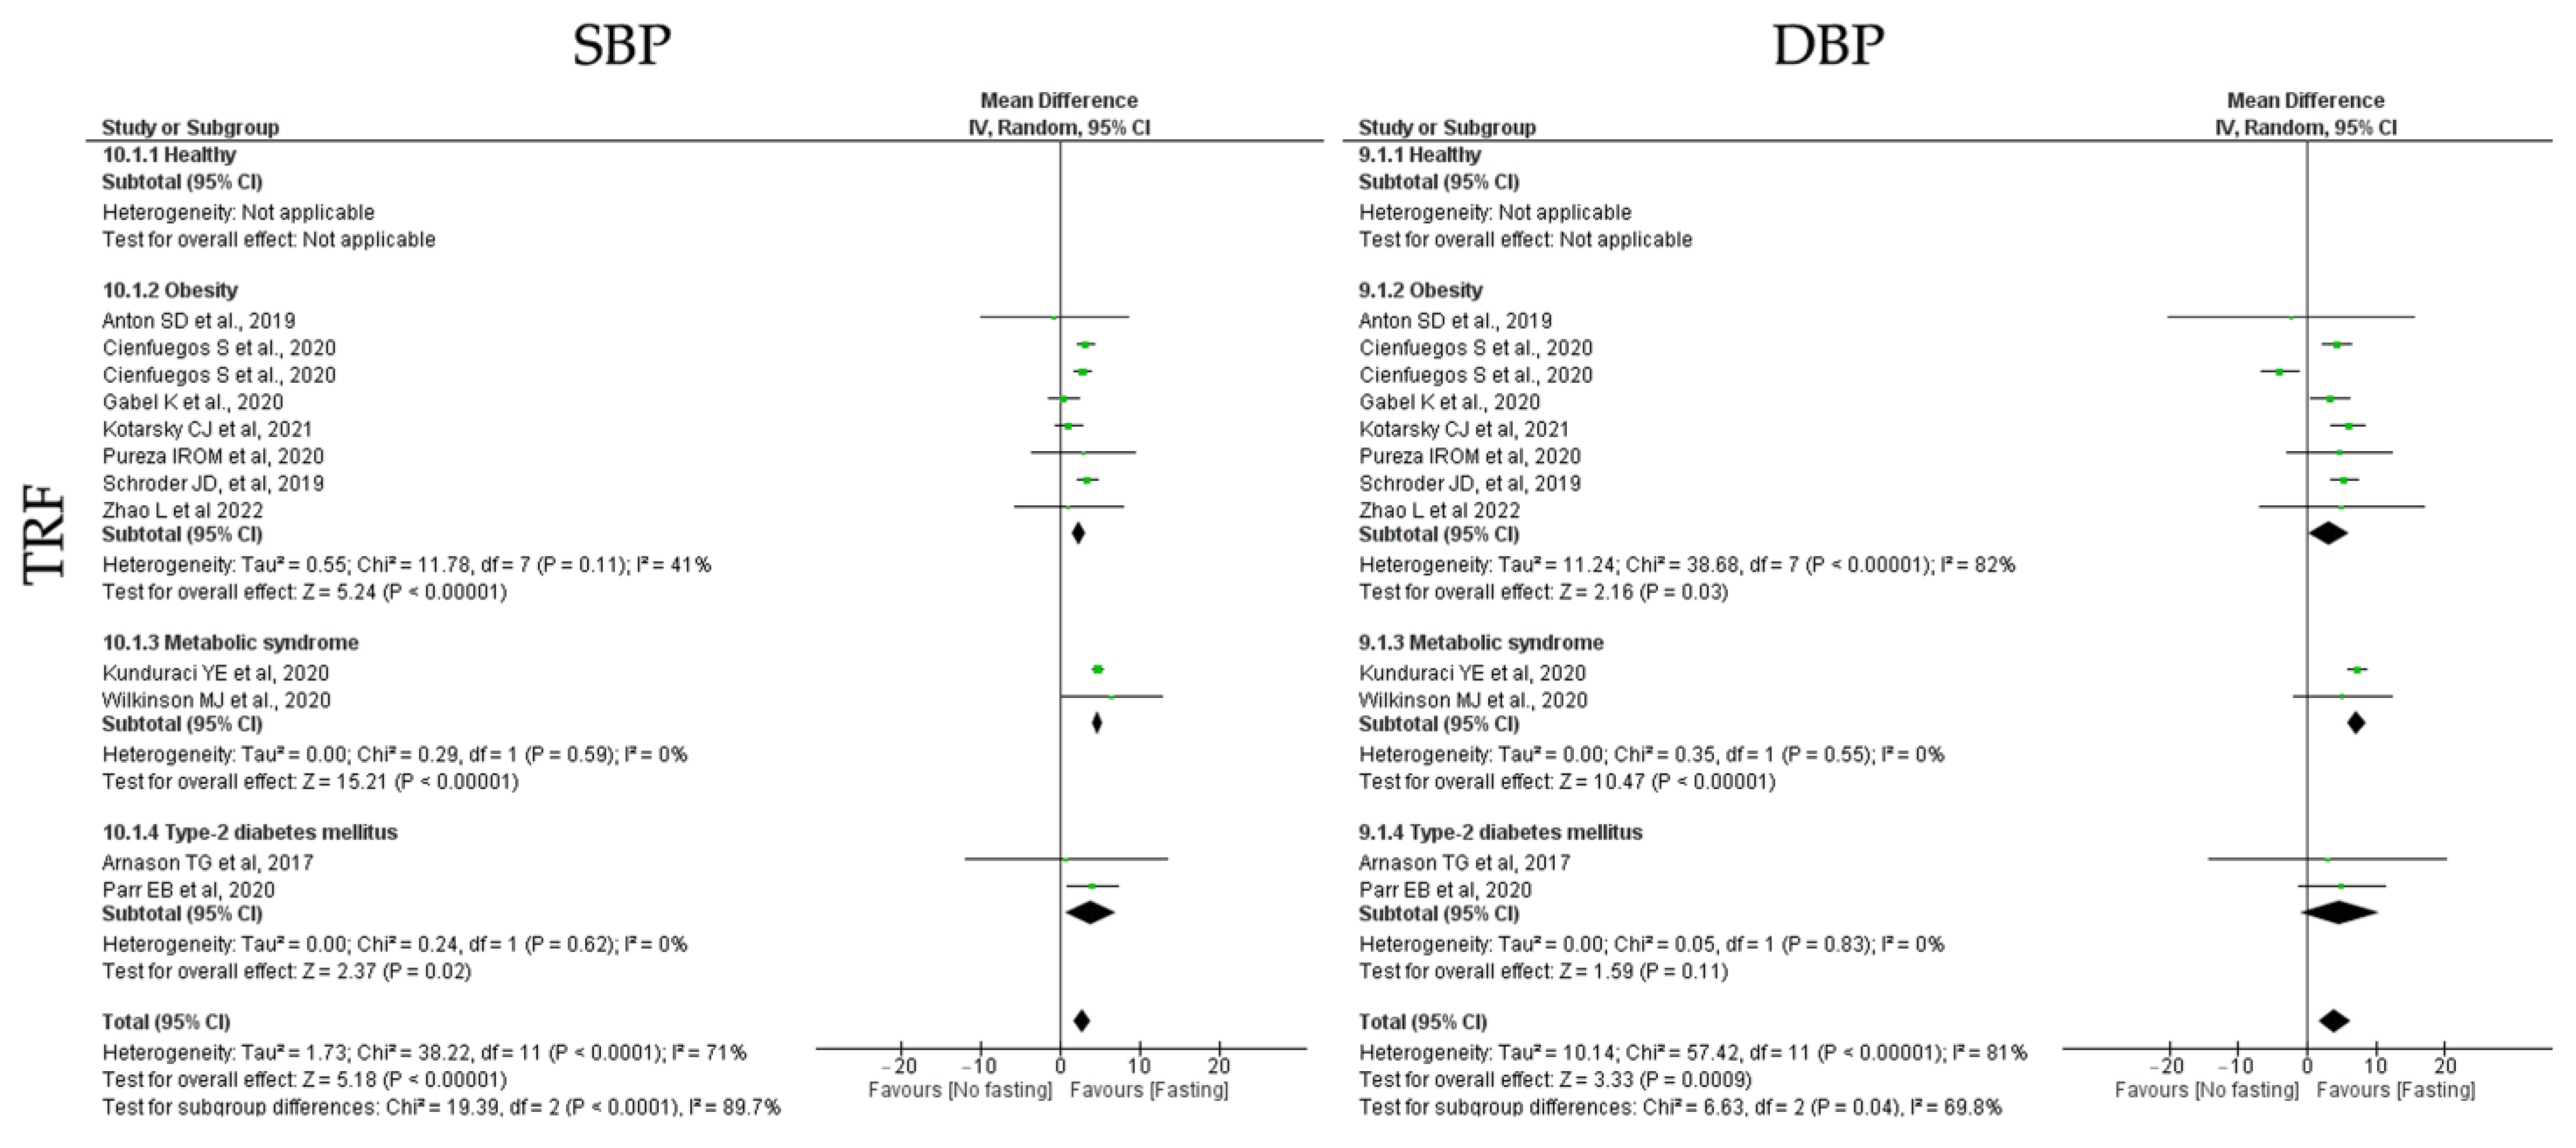
| Blood pressure | SBP (mmHg) | ||||||||
| All studies | 11 | 3.99 | 1.64 | 6.34 | 0.0009 | 57.42 | <0.00001 | 81.00 | |
| Healthy | 0 | - | - | - | - | - | - | - | |
| Obesity | 7 | 3.18 | 0.29 | 6.07 | 0.03 | 38.68 | <0.00001 | 82.00 | |
| T2D | 2 | 4.77 | −1.11 | 10.64 | 0.11 | 0.05 | 0.83 | 0.00 | |
| MetS | 2 | 7.27 | 5.91 | 8.63 | <0.00001 | 0.35 | 0.55 | 0.00 | |
| DBP (mmHg) | |||||||||
| All studies | 11 | 2.86 | 1.78 | 3.94 | <0.00001 | 38.22 | <0.00001 | 71.00 | |
| Healthy | 0 | - | - | - | - | - | - | - | |
| Obesity | 7 | 2.36 | 1.47 | 3.24 | <0.00001 | 11.78 | 0.11 | 41.00 | |
| T2D | 2 | 3.80 | 0.66 | 6.94 | 0.02 | 0.24 | 0.62 | 0.00 | |
| MetS | 2 | 4.77 | 4.15 | 5.38 | <0.00001 | 0.29 | 0.59 | 0.00 | |


| Moderators | k 1 | Point Estimate | CI Lower | CI Upper | p-Value | Heterogeneity | |||
|---|---|---|---|---|---|---|---|---|---|
| Q-Value | p-Value | I-Squared | |||||||
| Adiposity | Weight (kg) | ||||||||
| All studies | 14 | 2.22 | 1.07 | 3.38 | 0.0002 | 8.11 | 0.80 | 0.00 | |
| Healthy | 5 | 2.44 | 0.74 | 4.14 | 0.005 | 3.84 | 0.43 | 0.00 | |
| Obesity | 6 | 3.01 | 0.92 | 5.10 | 0.005 | 1.95 | 0.75 | 0.00 | |
| T2D | 4 | 0.78 | −1.60 | 3.15 | 0.52 | 0.29 | 0.99 | 0.00 | |
| MetS | 0 | - | - | - | - | - | - | ||
| BMI (kg/m2) | |||||||||
| All studies | 19 | 1.01 | 0.81 | 1.21 | <0.00001 | 18.42 | 0.73 | 0.00 | |
| Healthy | 5 | 0.70 | 0.32 | 1.09 | 0.0004 | 2.46 | 0.65 | 0.00 | |
| Obesity | 7 | 0.84 | 0.43 | 1.26 | <0.00001 | 2.57 | 0.86 | 0.00 | |
| T2D | 8 | 1.26 | 0.98 | 1.54 | <0.00001 | 7.23 | 0.70 | 0.00 | |
| MetS | 1 | 0.75 | −0.67 | 2.17 | <0.00001 | - | - | - | |
| Waist circumference (cm) | |||||||||
| All studies | 6 | 1.66 | 0.18 | 3.15 | 0.03 | 2.09 | 0.95 | 0.00 | |
| Healthy | 3 | 1.32 | −1.35 | 3.99 | 0.33 | 1.04 | 0.59 | 0.00 | |
| Obesity | 2 | 1.30 | −2.84 | 5.44 | 0.54 | 0.09 | 0.77 | 0.00 | |
| T2D | 2 | 0.76 | −2.54 | 4.07 | 0.65 | 0.03 | 0.87 | 0.00 | |
| MetS | 1 | 2.61 | 0.12 | 5.10 | 0.04 | - | - | - | |
| Lipid homeostasis | HDL-c (mg/dL) | ||||||||
| All studies | 12 | 0.44 | −1.21 | 2.10 | 0.60 | 83.97 | <0.00001 | 82.00 | |
| Healthy | 5 | −0.91 | −2.90 | 1.08 | 0.37 | 5.52 | 0.24 | 27.00 | |
| Obesity | 2 | 0.67 | −6.61 | 7.96 | 0.86 | 4.97 | 0.03 | 80.00 | |
| T2D | 6 | 1.77 | −0.10 | 3.64 | 0.06 | 29.82 | <0.00001 | 77.00 | |
| MetS | 1 | −5.13 | −7.01 | 3.25 | <0.00001 | - | - | - | |
| LDL-c (mg/dL) | |||||||||
| All studies | 11 | −3.81 | −6.99 | −0.63 | 0.02 | 21.13 | 0.10 | 34.00 | |
| Healthy | 5 | −5.68 | −12.21 | 0.85 | 0.09 | 1.72 | 0.79 | 0.00 | |
| Obesity | 2 | 3.64 | −12.36 | 19.64 | 0.66 | 5.00 | 0.03 | 80.00 | |
| T2D | 6 | −4.55 | −8.75 | −0.35 | 0.03 | 12.12 | 0.10 | 42.00 | |
| MetS | 0 | - | - | - | - | - | - | - | |
| Total cholesterol (mg/dL) | |||||||||
| All studies | 11 | 24.29 | 3.05 | 45.53 | 0.02 | 759.97 | <0.00001 | 98.00 | |
| Healthy | 5 | 26.54 | −34.18 | 87.26 | 0.39 | 351.01 | <0.00001 | 99.00 | |
| Obesity | 3 | 28.36 | −33.99 | 90.70 | 0.37 | 105.91 | <0.00001 | 98.00 | |
| T2D | 5 | 20.58 | −3.03 | 44.19 | 0.09 | 233.06 | <0.00001 | 98.00 | |
| MetS | 0 | - | - | - | |||||
| Triglycerides (mg/dL) | |||||||||
| All studies | 14 | 4.31 | −2.44 | 11.07 | 0.21 | 39.22 | 0.002 | 57.00 | |
| Healthy | 5 | −1.61 | −16.33 | 13.11 | 0.83 | 10.21 | 0.04 | 61.00 | |
| Obesity | 3 | 14.96 | −12.98 | 42.89 | 0.29 | 7.59 | 0.02 | 74.00 | |
| T2D | 7 | 6.06 | −1.24 | 13.35 | 0.10 | 12.88 | 0.12 | 38.00 | |
| MetS | 1 | −3.78 | −33.78 | 26.22 | 0.80 | - | - | - | |
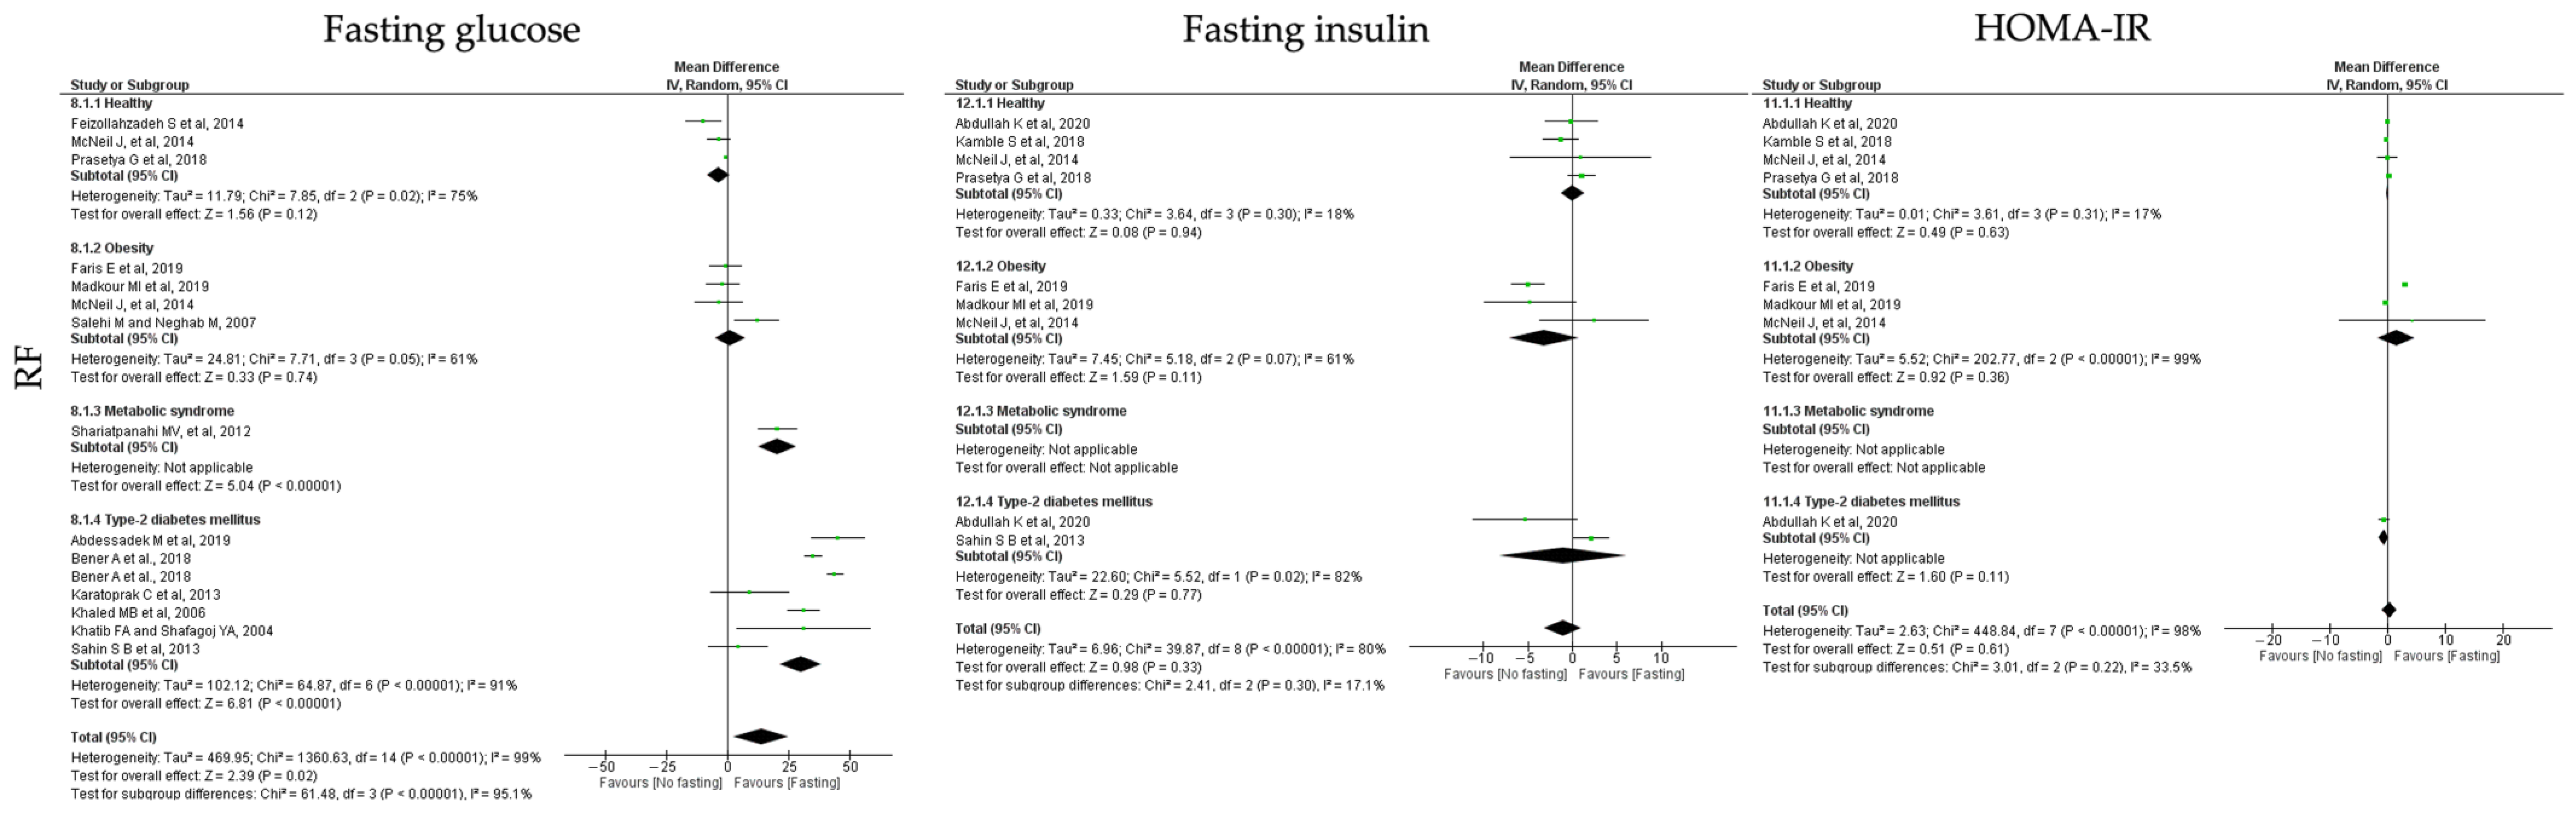
| Insulin homeostasis | Fasting glucose (mg/dL) | ||||||||
| All studies | 13 | 13.75 | 2.47 | 25.02 | 0.02 | 1360.6 | <0.00001 | 99.00 | |
| Healthy | 3 | −3.65 | −8.24 | 0.95 | 0.12 | 7.85 | 0.02 | 75.00 | |
| Obesity | 4 | 1.06 | −5.23 | 7.34 | 0.74 | 7.71 | 0.05 | 61.00 | |
| T2D | 6 | 29.90 | 21.29 | 38.50 | <0.00001 | 64.87 | <0.00001 | 91.00 | |
| MetS | 1 | 20.24 | 12.38 | 28.10 | <0.00001 | - | - | - | |
| Fasting insulin (mU/L) | |||||||||
| All studies | 7 | −1.06 | −3.17 | 1.06 | 0.33 | 39.87 | <0.00001 | 80.00 | |
| Healthy | 4 | 0.05 | −1.24 | 1.34 | 0.94 | 3.64 | 0.30 | 18.00 | |
| Obesity | 3 | −3.20 | −7.14 | 0.74 | 0.11 | 5.18 | 0.07 | 61.00 | |
| T2D | 2 | −1.07 | −8.28 | 6.13 | 0.77 | 5.52 | 0.02 | 82.00 | |
| MetS | 0 | - | - | - | - | - | - | - | |
| HOMA-IR | |||||||||
| All studies | 6 | 0.32 | −0.91 | 1.54 | 0.64 | 448.84 | <0.00001 | 98.00 | |
| Healthy | 4 | −0.05 | −0.26 | 0.16 | 0.63 | 3.61 | 0.31 | 17.00 | |
| Obesity | 3 | 1.49 | −1.68 | 4.67 | 0.36 | 202.77 | <0.00001 | 99.00 | |
| T2D | 1 | −0.68 | −1.51 | 0.15 | 0.11 | - | - | - | |
| MetS | 0 | - | - | - | - | - | - | - | |
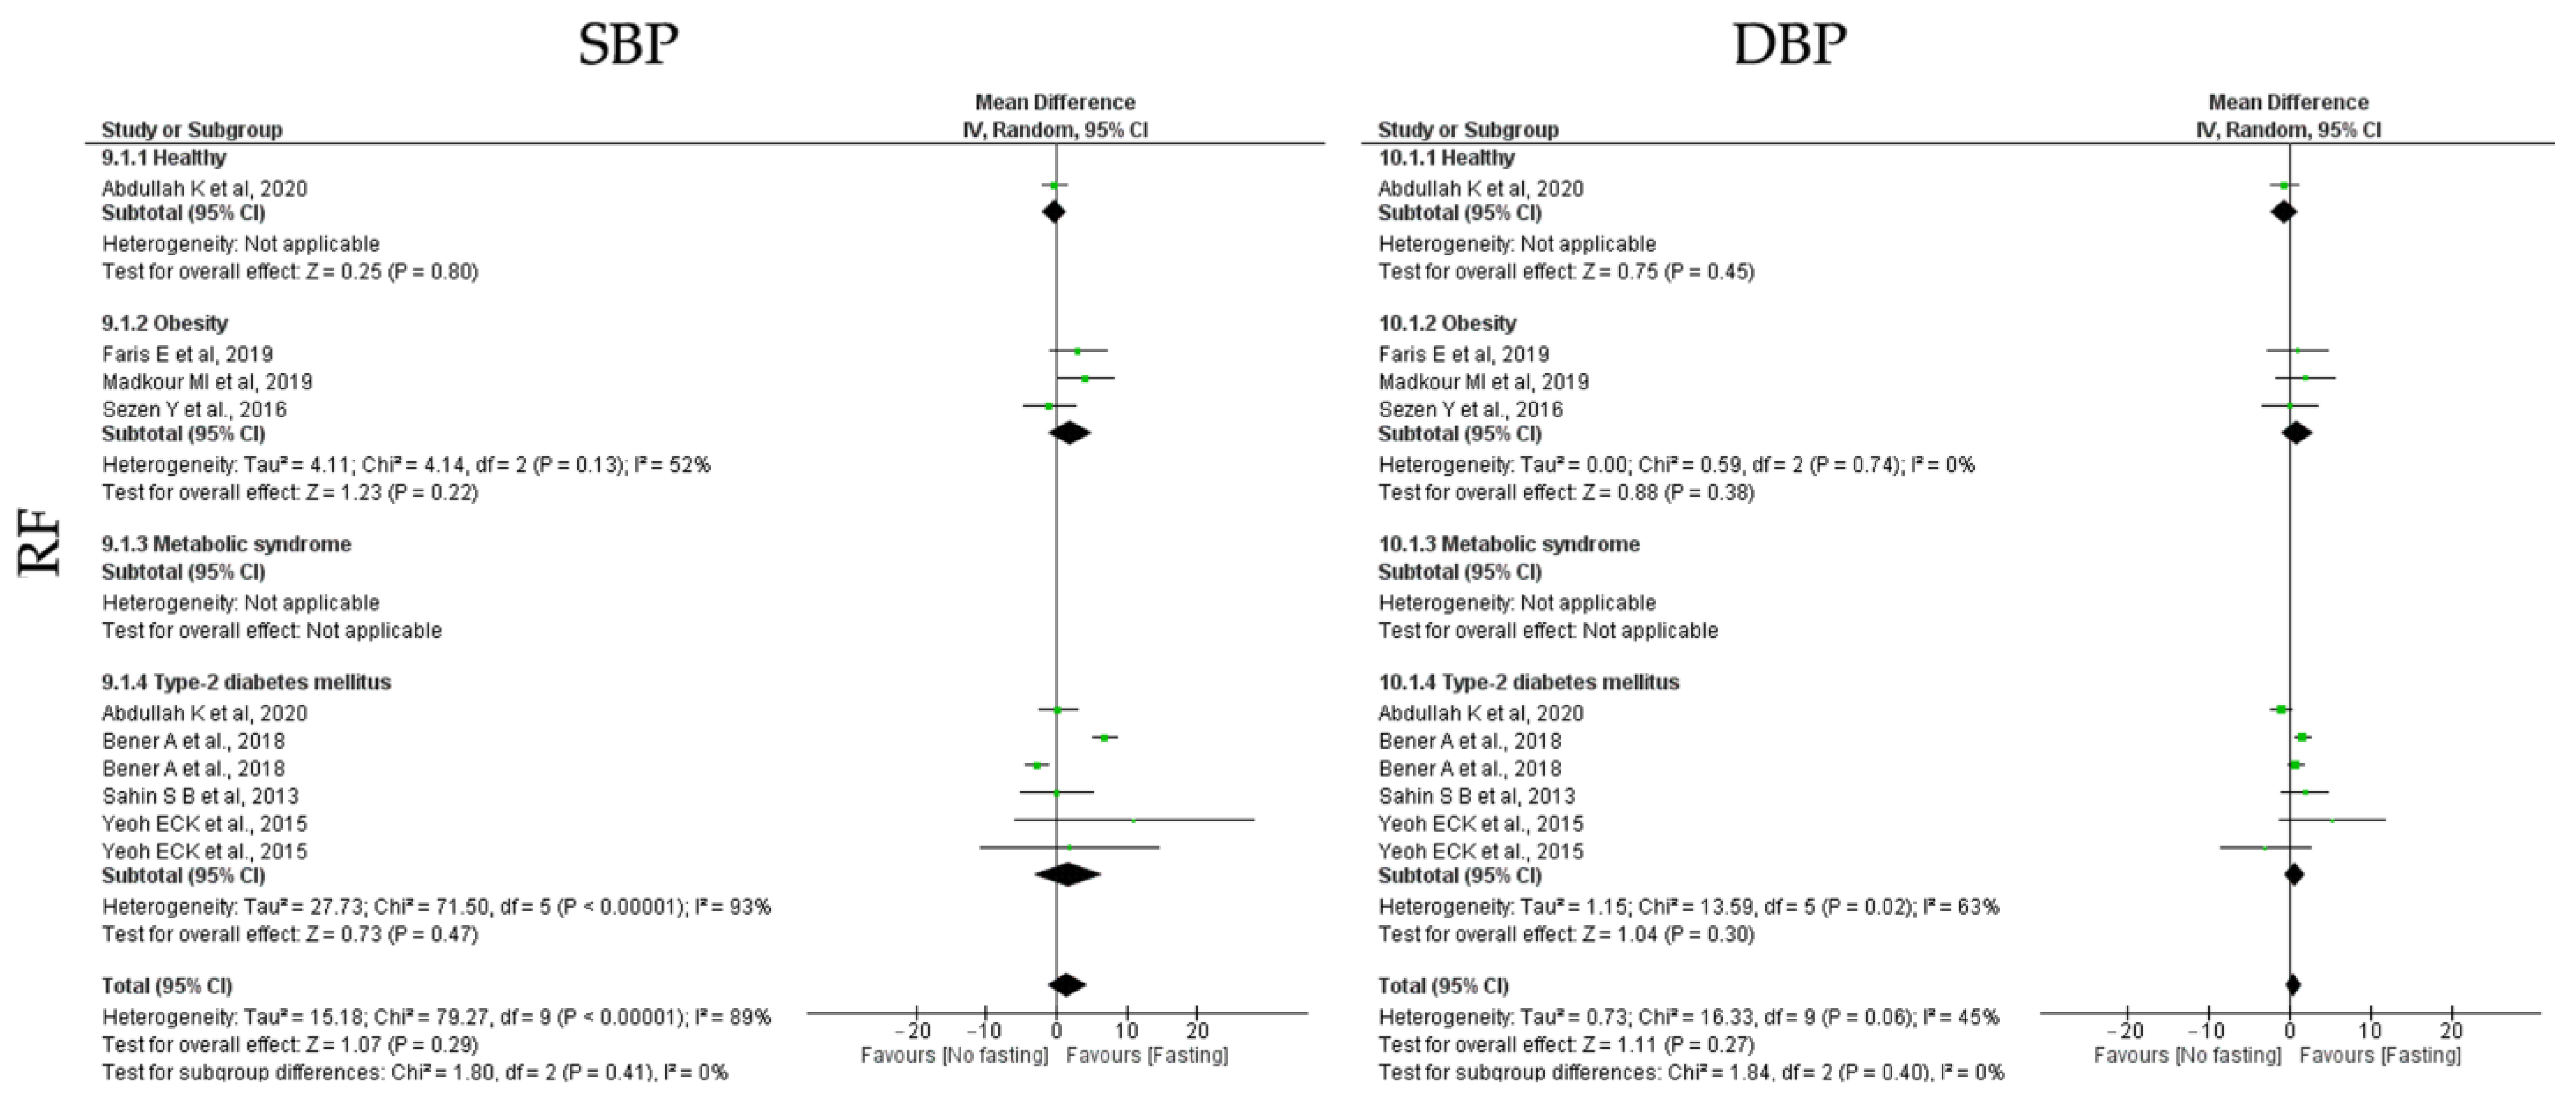
| Blood pressure | SBP (mmHg) | ||||||||
| All studies | 7 | 1.54 | −1.29 | 4.37 | 0.29 | 79.27 | <0.00001 | 89.00 | |
| Healthy | 1 | −0.22 | −1.92 | 1.48 | 0.80 | - | - | - | |
| Obesity | 3 | 2.00 | −1.19 | 5.19 | 0.22 | 4.14 | 0.13 | 52.00 | |
| T2D | 4 | 1.84 | −3.11 | 6.78 | 0.47 | 71.50 | <0.00001 | 93.00 | |
| MetS | 0 | - | - | - | - | - | - | - | |
| DBP (mmHg) | |||||||||
| All studies | 7 | 0.51 | −0.38 | 1.40 | 0.27 | 16.33 | 0.06 | 45.00 | |
| Healthy | 1 | −0.67 | −2.42 | 1.08 | 0.45 | - | - | - | |
| Obesity | 3 | 0.92 | −1.12 | 2.96 | 0.38 | 0.59 | 0.74 | 0.00 | |
| T2D | 4 | 0.65 | −0.58 | 1.88 | 0.30 | 13.59 | 0.02 | 63.00 | |
| MetS | 0 | - | - | - | - | - | - | - | |
3.6.3. Insulin Homeostasis


3.6.4. Blood Pressure


4. Discussion
5. Conclusions
Supplementary Materials
Author Contributions
Funding
Institutional Review Board Statement
Informed Consent Statement
Data Availability Statement
Conflicts of Interest
References
- Rynders, C.A.; Thomas, E.A.; Zaman, A.; Pan, Z.; Catenacci, V.A.; Melanson, E.L. Effectiveness of Intermittent Fasting and Time-Restricted Feeding Compared to Continuous Energy Restriction for Weight Loss. Nutrients 2019, 11, 2442. [Google Scholar] [CrossRef] [PubMed]
- Patterson, R.E.; Sears, D.D. Metabolic Effects of Intermittent Fasting. Annu. Rev. Nutr. 2017, 37, 371–393. [Google Scholar] [CrossRef] [PubMed]
- de Cabo, R.; Mattson, M.P. Effects of Intermittent Fasting on Health, Aging, and Disease. N. Engl. J. Med. 2019, 381, 2541–2551. [Google Scholar] [CrossRef] [PubMed]
- Antoni, R.; Johnston, K.L.; Collins, A.L.; Robertson, M.D. Effects of intermittent fasting on glucose and lipid metabolism. Proc. Nutr. Soc. 2017, 76, 361–368. [Google Scholar] [CrossRef] [PubMed]
- Antoni, R.; Johnston, K.L.; Collins, A.L.; Robertson, M.D. Intermittent v. continuous energy restriction: Differential effects on postprandial glucose and lipid metabolism following matched weight loss in overweight/obese participants. Br. J. Nutr. 2018, 119, 507–516. [Google Scholar] [CrossRef] [PubMed]
- Carter, S.; Clifton, P.M.; Keogh, J.B. The effect of intermittent compared with continuous energy restriction on glycaemic control in patients with type 2 diabetes: 24-month follow-up of a randomised noninferiority trial. Diabetes Res. Clin. Pract. 2019, 151, 11–19. [Google Scholar] [CrossRef] [PubMed]
- Kunduraci, Y.E.; Ozbek, H. Does the Energy Restriction Intermittent Fasting Diet Alleviate Metabolic Syndrome Biomarkers? A Randomized Controlled Trial. Nutrients 2020, 12, 3213. [Google Scholar] [CrossRef]
- Pinto, A.M.; Bordoli, C.; Buckner, L.P.; Kim, C.; Kaplan, P.C.; Del Arenal, I.M.; Jeffcock, E.J.; Hall, W.L. Intermittent energy restriction is comparable to continuous energy restriction for cardiometabolic health in adults with central obesity: A randomized controlled trial; the Met-IER study. Clin. Nutr. 2020, 39, 1753–1763. [Google Scholar] [CrossRef]
- Corley, B.T.; Carroll, R.W.; Hall, R.M.; Weatherall, M.; Parry-Strong, A.; Krebs, J.D. Intermittent fasting in Type 2 diabetes mellitus and the risk of hypoglycaemia: A randomized controlled trial. Diabet. Med. 2018, 35, 588–594. [Google Scholar] [CrossRef]
- Zubrzycki, A.; Cierpka-Kmiec, K.; Kmiec, Z.; Wronska, A. The role of low-calorie diets and intermittent fasting in the treatment of obesity and type-2 diabetes. J. Physiol. Pharmacol. 2018, 69, 663–683. [Google Scholar] [CrossRef]
- Mottillo, S.; Filion, K.B.; Genest, J.; Joseph, L.; Pilote, L.; Poirier, P.; Rinfret, S.; Schiffrin, E.L.; Eisenberg, M.J. The metabolic syndrome and cardiovascular risk a systematic review and meta-analysis. J. Am. Coll. Cardiol. 2010, 56, 1113–1132. [Google Scholar] [CrossRef] [PubMed]
- Page, M.J.; McKenzie, J.E.; Bossuyt, P.M.; Boutron, I.; Hoffmann, T.C.; Mulrow, C.D.; Shamseer, L.; Tetzlaff, J.M.; Akl, E.A.; Brennan, S.E.; et al. The PRISMA 2020 statement: An updated guideline for reporting systematic reviews. BMJ 2021, 372, n71. [Google Scholar] [CrossRef] [PubMed]
- Israel, H.; Richter, R.R. A guide to understanding meta-analysis. J. Orthop. Sport. Phys. Ther. 2011, 41, 496–504. [Google Scholar] [CrossRef] [PubMed]
- Ma, L.L.; Wang, Y.Y.; Yang, Z.H.; Huang, D.; Weng, H.; Zeng, X.T. Methodological quality (risk of bias) assessment tools for primary and secondary medical studies: What are they and which is better? Mil. Med. Res. 2020, 7, 7. [Google Scholar] [CrossRef] [PubMed]
- Aromataris, E.; Munn, Z. JBI Manual for Evidence Synthesis; JBI: Tokyo, Japan, 2020. [Google Scholar]
- Slim, K.; Nini, E.; Forestier, D.; Kwiatkowski, F.; Panis, Y.; Chipponi, J. Methodological index for non-randomized studies (minors): Development and validation of a new instrument. ANZ J. Surg. 2003, 73, 712–716. [Google Scholar] [CrossRef]
- Abdessadek, M.; Khabbal, Y.; Magoul, R.; Marmouzi, I.; Ajdi, F. Follow-up of glycemic index before and after Ramadan fasting in type 2 diabetes patients under antidiabetic medications. Ann. Pharm. Fr. 2019, 77, 374–381. [Google Scholar] [CrossRef]
- Abdullah, K.; Al-Habori, M.; Al-Eryani, E. Ramadan Intermittent Fasting Affects Adipokines and Leptin/Adiponectin Ratio in Type 2 Diabetes Mellitus and Their First-Degree Relatives. BioMed. Res. Int. 2020, 2020, 1281792. [Google Scholar] [CrossRef]
- Anton, S.D.; Lee, S.A.; Donahoo, W.T.; McLaren, C.; Manini, T.; Leeuwenburgh, C.; Pahor, M. The Effects of Time Restricted Feeding on Overweight, Older Adults: A Pilot Study. Nutrients 2019, 11, 1500. [Google Scholar] [CrossRef]
- Arnason, T.G.; Bowen, M.W.; Mansell, K.D. Effects of intermittent fasting on health markers in those with type 2 diabetes: A pilot study. World J. Diabetes 2017, 8, 154–164. [Google Scholar] [CrossRef]
- Bener, A.; Al-Hamaq, A.O.; Ozturk, M.; Catan, F.; Haris, P.I.; Rajput, K.U.; Omer, A. Effect of ramadan fasting on glycemic control and other essential variables in diabetic patients. Ann. Afr. Med. 2018, 17, 196–202. [Google Scholar] [CrossRef]
- Catenacci, V.A.; Pan, Z.; Ostendorf, D.; Brannon, S.; Gozansky, W.S.; Mattson, M.P.; Martin, B.; MacLean, P.S.; Melanson, E.L.; Troy Donahoo, W. A randomized pilot study comparing zero-calorie alternate-day fasting to daily caloric restriction in adults with obesity. Obesity 2016, 24, 1874–1883. [Google Scholar] [CrossRef] [PubMed]
- Cho, A.R.; Moon, J.Y.; Kim, S.; An, K.Y.; Oh, M.; Jeon, J.Y.; Jung, D.H.; Choi, M.H.; Lee, J.W. Effects of alternate day fasting and exercise on cholesterol metabolism in overweight or obese adults: A pilot randomized controlled trial. Metab. Clin. Exp. 2019, 93, 52–60. [Google Scholar] [CrossRef] [PubMed]
- Cienfuegos, S.; Gabel, K.; Kalam, F.; Ezpeleta, M.; Wiseman, E.; Pavlou, V.; Lin, S.; Oliveira, M.L.; Varady, K.A. Effects of 4- and 6-h Time-Restricted Feeding on Weight and Cardiometabolic Health: A Randomized Controlled Trial in Adults with Obesity. Cell Metab. 2020, 32, 366–378. [Google Scholar] [CrossRef]
- Conley, M.; Le Fevre, L.; Haywood, C.; Proietto, J. Is two days of intermittent energy restriction per week a feasible weight loss approach in obese males? A randomised pilot study. Nutr. Diet. J. Dietit. Assoc. Aust. 2018, 75, 65–72. [Google Scholar] [CrossRef]
- de Oliveira Maranhao hr, I.R.; da Silva Junior, A.E.; Silva Praxedes, D.R.; Lessa Vasconcelos, L.G.; de Lima Macena, M.; Vieira de Melo, I.S.; de Menezes Toledo Florencio, T.M.; Bueno, N.B. Effects of time-restricted feeding on body weight, body composition and vital signs in low-income women with obesity: A 12-month randomized clinical trial. Clin. Nutr. 2021, 40, 759–766. [Google Scholar] [CrossRef]
- Faris, M.A.E.; Madkour, M.I.; Obaideen, A.K.; Dalah, E.Z.; Hasan, H.A.; Radwan, H.; Jahrami, H.A.; Hamdy, O.; Mohammad, M.G. Effect of Ramadan diurnal fasting on visceral adiposity and serum adipokines in overweight and obese individuals. Diabetes Res. Clin. Pract. 2019, 153, 166–175. [Google Scholar] [CrossRef]
- Feizollahzadeh, S.; Rasuli, J.; Kheirouri, S.; Alizadeh, M. Augmented plasma adiponectin after prolonged fasting during ramadan in men. Health Promot. Perspect. 2014, 4, 77–81. [Google Scholar] [CrossRef]
- Gabel, K.; Kroeger, C.M.; Trepanowski, J.F.; Hoddy, K.K.; Cienfuegos, S.; Kalam, F.; Varady, K.A. Differential Effects of Alternate-Day Fasting Versus Daily Calorie Restriction on Insulin Resistance. Obesity 2019, 27, 1443–1450. [Google Scholar] [CrossRef]
- Gabel, K.; Marcell, J.; Cares, K.; Kalam, F.; Cienfuegos, S.; Ezpeleta, M.; Varady, K.A. Effect of time restricted feeding on the gut microbiome in adults with obesity: A pilot study. Nutr. Health 2020, 26, 79–85. [Google Scholar] [CrossRef]
- Gnanou, J.V.; Caszo, B.A.; Khalil, K.M.; Abdullah, S.L.; Knight, V.F.; Bidin, M.Z. Effects of Ramadan fasting on glucose homeostasis and adiponectin levels in healthy adult males. J. Diabetes Metab. Disord. 2015, 14, 55. [Google Scholar] [CrossRef]
- Guo, Y.; Luo, S.; Ye, Y.; Yin, S.; Fan, J.; Xia, M. Intermittent Fasting Improves Cardiometabolic Risk Factors and Alters Gut Microbiota in Metabolic Syndrome Patients. J. Clin. Endocrinol. Metab. 2021, 106, 64–79. [Google Scholar] [CrossRef] [PubMed]
- Hoddy, K.K.; Kroeger, C.M.; Trepanowski, J.F.; Barnosky, A.; Bhutani, S.; Varady, K.A. Meal timing during alternate day fasting: Impact on body weight and cardiovascular disease risk in obese adults. Obesity 2014, 22, 2524–2531. [Google Scholar] [CrossRef] [PubMed]
- Hutchison, A.T.; Liu, B.; Wood, R.E.; Vincent, A.D.; Thompson, C.H.; O’Callaghan, N.J.; Wittert, G.A.; Heilbronn, L.K. Effects of Intermittent Versus Continuous Energy Intakes on Insulin Sensitivity and Metabolic Risk in Women with Overweight. Obesity 2019, 27, 50–58. [Google Scholar] [CrossRef]
- Jones, R.; Pabla, P.; Mallinson, J.; Nixon, A.; Taylor, T.; Bennett, A.; Tsintzas, K. Two weeks of early time-restricted feeding (eTRF) improves skeletal muscle insulin and anabolic sensitivity in healthy men. Am. J. Clin. Nutr. 2020, 112, 1015–1028. [Google Scholar] [CrossRef] [PubMed]
- Kamble, S.; Hiremath, S. Insulin resistance and blood lipid levels during fasting. Natl. J. Physiol. Pharm. Pharmacol. 2018, 8, 1158–1161. [Google Scholar] [CrossRef]
- Karatoprak, C.; Yolbas, S.; Cakirca, M.; Cinar, A.; Zorlu, M.; Kiskac, M.; Cikrikcioglu, M.A.; Erkoc, R.; Tasan, E. The effects of long term fasting in Ramadan on glucose regulation in type 2 diabetes mellitus. Eur. Rev. Med. Pharmacol. Sci. 2013, 17, 2512–2516. [Google Scholar]
- Kesztyus, D.; Cermak, P.; Gulich, M.; Kesztyus, T. Adherence to Time-Restricted Feeding and Impact on Abdominal Obesity in Primary Care Patients: Results of a Pilot Study in a Pre-Post Design. Nutrients 2019, 11, 2854. [Google Scholar] [CrossRef]
- Khaled, B.M.; Bendahmane, M.; Belbraouet, S. Ramadan fasting induces modifications of certain serum components in obese women with type 2 diabetes. Saudi Med. J. 2006, 27, 23–26. [Google Scholar]
- Khatib, F.A.; Shafagoj, Y.A. Metabolic alterations as a result of Ramadan fasting in non-insulin-dependent diabetes mellitus patients in relation to food intake. Saudi Med. J. 2004, 25, 1858–1863. [Google Scholar]
- Kotarsky, C.J.; Johnson, N.R.; Mahoney, S.J.; Mitchell, S.L.; Schimek, R.L.; Stastny, S.N.; Hackney, K.J. Time-restricted eating and concurrent exercise training reduces fat mass and increases lean mass in overweight and obese adults. Physiol. Rep. 2021, 9, e14868. [Google Scholar] [CrossRef]
- Kovil, R.; Shaikh, N. Study of Beneficial Impact on Specific Biomarkers in Type 2 Diabetes During Ramadan Fasting (Unintentional Intermittent Fasting). J. Assoc. Physicians India 2020, 68, 26–29. [Google Scholar] [PubMed]
- Li, C.; Sadraie, B.; Steckhan, N.; Kessler, C.; Stange, R.; Jeitler, M.; Michalsen, A. Effects of A One-week Fasting Therapy in Patients with Type-2 Diabetes Mellitus and Metabolic Syndrome—A Randomized Controlled Explorative Study. Exp. Clin. Endocrinol. Diabetes 2017, 125, 618–624. [Google Scholar] [CrossRef]
- Madkour, M.I.; El-Serafi, A.T.; Jahrami, H.A.; Sherif, N.M.; Hassan, R.E.; Awadallah, S.; Faris, M.A.E. Ramadan diurnal intermittent fasting modulates SOD2, TFAM, Nrf2, and sirtuins (SIRT1, SIRT3) gene expressions in subjects with overweight and obesity. Diabetes Res. Clin. Pract. 2019, 155, 107801. [Google Scholar] [CrossRef] [PubMed]
- McNeil, J.; Mamlouk, M.M.; Duval, K.; Schwartz, A.; Nardo Junior, N.; Doucet, E. Alterations in metabolic profile occur in normal-weight and obese men during the Ramadan fast despite no changes in anthropometry. J. Obes. 2014, 2014, 482547. [Google Scholar] [CrossRef] [PubMed]
- Parr, E.B.; Devlin, B.L.; Lim, K.H.C.; Moresi, L.N.Z.; Geils, C.; Brennan, L.; Hawley, J.A. Time-Restricted Eating as a Nutrition Strategy for Individuals with Type 2 Diabetes: A Feasibility Study. Nutrients 2020, 12, 3228. [Google Scholar] [CrossRef] [PubMed]
- Parvaresh, A.; Razavi, R.; Abbasi, B.; Yaghoobloo, K.; Hassanzadeh, A.; Mohammadifard, N.; Safavi, S.M.; Hadi, A.; Clark, C.C.T. Modified alternate-day fasting vs. calorie restriction in the treatment of patients with metabolic syndrome: A randomized clinical trial. Complement. Ther. Med. 2019, 47, 102187. [Google Scholar] [CrossRef] [PubMed]
- Prasetya, G.; Sapwarobol, S. Intermittent Fasting During Ramadan Improves Insulin Sensitivity and Anthropometric Parameters in Healthy Young Muslim Men. Am. J. Lifestyle Med. 2021, 15, 200–206. [Google Scholar] [CrossRef] [PubMed]
- Sahin, S.B.; Ayaz, T.; Ozyurt, N.; Ilkkilic, K.; Kirvar, A.; Sezgin, H. The impact of fasting during Ramadan on the glycemic control of patients with type 2 diabetes mellitus. Exp. Clin. Endocrinol. Diabetes 2013, 121, 531–534. [Google Scholar] [CrossRef]
- Salehi, M.; Neghab, M. Effects of fasting and a medium calorie balanced diet during the holy month Ramadan on weight, BMI and some blood parameters of overweight males. Pak. J. Biol. Sci. 2007, 10, 968–971. [Google Scholar] [CrossRef]
- Schroder, J.D.; Falqueto, H.; Manica, A.; Zanini, D.; de Oliveira, T.; de Sa, C.A.; Cardoso, A.M.; Manfredi, L.H. Effects of time-restricted feeding in weight loss, metabolic syndrome and cardiovascular risk in obese women. J. Transl. Med. 2021, 19, 3. [Google Scholar] [CrossRef]
- Sezen, Y.; Altiparmak, I.H.; Erkus, M.E.; Kocarslan, A.; Kaya, Z.; Gunebakmaz, O.; Demirbag, R. Effects of Ramadan fasting on body composition and arterial stiffness. J. Pak. Med. Assoc. 2016, 66, 1522–1527. [Google Scholar] [PubMed]
- Shariatpanahi, M.V.; Shariatpanahi, Z.V.; Shahbazi, S.; Moshtaqi, M. Effect of fasting with two meals on BMI and inflammatory markers of metabolic syndrome. Pak. J. Biol. Sci. 2012, 15, 255–258. [Google Scholar] [CrossRef] [PubMed]
- Sundfor, T.M.; Svendsen, M.; Tonstad, S. Effect of intermittent versus continuous energy restriction on weight loss, maintenance and cardiometabolic risk: A randomized 1-year trial. Nutr. Metab. Cardiovasc. Dis. 2018, 28, 698–706. [Google Scholar] [CrossRef] [PubMed]
- Varady, K.A.; Bhutani, S.; Church, E.C.; Klempel, M.C. Short-term modified alternate-day fasting: A novel dietary strategy for weight loss and cardioprotection in obese adults. Am. J. Clin. Nutr. 2009, 90, 1138–1143. [Google Scholar] [CrossRef]
- Wilkinson, M.J.; Manoogian, E.N.C.; Zadourian, A.; Lo, H.; Fakhouri, S.; Shoghi, A.; Wang, X.; Fleischer, J.G.; Navlakha, S.; Panda, S.; et al. Ten-Hour Time-Restricted Eating Reduces Weight, Blood Pressure, and Atherogenic Lipids in Patients with Metabolic Syndrome. Cell Metab. 2020, 31, 92–104.e105. [Google Scholar] [CrossRef]
- Yeoh, E.C.; Zainudin, S.B.; Loh, W.N.; Chua, C.L.; Fun, S.; Subramaniam, T.; Sum, C.F.; Lim, S.C. Fasting during Ramadan and Associated Changes in Glycaemia, Caloric Intake and Body Composition with Gender Differences in Singapore. Ann. Acad. Med. Singap. 2015, 44, 202–206. [Google Scholar] [CrossRef]
- Zhao, L.; Hutchison, A.T.; Liu, B.; Yates, C.L.; Teong, X.T.; Wittert, G.A.; Thompson, C.H.; Nguyen, L.; Au, J.; Manoogian, E.N.C.; et al. Time-restricted eating improves glycemic control and dampens energy-consuming pathways in human adipose tissue. Nutrition 2022, 96, 111583. [Google Scholar] [CrossRef]
- Zouhal, H.; Bagheri, R.; Ashtary-Larky, D.; Wong, A.; Triki, R.; Hackney, A.C.; Laher, I.; Abderrahman, A.B. Effects of Ramadan intermittent fasting on inflammatory and biochemical biomarkers in males with obesity. Physiol. Behav. 2020, 225, 113090. [Google Scholar] [CrossRef]
- Zouhal, H.; Bagheri, R.; Triki, R.; Saeidi, A.; Wong, A.; Hackney, A.C.; Laher, I.; Suzuki, K.; Ben Abderrahman, A. Effects of Ramadan Intermittent Fasting on Gut Hormones and Body Composition in Males with Obesity. Int. J. Environ. Res. Public Health 2020, 17, 5600. [Google Scholar] [CrossRef]
- Trepanowski, J.F.; Kroeger, C.M.; Barnosky, A.; Klempel, M.; Bhutani, S.; Hoddy, K.K.; Rood, J.; Ravussin, E.; Varady, K.A. Effects of alternate-day fasting or daily calorie restriction on body composition, fat distribution, and circulating adipokines: Secondary analysis of a randomized controlled trial. Clin. Nutr. 2018, 37, 1871–1878. [Google Scholar] [CrossRef]
- Carter, S.; Clifton, P.M.; Keogh, J.B. The effects of intermittent compared to continuous energy restriction on glycaemic control in type 2 diabetes; a pragmatic pilot trial. Diabetes Res. Clin. Pract. 2016, 122, 106–112. [Google Scholar] [CrossRef] [PubMed]
- Furmli, S.; Elmasry, R.; Ramos, M.; Fung, J. Therapeutic use of intermittent fasting for people with type 2 diabetes as an alternative to insulin. BMJ Case Rep. 2018, 2018, bcr-2017. [Google Scholar] [CrossRef] [PubMed]
- Sutton, E.F.; Beyl, R.; Early, K.S.; Cefalu, W.T.; Ravussin, E.; Peterson, C.M. Early Time-Restricted Feeding Improves Insulin Sensitivity, Blood Pressure, and Oxidative Stress Even without Weight Loss in Men with Prediabetes. Cell Metab. 2018, 27, 1212–1221.e1213. [Google Scholar] [CrossRef] [PubMed]
- Shafras, M.S.; Monaragala, L.M.; Samarakkody, I.S.; Ahamed, R.A.; Nawarathna, L.N.; Sanas, M.S.; Antonypillai, C.A. Comparison of glycaemic control and anthropometric parameters before and after Ramadan fasting in a selected cohort of patients with type 2 diabetes mellitus in Sri Lanka. Ceylon Med. J. 2020, 65, 79–85. [Google Scholar] [CrossRef]
- Hassanein, M.; Abdelgadir, E.; Obaid, H.A.; Ahmed, F.S.; Alsharhan, M.; Thabit, S.; Haidar, M.; Elsayed, M.; Alawadi, F. Biometric and metabolic changes in patients with diabetes prior, during and after the holy month of Ramadan (ABCD Study). Diabetes Res. Clin. Pract. 2021, 173, 108678. [Google Scholar] [CrossRef] [PubMed]
- Harbuwono, D.S.; Kurniawan, F.; Sudarsono, N.C.; Tahapary, D.L. The impact of Ramadan fasting on glucose variability in type 2 diabetes mellitus patients on oral anti diabetic agents. PLoS ONE 2020, 15, e0234443. [Google Scholar] [CrossRef] [PubMed]
- Kalam, F.; Kroeger, C.M.; Trepanowski, J.F.; Gabel, K.; Song, J.H.; Cienfuegos, S.; Varady, K.A. Beverage intake during alternate-day fasting: Relationship to energy intake and body weight. Nutr. Health 2019, 25, 167–171. [Google Scholar] [CrossRef] [PubMed]
- Trepanowski, J.F.; Kroeger, C.M.; Barnosky, A.; Klempel, M.C.; Bhutani, S.; Hoddy, K.K.; Gabel, K.; Freels, S.; Rigdon, J.; Rood, J.; et al. Effect of Alternate-Day Fasting on Weight Loss, Weight Maintenance, and Cardioprotection Among Metabolically Healthy Obese Adults: A Randomized Clinical Trial. JAMA Intern. Med. 2017, 177, 930–938. [Google Scholar] [CrossRef]
- Li, C.; Ostermann, T.; Hardt, M.; Ludtke, R.; Broecker-Preuss, M.; Dobos, G.; Michalsen, A. Metabolic and psychological response to 7-day fasting in obese patients with and without metabolic syndrome. Forsch Komplementmed 2013, 20, 413–420. [Google Scholar] [CrossRef]
- Vidmar, A.P.; Naguib, M.; Raymond, J.K.; Salvy, S.J.; Hegedus, E.; Wee, C.P.; Goran, M.I. Time-Limited Eating and Continuous Glucose Monitoring in Adolescents with Obesity: A Pilot Study. Nutrients 2021, 13, 3697. [Google Scholar] [CrossRef]
- Lowe, D.A.; Wu, N.; Rohdin-Bibby, L.; Moore, A.H.; Kelly, N.; Liu, Y.E.; Philip, E.; Vittinghoff, E.; Heymsfield, S.B.; Olgin, J.E.; et al. Effects of Time-Restricted Eating on Weight Loss and Other Metabolic Parameters in Women and Men With Overweight and Obesity: The TREAT Randomized Clinical Trial. JAMA Intern. Med. 2020, 180, 1491–1499. [Google Scholar] [CrossRef] [PubMed]
- Aksungar, F.B.; Sarikaya, M.; Coskun, A.; Serteser, M.; Unsal, I. Comparison of Intermittent Fasting Versus Caloric Restriction in Obese Subjects: A Two Year Follow-Up. J. Nutr. Health Aging 2017, 21, 681–685. [Google Scholar] [CrossRef] [PubMed]
- Kessler, C.S.; Stange, R.; Schlenkermann, M.; Jeitler, M.; Michalsen, A.; Selle, A.; Raucci, F.; Steckhan, N. A nonrandomized controlled clinical pilot trial on 8 wk of intermittent fasting (24 h/wk). Nutrition 2018, 46, 143–152.e142. [Google Scholar] [CrossRef] [PubMed]
- Mindikoglu, A.L.; Abdulsada, M.M.; Jain, A.; Choi, J.M.; Jalal, P.K.; Devaraj, S.; Mezzari, M.P.; Petrosino, J.F.; Opekun, A.R.; Jung, S.Y. Intermittent fasting from dawn to sunset for 30 consecutive days is associated with anticancer proteomic signature and upregulates key regulatory proteins of glucose and lipid metabolism, circadian clock, DNA repair, cytoskeleton remodeling, immune system and cognitive function in healthy subjects. J. Proteom. 2020, 217, 103645. [Google Scholar] [CrossRef]
- Johnstone, A.M.; Faber, P.; Gibney, E.R.; Elia, M.; Horgan, G.; Golden, B.E.; Stubbs, R.J. Effect of an acute fast on energy compensation and feeding behaviour in lean men and women. Int. J. Obes. Relat. Metab. Disord. J. Int. Assoc. Study Obes. 2002, 26, 1623–1628. [Google Scholar] [CrossRef]
- Klempel, M.C.; Bhutani, S.; Fitzgibbon, M.; Freels, S.; Varady, K.A. Dietary and physical activity adaptations to alternate day modified fasting: Implications for optimal weight loss. Nutr. J. 2010, 9, 35. [Google Scholar] [CrossRef]
- Klempel, M.C.; Kroeger, C.M.; Varady, K.A. Alternate day fasting (ADF) with a high-fat diet produces similar weight loss and cardio-protection as ADF with a low-fat diet. Metab. Clin. Exp. 2013, 62, 137–143. [Google Scholar] [CrossRef]
- Hoddy, K.K.; Gibbons, C.; Kroeger, C.M.; Trepanowski, J.F.; Barnosky, A.; Bhutani, S.; Gabel, K.; Finlayson, G.; Varady, K.A. Changes in hunger and fullness in relation to gut peptides before and after 8 weeks of alternate day fasting. Clin. Nutr. 2016, 35, 1380–1385. [Google Scholar] [CrossRef]
- Horne, B.D.; Muhlestein, J.B.; Anderson, J.L. Health effects of intermittent fasting: Hormesis or harm? A systematic review. Am. J. Clin. Nutr. 2015, 102, 464–470. [Google Scholar] [CrossRef]
- Johnson, J.B.; Summer, W.; Cutler, R.G.; Martin, B.; Hyun, D.H.; Dixit, V.D.; Pearson, M.; Nassar, M.; Telljohann, R.; Maudsley, S.; et al. Alternate day calorie restriction improves clinical findings and reduces markers of oxidative stress and inflammation in overweight adults with moderate asthma. Free Radic. Biol. Med. 2007, 42, 665–674. [Google Scholar] [CrossRef]
- Bhutani, S.; Klempel, M.C.; Kroeger, C.M.; Aggour, E.; Calvo, Y.; Trepanowski, J.F.; Hoddy, K.K.; Varady, K.A. Effect of exercising while fasting on eating behaviors and food intake. J. Int. Soc. Sport. Nutr. 2013, 10, 50. [Google Scholar] [CrossRef] [PubMed]
- Longo, V.D.; Mattson, M.P. Fasting: Molecular mechanisms and clinical applications. Cell Metab. 2014, 19, 181–192. [Google Scholar] [CrossRef]
- Patterson, R.E.; Laughlin, G.A.; LaCroix, A.Z.; Hartman, S.J.; Natarajan, L.; Senger, C.M.; Martinez, M.E.; Villasenor, A.; Sears, D.D.; Marinac, C.R.; et al. Intermittent Fasting and Human Metabolic Health. J. Acad. Nutr. Diet. 2015, 115, 1203–1212. [Google Scholar] [CrossRef] [PubMed]
- Cienfuegos, S.; McStay, M.; Gabel, K.; Varady, K.A. Time restricted eating for the prevention of type 2 diabetes. J. Physiol. 2022, 600, 1253–1264. [Google Scholar] [CrossRef] [PubMed]
- Kang, J.; Ratamess, N.A.; Faigenbaum, A.D.; Bush, J.A.; Beller, N.; Vargas, A.; Fardman, B.; Andriopoulos, T. Effect of Time-Restricted Feeding on Anthropometric, Metabolic, and Fitness Parameters: A Systematic Review. J. Am. Nutr. Assoc. 2022, 41, 810–825. [Google Scholar] [CrossRef] [PubMed]
- Tinsley, G.M.; La Bounty, P.M. Effects of intermittent fasting on body composition and clinical health markers in humans. Nutr. Rev. 2015, 73, 661–674. [Google Scholar] [CrossRef]
- Mandal, S.; Simmons, N.; Awan, S.; Chamari, K.; Ahmed, I. Intermittent fasting: Eating by the clock for health and exercise performance. BMJ Open Sport Exerc. Med. 2022, 8, e001206. [Google Scholar] [CrossRef] [PubMed]
- Soliman, G.A. Intermittent fasting and time-restricted eating role in dietary interventions and precision nutrition. Front. Public Health 2022, 10, 1017254. [Google Scholar] [CrossRef]
- Vasim, I.; Majeed, C.N.; DeBoer, M.D. Intermittent Fasting and Metabolic Health. Nutrients 2022, 14, 631. [Google Scholar] [CrossRef]
- Santos, H.O.; Macedo, R.C.O. Impact of intermittent fasting on the lipid profile: Assessment associated with diet and weight loss. Clin. Nutr. ESPEN 2018, 24, 14–21. [Google Scholar] [CrossRef]
- Albosta, M.; Bakke, J. Intermittent fasting: Is there a role in the treatment of diabetes? A review of the literature and guide for primary care physicians. Clin. Diabetes Endocrinol. 2021, 7, 3. [Google Scholar] [CrossRef] [PubMed]
- Halberg, N.; Henriksen, M.; Soderhamn, N.; Stallknecht, B.; Ploug, T.; Schjerling, P.; Dela, F. Effect of intermittent fasting and refeeding on insulin action in healthy men. J. Appl. Physiol. 2005, 99, 2128–2136. [Google Scholar] [CrossRef] [PubMed]
- Ingersen, A.; Helset, H.R.; Calov, M.; Chabanova, E.; Harreskov, E.G.; Jensen, C.; Hansen, C.N.; Prats, C.; Helge, J.W.; Larsen, S.; et al. Metabolic effects of alternate-day fasting in males with obesity with or without type 2 diabetes. Front. Physiol. 2022, 13, 1061063. [Google Scholar] [CrossRef]
- Harvie, M.; Howell, A. Potential Benefits and Harms of Intermittent Energy Restriction and Intermittent Fasting Amongst Obese, Overweight and Normal Weight Subjects-A Narrative Review of Human and Animal Evidence. Behav. Sci. 2017, 7, 4. [Google Scholar] [CrossRef] [PubMed]
- Cheng, C.W.; Villani, V.; Buono, R.; Wei, M.; Kumar, S.; Yilmaz, O.H.; Cohen, P.; Sneddon, J.B.; Perin, L.; Longo, V.D. Fasting-Mimicking Diet Promotes Ngn3-Driven beta-Cell Regeneration to Reverse Diabetes. Cell 2017, 168, 775–788.e712. [Google Scholar] [CrossRef] [PubMed]
- Longo, R.; Peri, C.; Cricri, D.; Coppi, L.; Caruso, D.; Mitro, N.; De Fabiani, E.; Crestani, M. Ketogenic Diet: A New Light Shining on Old but Gold Biochemistry. Nutrients 2019, 11, 2497. [Google Scholar] [CrossRef]
- Wang, W.; Wei, R.; Pan, Q.; Guo, L. Beneficial effect of time-restricted eating on blood pressure: A systematic meta-analysis and meta-regression analysis. Nutr. Metab. 2022, 19, 77. [Google Scholar] [CrossRef]
- Wang, Y.; Wu, R. The Effect of Fasting on Human Metabolism and Psychological Health. Dis. Mrk. 2022, 2022, 5653739. [Google Scholar] [CrossRef]
- Mattson, M.P.; Allison, D.B.; Fontana, L.; Harvie, M.; Longo, V.D.; Malaisse, W.J.; Mosley, M.; Notterpek, L.; Ravussin, E.; Scheer, F.A.; et al. Meal frequency and timing in health and disease. Proc. Natl. Acad. Sci. USA 2014, 111, 16647–16653. [Google Scholar] [CrossRef]
- Mattson, M.P.; Longo, V.D.; Harvie, M. Impact of intermittent fasting on health and disease processes. Ageing Res. Rev. 2017, 39, 46–58. [Google Scholar] [CrossRef]
- Anton, S.D.; Moehl, K.; Donahoo, W.T.; Marosi, K.; Lee, S.A.; Mainous, A.G., 3rd; Leeuwenburgh, C.; Mattson, M.P. Flipping the Metabolic Switch: Understanding and Applying the Health Benefits of Fasting. Obesity 2018, 26, 254–268. [Google Scholar] [CrossRef] [PubMed]
- Mattson, M.P.; Arumugam, T.V. Hallmarks of Brain Aging: Adaptive and Pathological Modification by Metabolic States. Cell Metab. 2018, 27, 1176–1199. [Google Scholar] [CrossRef]
- Puchalska, P.; Crawford, P.A. Multi-dimensional Roles of Ketone Bodies in Fuel Metabolism, Signaling, and Therapeutics. Cell Metab. 2017, 25, 262–284. [Google Scholar] [CrossRef] [PubMed]
- Mattson, M.P.; Moehl, K.; Ghena, N.; Schmaedick, M.; Cheng, A. Intermittent metabolic switching, neuroplasticity and brain health. Nat. Rev. Neurosci. 2018, 19, 63–80. [Google Scholar] [CrossRef] [PubMed]
- Mattson, M.P.; Wan, R. Beneficial effects of intermittent fasting and caloric restriction on the cardiovascular and cerebrovascular systems. J. Nutr. Biochem. 2005, 16, 129–137. [Google Scholar] [CrossRef] [PubMed]
| Regime | Weight | BMI | Waist Circumference | Glucose | Total Cholesterol |
|---|---|---|---|---|---|
| ADF | 94.34 ± 10.39 | 33.60 ± 2.83 | 107.43 ± 9.79 | 105.76 ± 25.79 | 183.54 ± 14.02 |
| TRF | 92.12 ± 7.19 | 36.09 ± 16.44 | 105.91 ± 5.09 | 108.04 ± 24.73 | 206.98 ± 20.77 |
| RF | 83.09 ± 13.15 | 30.16 ± 11.81 | 98.29 ± 11.01 | 156.40 ± 38.90 | 188.78 ± 24.80 |
Disclaimer/Publisher’s Note: The statements, opinions and data contained in all publications are solely those of the individual author(s) and contributor(s) and not of MDPI and/or the editor(s). MDPI and/or the editor(s) disclaim responsibility for any injury to people or property resulting from any ideas, methods, instructions or products referred to in the content. |
© 2023 by the authors. Licensee MDPI, Basel, Switzerland. This article is an open access article distributed under the terms and conditions of the Creative Commons Attribution (CC BY) license (https://creativecommons.org/licenses/by/4.0/).
Share and Cite
Silva, A.I.; Direito, M.; Pinto-Ribeiro, F.; Ludovico, P.; Sampaio-Marques, B. Effects of Intermittent Fasting on Regulation of Metabolic Homeostasis: A Systematic Review and Meta-Analysis in Health and Metabolic-Related Disorders. J. Clin. Med. 2023, 12, 3699. https://doi.org/10.3390/jcm12113699
Silva AI, Direito M, Pinto-Ribeiro F, Ludovico P, Sampaio-Marques B. Effects of Intermittent Fasting on Regulation of Metabolic Homeostasis: A Systematic Review and Meta-Analysis in Health and Metabolic-Related Disorders. Journal of Clinical Medicine. 2023; 12(11):3699. https://doi.org/10.3390/jcm12113699
Chicago/Turabian StyleSilva, Ana Inês, Manuel Direito, Filipa Pinto-Ribeiro, Paula Ludovico, and Belém Sampaio-Marques. 2023. "Effects of Intermittent Fasting on Regulation of Metabolic Homeostasis: A Systematic Review and Meta-Analysis in Health and Metabolic-Related Disorders" Journal of Clinical Medicine 12, no. 11: 3699. https://doi.org/10.3390/jcm12113699
APA StyleSilva, A. I., Direito, M., Pinto-Ribeiro, F., Ludovico, P., & Sampaio-Marques, B. (2023). Effects of Intermittent Fasting on Regulation of Metabolic Homeostasis: A Systematic Review and Meta-Analysis in Health and Metabolic-Related Disorders. Journal of Clinical Medicine, 12(11), 3699. https://doi.org/10.3390/jcm12113699