
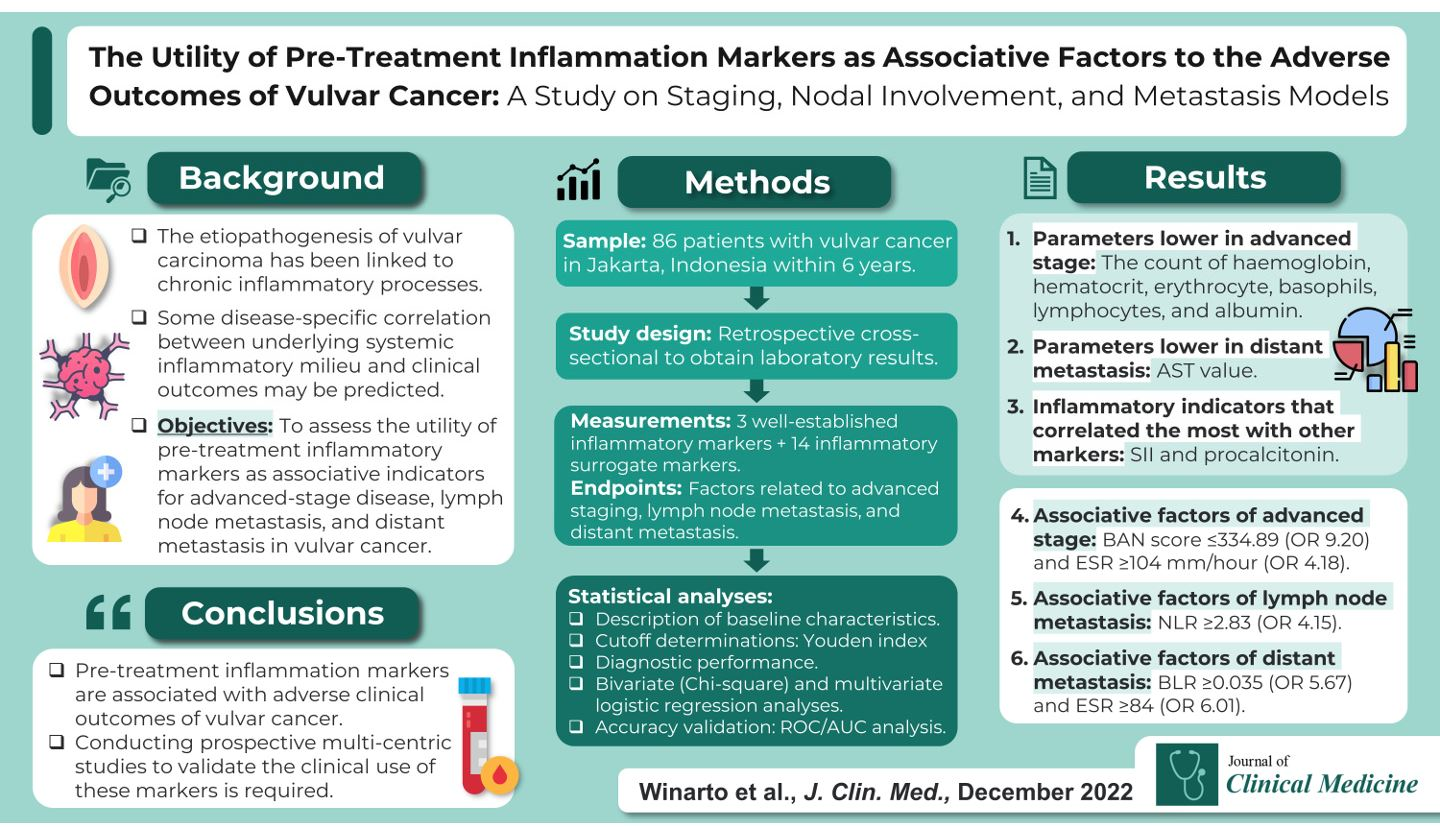
The Utility of Pre-Treatment Inflammation Markers as Associative Factors to the Adverse Outcomes of Vulvar Cancer: A Study on Staging, Nodal Involvement, and Metastasis Models

 ,
,  ,
,  , , and
Abstract

1. Introduction
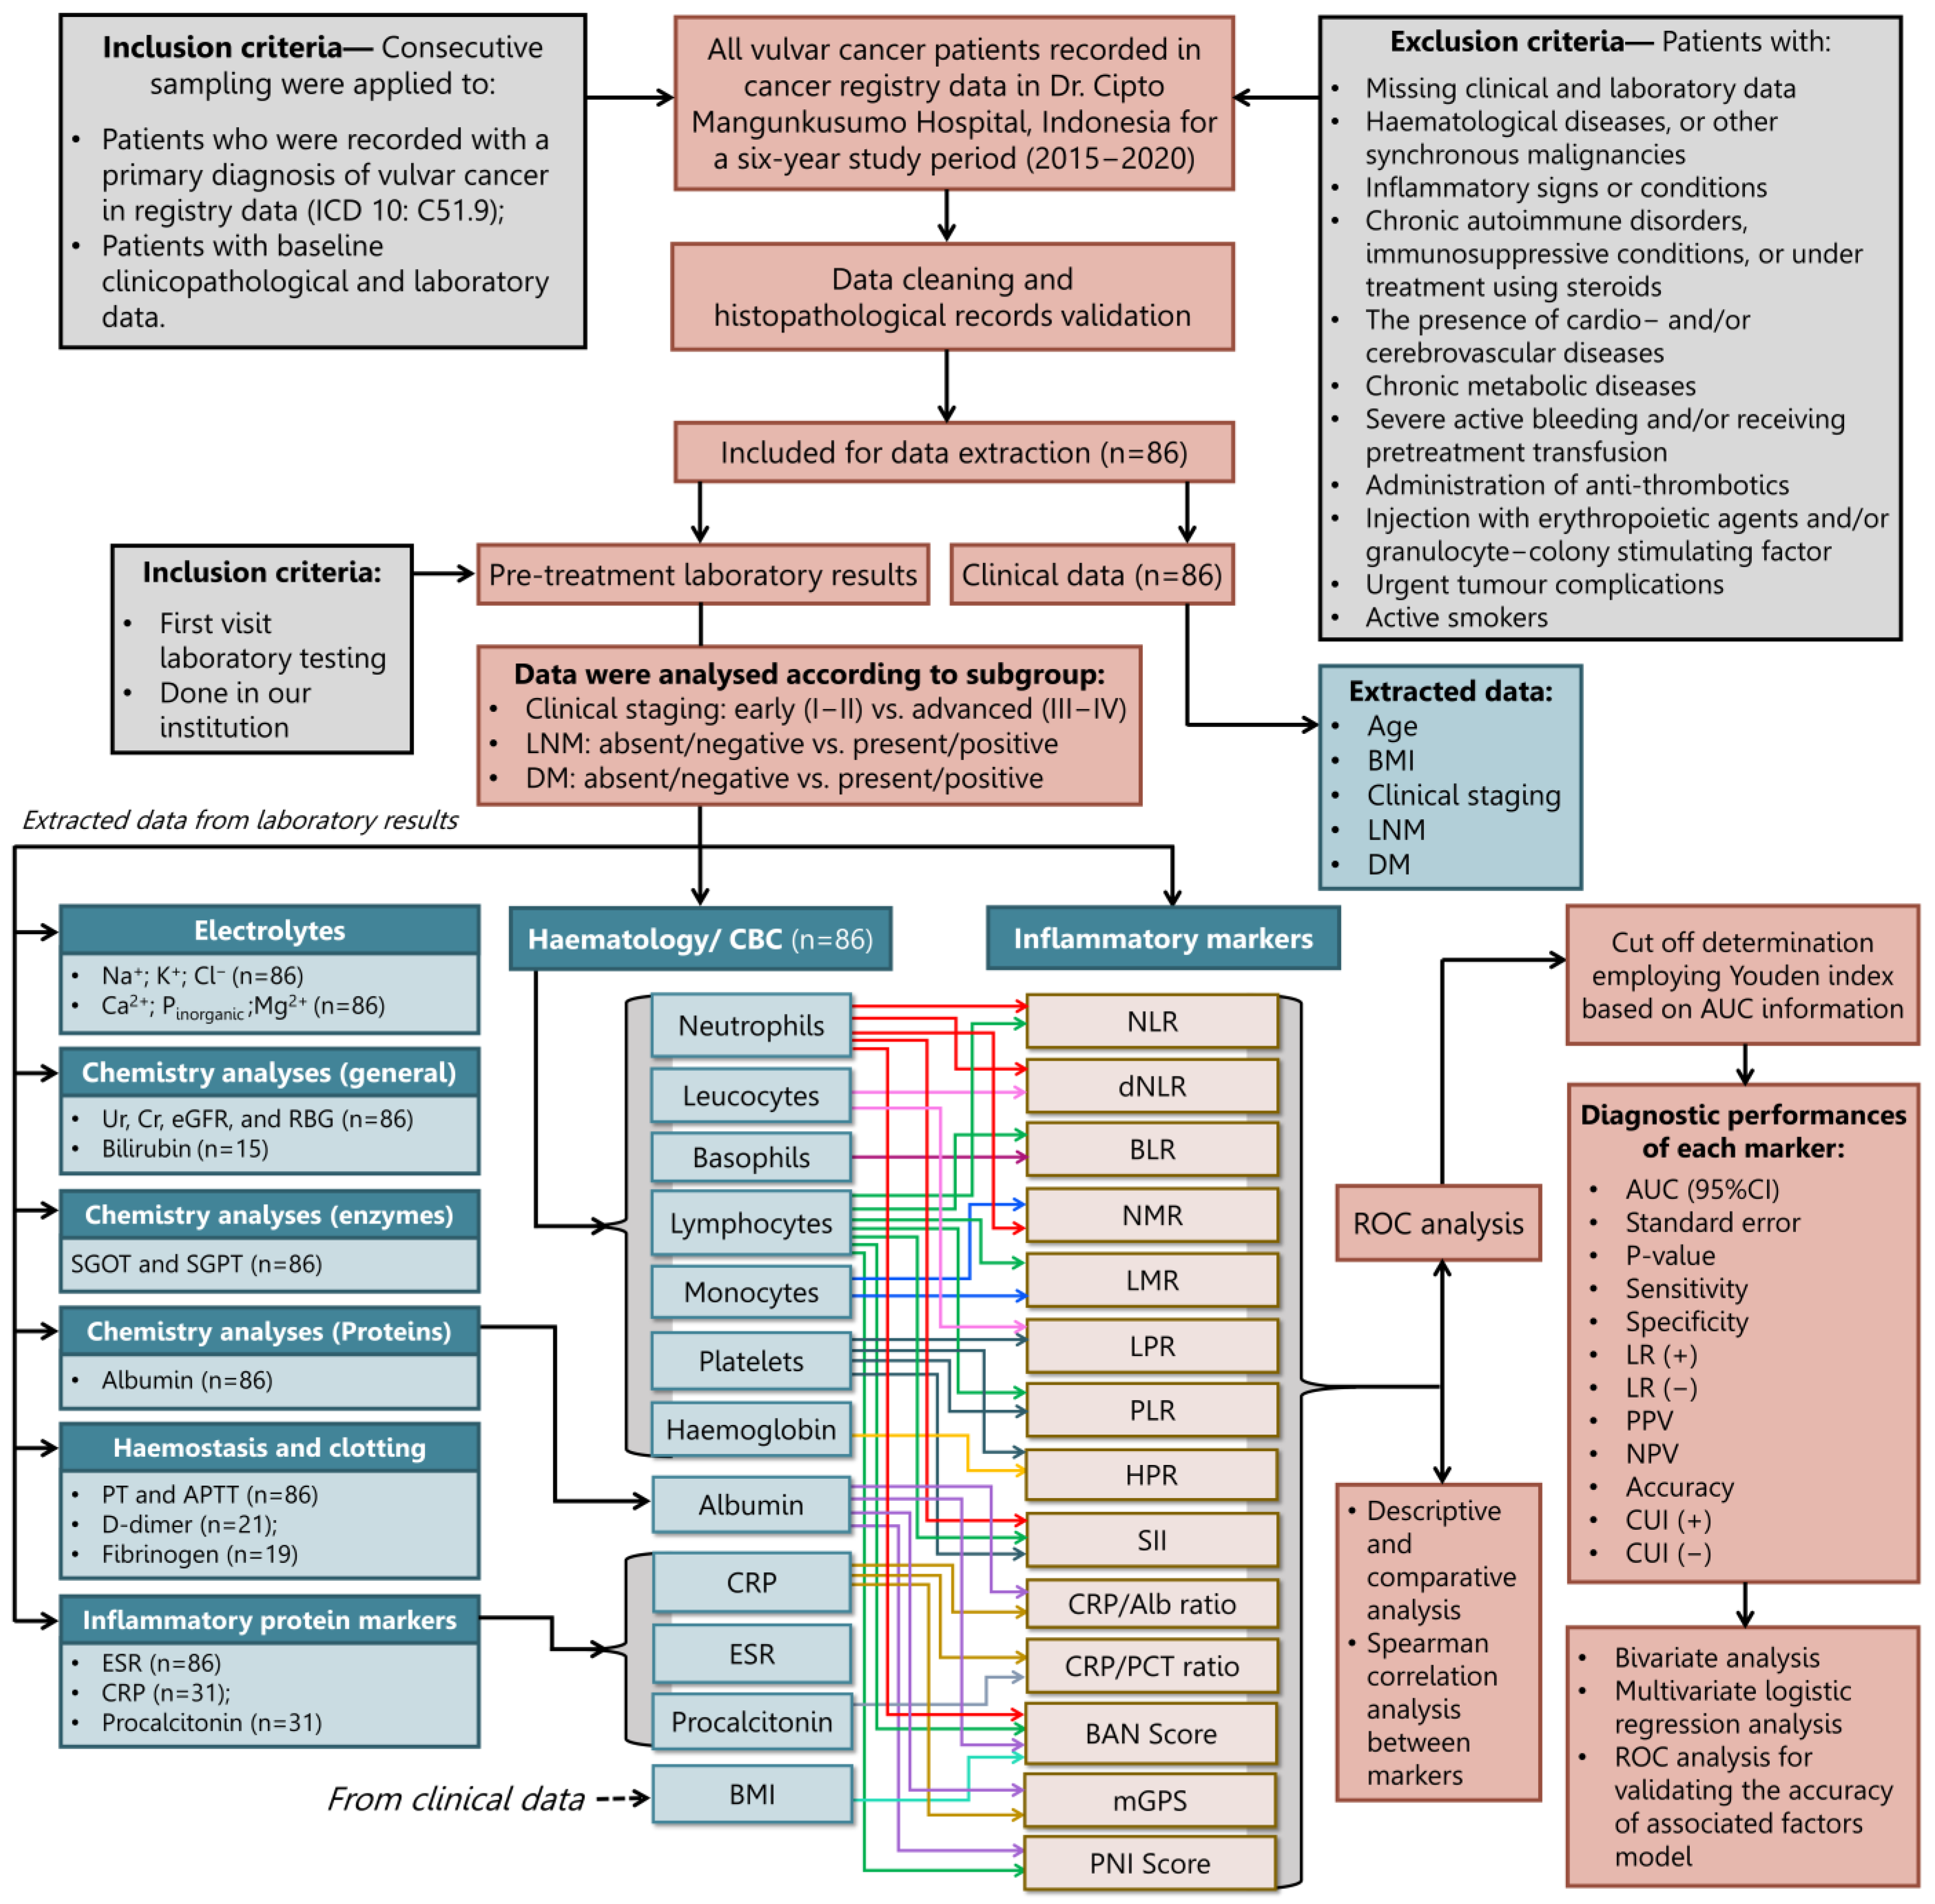
2. Materials and Methods
2.1. Study Design, Patients, and Eligibility Criteria
2.2. Study Variables: Patients Characteristics, Laboratory Results, and Markers Measurements
2.3. Study Endpoints, Markers’ Cut-Off Determination, and Diagnostic Indicator Performances
2.4. Statistical Analysis
3. Results
3.1. Patients Characteristics
3.2. Comparison of Baseline Laboratory Examination Results
3.3. Comparison of Baseline Inflammatory Markers

| Laboratory Profiles | Overall Included Cases | Mean ± Standard Deviation or Median (Interquartile Range: 25–75% Quartile) | ||||||||
|---|---|---|---|---|---|---|---|---|---|---|
| Clinical Staging | Lymph Node Metastasis (LNM) | Distant Metastasis (DM) | ||||||||
| Early Stage/ I–II | Advanced Stage/III–IV | p-Value | LNM (−) | LNM (+) | p-Value | DM (−) | DM (+) | p-Value | ||
| Haemoglobin (g/dL) | 10.6 ± 1.8 | 11.6 ± 2.1 | 10.5 ± 1.8 | 0.005 a | 10.8 ± 2.1 | 10.3 ± 1.5 | 0.226 b | 10.8 ± 1.8 | 10.1 ± 1.8 | 0.107 a |
| Hematocrit (%) | 31.4 ± 5.8 | 34.1 ± 7.7 | 30.7 ± 5.0 | 0.029 a | 31.9 ± 6.9 | 31.0 ± 4.6 | 0.522 b | 32.3 (28.3–35.8) | 31.4 (28.1–34.1) | 0.284 c |
| Erythrocyte (×106/μL) | 3.8 ± 0.7 | 4.2 ± 0.8 | 3.7 ± 0.7 | 0.009 a | 3.8 ± 0.8 | 3.7 ± 0.6 | 0.512 b | 3.7 (3.5–4.3) | 3.8 (3.3–4.1) | 0.426 c |
| MCV (fL) | 83.8 ± 6.2 | 83.8 ± 7.9 | 83.8 ± 5.8 | 0.262 a | 83.9 ± 7.1 | 83.8 ± 5.5 | 0.952 a | 84.1 ± 5.7 | 83.4 ± 7.1 | 0.606 a |
| MCH (pg) | 28.4 (32.2–34.6) | 28.4 (27.1–30.0) | 28.4 (26.5–30.0) | 0.920 c | 28.8 (26.9–30.0) | 28.4 (26.4–29.7) | 0.387 c | 28.6 (26.9–30.0) | 28.1 (25.9–30.0) | 0.447 c |
| MCHC (g/dL) | 33.5 ± 1.7 | 33.5 ± 1.4 | 33.6 ± 1.8 | 0.169 a | 33.7 ± 1.6 | 33.4 ± 1.8 | 0.545 a | 33.7 ± 1.5 | 33.3 ± 2.1 | 0.293 a |
| Platelets (×109/L) | 346.9 ± 144.9 | 377.5 ± 144.5 | 338.7 ± 144.9 | 0.559 a | 347.1 ± 161. 6 | 346.6 ± 129.7 | 0.989 a | 349.8 ± 141.3 | 341.9 ± 152.9 | 0.808 a |
| Leucocytes (count/μL) | 10,085 (6850–15,492) | 8865 (7737–12,807) | 11,105 (6155–16,350) | 0.832 c | 9840 (6840–16,540) | 10,960 (6705–15,240) | 0.952 c | 9365 (7040–15,402.5) | 12,045 (5965–16,350) | 0.865 c |
| Basophils (%) | 0.4 (0.2–0.5) | 0.4 (0.3–0.6) | 0.3 (0.2–0.5) | 0.047 c | 0.4 (0.2–0.5) | 0.3 (0.2–0.5) | 0.686 c | 0.3 (0.2–0.5) | 0.4 (0.2–0.5) | 0.902 c |
| Eosinophils (%) | 1.5 (0.4–2.8) | 1.2 (0.9–3.7) | 1.5 (0.4–2.8) | 0.625 c | 1.2 (0.4–2.2) | 1.9 (0.4–2.9) | 0.222 c | 1.4 (0.4–2.9) | 1.6 (0.5–2.8) | 0.844 c |
| Neutrophils (%) | 77.9 (69.0–84.1) | 66.3 (60.5–81.2) | 78.7 (71.5–84.7) | 0.047 c | 77.9 (62.2–84.5) | 77.9 (71.8–83.0) | 0.749 c | 76.6 (66.4–83.4) | 79.9 (70.0–84.7) | 0.360 c |
| Lymphocytes (%) | 12.8 (6.8–20.2) | 25.4 (11.6–28.4) | 11.3 (6.2–16.6) | 0.011 c | 12.9 (7.2–25.8) | 12.8 (6.2–17.0) | 0.397 c | 14.1 (7.3–25.2) | 10.7 (5.5–15.2) | 0.144 c |
| Monocytes (%) | 6.7 ± 2.4 | 6.1 (5.4–7.0) | 6.8 (5.4–8.5) | 0.364 c | 6.5 (5.4–8.3) | 6.9 (5.3–8.5) | 0.822 c | 6.5 ± 2.5 | 7.1 ± 2.1 | 0.270 a |
| Ureum (mg/dL) | 24.2 (18.6–35.5) | 21.3 (18.2–28.8) | 25.6 (18.9–41.0) | 0.141 a | 24.0 (18.8–29.6) | 25.2 (16.9–44.0) | 0.331 a | 23.5 (17.4–38.7) | 26.1 (19.3–32.7) | 0.964 a |
| Creatinine (mg/dL) | 0.8 (0.6–1.0) | 0.8 (0.7–0.9) | 0.8 (0.6–1.1) | 0.574 a | 0.7 (0.6–0.9) | 0.8 (0.6–1.2) | 0.139 a | 0.8 (0.7–1.0) | 0.7 (0.6–0.9) | 0.399 a |
| eGFR (mL/min/1.73 m2) | 84.0 (58.4–103.0) | 83.8 (71.6–106.8) | 85.9 (57.2–102.8) | 0.411 c | 92.0 (71.7–107.8) | 77.6 (46.5–102.0) | 0.059 c | 77.1 ± 32.9 | 85.3 ± 26.1 | 0.233 a |
| AST (µ/L) | 19.0 (15.0–25.5) | 21.0 (14.7–22.0) | 19.0 (15.0–35.7) | 0.648 c | 21.0 (16.0–30.5) | 17.0 (14.0–23.5) | 0.279 c | 18.5 (14.0–22.2) | 22.5 (15.2–60.7) | 0.049 c |
| ALT (µ/L) | 16.0 (11.0–23.0) | 19.5 (10.7–22.7) | 15.5 (11.0–23.0) | 0.531 c | 18.0 (13.5–24.5) | 13.00 (9.5–22.5) | 0.094 c | 15.5 (10.0–22.0) | 17.0 (11.0–33.7) | 0.269 c |
| Albumin (g/dL) | 3.3 (2.7–4.0) | 4.0 (3.4–4.2) | 3.2 (2.6–3.8) | 0.003 c | 3.4 ± 0.7 | 3.2 ± 0.8 | 0.152 a | 3.3 ± 0.8 | 3.1 ± 0.8 | 0.277 a |
| Patient PT (seconds) | 10.5 (10.2–11.5) | 10.3 (10.1–10.8) | 10.7 (10.3–11.8) | 0.066 c | 10.4 (10.0–11.3) | 10.7 (10.3–11.9) | 0.194 c | 10.5 (10.1–11.4) | 10.7 (10.2–11.8) | 0.497 c |
| Patient aPTT (seconds) | 34.2 (29.3–38.4) | 33.5 (29.4–35.9) | 34.7 (29.0–39.1) | 0.545 c | 35.5 (30.2–39.0) | 33.2 (28.8–38.0) | 0.268 c | 33.9 (29.4–38.3) | 35.8 (29.0–38.7) | 0.678 c |
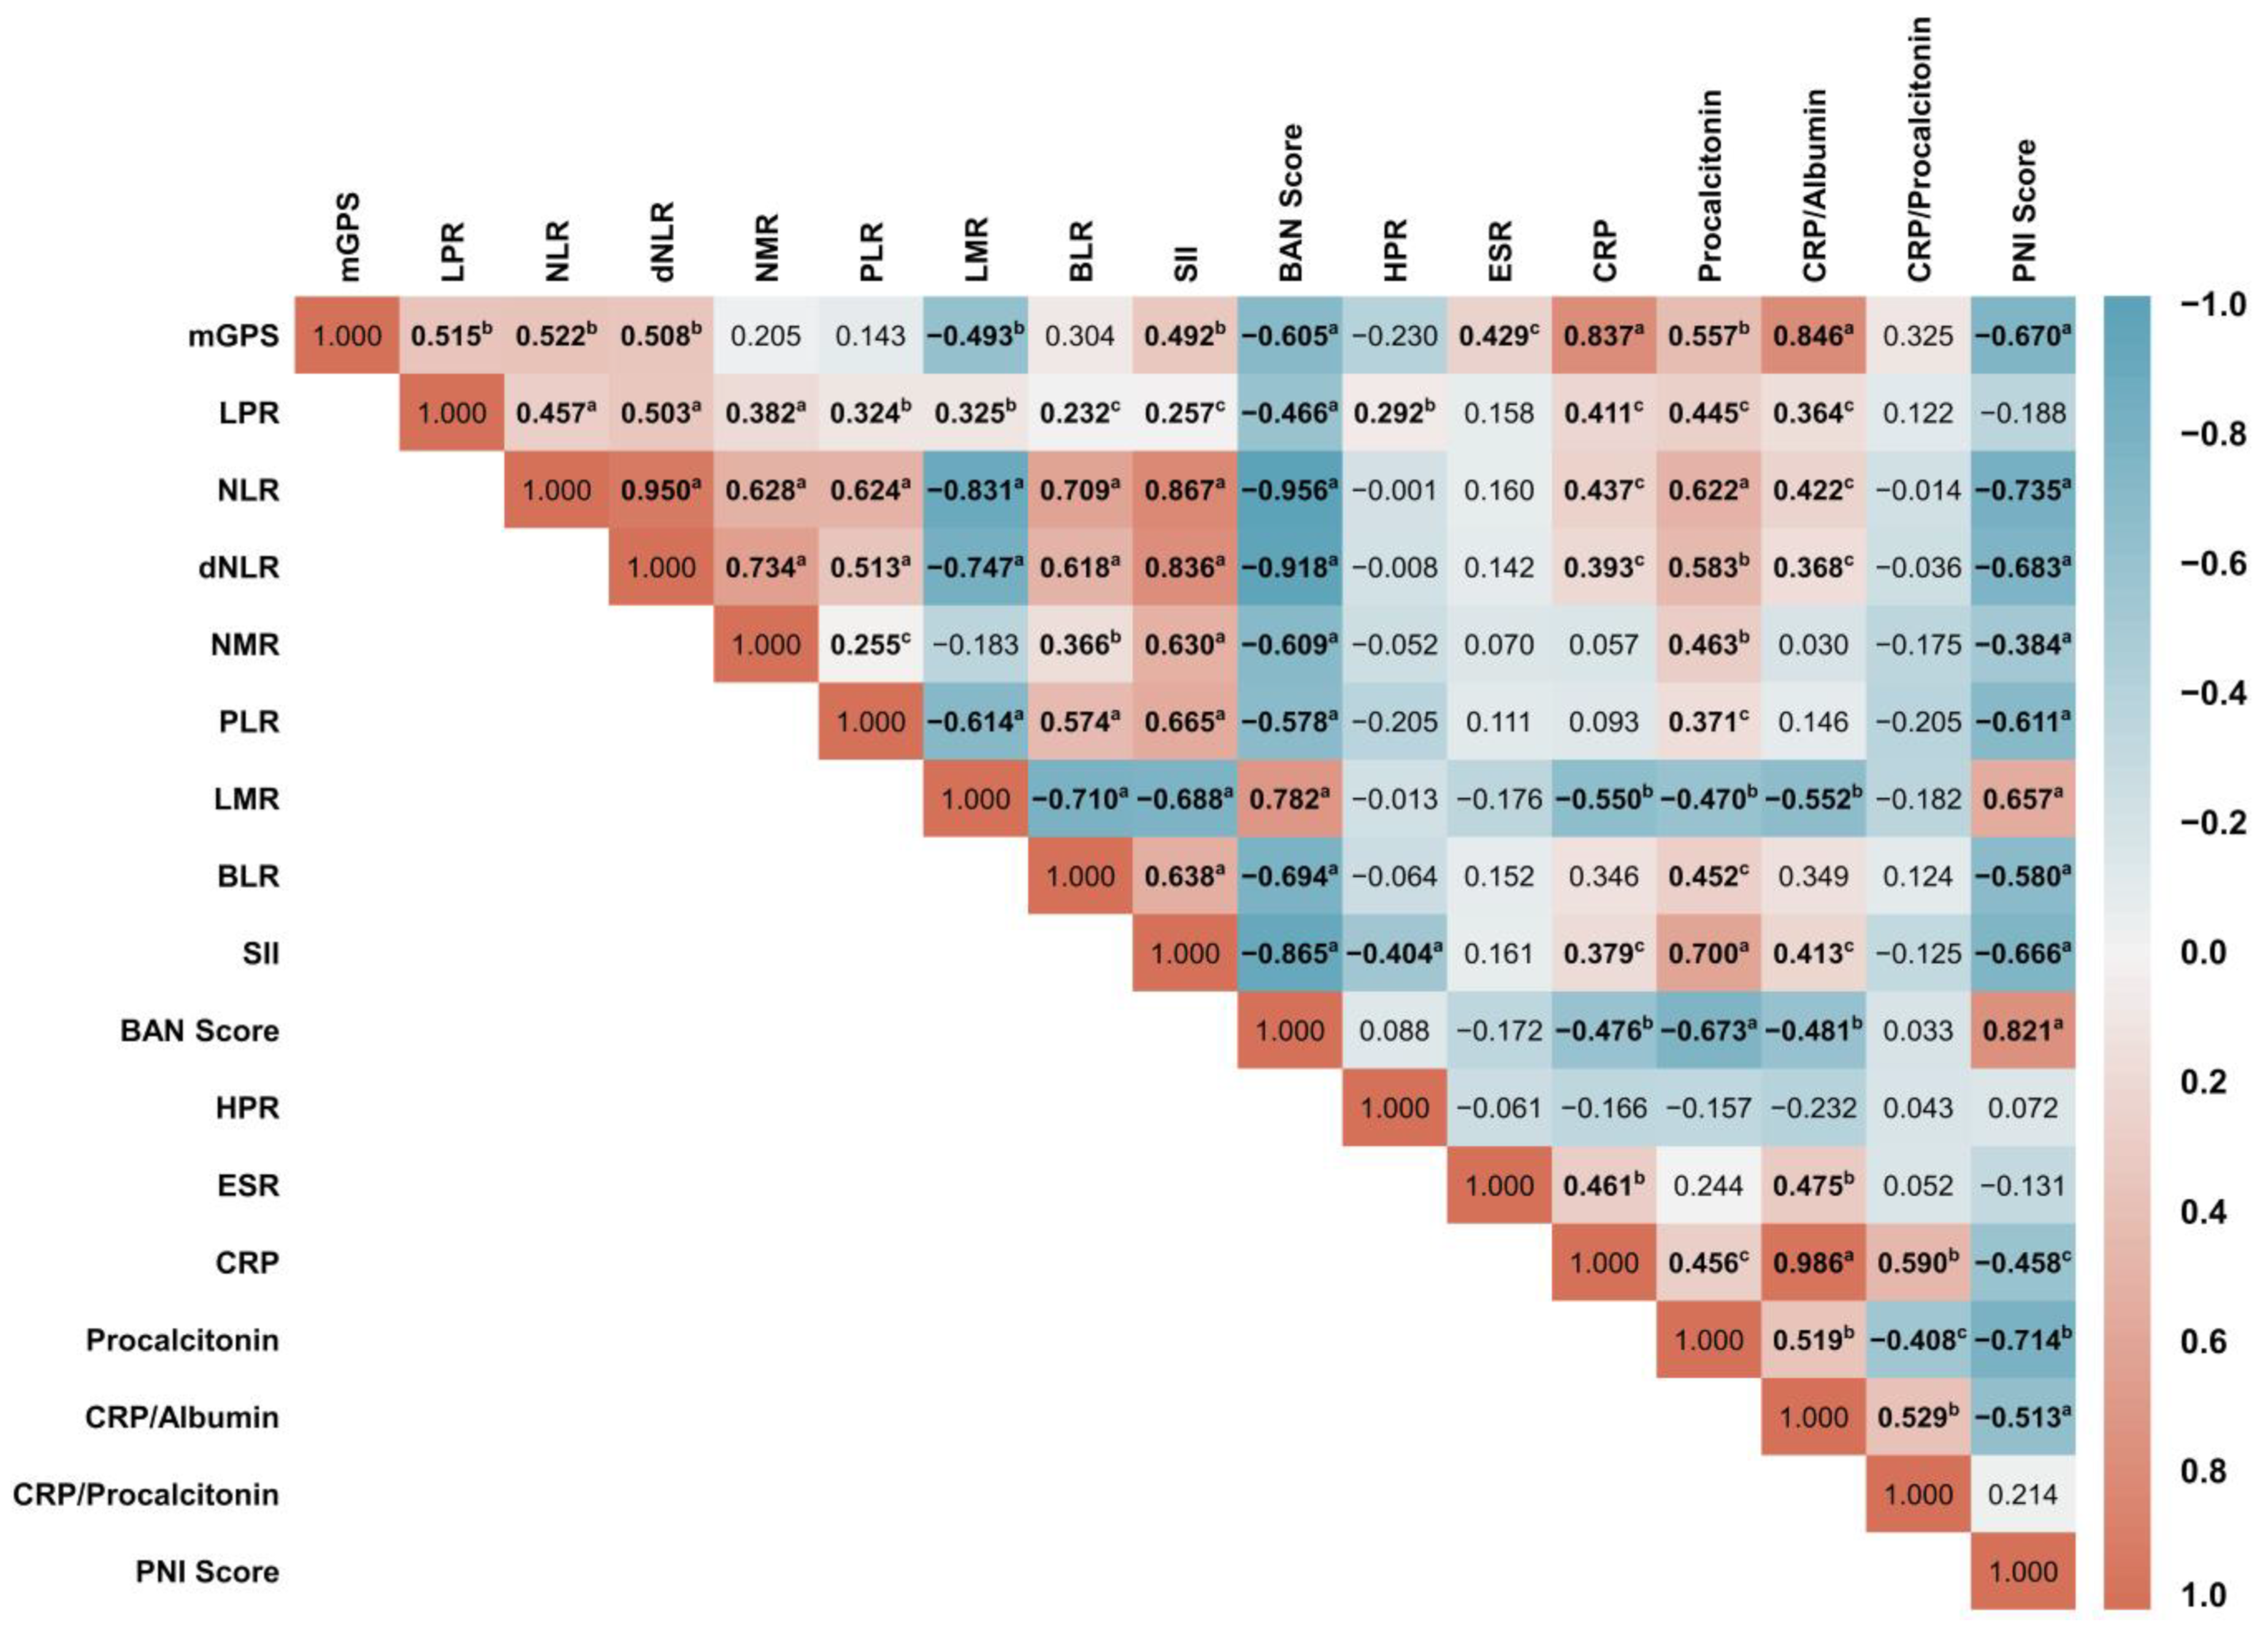
3.4. Intercorrelations between Inflammatory Markers
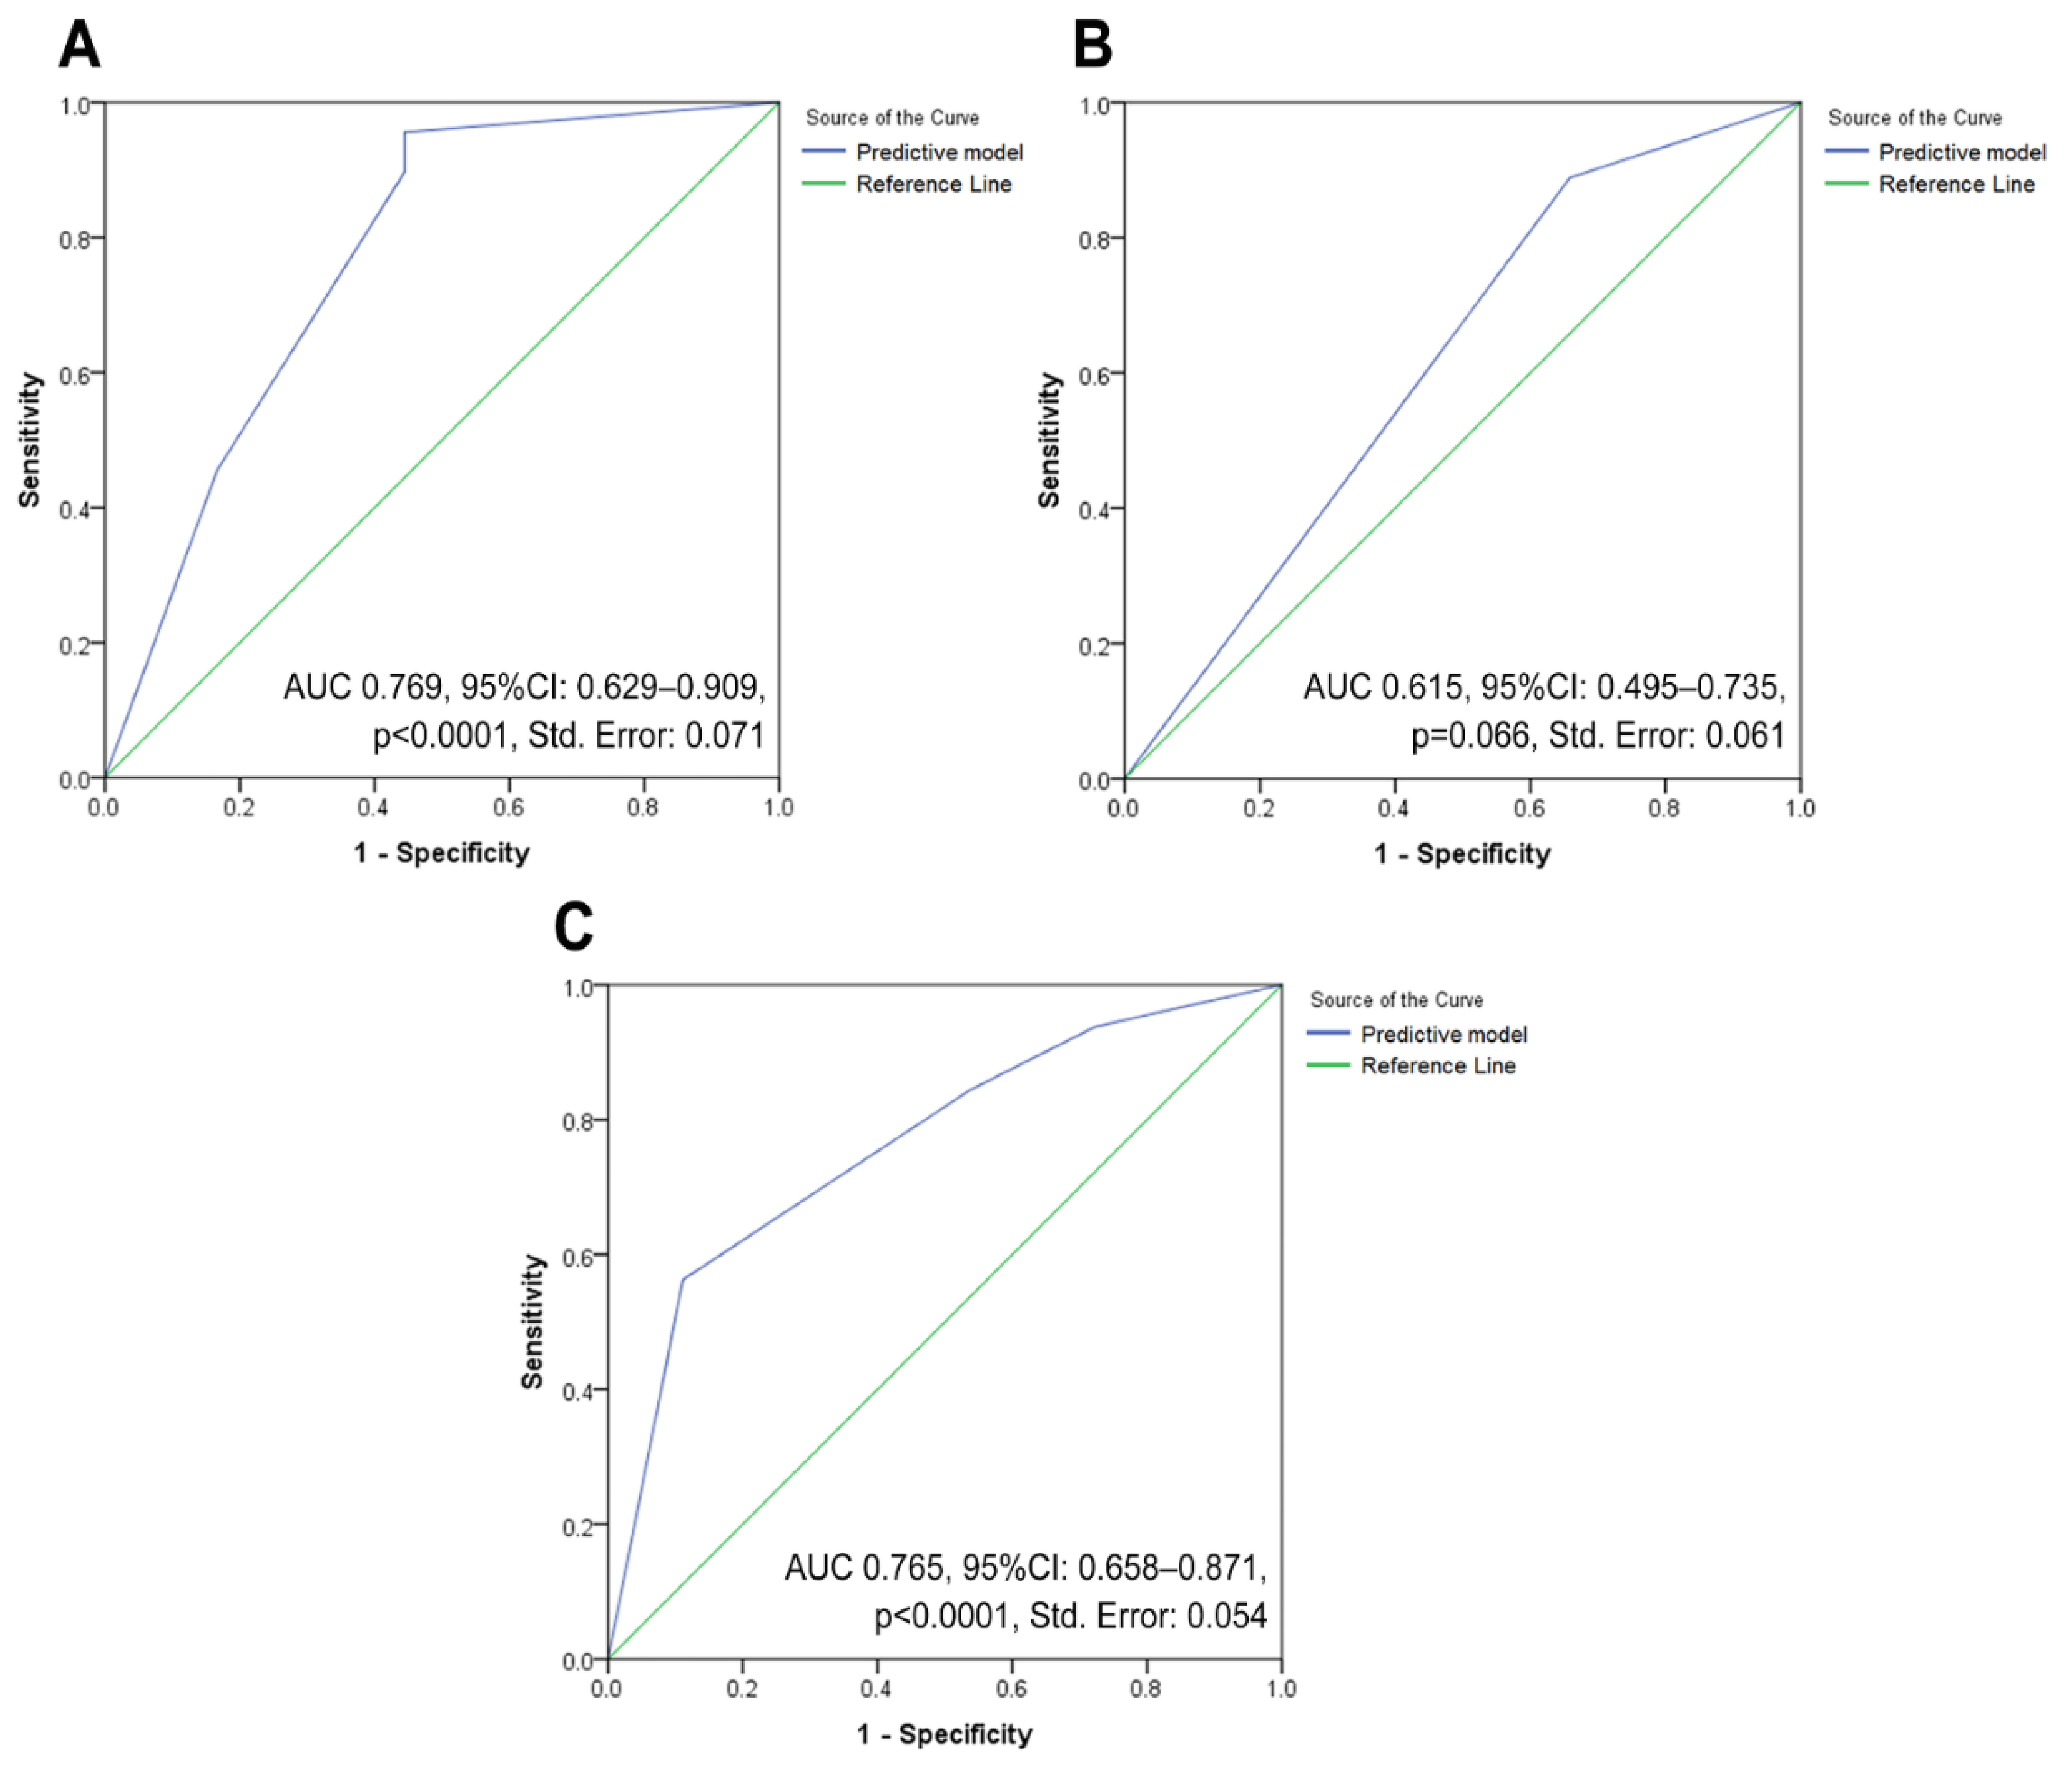
3.5. Determination of Inflammatory Markers Cut-Off and Their Diagnostic Performance
3.6. Association of Inflammatory Markers with Clinical Staging Endpoints
3.7. Association of Inflammatory Markers with Lymph Node Metastasis Endpoints
3.8. Association of Inflammatory Markers with Distant Metastasis Endpoints

4. Discussion
Strengths and Limitations
5. Conclusions
Supplementary Materials
Author Contributions
Funding
Institutional Review Board Statement
Informed Consent Statement
Data Availability Statement
Conflicts of Interest
References
- Bucchi, L.; Pizzato, M.; Rosso, S.; Ferretti, S. New Insights into the Epidemiology of Vulvar Cancer: Systematic Literature Review for an Update of Incidence and Risk Factors. Cancers 2022, 14, 389. [Google Scholar] [CrossRef] [PubMed]
- Alkatout, I.; Schubert, M.; Garbrecht, N.; Weigel, M.T.; Jonat, W.; Mundhenke, C.; Günther, V. Vulvar Cancer: Epidemiology, Clinical Presentation, and Management Options. Int. J. Womens Health 2015, 7, 305–313. [Google Scholar] [CrossRef] [PubMed]
- Fatalska, A.; Rusetska, N.; Bakuła-zalewska, E.; Kowalik, A.; Zięba, S.; Wroblewska, A.; Zalewski, K.; Goryca, K.; Domański, D.; Kowalewska, M. Inflammatory Proteins HMGA2 and PRTN3 as Drivers of Vulvar Squamous Cell Carcinoma Progression. Cancers 2021, 13, 27. [Google Scholar] [CrossRef] [PubMed]
- Bartl, T.; Bekos, C.; Postl, M.; Alexander, R.; Polterauer, S.; Stefanie, A.; Richard, S. The Systemic Immune-Inflammation Index (SII) Is an Independent Prognostic Parameter of Survival in Patients with Invasive Vulvar Cancer. J. Gynecol. Oncol. 2021, 32, e1. [Google Scholar] [CrossRef]
- Hibino, S.; Kawazoe, T.; Kasahara, H.; Itoh, S.; Ishimoto, T.; Sakata-Yanagimoto, M.; Taniguchi, K. Inflammation-Induced Tumorigenesis and Metastasis. Int. J. Mol. Sci. 2021, 22, 5421. [Google Scholar] [CrossRef]
- Thuijs, N.B.; Schonck, W.A.M.; Klaver, L.L.J.; Fons, G.; van Beurden, M.; Steenbergen, R.D.M.; Bleeker, M.C.G. Biomarker Expression in Multifocal Vulvar High-Grade Squamous Intraepithelial Lesions. Cancers 2021, 13, 5646. [Google Scholar] [CrossRef]
- Ertas, I.E.; Gungorduk, K.; Akman, L.; Ozdemir, A.; Terek, M.C.; Ozsaran, A.; Sanci, M.; Dikmen, Y. Can Preoperative Neutrophil:Lymphocyte and Platelet:Lymphocyte Ratios Be Used as Predictive Markers for Lymph Node Metastasis in Squamous Cell Carcinoma of the Vulva? Eur. J. Obstet. Gynecol. Reprod. Biol. 2013, 171, 138–142. [Google Scholar] [CrossRef]
- Mleko, M.; Pitynski, K.; Pluta, E.; Czerw, A.; Sygit, K.; Karakiewicz, B.; Banas, T. Role of Systemic Inflammatory Reaction in Female Genital Organ Malignancies—State of the Art. Cancer Manag. Res. 2021, 13, 5491–5508. [Google Scholar] [CrossRef]
- Tavares-Murta, B.M.; Mendonça, M.A.O.; Duarte, N.L.; da Silva, J.A.; Mutão, T.S.; Garcia, C.B.; Murta, E.F.C. Systemic Leukocyte Alterations Are Associated with Invasive Uterine Cervical Cancer. Int. J. Gynecol. Cancer 2010, 20, 1154–1159. [Google Scholar] [CrossRef]
- Smith, R.A.; Bosonnet, L.; Ghaneh, P.; Sutton, R.; Evans, J.; Healey, P.; Garvey, C.; Hughes, M.; Raraty, M.; Campbell, F.; et al. The Platelet-Lymphocyte Ratio Improves the Predictive Value of Serum CA19-9 Levels in Determining Patient Selection for Staging Laparoscopy in Suspected Periampullary Cancer. Surgery 2008, 143, 658–666. [Google Scholar] [CrossRef]
- Greten, F.R.; Grivennikov, S.I. Inflammation and Cancer: Triggers, Mechanisms, and Consequences. Immunity 2019, 51, 27–41. [Google Scholar] [CrossRef]
- Park, J.W.; Chang, H.J.; Yeo, H.Y.; Han, N.; Kim, B.C.; Kong, S.Y.; Kim, J.; Oh, J.H. The Relationships between Systemic Cytokine Profiles and Inflammatory Markers in Colorectal Cancer and the Prognostic Significance of These Parameters. Br. J. Cancer 2020, 123, 610–618. [Google Scholar] [CrossRef]
- Bruserud, Ø.; Aarstad, H.H.; Tvedt, T.H.A. Combined C-Reactive Protein and Novel Inflammatory Parameters as a Predictor in Cancer—What Can We Learn from the Hematological Experience? Cancers 2020, 12, 1966. [Google Scholar] [CrossRef]
- Ruka, W.; Rutkowski, P.; Kaminska, J.; Rysinska, A.; Steffen, J. Alterations of Routine Blood Tests in Adult Patients with Soft Tissue Sarcomas: Relationships to Cytokine Serum Levels and Prognostic Significance. Ann. Oncol. 2001, 12, 1423–1432. [Google Scholar] [CrossRef]
- Alexandrakis, M.G.; Passam, F.H.; Moschandrea, I.A.; Christophoridou, A.V.; Pappa, C.A.; Coulocheri, S.A.; Kyriakou, D.S. Levels of Serum Cytokines and Acute Phase Proteins in Patients with Essential and Cancer-Related Thrombocytosis. Am. J. Clin. Oncol. 2003, 26, 135–140. [Google Scholar] [CrossRef]
- Yoshida, K.; Yoshikawa, N.; Shirakawa, A.; Niimi, K.; Suzuki, S.; Kajiyama, H.; Kikkawa, F. Prognostic Value of Neutrophil-to-Lymphocyte Ratio in Early-Stage Ovarian Clear-Cell Carcinoma. J. Gynecol. Oncol. 2019, 30, e85. [Google Scholar] [CrossRef]
- Yun, T.H.; Jeong, Y.Y.; Lee, S.J.; Choi, Y.S.; Ryu, J.M. Neutrophil–Lymphocyte and Platelet–Lymphocyte Ratios in Preoperative Differential Diagnosis of Benign, Borderline, and Malignant Ovarian Tumors. J. Clin. Med. 2022, 11, 1355. [Google Scholar] [CrossRef]
- Sanna, E.; Tanca, L.; Cherchi, C.; Gramignano, G.; Oppi, S.; Chiai, M.G.; Macciò, A.; Madeddu, C. Decrease in Neutrophil-to-Lymphocyte Ratio during Neoadjuvant Chemotherapy as a Predictive and Prognostic Marker in Advanced Ovarian Cancer. Diagnostics 2021, 11, 1298. [Google Scholar] [CrossRef]
- Li, Y.X.; Chang, J.Y.; He, M.Y.; Wang, H.R.; Luo, D.Q.; Li, F.H.; Li, J.H.; Ran, L. Neutrophil-to-Lymphocyte Ratio (NLR) and Monocyte-to-Lymphocyte Ratio (MLR) Predict Clinical Outcome in Patients with Stage IIB Cervical Cancer. J. Oncol. 2021, 2021, 2939162. [Google Scholar] [CrossRef]
- Prabawa, I.P.Y.; Bhargah, A.; Liwang, F.; Tandio, D.A.; Tandio, A.L.; Lestari, A.A.W.; Budiana, I.N.G.; Manuaba, I.B.A.P. Pretreatment Neutrophil-to-Lymphocyte Ratio (NLR) and Platelet-to-Lymphocyte Ratio (PLR) as a Predictive Value of Hematological Markers in Cervical Cancer. Asian Pac. J. Cancer Prev. 2019, 20, 863–868. [Google Scholar] [CrossRef]
- Lee, J.W.; Seol, K.H. Pretreatment Neutrophil-to-lymphocyte Ratio Combined with Platelet-to-lymphocyte Ratio as a Predictor of Survival Outcomes after Definitive Concurrent Chemoradiotherapy for Cervical Cancer. J. Clin. Med. 2021, 10, 2199. [Google Scholar] [CrossRef] [PubMed]
- Holub, K.; Busato, F.; Gouy, S.; Sun, R.; Pautier, P.; Genestie, C.; Morice, P.; Leary, A.; Deutsch, E.; Haie-Meder, C.; et al. Analysis of Systemic Inflammatory Factors and Survival Outcomes in Endometrial Cancer Patients Staged I-III FIGO and Treated with Postoperative External Radiotherapy. J. Clin. Med. 2020, 9, 1441. [Google Scholar] [CrossRef] [PubMed]
- Jeong, Y.Y.; Lee, E.J.; Cho, E.B.; Ryu, J.M.; Choi, Y.S. The Role of Platelet-to-Lymphocyte Ratio and Neutrophil-to-Lymphocyte Ratio as a Supplemental Tool for Differential Diagnosis of Uterine Myoma and Sarcoma. Clin. Exp. Obstet. Gynecol. 2021, 48, 901–906. [Google Scholar] [CrossRef]
- Vandenbroucke, J.P.; von Elm, E.; Altman, D.G.; Gøtzsche, P.C.; Mulrow, C.D.; Pocock, S.J.; Poole, C.; Schlesselman, J.J.; Egger, M.; Blettner, M.; et al. Strengthening the Reporting of Observational Studies in Epidemiology (STROBE): Explanation and Elaboration. Int. J. Surg. 2014, 12, 1500–1524. [Google Scholar] [CrossRef] [PubMed]
- Virarkar, M.; Vulasala, S.S.; Daoud, T.; Javadi, S.; Lall, C.; Bhosale, P. Vulvar Cancer: 2021 Revised FIGO Staging System and the Role of Imaging. Cancers 2022, 14, 2264. [Google Scholar] [CrossRef] [PubMed]
- Tu, H.; Sun, P.; Gu, H.F.; Zhang, X.K.; Huang, H.; Wan, T.; Liu, J.H. Clinical Significance and Prognostic Value of Femoral Lymph Node Metastasis in FIGO Stage III Vulvar Carcinoma. Eur. J. Surg. Oncol. 2017, 43, 1768–1775. [Google Scholar] [CrossRef] [PubMed]
- Olawaiye, A.B.; Cuello, M.A.; Rogers, L.J. Cancer of the Vulva: 2021 Update. Int. J. Gynecol. Obstet. 2021, 155, 7–18. [Google Scholar] [CrossRef]
- Chow, L.; Tsui, B.Q.; Bahrami, S.; Masamed, R.; Memarzadeh, S.; Raman, S.S.; Patel, M.K. Gynecologic Tumor Board: A Radiologist’s Guide to Vulvar and Vaginal Malignancies. Abdom. Radiol. 2021, 46, 5669–5686. [Google Scholar] [CrossRef]
- Olawaiye, A.B.; Cotler, J.; Cuello, M.A.; Bhatla, N.; Okamoto, A.; Wilailak, S.; Purandare, C.N.; Lindeque, G.; Berek, J.S.; Kehoe, S.; et al. FIGO Staging for Carcinoma of the Vulva: 2021 Revision. Int. J. Gynecol. Obstet. 2021, 155, 43–47. [Google Scholar] [CrossRef]
- Gershenwald, J.E.; Scolyer, R.A.; Hess, K.R.; Sondak, V.K.; Long, G.V.; Ross, M.I.; Lazar, A.J.; Faries, M.B.; Kirkwood, J.M.; McArthur, G.A.; et al. Melanoma Staging: Evidence-Based Changes in the American Joint Committee on Cancer Eighth Edition Cancer Staging Manual. CA Cancer J. Clin. 2017, 67, 472–492. [Google Scholar] [CrossRef]
- Chang, H.; Han, D.; Bang, H.Y.; Kim, P.S.; Lee, K. In Which Group of Gastric Cancer Patients Is the Preoperative Neutrophil-to-Lymphocyte Ratio a Significant Prognostic Factor? Korean J. Clin. Oncol. 2016, 12, 19–24. [Google Scholar] [CrossRef]
- Pang, W.; Lou, N.; Jin, C.; Hu, C.; Arvine, C.; Zhu, G.; Shen, X. Combination of Preoperative Platelet/Lymphocyte and Neutrophil/Lymphocyte Rates and Tumor-Related Factors to Predict Lymph Node Metastasis in Patients with Gastric Cancer. Eur. J. Gastroenterol. Hepatol. 2016, 28, 493–502. [Google Scholar] [CrossRef]
- Ikhsan, M.; Nasution, S.A.; Rachman, A.; Muhadi, M. Korelasi Rasio Hemoglobin Platelet Dan Rasio Leukosit Platelet Terhadap Skor SYNTAX-2 Pada Pasien Infark Miokard Akut Dengan ST-Elevasi. J. Penyakit Dalam Indones. 2021, 8, 23. [Google Scholar] [CrossRef]
- Ciocan, A.; Ciocan, R.A.; Al Hajjar, N.; Gherman, C.D.; Bolboacă, S.D. Abilities of Pre-Treatment Inflammation Ratios as Classification or Prediction Models for Patients with Colorectal Cancer. Diagnostics 2021, 11, 566. [Google Scholar] [CrossRef]
- Grenader, T.; Nash, S.; Adams, R.; Kaplan, R.; Fisher, D.; Maughan, T.; Bridgewater, J. Derived Neutrophil Lymphocyte Ratio Is Predictive of Survival from Intermittent Therapy in Advanced Colorectal Cancer: A Post Hoc Analysis of the MRC COIN Study. Br. J. Cancer 2016, 114, 612–615. [Google Scholar] [CrossRef]
- Tang, F.; Dai, P.; Wei, Q.; Gan, K.; Wang, Z.; Chen, H.; Li, T.; Lv, M.; Deng, M.; Luo, G. The Neutrophil-to-Monocyte Ratio and Platelet-to-White Blood Cell Ratio Represent Novel Prognostic Markers in Patients with Pancreatic Cancer. Gastroenterol. Res. Pract. 2021, 2021, 6693028. [Google Scholar] [CrossRef]
- Zhang, F.; Bu, L.-J.; Wang, R.; Da, J.; Ding, J.-X.; Peng, W.-R. Pretreatment BAN Score Based on Body-Mass-Index, Albumin and Neutrophil-Lymphocyte Ratio Could Predict Long-Term Survival for Patients with Operable Esophageal Squamous Cell Carcinoma. J. Cancer 2022, 13, 2768–2774. [Google Scholar] [CrossRef]
- Zhou, T.; Zhao, Y.; Zhao, S.; Yang, Y.; Huang, Y.; Hou, X.; Zhao, H.; Zhang, L. Comparison of the Prognostic Value of Systemic Inflammation Response Markers in Small Cell Lung Cancer Patients. J. Cancer 2019, 10, 1685–1692. [Google Scholar] [CrossRef]
- Wang, X.; He, Q.; Liang, H.; Liu, J.; Xu, X.; Jiang, K.; Zhang, J. A Novel Robust Nomogram Based on Preoperative Hemoglobin and Albumin Levels and Lymphocyte and Platelet Counts (HALP) for Predicting Lymph Node Metastasis of Gastric Cancer. J. Gastrointest. Oncol. 2021, 13, 2706–2718. [Google Scholar] [CrossRef]
- Xishan, Z.; Ye, Z.; Feiyan, M.; Liang, X.; Shikai, W. The Role of Prognostic Nutritional Index for Clinical Outcomes of Gastric Cancer after Total Gastrectomy. Sci. Rep. 2020, 10, 17373. [Google Scholar] [CrossRef]
- Proctor, M.J.; Morrison, D.S.; Talwar, D.; Balmer, S.M.; O’Reilly, D.S.J.; Foulis, A.K.; Horgan, P.G.; McMillan, D.C. An Inflammation-Based Prognostic Score (MGPS) Predicts Cancer Survival Independent of Tumour Site: A Glasgow Inflammation Outcome Study. Br. J. Cancer 2011, 104, 726–734. [Google Scholar] [CrossRef] [PubMed]
- Vassallo, M.; Michelangeli, C.; Fabre, R.; Manni, S.; Genillier, P.L.; Weiss, N.; Blanchouin, E.; Saudes, L.; Kaphan, R.; Puchois, A.; et al. Procalcitonin and C-Reactive Protein/Procalcitonin Ratio as Markers of Infection in Patients With Solid Tumors. Front. Med. 2021, 8, 627967. [Google Scholar] [CrossRef] [PubMed]
- Unal, I. Defining an Optimal Cut-Point Value in ROC Analysis: An Alternative Approach. Comput. Math. Methods Med. 2017, 2017, 3762651. [Google Scholar] [CrossRef] [PubMed]
- Attwood, K.; Tian, L. Confidence Interval Estimation of the Youden Index and Corresponding Cut-Point for a Combination of Biomarkers under Normality. Commun. Stat. Theory Methods 2020, 51, 501–518. [Google Scholar] [CrossRef] [PubMed]
- Shimizu, T.; Taniguchi, K.; Asakuma, M.; Tomioka, A.; Inoue, Y.; Komeda, K.; Hirokawa, F.; Uchiyama, K. Lymphocyte–to–Monocyte Ratio and Prognostic Nutritional Index Predict Poor Prognosis in Patients on Chemotherapy for Unresectable Pancreatic Cancer. Anticancer Res. 2019, 39, 2169 LP–2176 LP. [Google Scholar] [CrossRef]
- MedCalc Software Ltd. Diagnostic Test Evaluation Calculator v.20.114. Available online: https://www.medcalc.org/calc/diagnostic_test.php (accessed on 1 August 2022).
- Mitchell, A.J.; Pezzullo, J. Clinical Utility Index Calculator (CUI+ CUI-) v5: Quickly Find the Qualitative and Quantitative Accuracy & Utility of Diagnostic Predictive and Screening Tests. Available online: https://www.psycho-oncology.info/cui.html (accessed on 1 August 2022).
- Mitchell, A.J. Sensitivity × PPV Is a Recognized Test Called the Clinical Utility Index (CUI+). Eur. J. Epidemiol. 2011, 26, 251–252, author reply 252. [Google Scholar] [CrossRef]
- Cartwright, J.K.; Desmarais, S.L.; Johnson, K.L.; Van Dorn, R.A. Performance and Clinical Utility of a Short Violence Risk Screening Tool in U.S. Adults with Mental Illness. Psychol. Serv. 2018, 15, 398–408. [Google Scholar] [CrossRef]
- Šimundić, A.-M. Measures of Diagnostic Accuracy: Basic Definitions. EJIFCC 2009, 19, 203–211. [Google Scholar]
- De, J.; Wand, A.P.F. Delirium Screening: A Systematic Review of Delirium Screening Tools in Hospitalized Patients. Gerontologist 2015, 55, 1079–1099. [Google Scholar] [CrossRef]
- American Academy of Family Physicians Likelihood Ratios, Predictive Values, and Post-Test Probabilities. Available online: https://www.aafp.org/dam/AAFP/documents/journals/afp/Likelihood_Ratios.pdf (accessed on 21 August 2022).
- Statistic Tutor Spearman’s Correlation. Available online: http://www.statstutor.ac.uk/resources/uploaded/spearmans.pdf (accessed on 19 September 2021).
- Bursac, Z.; Gauss, C.H.; Williams, D.K.; Hosmer, D.W. Purposeful Selection of Variables in Logistic Regression. Source Code Biol. Med. 2008, 3, 17. [Google Scholar] [CrossRef]
- Alkhamis, M.A.; Brookes, V.J.; Van der Waa, K. Applications of Novel Analytical Methods in Epidemiology; Frontiers Media, S.A.: Lausanne, Switzerland, 2018. [Google Scholar]
- Dahlan, M.S. Logistics Regression Multivariate Analysis, 2nd ed.; Epidemiologi Indonesia: Jakarta, Indonesia, 2019. (In Indonesian) [Google Scholar]
- Tenny, S.; Hoffman, M.R. Prevalence. Available online: https://www.ncbi.nlm.nih.gov/books/NBK430867/ (accessed on 21 August 2022).
- Bakacak, M.; Serin, S.; Ercan, Ö.; Köstü, B.; Bostancı, M.S.; Bakacak, Z.; Kıran, H.; Kıran, G. Utility of Preoperative Neutrophil-to-Lymphocyte and Platelet-to-Lymphocyte Ratios to Distinguish Malignant from Benign Ovarian Masses. J. Turk. Ger. Gynecol. Assoc. 2016, 17, 21–25. [Google Scholar] [CrossRef]
- Lee, Y.Y.; Choi, C.H.; Kim, H.J.; Kim, T.J.; Lee, J.W.; Lee, J.H.; Bae, D.S.; Kim, B.G. Pretreatment Neutrophil:Lymphocyte Ratio as a Prognostic Factor in Cervical Carcinoma. Anticancer Res. 2012, 32, 1555–1561. [Google Scholar]
- Ilgen, O.; Kurt, S.; Yuzuguldu, R.I.; Ada, O.; Mankan, A. Platelet to Lymphocyte and Neutrophil to Lymphocyte Ratios in Endometrial Pathologies. Ginekol. Pol. 2021. [Google Scholar] [CrossRef]
- John-Olabode, S.O.; Okunade, K.S.; Olorunfemi, G.; Soibi-Harry, A.; Rimi, G.; Osunwusi, B.; Okunowo, A.; Amaeshi, L.; Anorlu, R. Pretreatment Neutrophil-to-Lymphocyte Ratio: A Prognostic Biomarker of Survival in Patients with Epithelial Ovarian Cancer. Cureus 2021, 13, e16429. [Google Scholar] [CrossRef]
- Yin, C.; Toiyama, Y.; Okugawa, Y.; Omura, Y.; Kusunoki, Y.; Kusunoki, K.; Imaoka, Y.; Yasuda, H.; Ohi, M.; Kusunoki, M. Clinical Significance of Advanced Lung Cancer Inflammation Index, a Nutritional and Inflammation Index, in Gastric Cancer Patients after Surgical Resection: A Propensity Score Matching Analysis. Clin. Nutr. 2021, 40, 1130–1136. [Google Scholar] [CrossRef]
- Qi, C.; Zhou, Y.; Hu, Z.; Niu, H.; Yue, F.; An, H.; Duan, G. The Prognostic Value of the Advanced Lung Cancer Inflammation Index (ALI) for Patients with Neuroblastoma. J. Int. Med. Res. 2022, 50, 03000605221109382. [Google Scholar] [CrossRef]
- Cuyàs, E.; Verdura, S.; Martin-Castillo, B.; Alarcón, T.; Lupu, R.; Bosch-Barrera, J.; Menendez, J.A. Tumor Cell-Intrinsic Immunometabolism and Precision Nutrition in Cancer Immunotherapy. Cancers 2020, 12, 1757. [Google Scholar] [CrossRef]
- He, X.; Zhou, T.; Yang, Y.; Hong, S.; Zhan, J.; Hu, Z.; Fang, W.; Qin, T.; Ma, Y.; Zhao, Y.; et al. Advanced Lung Cancer Inflammation Index, a New Prognostic Score, Predicts Outcome in Patients with Small-Cell Lung Cancer. Clin. Lung Cancer 2015, 16, e165–e171. [Google Scholar] [CrossRef]
- Ataseven, B.; du Bois, A.; Reinthaller, A.; Traut, A.; Heitz, F.; Aust, S.; Prader, S.; Polterauer, S.; Harter, P.; Grimm, C. Pre-Operative Serum Albumin Is Associated with Post-Operative Complication Rate and Overall Survival in Patients with Epithelial Ovarian Cancer Undergoing Cytoreductive Surgery. Gynecol. Oncol. 2015, 138, 560–565. [Google Scholar] [CrossRef]
- Prieske, K.; Haeringer, N.; Grimm, D.; Trillsch, F.; Eulenburg, C.; Burandt, E.; Schmalfeldt, B.; Mahner, S.; Mueller, V.; Woelber, L. Patterns of Distant Metastases in Vulvar Cancer. Gynecol. Oncol. 2016, 142, 427–434. [Google Scholar] [CrossRef]
- Serrado, M.A.; Horta, M.; Cunha, T.M. State of the Art in Vulvar Cancer Imaging. Radiol. Bras. 2019, 52, 316–324. [Google Scholar] [CrossRef] [PubMed]
- Zhou, X.-L.; Zhu, W.-G.; Zhu, Z.-J.; Wang, W.-W.; Deng, X.; Tao, W.-J.; Ji, F.-Z.; Tong, Y.-S. Lymphopenia in Esophageal Squamous Cell Carcinoma: Relationship to Malnutrition, Various Disease Parameters, and Response to Concurrent Chemoradiotherapy. Oncologist 2019, 24, e677–e686. [Google Scholar] [CrossRef] [PubMed]
- McMillan, D.C. The Systemic Inflammation-Based Glasgow Prognostic Score: A Decade of Experience in Patients with Cancer. Cancer Treat. Rev. 2013, 39, 534–540. [Google Scholar] [CrossRef] [PubMed]
- Almasaudi, A.S.; Dolan, R.D.; Edwards, C.A.; McMillan, D.C. Hypoalbuminemia Reflects Nutritional Risk, Body Composition and Systemic Inflammation and Is Independently Associated with Survival in Patients with Colorectal Cancer. Cancers 2020, 12, 1986. [Google Scholar] [CrossRef] [PubMed]
- Cézé, N.; Thibault, G.; Goujon, G.; Viguier, J.; Watier, H.; Dorval, E.; Lecomte, T. Pre-Treatment Lymphopenia as a Prognostic Biomarker in Colorectal Cancer Patients Receiving Chemotherapy. Cancer Chemother. Pharmacol. 2011, 68, 1305–1313. [Google Scholar] [CrossRef]
- Zhang, X.; Tang, M.; Zhang, Q.; Zhang, K.-P.; Guo, Z.-Q.; Xu, H.-X.; Yuan, K.-T.; Yu, M.; Braga, M.; Cederholm, T.; et al. The GLIM Criteria as an Effective Tool for Nutrition Assessment and Survival Prediction in Older Adult Cancer Patients. Clin. Nutr. 2021, 40, 1224–1232. [Google Scholar] [CrossRef]
- Ringel, A.E.; Drijvers, J.M.; Baker, G.J.; Catozzi, A.; García-Cañaveras, J.C.; Gassaway, B.M.; Miller, B.C.; Juneja, V.R.; Nguyen, T.H.; Joshi, S.; et al. Obesity Shapes Metabolism in the Tumor Microenvironment to Suppress Anti-Tumor Immunity. Cell 2020, 183, 1848–1866.e26. [Google Scholar] [CrossRef]
- Tas, F.; Erturk, K. Elevated Erythrocyte Sedimentation Rate Is Associated with Metastatic Disease and Worse Survival in Patients with Cutaneous Malignant Melanoma. Mol. Clin. Oncol. 2017, 7, 1142–1146. [Google Scholar] [CrossRef][Green Version]
- Litao, M.K.S.; Kamat, D. Erythrocyte Sedimentation Rate and C-Reactive Protein: How Best to Use Them in Clinical Practice. Pediatr. Ann. 2014, 43, 417–420. [Google Scholar] [CrossRef]
- Go, D.J.; Lee, E.Y.; Lee, E.B.; Song, Y.W.; Konig, M.F.; Park, J.K. Elevated Erythrocyte Sedimentation Rate Is Predictive of Interstitial Lung Disease and Mortality in Dermatomyositis: A Korean Retrospective Cohort Study. J. Korean Med. Sci. 2016, 31, 389–396. [Google Scholar] [CrossRef]
- Strojnik, T.; Smigoc, T.; Lah, T.T. Prognostic Value of Erythrocyte Sedimentation Rate and C-Reactive Protein in the Blood of Patients with Glioma. Anticancer Res. 2014, 34, 339–347. [Google Scholar]
- Choi, Y.; Park, B.; Kim, K.; Jeong, B.C.; Seo, S.I.; Jeon, S.S.; Choi, H.Y.; Lee, J.E.; Lee, H.M. Erythrocyte Sedimentation Rate and Anaemia Are Independent Predictors of Survival in Patients with Clear Cell Renal Cell Carcinoma. Br. J. Cancer 2013, 108, 387–394. [Google Scholar] [CrossRef]
- Kornum, J.B.; Farkas, D.K.; Sværke, C.; Severinsen, M.T.; Thomsen, R.W.; Sørensen, H.T. Cancer Risk and Prognosis after a Hospital Contact for an Elevated Erythrocyte Sedimentation Rate. Cancer Epidemiol. Biomark. Prev. 2019, 28, 225–232. [Google Scholar] [CrossRef]
- De Monte, L.; Wörmann, S.; Brunetto, E.; Heltai, S.; Magliacane, G.; Reni, M.; Paganoni, A.M.; Recalde, H.; Mondino, A.; Falconi, M.; et al. Basophil Recruitment into Tumor-Draining Lymph Nodes Correlates with Th2 Inflammation and Reduced Survival in Pancreatic Cancer Patients. Cancer Res. 2016, 76, 1792–1803. [Google Scholar] [CrossRef]
- Yang, Z.; Zhang, Z.; Lin, F.; Ren, Y.; Liu, D.; Zhong, R.; Liang, Y. Comparisons of Neutrophil-, Monocyte-, Eosinophil-, and Basophil- Lymphocyte Ratios among Various Systemic Autoimmune Rheumatic Diseases. APMIS 2017, 125, 863–871. [Google Scholar] [CrossRef]
- Gruber, I.; Landenberger, N.; Staebler, A.; Hahn, M.; Wallwiener, D.; Fehm, T. Relationship Between Circulating Tumor Cells and Peripheral T-Cells in Patients with Primary Breast Cancer. Anticancer Res. 2013, 33, 2233 LP–2238 LP. [Google Scholar]
- Ruffell, B.; DeNardo, D.G.; Affara, N.I.; Coussens, L.M. Lymphocytes in Cancer Development: Polarization towards pro-Tumor Immunity. Cytokine Growth Factor Rev. 2010, 21, 3–10. [Google Scholar] [CrossRef]
- Milne, K.; Alexander, C.; Webb, J.R.; Sun, W.; Dillon, K.; Kalloger, S.E.; Gilks, C.B.; Clarke, B.; Köbel, M.; Nelson, B.H. Absolute Lymphocyte Count Is Associated with Survival in Ovarian Cancer Independent of Tumor-Infiltrating Lymphocytes. J. Transl. Med. 2012, 10, 33. [Google Scholar] [CrossRef]
- Kobayashi, N.; Usui, S.; Kikuchi, S.; Goto, Y.; Sakai, M.; Onizuka, M.; Sato, Y. Preoperative Lymphocyte Count Is an Independent Prognostic Factor in Node-Negative Non-Small Cell Lung Cancer. Lung Cancer 2012, 75, 223–227. [Google Scholar] [CrossRef]
- Yin, X.; Wu, L.; Yang, H.; Yang, H.B. Prognostic Significance of Neutrophil-Lymphocyte Ratio (NLR) in Patients with Ovarian Cancer: A Systematic Review and Meta-Analysis. Medicine 2019, 98, e17475. [Google Scholar] [CrossRef]
- Powell, D.R.; Huttenlocher, A. Neutrophils in the Tumor Microenvironment. Trends Immunol. 2016, 37, 41–52. [Google Scholar] [CrossRef] [PubMed]
- Zhang, Y.; Lu, J.J.; Du, Y.P.; Feng, C.X.; Wang, L.Q.; Chen, M. Bin Prognostic Value of Neutrophil-to-Lymphocyte Ratio and Platelet-to-Lymphocyte Ratio in Gastric Cancer. Medicine 2018, 97, e0144. [Google Scholar] [CrossRef] [PubMed]
- Baert, T.; Van Camp, J.; Vanbrabant, L.; Busschaert, P.; Laenen, A.; Han, S.; Van Nieuwenhuysen, E.; Vergote, I.; Coosemans, A. Influence of CA125, Platelet Count and Neutrophil to Lymphocyte Ratio on the Immune System of Ovarian Cancer Patients. Gynecol. Oncol. 2018, 150, 31–37. [Google Scholar] [CrossRef] [PubMed]
- Xiong, Y.; Zhao, N.; Zheng, Y.; Wang, J.; Wei, F.; Ren, X. Prognostic Value of Pretreatment Inflammatory Biomarkers in Advanced Lung Adenocarcinoma Patients Receiving First-Line Pemetrexed/Platinum Doublet. Tumor Biol. 2017, 39, 1010428317701639. [Google Scholar] [CrossRef] [PubMed]
- Gambichler, T.; Mansour, R.; Scheel, C.H.; Said, S.; Abu Rached, N.; Susok, L. Prognostic Performance of the Derived Neutrophil-to-Lymphocyte Ratio in Stage IV Melanoma Patients Treated with Immune Checkpoint Inhibitors. Dermato 2022, 2, 14–20. [Google Scholar] [CrossRef]
- Ren, K.; Yin, Y.; He, F.; Shao, Y.; Wang, S. Prognostic Role of Derived Neutrophil-to-Lymphocyte Ratio in Surgical Triple-Negative Breast Cancer. Cancer Manag. Res. 2018, 10, 4891–4898. [Google Scholar] [CrossRef]
- Abdulhadi, B.; Naranjo, M.; Krishnamoorthy, P.; Rangaswami, J. White Blood Cell Count To Platelet Ratio: A Novel Biomarker for Predicting Outcomes in Patients on Circulatory Support Devices. J. Am. Coll. Cardiol. 2018, 71, A810. [Google Scholar] [CrossRef]
- Horvathova, L.; Tillinger, A.; Sivakova, I.; Mikova, L.; Mravec, B.; Bucova, M. Chemical Sympathectomy Increases Neutrophil-to-Lymphocyte Ratio in Tumor-Bearing Rats but Does Not Influence Cancer Progression. J. Neuroimmunol. 2015, 278, 255–261. [Google Scholar] [CrossRef]
- He, Q.; Chen, C.; Yang, L. Predictive Value of Perioperative Monocyte Counts for Bacteremia and 90-Day All-Cause Mortality in Patients with Severe Burn. Prepr. Res. Sq. 2022, 1–18. [Google Scholar] [CrossRef]
- Stone, R.L.; Nick, A.M.; McNeish, I.A.; Balkwill, F.; Han, H.D.; Bottsford-Miller, J.; Rupairmoole, R.; Armaiz-Pena, G.N.; Pecot, C.V.; Coward, J.; et al. Paraneoplastic Thrombocytosis in Ovarian Cancer. N. Engl. J. Med. 2012, 366, 610–618. [Google Scholar] [CrossRef]
- Lin, R.J.; Afshar-Kharghan, V.; Schafer, A.I. Paraneoplastic Thrombocytosis: The Secrets of Tumor Self-Promotion. Blood 2014, 124, 184–187. [Google Scholar] [CrossRef]
- Pucci, F.; Rickelt, S.; Newton, A.P.; Garris, C.; Nunes, E.; Evavold, C.; Pfirschke, C.; Engblom, C.; Mino-Kenudson, M.; Hynes, R.O.; et al. PF4 Promotes Platelet Production and Lung Cancer Growth. Cell Rep. 2016, 17, 1764–1772. [Google Scholar] [CrossRef]
- Valle-Mendiola, A.; Gutiérrez-Hoya, A.; Lagunas-Cruz, M.D.C.; Weiss-Steider, B.; Soto-Cruz, I. Pleiotropic Effects of IL-2 on Cancer: Its Role in Cervical Cancer. Mediat. Inflamm. 2016, 2016, 2849523. [Google Scholar] [CrossRef]
- Kurtoglu, E.; Kokcu, A.; Celik, H.; Sari, S.; Tosun, M. Platelet Indices May Be Useful in Discrimination of Benign and Malign Endometrial Lesions, and Early and Advanced Stage Endometrial Cancer. Asian Pac. J. Cancer Prev. 2015, 16, 5397–5400. [Google Scholar] [CrossRef][Green Version]
- Nakamura, K.; Nakayama, K.; Tatsumi, N.; Minamoto, T.; Ishibashi, T.; Ohnishi, K.; Yamashita, H.; Ono, R.; Sasamori, H.; Razia, S.; et al. Prognostic Significance of Pre-treatment Neutrophil-to-lymphocyte and Platelet-to-lymphocyte Ratios in Non-surgically Treated Uterine Cervical Carcinoma. Mol. Clin. Oncol. 2018, 9, 138–144. [Google Scholar] [CrossRef]
- Gu, L.; Li, H.; Chen, L.; Ma, X.; Li, X.; Gao, Y.; Zhang, Y.; Xie, Y.; Zhang, X. Prognostic Role of Lymphocyte to Monocyte Ratio for Patients with Cancer: Evidence from a Systematic Review and Meta-Analysis. Oncotarget 2016, 7, 31926–31942. [Google Scholar] [CrossRef]
- Schmidt, H.; Bastholt, L.; Geertsen, P.; Christensen, I.J.; Larsen, S.; Gehl, J.; von der Maase, H. Elevated Neutrophil and Monocyte Counts in Peripheral Blood Are Associated with Poor Survival in Patients with Metastatic Melanoma: A Prognostic Model. Br. J. Cancer 2005, 93, 273–278. [Google Scholar] [CrossRef]
- Huang, H.; Liu, Q.; Zhu, L.; Zhang, Y.; Lu, X.; Wu, Y.; Liu, L. Prognostic Value of Preoperative Systemic Immune-Inflammation Index in Patients with Cervical Cancer. Sci. Rep. 2019, 9, 3284. [Google Scholar] [CrossRef]
- Nie, D.; Gong, H.; Mao, X.; Li, Z. Systemic Immune-Inflammation Index Predicts Prognosis in Patients with Epithelial Ovarian Cancer: A Retrospective Study. Gynecol. Oncol. 2019, 152, 259–264. [Google Scholar] [CrossRef]
- Yang, R.; Chang, Q.; Meng, X.; Gao, N.; Wang, W. Prognostic Value of Systemic Immune-Inflammation Index in Cancer: A Meta-Analysis. J. Cancer 2018, 9, 3295–3302. [Google Scholar] [CrossRef]
- Chen, J.-H.; Zhai, E.-T.; Yuan, Y.-J.; Wu, K.-M.; Xu, J.-B.; Peng, J.-J.; Chen, C.-Q.; He, Y.-L.; Cai, S.-R. Systemic Immune-Inflammation Index for Predicting Prognosis of Colorectal Cancer. World J. Gastroenterol. 2017, 23, 6261–6272. [Google Scholar] [CrossRef] [PubMed]
- Ji, Y.; Wang, H. Prognostic Prediction of Systemic Immune-Inflammation Index for Patients with Gynecological and Breast Cancers: A Meta-Analysis. World J. Surg. Oncol. 2020, 18, 197. [Google Scholar] [CrossRef]
- Khalfallah, M.; Jerraya, H.; Sbai, A.; Dougaz, W.; Changuel, A.; Nouira, R.; Bouasker, I.; Dziri, C. Prognostic Nutritional Index Score Is Useful to Predict Post-Operative Mortality and Morbidity in Gastric Cancer. Tunis Med. 2016, 94, 401–405. [Google Scholar] [PubMed]
- Osugi, J.; Muto, S.; Matsumura, Y.; Higuchi, M.; Suzuki, H.; Gotoh, M. Prognostic Impact of the High-Sensitivity Modified Glasgow Prognostic Score in Patients with Resectable Non-Small Cell Lung Cancer. J. Cancer Res. Ther. 2016, 12, 945–951. [Google Scholar] [CrossRef] [PubMed]
- Liu, Y.; Chen, S.; Zheng, C.; Ding, M.; Zhang, L.; Wang, L.; Xie, M.; Zhou, J. The Prognostic Value of the Preoperative C-Reactive Protein/Albumin Ratio in Ovarian Cancer. BMC Cancer 2017, 17, 285. [Google Scholar] [CrossRef]
- He, X.; Li, J.P.; Liu, X.H.; Zhang, J.P.; Zeng, Q.Y.; Chen, H.; Chen, S.L. Prognostic Value of C-Reactive Protein/Albumin Ratio in Predicting Overall Survival of Chinese Cervical Cancer Patients Overall Survival: Comparison among Various Inflammation Based Factors. J. Cancer 2018, 9, 1877–1884. [Google Scholar] [CrossRef]
- Han, Y.; Mao, F.; Wu, Y.; Fu, X.; Zhang, W.; Zhu, X.; Zhou, S.; Zhang, W.; Sun, Q.; Zhao, Y. Prognostic Role of C-Reactive Protein in Breast Cancer: A Systematic Review and Meta-Analysis. Int. J. Biol. Markers 2011, 26, 209–215. [Google Scholar] [CrossRef]
- Nakamura, M.; Bax, H.J.; Scotto, D.; Souri, E.A.; Sollie, S.; Harris, R.J.; Hammar, N.; Walldius, G.; Winship, A.; Ghosh, S.; et al. Immune Mediator Expression Signatures Are Associated with Improved Outcome in Ovarian Carcinoma. Oncoimmunology 2019, 8, e1593811. [Google Scholar] [CrossRef]
- Yang, D.; Li, H.; Sun, X.; Yang, S.; Wang, K.; Liu, Z. Clinical Usefulness of High Levels of C-Reactive Protein for Diagnosing Epithelial Ovarian Cancer. Sci. Rep. 2020, 10, 20056. [Google Scholar] [CrossRef]
- Li, J.; Jiao, X.; Yuan, Z.; Qiu, H.; Guo, R. C-Reactive Protein and Risk of Ovarian Cancer: A Systematic Review and Meta-Analysis. Medicine 2017, 96, e7822. [Google Scholar] [CrossRef]
- Thomas, I.; Amin, A.; Szczachor, J.; Rayner, S.; Wood, K.; Lim, M. The Predictive Value of the Modified Glasgow Prognostic Score (MGPS) in Determining Outcome Following Elective Colorectal Cancer Surgery. Color. Dis. 2016, 18, 21. [Google Scholar]
- Gorišek, B.; Miksić, N.G.; Krajnc, P.; Pakiž, M.; Turk, Z. The Role of Procalcitonin in Gynaecological Surgery. J. Int. Med. Res. 2009, 37, 918–926. [Google Scholar] [CrossRef]
- Rasjad, I.S.; Tjokroprawiro, B.A. The Role of Procalcitonin as a Prognostic Variable in Ovarian Cancer Patients at Dr. Soetomo General Hospital Surabaya. Indones. J. Cancer 2021, 15, 107. [Google Scholar] [CrossRef]
- Chaftari, A.M.; Hachem, R.; Reitzel, R.; Jordan, M.; Jiang, Y.; Yousif, A.; Garoge, K.; Deshmukh, P.; Al Hamal, Z.; Jabbour, J.; et al. Role of Procalcitonin and Interleukin-6 in Predicting Cancer, and Its Progression Independent of Infection. PLoS ONE 2015, 10, e0130999. [Google Scholar] [CrossRef]
- Nardone, V.; Giannicola, R.; Bianco, G.; Giannarelli, D.; Tini, P.; Pastina, P.; Falzea, A.C.; Macheda, S.; Caraglia, M.; Luce, A.; et al. Inflammatory Markers and Procalcitonin Predict the Outcome of Metastatic Non-Small-Cell-Lung-Cancer Patients Receiving PD-1/PD-L1 Immune-Checkpoint Blockade. Front. Oncol. 2021, 11, 68411. [Google Scholar] [CrossRef]
- Jun, J.C.; Rathore, A.; Younas, H.; Gilkes, D.; Polotsky, V.Y. Hypoxia-Inducible Factors and Cancer. Curr. Sleep Med. Rep. 2017, 3, 1–10. [Google Scholar] [CrossRef]
- Hashimoto, T.; Shibasaki, F. Hypoxia-Inducible Factor as an Angiogenic Master Switch. Front. Pediatr. 2015, 3, 33. [Google Scholar] [CrossRef]
- Hu, Z.; Tan, S.; Chen, S.; Qin, S.; Chen, H.; Qin, S.; Huang, Z.; Zhou, F.; Qin, X. Diagnostic Value of Hematological Parameters Platelet to Lymphocyte Ratio and Hemoglobin to Platelet Ratio in Patients with Colon Cancer. Clin. Chim. Acta 2020, 501, 48–52. [Google Scholar] [CrossRef]
- Mo, C.-J.; Hu, Z.-J.; Qin, S.-Z.; Chen, H.-P.; Huang, L.; Li, S.; Cao, Z. Diagnostic Value of Platelet-Lymphocyte Ratio and Hemoglobin-Platelet Ratio in Patients with Rectal Cancer. J. Clin. Lab. Anal. 2020, 34, e23153. [Google Scholar] [CrossRef]
- Cox, S.; Hurt, C.; Grenader, T.; Mukherjee, S.; Bridgewater, J.; Crosby, T. The Prognostic Value of Derived Neutrophil to Lymphocyte Ratio in Oesophageal Cancer Treated with Definitive Chemoradiotherapy. Radiother. Oncol. 2017, 125, 154–159. [Google Scholar] [CrossRef]
- Mikkola, A.; Aro, J.; Rannikko, S.; Ruutu, M. Prognostic Grouping of Metastatic Prostate Cancer Using Conventional Pretreatment Prognostic Factors. Scand. J. Urol. Nephrol. 2009, 43, 265–270. [Google Scholar] [CrossRef] [PubMed]
- Njoku, K.; Ramchander, N.C.; Wan, Y.L.; Barr, C.E.; Crosbie, E.J. Pre-Treatment Inflammatory Parameters Predict Survival from Endometrial Cancer: A Prospective Database Analysis. Gynecol. Oncol. 2022, 164, 146–153. [Google Scholar] [CrossRef] [PubMed]


| No | Surrogate Markers | Abbreviation | Formula | Ref. |
|---|---|---|---|---|
| 1. | Leukocyte-to-platelet ratio | LPR | [33] | |
| 2. | Neutrophil-to-lymphocyte ratio | NLR | [34] | |
| 3. | Derived neutrophil-to-lymphocyte ratio | dNLR | [34,35] | |
| 4. | Neutrophil-to-monocyte ratio | NMR | [36] | |
| 5. | Platelet-to-lymphocyte ratio | PLR | [34] | |
| 6. | Lymphocyte-to-monocyte ratio | LMR | [34] | |
| 7. | Basophil-to-monocyte ratio | BLR | [19] | |
| 8. | Systemic immune-inflammation index | SII | [7] | |
| 9. | Body-mass-index, albumin and NLR score | BAN score | [37,38] | |
| 10. | Haemoglobin-to-platelet ratio | HPR | [39] | |
| 11. | Prognostic nutritional index | PNI | [10 × albumin (g/dL)] + [0.005 × lymphocytes (count/μL)] | [40] |
| 12. | Modified Glasgow prognostic score | mGPS | Scoring ranges from 0 to 2:
| [41] |
| 13. | CRP-to-albumin ratio | CRP/Alb ratio | [38] | |
| 14. | CRP-to-procalcitonin ratio | CRP/PCT ratio | [42] |
| Inflammatory Markers | Overall Included Cases | Mean ± Standard Deviation or Median (Interquartile Range: 25–75% Quartile) | ||||||||
|---|---|---|---|---|---|---|---|---|---|---|
| Clinical Staging | Lymph Node Metastasis (LNM) | Distant Metastasis (DM) | ||||||||
| Early Stage/ I–II | Advanced Stage/ III–IV | p-Value | LNM (−) | LNM (+) | p-Value | DM (−) | DM (+) | p-Value | ||
| LPR * | 29.80 (20.30–50.25) | 25.95 (20.17–47.65) | 30.80 (21.00–52.27) | 0.510 a | 30.80 (20.30–51.80) | 29.00 (20.10–47.10) | 0.789 a | 26.65 (21.72–48.70) | 37.15 (18.85–52.27) | 0.789 a |
| NLR * | 6.27 (3.35–11.69) | 2.60 (2.17–7.10) | 6.74 (4.51–13.20) | 0.014 a | 6.19 (2.38–11.83) | 6.37 (4.23–12.31) | 0.421 a | 5.45 (2.63–11.22) | 7.44 (4.91–15.53) | 0.421 a |
| dNLR * | 3.52 (2.23–5.31) | 1.97 (1.53–4.34) | 3.71 (2.51–5.53) | 0.047 a | 3.52 (1.65–5.47) | 3.52 (2.55–4.88) | 0.749 a | 3.28 (1.98–5.02) | 3.97 (2.33–5.53) | 0.749 a |
| NMR * | 10.99 (8.77–14.90) | 10.99 (9.05–14.35) | 11.06 (8.76–15.15) | 0.920 a | 11.13 (9.24–13.95) | 10.65 (8.71–15.53) | 0.986 a | 10.99 (9.01–15.74) | 11.06 (8.08–13.54) | 0.986 a |
| PLR * | 251.73 (164.87–449.27) | 175.1 (156.3–259.4) | 262.0 (175.7–495.3) | 0.075 a | 244.8 (162.7–353.6) | 264.5 (172.3–545.6) | 0.202 a | 246.8 (164.8–450.5) | 259.2 (163.6–458.6) | 0.202 a |
| LMR * | 1.89 (1.17–2.92) | 2.84 (1.97–4.29) | 1.77 (1.10–2.67) | 0.007 a | 2.19 (1.16–3.08) | 1.76 (1.16–2.94) | 0.497 a | 2.25 (1.21–3.75) | 1.70 (0.97–2.21) | 0.497 a |
| BLR * | 0.03 (0.02–0.05) | 0.02 (0.17–0.32) | 0.03 (0.02–0.05) | 0.153 a | 0.03 (0.02–0.04) | 0.03 (0.02–0.06) | 0.526 a | 0.03 (0.02–0.04) | 0.04 (0.02–0.06) | 0.526 a |
| SII * | 2178.0 (1030.3–4006.0) | 1211.9 (836.0–2883.5) | 2263.8 (1371.9–4140.5) | 0.087 a | 1571.3 (970.3–3346.0) | 2256.2 (1362.7–4270.5) | 0.310 a | 1915.1 (932.2–4119.1) | 2332.2 (1440.0–3778.4) | 0.310 a |
| BAN score * | 111.52 (51.20–274.82) | 396.12 (71.72–541.26) | 105.34 (46.77–185.00) | 0.015 a | 115.81 (49.30–396.12) | 104.67 (53.73–189.34) | 0.371 a | 136.32 (63.30–348.67) | 100.83 (37.76–165.74) | 0.371 a |
| HPR * | 0.30 (0.23–0.45) | 0.33 (0.22–0.44) | 0.29 (0.23–0.48) | 0.795 a | 0.34 (0.23–0.48) | 0.28 (0.23–0.43) | 0.613 a | 0.32 (0.24–0.45) | 0.28 (0.21–0.50) | 0.613 a |
| ESR * | 95.00 (69.25–121.25) | 79.00 (50.75–100.75) | 105.00 (71.00–122.00) | 0.076 a | 87.00 (58.00–118.50) | 105.00 (77.00–122.00) | 0.343 a | 85.52 ± 36.47 | 102.12 ± 27.49 | 0.019 b |
| PNI score * | 41.03 ± 12.80 | 49.50 (39.75–54.25) | 39.00 (32.00–45.00) | 0.001 a | 41.00 (34.50–50.00) | 39.00 (32.00–45.50) | 0.165 a | 42.50 (34.00–50.00) | 38.50 (32.00–43.75) | 0.131 a |
| mGPS ** | 2.00 (0.00–2.00) | 0.00 (0.00–0.00) | 2.00 (0.00–2.00) | 0.009 a | 1.50 (0.00–2.00) | 2.00 (0.00–2.00) | 0.913 a | 1.50 (0.00–2.00) | 2.00 (0.00–2.00) | 0.913 a |
| CRP ** | 22.60 (6.11–165.90) | 3.95 (1.42–4.67) | 41.10 (8.10–176.70) | 0.005 a | 39.60 (3.97–195.87) | 18.10 (6.95–120.75) | 0.606 a | 16.46 (4.22–80.35) | 41.10 (6.30–190.70) | 0.606 a |
| Procalcitonin ** | 0.45 (0.15–1.96) | 0.05 c | 0.67 (0.18–2.29) | 0.044 a | 0.32 (0.12–1.10) | 0.67 (0.17–3.85) | 0.293 a | 0.31 (0.05–3.00) | 0.67 (0.29–1.10) | 0.293 a |
| CRP/Alb ratio ** | 9.63 (1.78–61.90) | 0.98 (0.37–1.14) | 10.28 (2.25–68.04) | 0.005 a | 10.07 (0.99–77.92) | 9.58 (1.85–34.64) | 0.691 a | 8.34 (1.04–21.52) | 10.28 (2.25–87.48) | 0.691 a |
| CRP/PCT ratio *** | 157.44 (31.45–273.05) | 124.72 c | 157.44 (22.89–343.61) | >0.999 a | 192.18 (54.44–544.29) | 64.57 (14.62–233.36) | 0.284 a | 77.28 (51.11–555.25) | 171.94 (18.13–273.05) | 0.284 a |
| Diagnostic Performance Indicators | Inflammatory Markers | ||||||||||||||||
|---|---|---|---|---|---|---|---|---|---|---|---|---|---|---|---|---|---|
| LPR | NLR | dNLR | NMR | PLR | LMR | BLR | SII | BAN | HPR | ESR | PNI | mGPS | CRP | Procalcitonin | CRP/Alb | CRP/PCT | |
| Clinical staging | |||||||||||||||||
| Cut-off | 22.70 | 2.83 | 2.075 | 15.765 | 202.14 | 2.205 | 0.035 | 1348.115 | 334.89 | 0.325 | 104 | 47.50 | 0.5 | 5.485 | 0.11 | 1.295 | 228.52 |
| AUC | 0.55 | 0.69 | 0.65 | 0.51 | 0.64 | 0.71 | 0.61 | 0.63 | 0.69 | 0.48 | 0.64 | 0.75 | 0.87 | 0.94 | 0.93 | 0.94 | 0.50 |
| p-value | 0.510 | 0.014 | 0.047 | 0.920 | 0.075 | 0.007 | 0.158 | 0.087 | 0.015 | 0.795 | 0.076 | 0.001 | 0.018 | 0.005 | 0.044 | 0.005 | >0.999 |
| Sensitivity | 72.06% | 86.76% | 85.29% | 23.53% | 69.12% | 67.65% | 48.53% | 76.47% | 89.71% | 52.94% | 51.47% | 80.88% | 74.07% | 92.59% | 86.21% | 92.60% | 31.80% |
| Specificity | 44.44% | 55.56% | 55.56% | 88.89% | 66.67% | 77.78% | 77.78% | 55.56% | 55.56% | 55.56% | 83.33% | 61.11% | 100% | 100% | 100% | 100% | 100% |
| CUI+ | 0.598 | 0.764 | 0.750 | 0.209 | 0.613 | 0.622 | 0.433 | 0.663 | 0.793 | 0.433 | 0.474 | 0.718 | 0.741 | 0.926 | 0.862 | 0.871 | 0.318 |
| CUI− | 0.132 | 0.292 | 0.278 | 0.209 | 0.242 | 0.302 | 0.222 | 0.214 | 0.327 | 0.132 | 0.260 | 0.280 | 0.364 | 0.667 | 0.333 | n/a | 0.118 |
| Lymph node metastasis | |||||||||||||||||
| Cut-off | 24.65 | 2.83 | 2.075 | 14.315 | 248.985 | 1.89 | 0.045 | 1413.135 | 238.45 | 0.325 | 87.5 | 47.50 | 1.50 | 5.485 | 2.72 | 1.295 | 880.665 |
| AUC | 0.48 | 0.55 | 0.52 | 0.50 | 0.58 | 0.54 | 0.54 | 0.56 | 0.56 | 0.53 | 0.56 | 0.59 | 0.51 | 0.44 | 0.61 | 0.46 | 0.37 |
| p-value | 0.789 | 0.421 | 0.749 | 0.986 | 0.202 | 0.497 | 0.531 | 0.310 | 0.371 | 0.613 | 0.344 | 0.165 | 0.921 | 0.606 | 0.293 | 0.691 | 0.284 |
| Sensitivity | 66.67% | 88.89% | 86.67% | 33.33% | 62.22% | 60.00% | 37.78% | 75.56% | 82.22% | 60.00% | 66.67% | 82.22% | 52.94% | 94.12% | 35.29% | 94.12% | 15.38% |
| Specificity | 39.02% | 34.10% | 34.10% | 78.05% | 56.1-% | 60.98% | 82.93% | 41.46% | 36.59% | 58.54% | 51.22% | 39.02% | 50.00% | 35.71% | 100% | 35.71% | 100% |
| CUI+ | 0.364 | 0.531 | 0.512 | 0.208 | 0.379 | 0.377 | 0.268 | 0.443 | 0.483 | 0.368 | 0.400 | 0.491 | 0.298 | 0.602 | 0.353 | 0.602 | 0.154 |
| CUI− | 0.201 | 0.252 | 0.239 | 0.403 | 0.323 | 0.355 | 0.455 | 0.252 | 0.239 | 0.334 | 0.299 | 0.260 | 0.233 | 0.298 | 0.560 | 0.298 | 0.500 |
| Distant Metastasis | |||||||||||||||||
| Cut-off | 34.15 | 5.67 | 3.455 | 9.535 | 223.965 | 2.34 | 0.035 | 1348.115 | 183.84 | 0.235 | 84 | 43.50 | 0.50 | 164.4 | 0.16 | 53.245 | 122.525 |
| AUC | 0.52 | 0.59 | 0.56 | 0.45 | 0.54 | 0.63 | 0.65 | 0.55 | 0.60 | 0.53 | 0.63 | 0.60 | 0.55 | 0.68 | 0.56 | 0.68 | 0.51 |
| p-value | 0.806 | 0.169 | 0.360 | 0.464 | 0.514 | 0.039 | 0.020 | 0.432 | 0.133 | 0.636 | 0.047 | 0.131 | 0.621 | 0.082 | 0.540 | 0.086 | 0.954 |
| Sensitivity | 56.25% | 68.75% | 65.62% | 65.62% | 68.75% | 81.25% | 65.62% | 84.38% | 84.38% | 37.50% | 84.38% | 75.00% | 73.33% | 46.67% | 93.33% | 46.67% | 66.67% |
| Specificity | 62.96% | 53.70% | 53.70% | 38.89% | 48.15% | 48.15% | 70.37% | 38.89% | 40.74% | 77.78% | 46.30% | 48.15% | 43.75% | 93.75% | 43.75% | 87.50% | 58.33% |
| CUI+ | 0.266 | 0.322 | 0.300 | 0.255 | 0.303 | 0.391 | 0.372 | 0.380 | 0.386 | 0.188 | 0.407 | 0.346 | 0.403 | 0.408 | 0.568 | 0.363 | 0.410 |
| CUI− | 0.446 | 0.399 | 0.389 | 0.255 | 0.348 | 0.391 | 0.546 | 0.314 | 0.332 | 0.527 | 0.386 | 0.368 | 0.278 | 0.611 | 0.383 | 0.557 | 0.371 |
| Inflammatory Markers | Clinical Staging | Total | Bivariate Analysis | Multivariate Analysis | |||
|---|---|---|---|---|---|---|---|
| Advanced | Early | Unadjusted OR (95%CI) | p-Value | Adjusted OR (95%CI) | p-Value | ||
| High LPR (≥22.70) | 49 (72.1%) | 10 (55.6%) | 59 (68.6%) | 2.06 (0.71–6.01) | 0.180 b,c | 1.04 (0.20–5.40) | 0.961 d |
| High NLR (≥2.83) | 59 (86.8%) | 8 (44.4%) | 67 (77.9%) | 8.19 (2.56–26.26) | <0.0001 a,c | 2.71 (0.19–38.14) | 0.460 d |
| High dNLR (≥2.075) | 58 (85.3%) | 8 (44.4%) | 66 (76.7%) | 7.25 (2.30–22.82) | 0.001 a,c | Not Defined (0) | >0.999 d |
| High NMR (≥15.765) | 16 (23.5%) | 2 (11.1%) | 18 (20.9%) | 2.46 (0.51–11.87) | 0.339 a | Not analysed | |
| High PLR (≥202.14) | 47 (69.1%) | 6 (33.3%) | 53 (61.6%) | 4.48 (1.48–13.54) | 0.006 b,c | 1.93 (0.43–8.65) | 0.389 d |
| Low LMR (≤2.205) | 46 (67.6%) | 4 (22.2%) | 50 (58.1%) | 7.32 (2.16–24.83) | 0.001 b,c | 3.80 (0.77–18.70) | 0.100 d |
| High BLR (≥0.035) | 33 (48.5%) | 4 (22.2%) | 37 (43.0%) | 3.33 (1.00–11.05) | 0.045 b,c | 0.73 (0.12–4.64) | 0.741 d |
| High SII (≥1348.115) | 52 (76.5%) | 8 (44.4%) | 60 (69.8%) | 4.06 (1.37–12.03) | 0.009 b,c | Not Defined (0) | >0.999 d |
| Low BAN score (≤334.89) | 61 (89.7%) | 8 (44.4%) | 69 (80.2%) | 10.89 (3.23–36.71) | <0.0001 a,c | 9.20 (2.61–32.45) | 0.001 d |
| Low HPR (≤0.325) | 36 (52.9%) | 8 (44.4%) | 44 (51.2%) | 1.41 (0.49–4.00) | 0.521 b | Not analysed | |
| High ESR (≥104) | 35 (51.5%) | 3 (16.7%) | 38 (44.2%) | 5.30 (1.41–20.00) | 0.008 b,c | 4.18 (1.01–17.32) | 0.048 d |
| Low PNI score (≤47.50) | 55 (80.9%) | 7 (38.9%) | 62 (72.1%) | 6.65 (2.16–20.46) | <0.0001 b,c | 1.43 (0.10–20.90) | 0.794 d |
| High mGPS (1–2) | 20 (74.1%) | 0 | 20 (64.5%) | n/a | 0.010 a | Not analysed | |
| High CRP (≥5.485) | 25 (92.6%) | 0 | 25 (80.6%) | n/a | <0.0001 a | Not analysed | |
| High PCT (≥0.11) | 25 (86.2%) | 0 | 25 (80.6%) | n/a | 0.032 a | Not analysed | |
| High CRP/Alb (≥1.295) | 27 (100%) | 4 (100%) | 31 (100%) | n/a | n/a | Not analysed | |
| High CRP/PCT (≥228.52) | 7 (31.8%) | 0 | 7 (29.2%) | n/a | >0.999 a | Not analysed | |
| Inflammatory Markers | LNM | Total | Bivariate Analysis | Multivariate Analysis | |||
|---|---|---|---|---|---|---|---|
| LNM (+) | LNM (−) | Unadjusted OR (95%CI) | p-Value | Adjusted OR (95%CI) | p-Value | ||
| High LPR (≥24.65) | 30 (66.7%) | 25 (61.0%) | 55 (64.0%) | 1.28 (0.53–3.09) | 0.583 a | Not analysed | |
| High NLR (≥2.83) | 40 (88.9%) | 27 (65.9%) | 67 (77.9%) | 4.15 (1.34–12.87) | 0.010 a,c | 4.15 (1.34–12.86) | 0.014 d |
| High dNLR (≥2.075) | 39 (86.7%) | 27 (65.9%) | 66 (76.7%) | 3.37 (1.15–9.87) | 0.022 a,c | Not Defined (0) | >0.999 d |
| High NMR (≥14.315) | 15 (33.3%) | 9 (22.0%) | 24 (27.9%) | 1.78 (0.68–4.67) | 0.240 a,c | 1.25 (0.38–4.19) | 0.712 d |
| High PLR (≥248.985) | 28 (62.2%) | 18 (43.9%) | 46 (53.5%) | 2.10 (0.89–4.98) | 0.089 a,c | 1.00 (0.29–3.50) | 0.989 d |
| Low LMR (≤1.89) | 27 (60.0%) | 16 (39.0%) | 43 (50.0%) | 2.34 (0.99–5.57) | 0.052 a,c | 1.74 (0.50–6.08) | 0.387 d |
| High BLR (≥0.045) | 17 (37.8%) | 7 (17.1%) | 24 (27.9%) | 2.95 (1.07–8.11) | 0.033 a,c | 2.05 (0.70–6.03) | 0.192 d |
| High SII (≥1413.135) | 34 (75.6%) | 24 (58.5%) | 58 (67.4%) | 2.19 (0.87–5.50) | 0.093 a,c | 0.39 (0.09–1.77) | 0.222 d |
| Low BAN score (≤238.45) | 37 (82.2%) | 26 (63.4%) | 63 (73.3%) | 2.67 (1.00–7.21) | 0.049 a,c | 0.31 (0.02–3.82) | 0.359 d |
| Low HPR (≤0.325) | 27 (60.0%) | 17 (41.5%) | 44 (51.2%) | 2.12 (0.89–5.01) | 0.086 a,c | 2.00 (0.82–4.90) | 0.127 d |
| High ESR (≥87.5) | 30 (66.7%) | 20 (48.8%) | 50 (58.1%) | 2.10 (0.88–5.02) | 0.093 a,c | 1.77 (0.69–4.55) | 0.237 d |
| Low PNI score (≤47.50) | 37 (82.2%) | 25 (61.0%) | 62 (72.1%) | 2.96 (1.10–7.96) | 0.028 a,c | 1.26 (0.25–6.29) | 0.780 d |
| High mGPS (2) | 9 (52.9%) | 7 (50.0%) | 16 (51.6%) | 1.12 (0.27–4.63) | 0.870 a | Not analysed | |
| High CRP (≥5.485) | 16 (94.1%) | 9 (64.3%) | 25 (80.6%) | 8.89 (0.89–88.40) | 0.067 b | Not analysed | |
| High PCT (≥2.72) | 6 (35.3%) | 0 | 6 (19.4%) | n/a | 0.021 b | Not analysed | |
| High CRP/Alb (≥1.295) | 16 (94.1%) | 9 (64.3%) | 25 (80.6%) | 8.89 (0.89–88.40) | 0.067 b | Not analysed | |
| High CRP/PCT (≥880.665) | 2 (15.4%) | 0 | 2 (8.3%) | n/a | 0.482 b | Not analysed | |
| Inflammatory Markers | Distant Metastasis (DM) | Total | Bivariate Analysis | Multivariate Analysis | |||
|---|---|---|---|---|---|---|---|
| DM (+) | DM (−) | Unadjusted OR (95%CI) | p-Value | Adjusted OR (95%CI) | p-Value | ||
| High LPR (≥34.15) | 18 (56.3%) | 20 (37.0%) | 38 (44.2%) | 2.19 (0.90–5.32) | 0.083 a,c | 1.06 (0.30–3.81) | 0.922 d |
| High NLR (≥5.67) | 22 (68.8%) | 25 (46.3%) | 47 (54.7%) | 2.55 (1.02–6.40) | 0.043 a,c | 0.71 (0.17–3.03) | 0.648 d |
| High dNLR (≥3.455) | 21 (65.6%) | 25 (46.3%) | 46 (53.5%) | 2.21 (0.90–5.47) | 0.082 a,c | 0.84 (0.12–5.86) | 0.859 d |
| High NMR (≥9.535) | 21 (65.6%) | 33 (61.1%) | 54 (62.8%) | 1.21 (0.49–3.02) | 0.676 a | Not analysed | |
| High PLR (≥223.965) | 22 (68.8%) | 28 (51.9%) | 50 (58.1%) | 2.04 (0.81–5.12) | 0.125 a,c | 0.81 (0.22–2.93) | 0.747 d |
| Low LMR (≤2.34) | 26 (81.3%) | 28 (51.9%) | 54 (62.8%) | 4.02 (1.42–11.34) | 0.006 a,c | 1.94 (0.51–7.45) | 0.332 d |
| High BLR (≥0.035) | 21 (65.6%) | 16 (29.6%) | 37 (43.0%) | 4.53 (1.78–11.54) | 0.001 a,c | 5.67 (2.02–15.87) | 0.001 d |
| High SII (≥1348.115) | 27 (84.4%) | 33 (61.1%) | 60 (69.8%) | 3.44 (1.14–10.32) | 0.023 a,c | 0.89 (0.07–11.12) | 0.930 d |
| Low BAN score (≤183.84) | 27 (84.4%) | 32 (59.3%) | 59 (68.6%) | 3.73 (1.24–11.13) | 0.015 a,c | 1.34 (0.18–9.90) | 0.772 d |
| Low HPR (≤0.235) | 12 (37.5%) | 12 (22.2%) | 24 (27.9%) | 2.10 (0.80–5.49) | 0.127 a,c | 1.90 (0.62–5.83) | 0.260 d |
| High ESR (≥84) | 27 (84.4%) | 29 (53.7%) | 56 (65.1%) | 4.65 (1.56–13.90) | 0.004 a,c | 6.01 (1.81–19.91) | 0.003 d |
| Low PNI score (≤43.50) | 24 (75.0%) | 28 (51.9%) | 52 (60.5%) | 2.79 (1.06–7.29) | 0.034 a,c | 0.82 (0.16–4.11) | 0.810 d |
| High mGPS (1–2) | 11 (64.7%) | 9 (64.3%) | 20 (64.5%) | 2.14 (0.47–9.70) | 0.320 a | Not analysed | |
| High CRP (≥164.4) | 7 (46.7%) | 1 (6.3%) | 8 (25.8%) | 13.12 (1.36–126.30) | 0.015 b | Not analysed | |
| High PCT (≥0.16) | 14 (93.3%) | 9 (56.3%) | 23 (74.2%) | 10.89 (1.14–103.98) | 0.037 b | Not analysed | |
| High CRP/Alb (≥53.245) | 7 (46.7%) | 2 (12.5%) | 9 (29.0%) | 6.12 (1.01–36.89) | 0.036 a | Not analysed | |
| High CRP/PCT (≥122.525) | 8 (66.7%) | 5 (41.7%) | 13 (54.2%) | 2.80 (0.53–14.73) | 0.219 a | Not analysed | |
Disclaimer/Publisher’s Note: The statements, opinions and data contained in all publications are solely those of the individual author(s) and contributor(s) and not of MDPI and/or the editor(s). MDPI and/or the editor(s) disclaim responsibility for any injury to people or property resulting from any ideas, methods, instructions or products referred to in the content. |
© 2022 by the authors. Licensee MDPI, Basel, Switzerland. This article is an open access article distributed under the terms and conditions of the Creative Commons Attribution (CC BY) license (https://creativecommons.org/licenses/by/4.0/).
Share and Cite
Winarto, H.; Habiburrahman, M.; Anggraeni, T.D.; Nuryanto, K.H.; Julianti, R.A.; Purwoto, G.; Andrijono, A. The Utility of Pre-Treatment Inflammation Markers as Associative Factors to the Adverse Outcomes of Vulvar Cancer: A Study on Staging, Nodal Involvement, and Metastasis Models. J. Clin. Med. 2023, 12, 96. https://doi.org/10.3390/jcm12010096
Winarto H, Habiburrahman M, Anggraeni TD, Nuryanto KH, Julianti RA, Purwoto G, Andrijono A. The Utility of Pre-Treatment Inflammation Markers as Associative Factors to the Adverse Outcomes of Vulvar Cancer: A Study on Staging, Nodal Involvement, and Metastasis Models. Journal of Clinical Medicine. 2023; 12(1):96. https://doi.org/10.3390/jcm12010096
Chicago/Turabian StyleWinarto, Hariyono, Muhammad Habiburrahman, Tricia Dewi Anggraeni, Kartiwa Hadi Nuryanto, Renny Anggia Julianti, Gatot Purwoto, and Andrijono Andrijono. 2023. "The Utility of Pre-Treatment Inflammation Markers as Associative Factors to the Adverse Outcomes of Vulvar Cancer: A Study on Staging, Nodal Involvement, and Metastasis Models" Journal of Clinical Medicine 12, no. 1: 96. https://doi.org/10.3390/jcm12010096
APA StyleWinarto, H., Habiburrahman, M., Anggraeni, T. D., Nuryanto, K. H., Julianti, R. A., Purwoto, G., & Andrijono, A. (2023). The Utility of Pre-Treatment Inflammation Markers as Associative Factors to the Adverse Outcomes of Vulvar Cancer: A Study on Staging, Nodal Involvement, and Metastasis Models. Journal of Clinical Medicine, 12(1), 96. https://doi.org/10.3390/jcm12010096