


Detectable Bias between Vascular Ultrasound Echo-Tracking Systems: Relevance Depends on Application
 , ,
, ,  , and
, and
Abstract
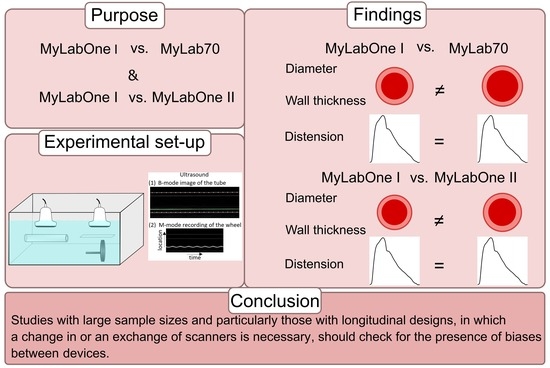
1. Introduction
2. Materials and Methods
2.1. Ultrasound Scanners
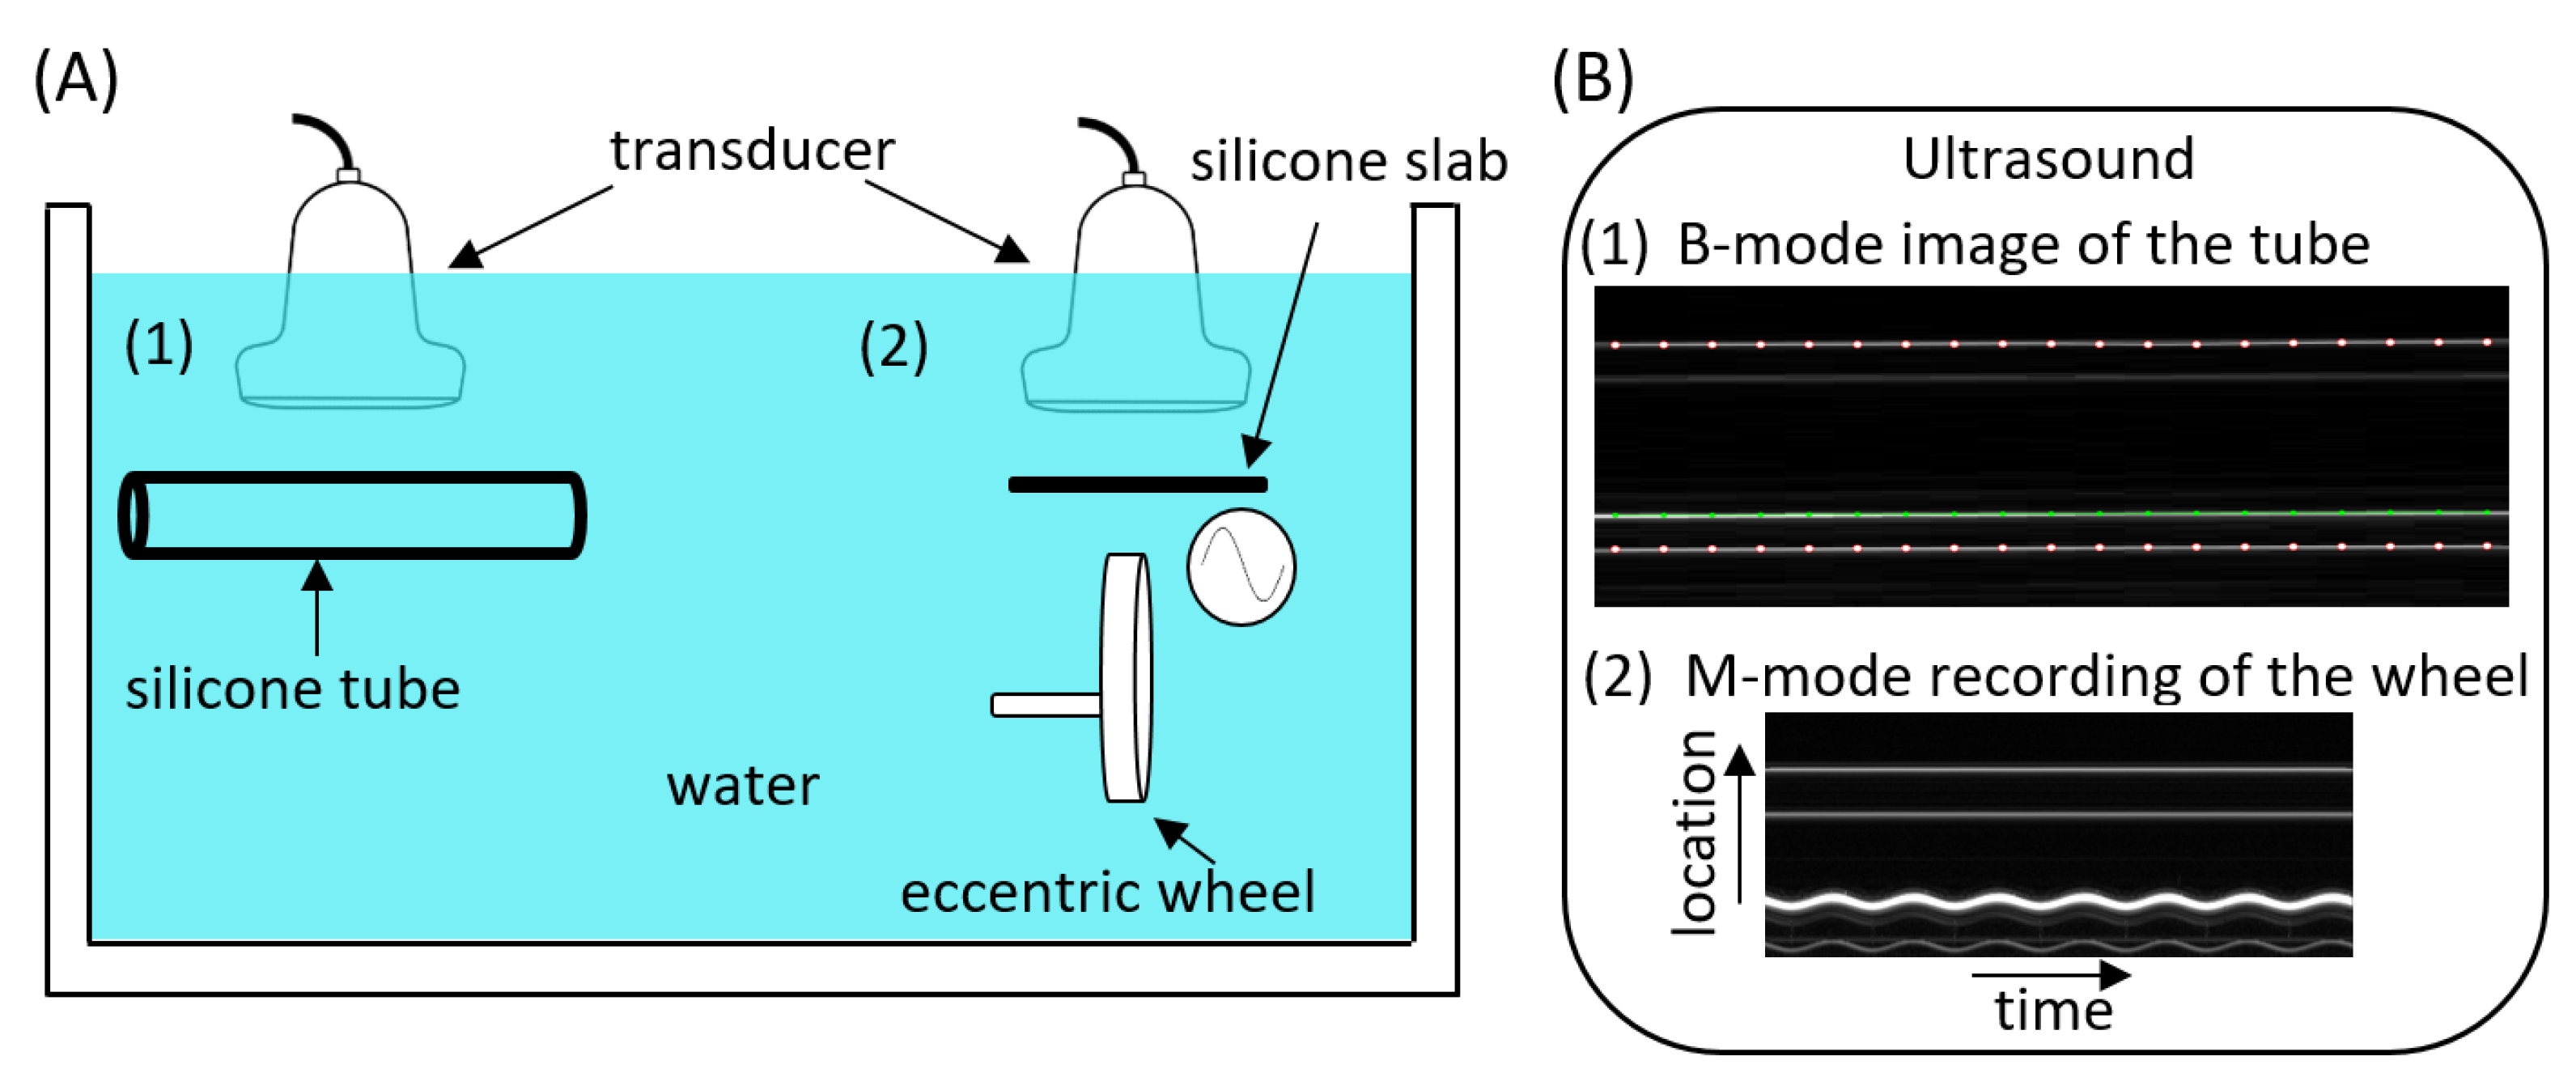
2.2. Phantom Configuration
2.3. Data Acquisition
2.4. Data Processing
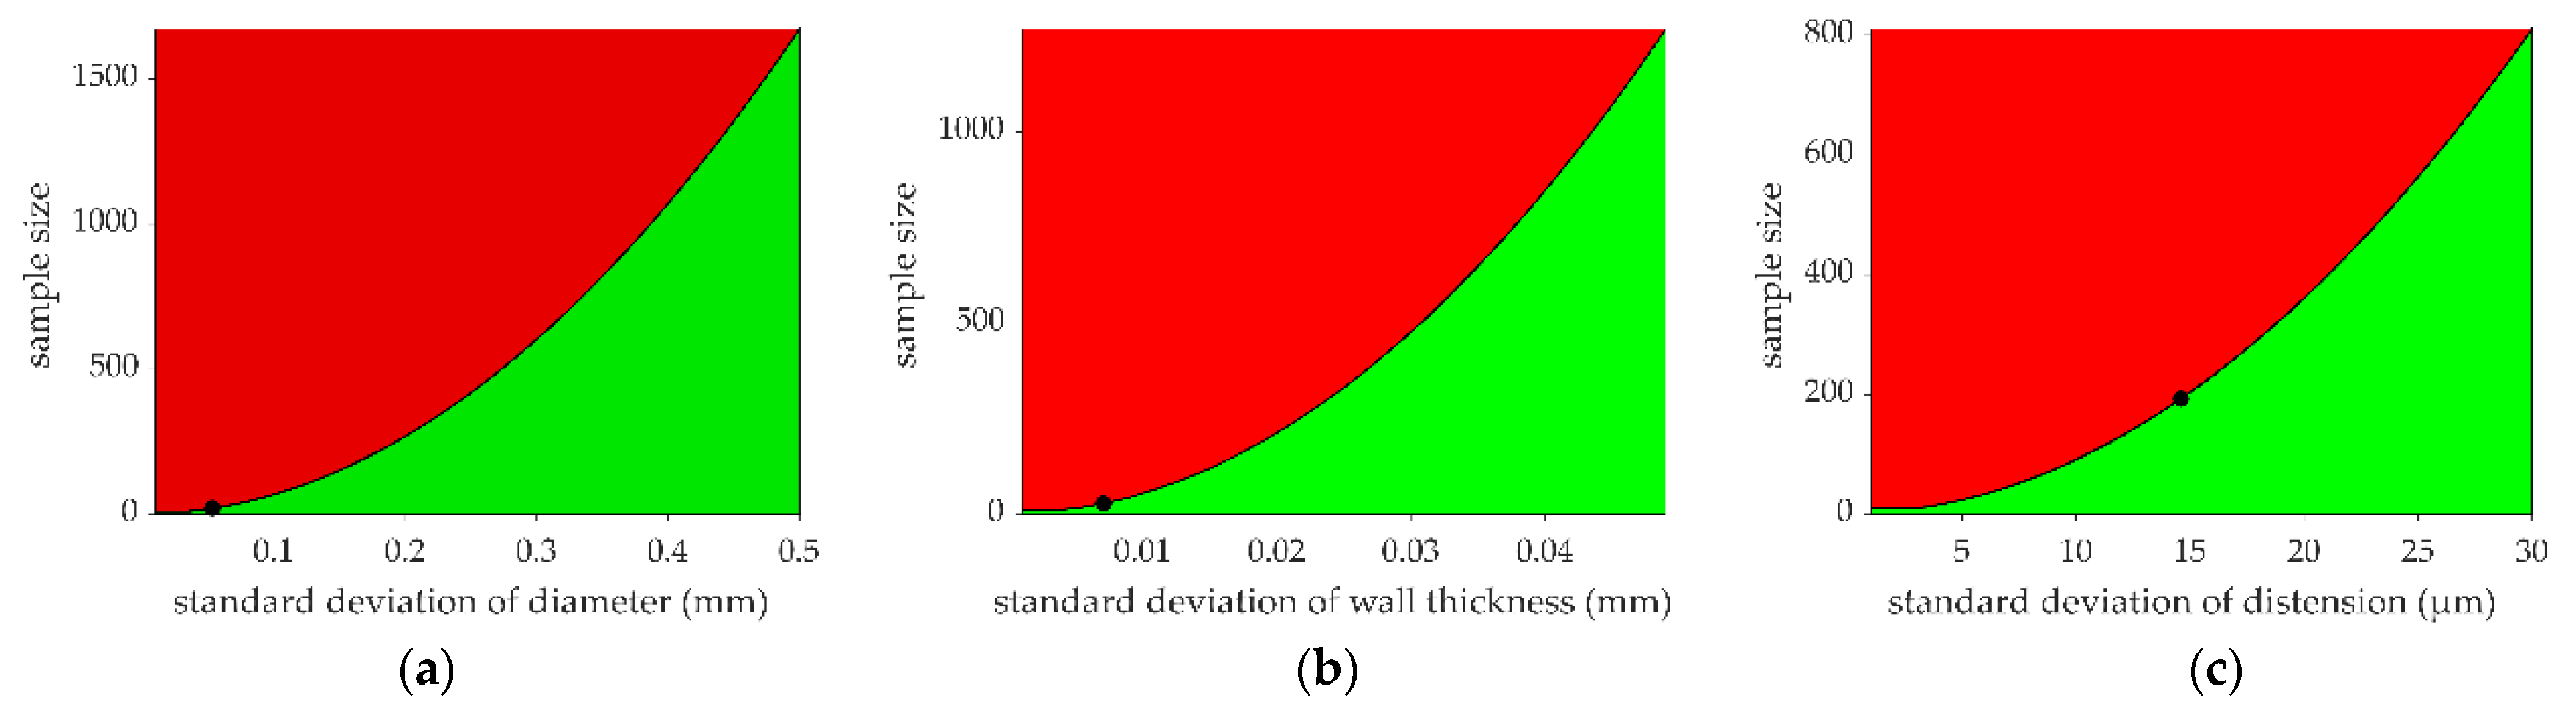
2.5. Statistical Analyses
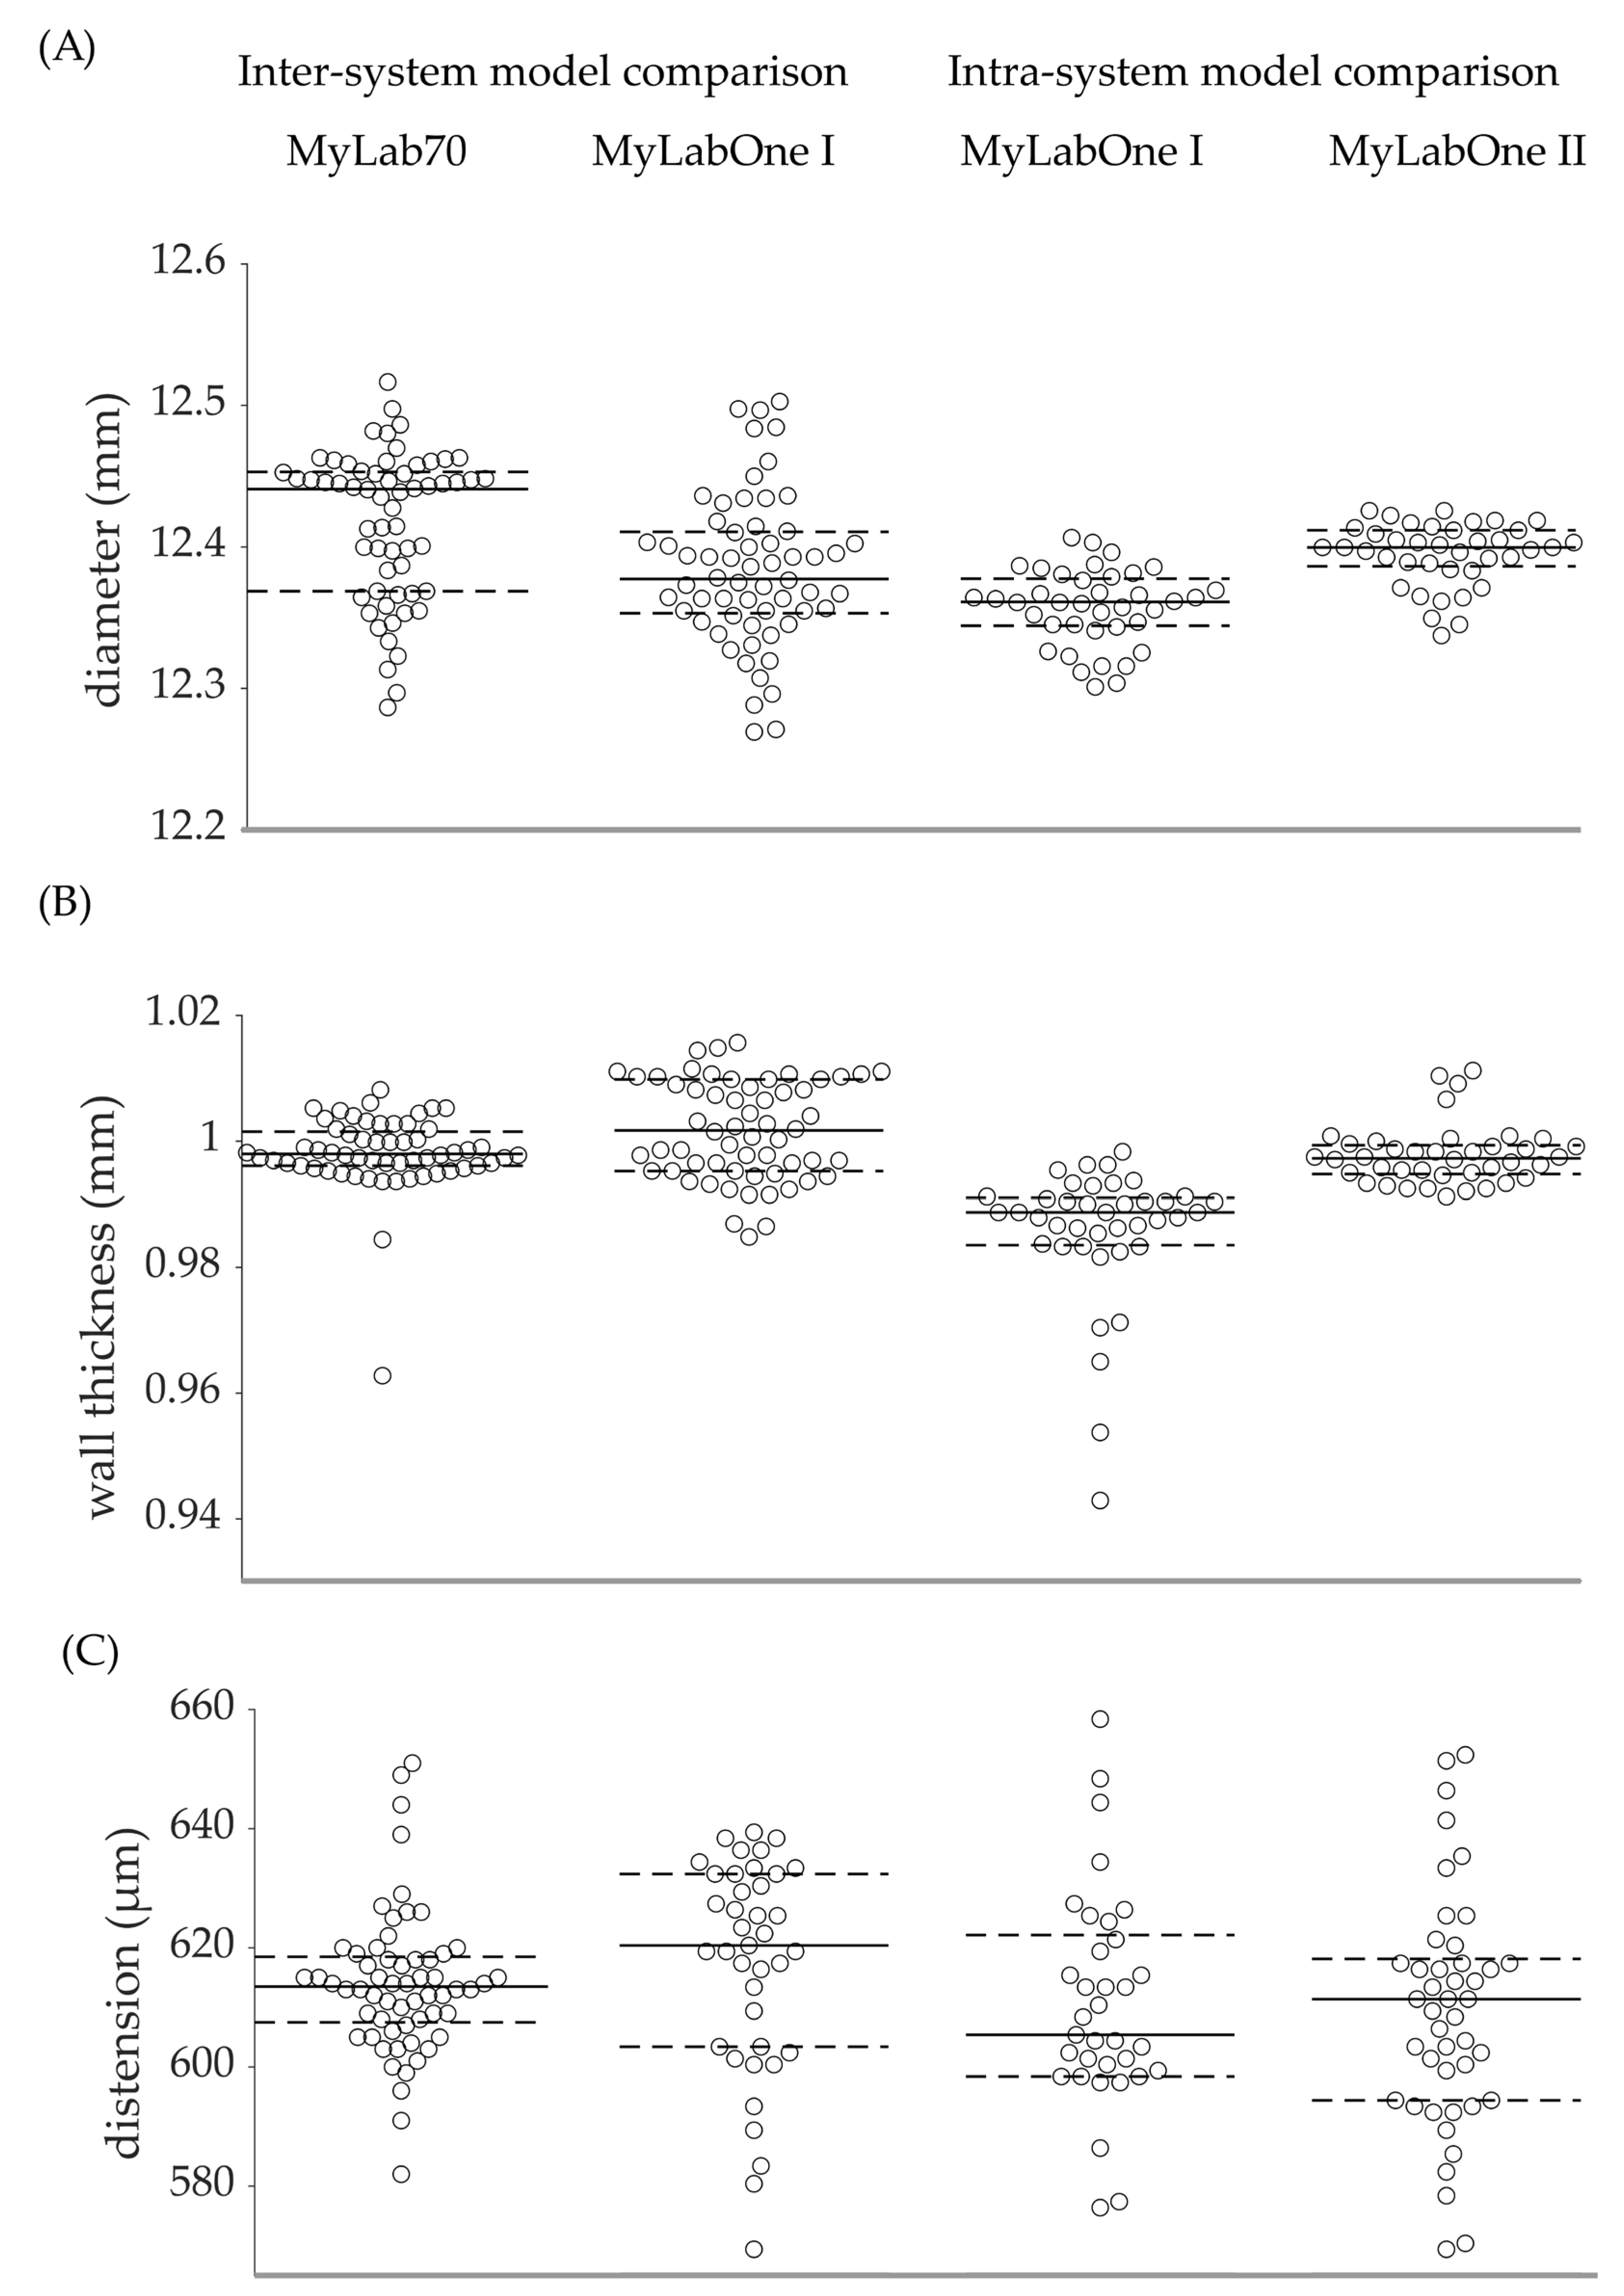
3. Results
3.1. MyLabOne I vs. MyLab70
3.2. MyLabOne I vs. MyLabOne II
3.3. MyLabOne I vs. MyLabOne I
4. Discussion
5. Conclusions
Author Contributions
Funding
Data Availability Statement
Acknowledgments
Conflicts of Interest
References
- Bozec, E.; Girerd, N.; Ferreira, J.P.; Latar, I.; Zannad, F.; Rossignol, P. Reproducibility in echotracking assessment of local carotid stiffness, diameter and thickness in a population-based study (The STANISLAS Cohort Study). Artery Res. 2020, 26, 5–12. [Google Scholar] [CrossRef]
- Hoeks, A.; Brands, P.; Smeets, F.; Reneman, R. Assessment of the distensibility of superficial arteries. Ultrasound Med. Biol. 1990, 16, 121–128. [Google Scholar] [CrossRef] [PubMed]
- Morganti, T.; Ricci, S.; Vittone, F.; Palombo, C.; Tortoli, P. Clinical validation of common carotid artery wall distension assessment based on multigate Doppler processing. Ultrasound Med. Biol. 2005, 31, 937–945. [Google Scholar] [CrossRef] [PubMed]
- Palombo, C.; Kozakova, M.; Guraschi, N.; Bini, G.; Cesana, F.; Castoldi, G.; Stella, A.; Morizzo, C.; Giannattasio, C. Radiofrequency-based carotid wall tracking: A comparison between two different systems. J. Hypertens. 2012, 30, 1614–1619. [Google Scholar] [CrossRef] [PubMed]
- Baldassarre, D.; Hamsten, A.; Veglia, F.; De Faire, U.; Humphries, S.E.; Smit, A.J.; Giral, P.; Kurl, S.; Rauramaa, R.; Mannarino, E. Measurements of carotid intima-media thickness and of interadventitia common carotid diameter improve prediction of cardiovascular events: Results of the IMPROVE (Carotid Intima Media Thickness [IMT] and IMT-Progression as Predictors of Vascular Events in a High Risk European Population) study. J. Am. Coll. Cardiol. 2012, 60, 1489–1499. [Google Scholar] [PubMed]
- Jensen-Urstad, K.; Jensen-Urstad, M.; Johansson, J. Carotid artery diameter correlates with risk factors for cardiovascular disease in a population of 55-year-old subjects. Stroke 1999, 30, 1572–1576. [Google Scholar] [CrossRef] [PubMed]
- Laurent, S.; Boutouyrie, P.; Asmar, R.; Gautier, I.; Laloux, B.; Guize, L.; Ducimetiere, P.; Benetos, A. Aortic stiffness is an independent predictor of all-cause and cardiovascular mortality in hypertensive patients. Hypertension 2001, 37, 1236–1241. [Google Scholar] [CrossRef] [PubMed]
- Engelen, L.; Bossuyt, J.; Ferreira, I.; van Bortel, L.M.; Reesink, K.D.; Segers, P.; Stehouwer, C.D.; Laurent, S.; Boutouyrie, P.; Collaboration, R.V.f.A.M. Reference values for local arterial stiffness. Part A: Carotid artery. J. Hypertens. 2015, 33, 1981–1996. [Google Scholar] [CrossRef] [PubMed]
- Malik, A.E.; Delhaas, T.; Spronck, B.; Henry, R.; Joseph, J.; Stehouwer, C.D.; Mess, W.H.; Reesink, K.D. Single M-Line is as reliable as multiple M-line ultrasound for carotid artery screening. Front. Physiol. 2021, 2265, 787083. [Google Scholar] [CrossRef] [PubMed]
- Reneman, R.S.; Meinders, J.M.; Hoeks, A.P. Non-invasive ultrasound in arterial wall dynamics in humans: What have we learned and what remains to be solved. Eur. Heart J. 2005, 26, 960–966. [Google Scholar] [CrossRef] [PubMed][Green Version]
- Brands, P.J.; Hoeks, A.P.; Willigers, J.; Willekes, C.; Reneman, R.S. An integrated system for the non-invasive assessment of vessel wall and hemodynamic properties of large arteries by means of ultrasound. Eur. J. Ultrasound 1999, 9, 257–266. [Google Scholar] [CrossRef] [PubMed]
- Hoeks, A.P.; Willekes, C.; Boutouyrie, P.; Brands, P.J.; Willigers, J.M.; Reneman, R.S. Automated detection of local artery wall thickness based on M-line signal processing. Ultrasound Med. Biol. 1997, 23, 1017–1023. [Google Scholar] [CrossRef] [PubMed]
- Kozakova, M.; Morizzo, C.; La Carrubba, S.; Fabiani, I.; Della Latta, D.; Jamagidze, J.; Chiappino, D.; Di Bello, V.; Palombo, C. Associations between common carotid artery diameter, Framingham risk score and cardiovascular events. Nutr. Metab. Cardiovasc. Dis. 2017, 27, 329–334. [Google Scholar] [CrossRef] [PubMed]
- Schram, M.T.; Sep, S.J.; van der Kallen, C.J.; Dagnelie, P.C.; Koster, A.; Schaper, N.; Henry, R.; Stehouwer, C.D. The Maastricht Study: An extensive phenotyping study on determinants of type 2 diabetes, its complications and its comorbidities. Eur. J. Epidemiol. 2014, 29, 439–451. [Google Scholar] [CrossRef] [PubMed]
- Spronck, B.; Heusinkveld, M.H.; Vanmolkot, F.H.; Op’t Roodt, J.; Hermeling, E.; Delhaas, T.; Kroon, A.A.; Reesink, K.D. Pressure-dependence of arterial stiffness: Potential clinical implications. J. Hypertens. 2015, 33, 330–338. [Google Scholar] [CrossRef] [PubMed]
- Brands, P.J.; Hoeks, A.P.; Ledoux, L.A.; Reneman, R.S. A radio frequency domain complex cross-correlation model to estimate blood flow velocity and tissue motion by means of ultrasound. Ultrasound Med. Biol. 1997, 23, 911–920. [Google Scholar] [CrossRef] [PubMed]
- Rossi, A.C.; Brands, P.J.; Hoeks, A.P. Nonlinear processing in B-mode ultrasound affects carotid diameter assessment. Ultrasound Med. Biol. 2009, 35, 736–747. [Google Scholar] [CrossRef] [PubMed]
- Faul, F.; Erdfelder, E.; Buchner, A.; Lang, A.-G. Statistical power analyses using G* Power 3.1: Tests for correlation and regression analyses. Behav. Res. Methods 2009, 41, 1149–1160. [Google Scholar] [CrossRef] [PubMed]


| MyLab70 | MyLabOne I & II | |
|---|---|---|
| Operating frequency (MHz) | 7.5 | 10 |
| RF sampling frequency (MHz) | 50 | 33 |
| Frame rate (fps) | 498 | 524 |
| No. of M-lines | 19 | 14 |
| Practical * axial resolution (mm) | 0.125 | 0.120 |
| Approx. cost | 120 k | 25 k |
| RF wall tracking | ART.LAB | RF module |
| RF output format | .r70 | .zrf |
| Inter-system model comparison | ||||||
| Bias (95% CI) | p | |||||
| Absolute | Relative (%) | |||||
| MyLabOne I | MyLab70 | |||||
| Diameter (mm) | n | 60 | 60 | |||
| Mean | 12.3830 | 12.4170 | −0.0339 (−0.0530 to −0.0147) | −0.27 (−0.43 to −0.12) | 0.001 | |
| SD | 0.0533 | 0.0527 | 0.542 | |||
| Wall thickness (mm) | n | 60 | 60 | |||
| Mean | 1.0019 | 0.9981 | 0.0038 (0.0013 to 0.0064) | 0.38 (0.13 to 0.63) | 0.004 | |
| SD | 0.0079 | 0.0062 | <0.001 | |||
| Distension (µm) | n | 39 | 60 | |||
| Mean | 617.0 | 614.1 | 2.9 (−3.0 to 8.8) | 0.48 (−0.56 to 1.51) | 0.333 | |
| SD | 17.8 | 12.1 | 0.047 | |||
| Intra-system model comparison | ||||||
| MyLabOne I | MyLabOne II | |||||
| Diameter (mm) | n | 40 | 40 | |||
| Mean | 12.3569 | 12.3945 | −0.0376 (−0.0484 to −0.0268) | −0.30 (−0.39 to −0.22) | <0.001 | |
| SD | 0.0222 | 0.0267 | 0.343 | |||
| Wall thickness (mm) | n | 40 | 40 | |||
| Mean | 0.9855 | 0.9976 | −0.0121 (−0.0159 to −0.0084) | −1.23 (−1.60 to −0.85) | <0.001 | |
| SD | 0.0110 | 0.0048 | 0.013 | |||
| Distension (µm) | n | 37 | 45 | |||
| Mean | 609.5 | 610.2 | −0.7 (−11.0 to 9.6) | −0.12 (−1.81 to 1.52) | 0.892 | |
| SD | 25.5 | 21.4 | 0.591 | |||
| Intra-device comparison | ||||||
| MyLabOne I 1st set | MyLabOne I 2nd set | |||||
| Diameter (mm) | n | 30 | 30 | |||
| Mean | 12.3824 | 12.3837 | −0.0012 (−0.0284 to 0.0260) | −0.01 (−0.23 to 0.21) | 0.929 | |
| SD | 0.0500 | 0.0573 | 0.257 | |||
| Wall thickness (mm) | n | 30 | 30 | |||
| Mean | 1.0006 | 1.0032 | −0.0026 (−0.0066 to 0.0013) | −0.26 (−0.66 to 0.13) | 0.198 | |
| SD | 0.0086 | 0.0070 | 0.364 | |||
| Distension (µm) | n | 20 | 19 | |||
| Mean | 615.2 | 618.8 | −3.6 (−14.8 to 7.6) | −0.59 (−2.41 to 1.23) | 0.529 | |
| SD | 18.9 | 16.8 | 0.697 | |||
| Variable | Study | Type of Data | Compared Devices | n | Absolute Bias | Relative Bias (%) |
|---|---|---|---|---|---|---|
| Diameter (mm) | Bozec et al., 2020 [1] | Carotid artery | Wall tracking system (WTS) and ART.LAB | 188 | 0.119 | 1.8 |
| Palombo et al., 2012 [4] | Carotid artery | Two RF-based systems | 105 | 0.263 | 3.4 | |
| Morganti et al., 2005 [3] | Carotid artery | Multigate Doppler system against commercially available ultrasound device | 37 | 0.05 | 0.7 | |
| This study, 2022 | Phantom set-up | Esaote MyLabOne I and MyLab70 | 60 | 0.0339 | 0.27 | |
| Wall thickness (mm) | Bozec et al., 2020 [1] | Carotid artery | WTS and ART.LAB | 186 | 0.046 | 6.1 |
| This study, 2022 | Phantom set-up | Esaote MyLabOne I and MyLab70 | 60 | 0.0038 | 0.38 | |
| Distension (µm) | Bozec et al., 2020 [1] | Carotid artery | WTS and ART.LAB | 181 | 23 | 4.3 |
| Palombo et al., 2012 [4] | Carotid artery | Two RF-based systems | 105 | 91 | 22 | |
| Morganti et al., 2005 [3] | Carotid artery | Multigate Doppler system against commercially available ultrasound device | 37 | 34 | 6.8 | |
| This study, 2022 | Phantom set-up | Esaote MyLabOne I and MyLab70 | 39 and 60 | 2.9 | 0.48 |
Disclaimer/Publisher’s Note: The statements, opinions and data contained in all publications are solely those of the individual author(s) and contributor(s) and not of MDPI and/or the editor(s). MDPI and/or the editor(s) disclaim responsibility for any injury to people or property resulting from any ideas, methods, instructions or products referred to in the content. |
© 2022 by the authors. Licensee MDPI, Basel, Switzerland. This article is an open access article distributed under the terms and conditions of the Creative Commons Attribution (CC BY) license (https://creativecommons.org/licenses/by/4.0/).
Share and Cite
Malik, A.E.F.; Giudici, A.; van der Laan, K.W.F.; Op ’t Roodt, J.; Mess, W.H.; Delhaas, T.; Spronck, B.; Reesink, K.D. Detectable Bias between Vascular Ultrasound Echo-Tracking Systems: Relevance Depends on Application. J. Clin. Med. 2023, 12, 69. https://doi.org/10.3390/jcm12010069
Malik AEF, Giudici A, van der Laan KWF, Op ’t Roodt J, Mess WH, Delhaas T, Spronck B, Reesink KD. Detectable Bias between Vascular Ultrasound Echo-Tracking Systems: Relevance Depends on Application. Journal of Clinical Medicine. 2023; 12(1):69. https://doi.org/10.3390/jcm12010069
Chicago/Turabian StyleMalik, Afrah E. F., Alessandro Giudici, Koen W. F. van der Laan, Jos Op ’t Roodt, Werner H. Mess, Tammo Delhaas, Bart Spronck, and Koen D. Reesink. 2023. "Detectable Bias between Vascular Ultrasound Echo-Tracking Systems: Relevance Depends on Application" Journal of Clinical Medicine 12, no. 1: 69. https://doi.org/10.3390/jcm12010069
APA StyleMalik, A. E. F., Giudici, A., van der Laan, K. W. F., Op ’t Roodt, J., Mess, W. H., Delhaas, T., Spronck, B., & Reesink, K. D. (2023). Detectable Bias between Vascular Ultrasound Echo-Tracking Systems: Relevance Depends on Application. Journal of Clinical Medicine, 12(1), 69. https://doi.org/10.3390/jcm12010069