
Diagnostic Accuracy of the Artificial Intelligence Methods in Medical Imaging for Pulmonary Tuberculosis: A Systematic Review and Meta-Analysis

Abstract
1. Introduction
2. Materials and Methods
2.1. Data Source and Search Strategy
2.2. Study Selection
2.3. Data Extraction
2.4. Quality Assessment
2.5. Data Synthesis and Analysis
3. Results
3.1. Identification of Studies and Study Characteristics
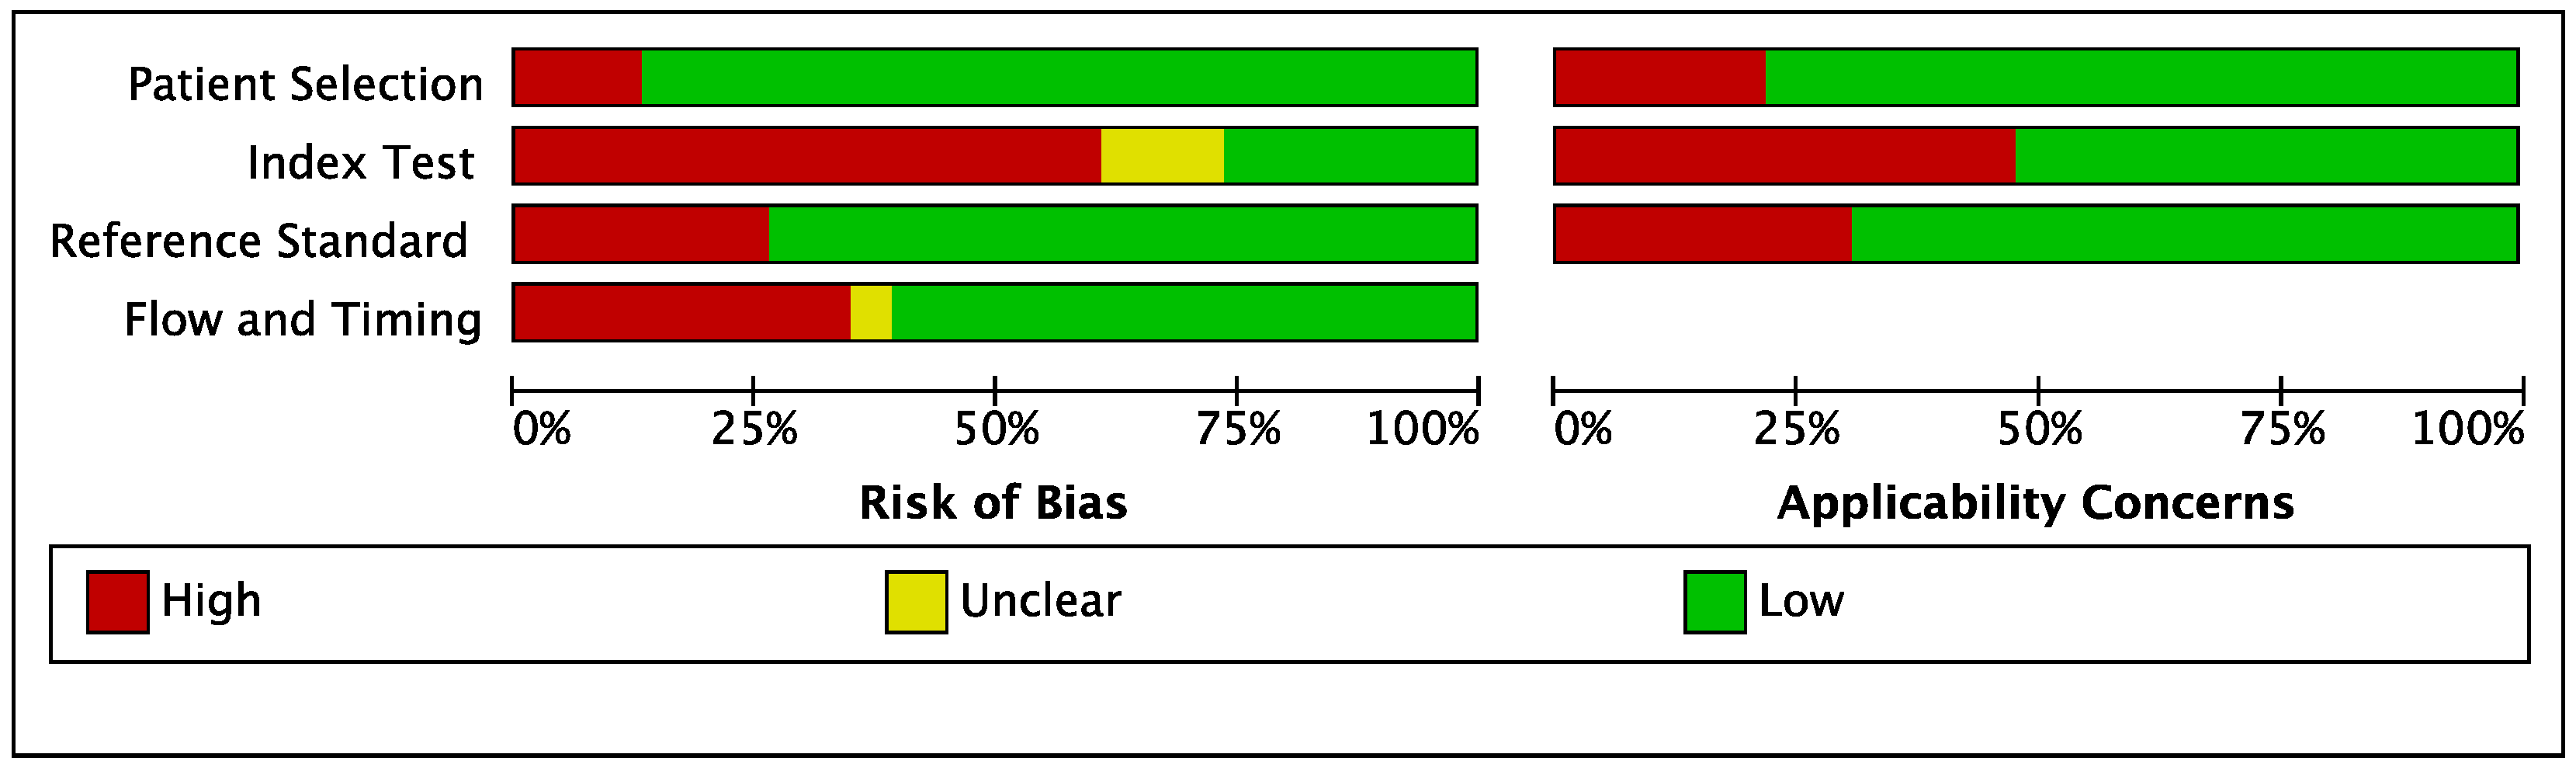
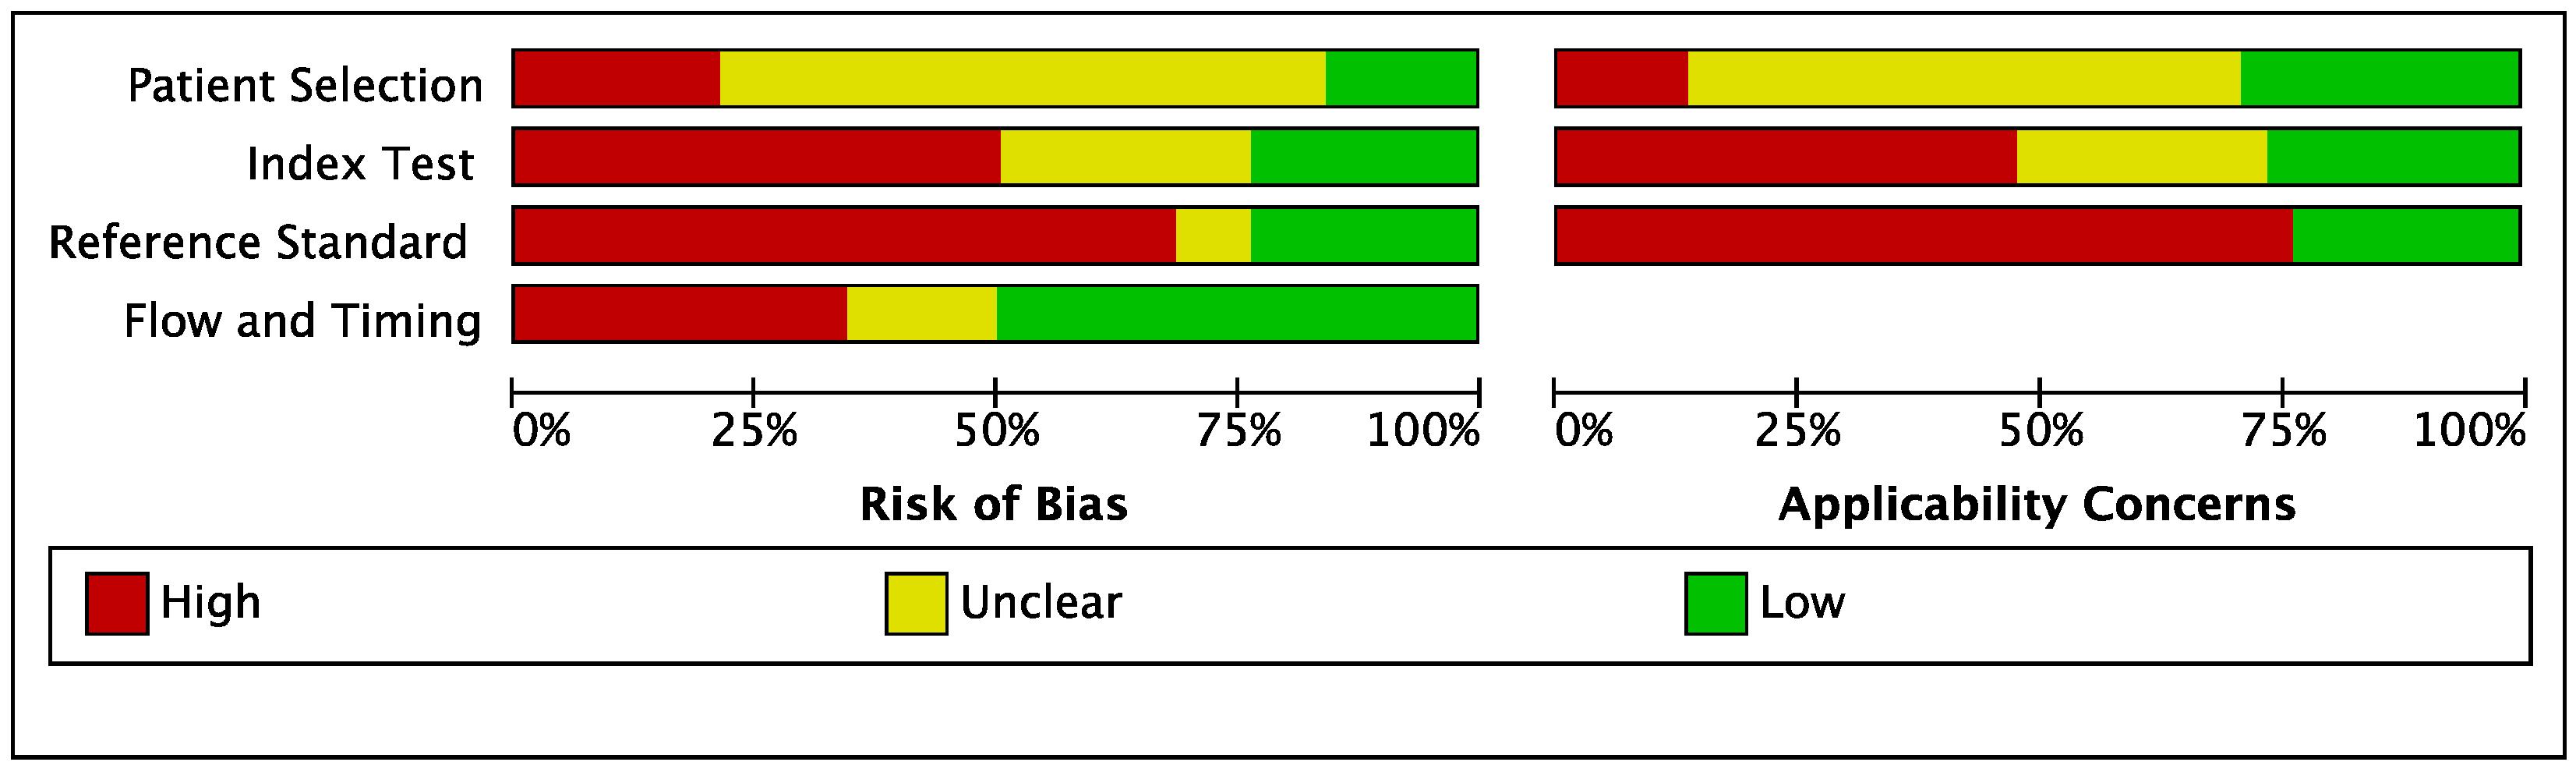
3.2. Quality Assessment of Studies
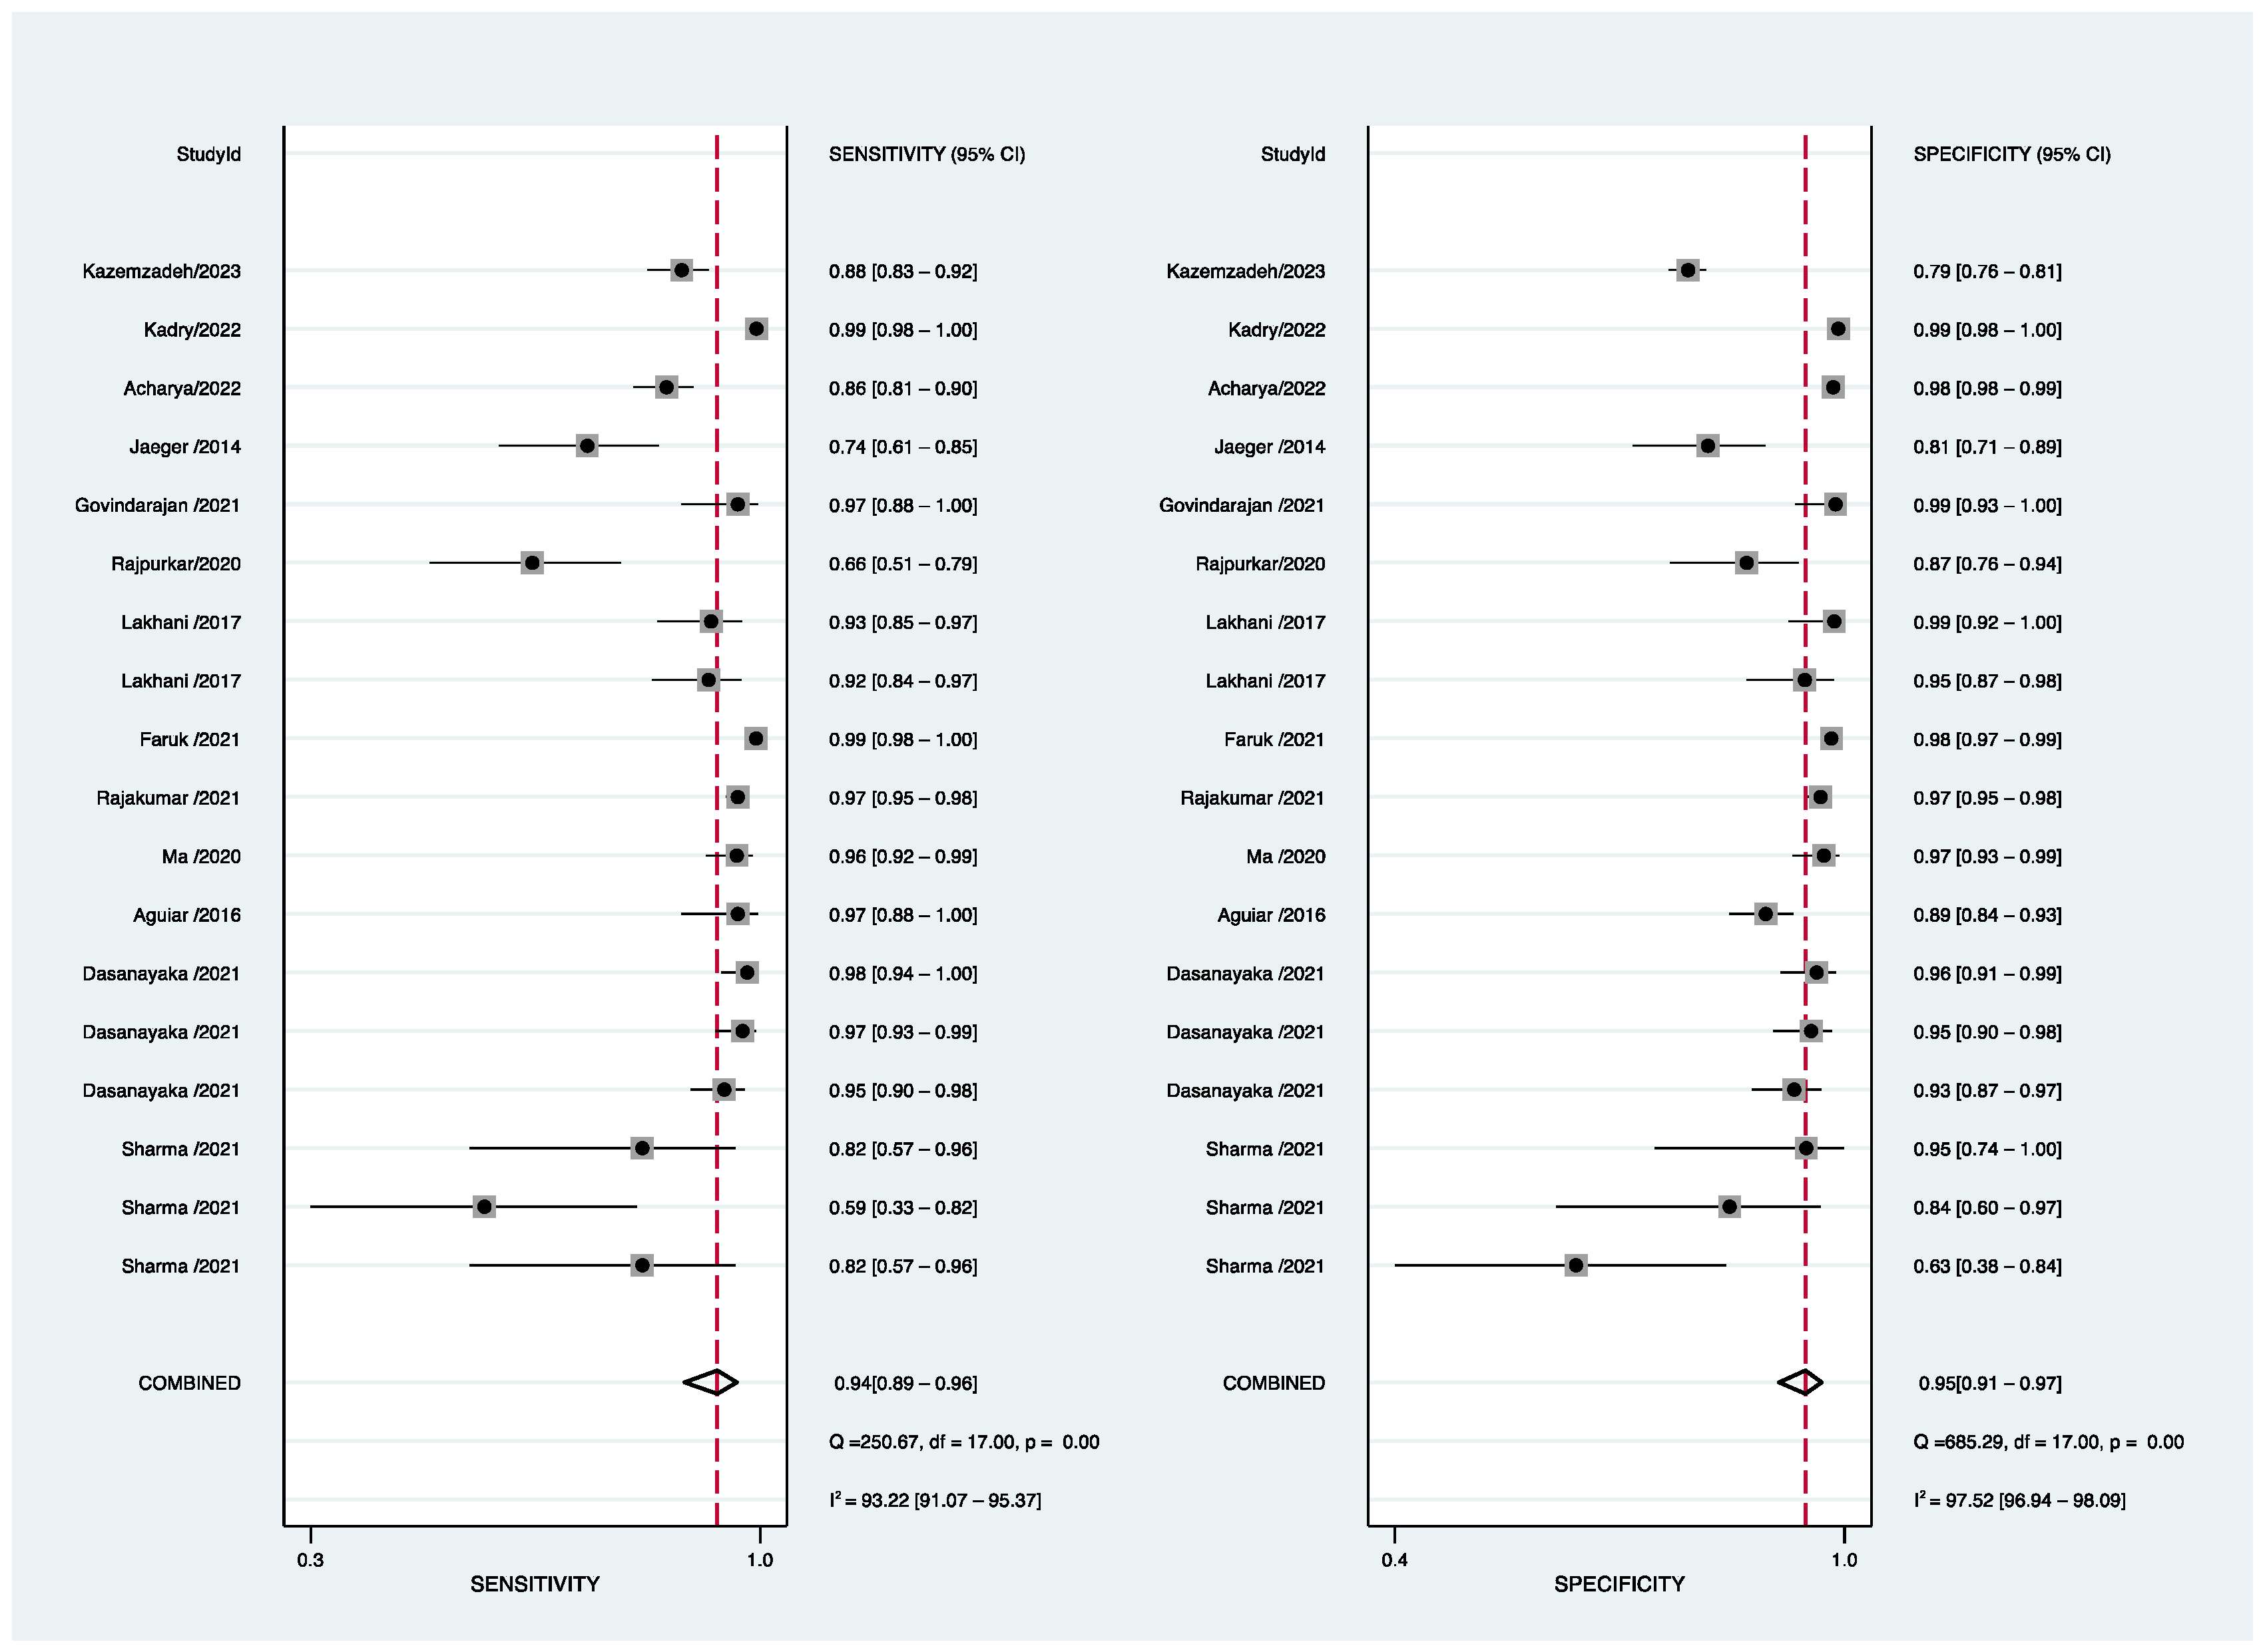
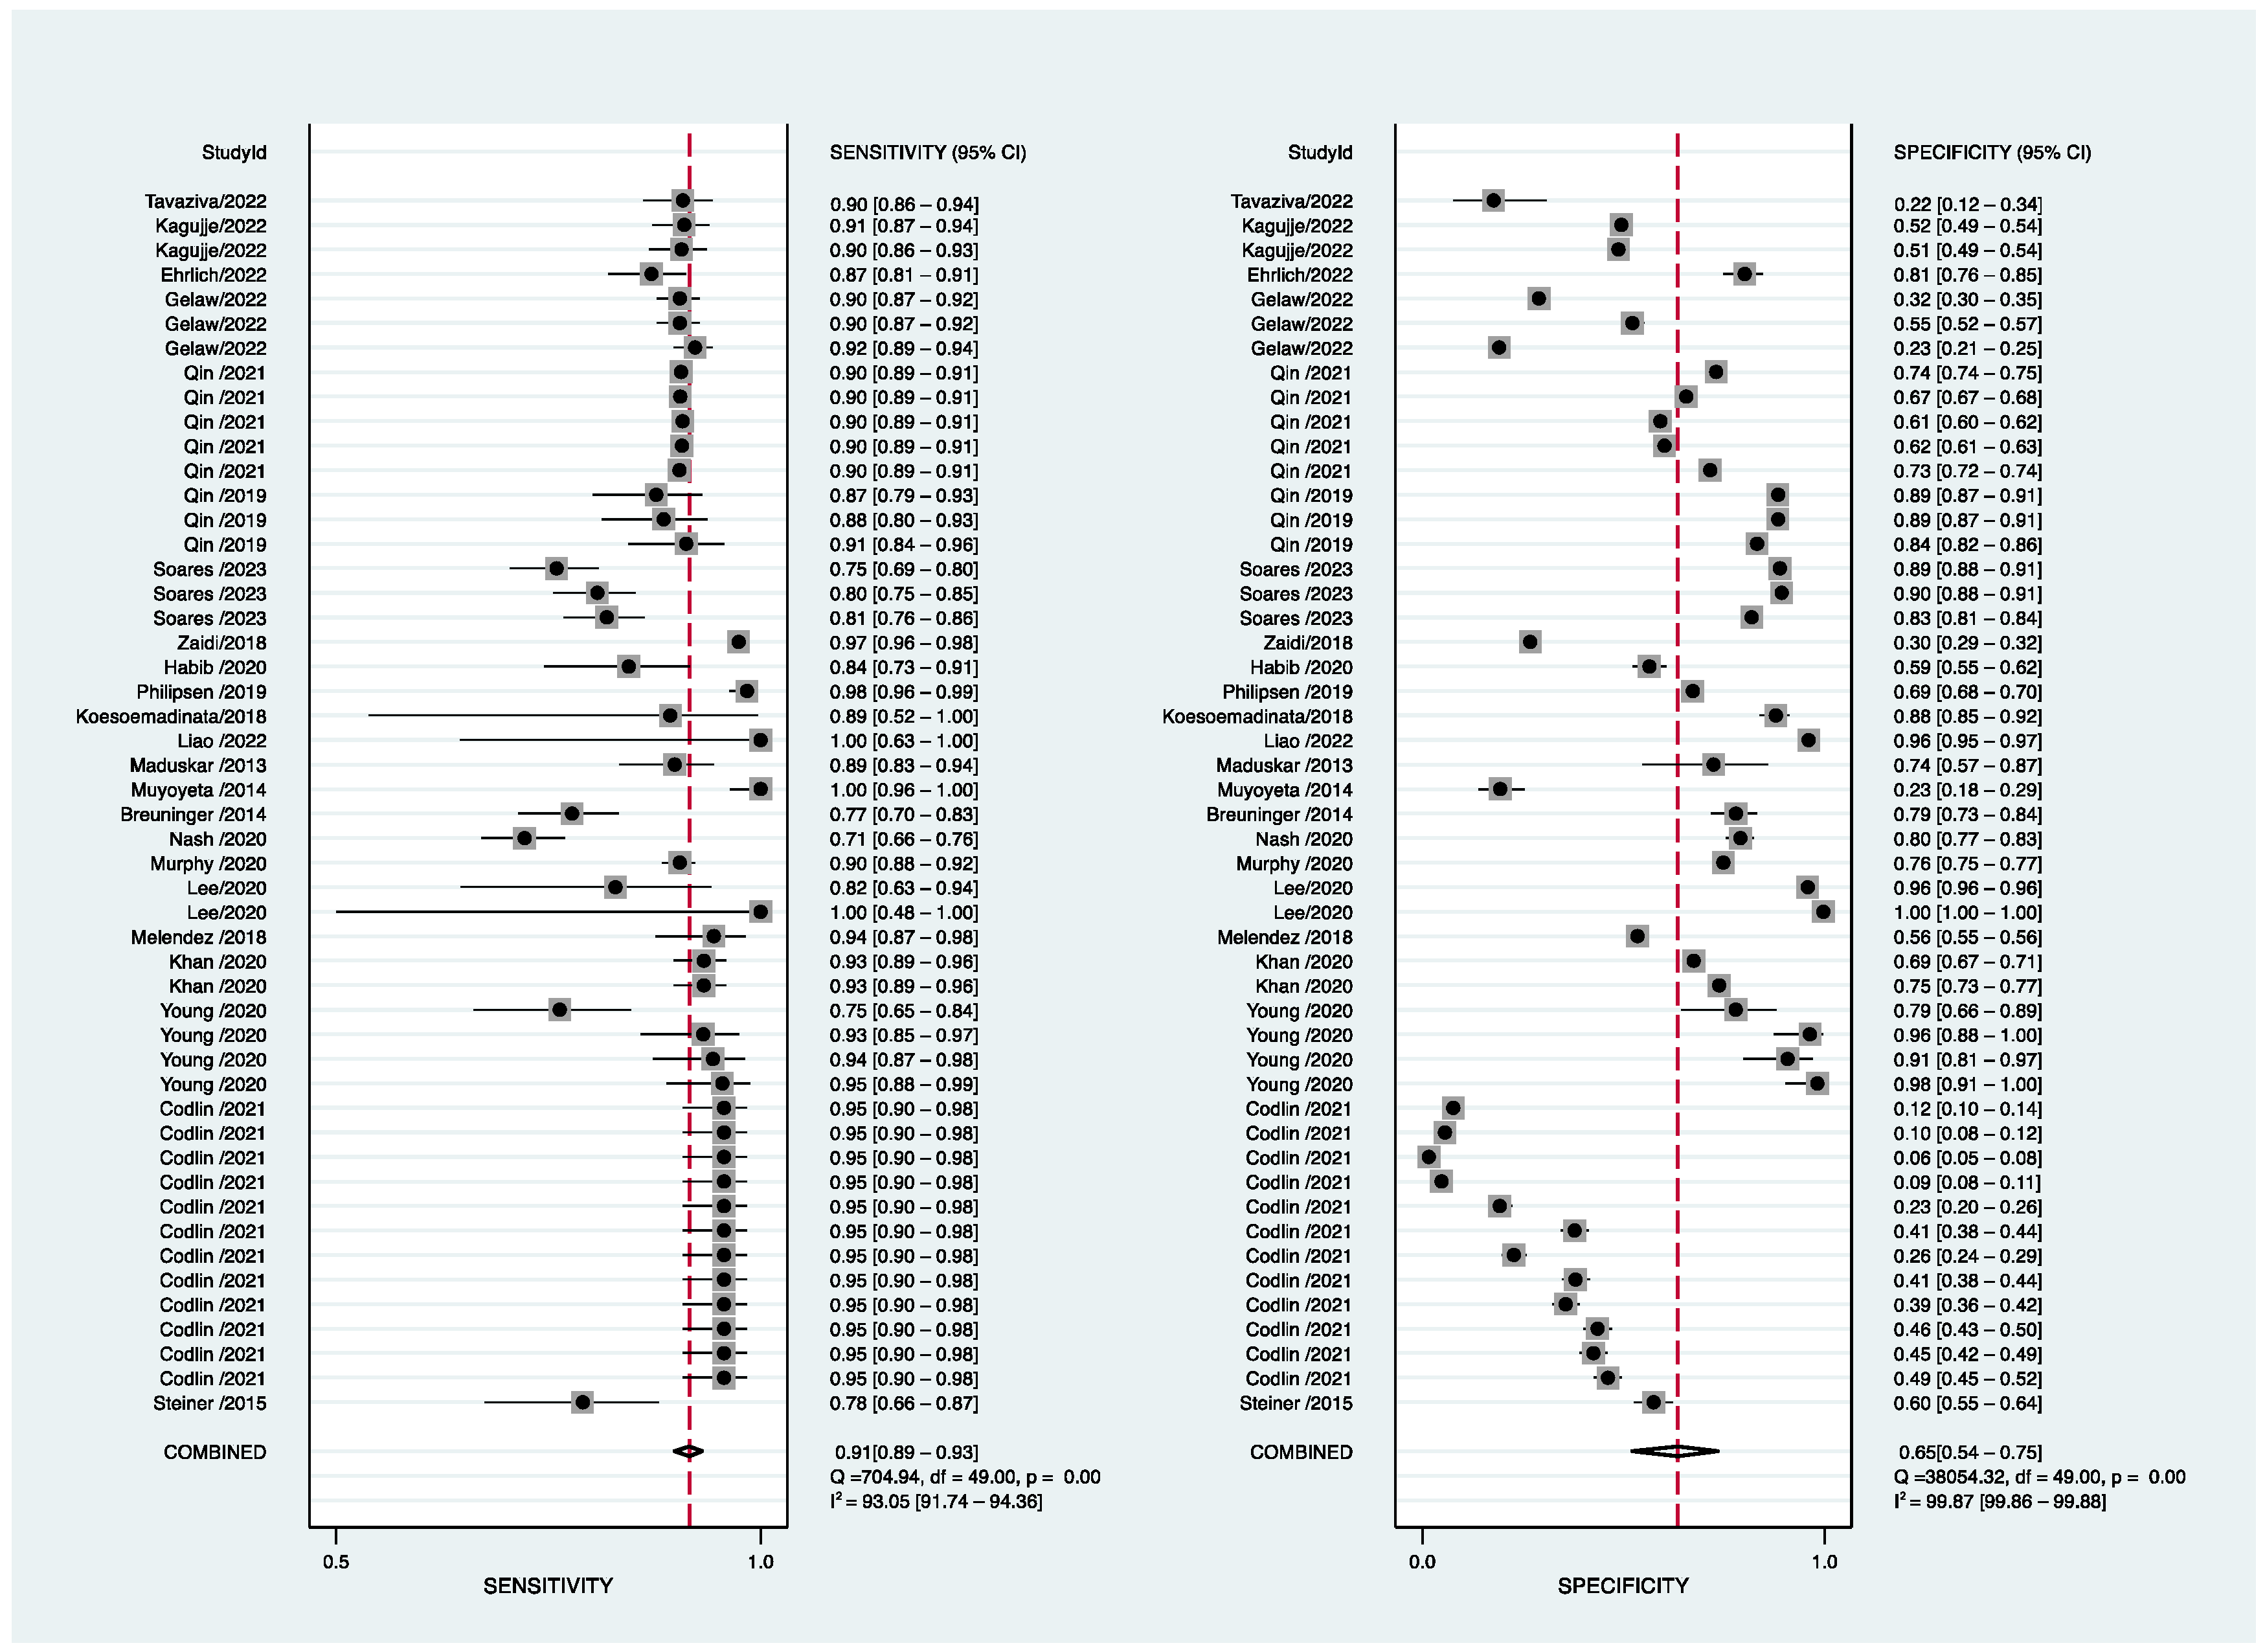
3.3. Diagnostic Accuracy Reported in AI-Based Software Assay for PTB
3.4. Subgroup and Sensitivity Analyses
4. Discussion
5. Conclusions
Supplementary Materials
Author Contributions
Funding
Institutional Review Board Statement
Informed Consent Statement
Data Availability Statement
Conflicts of Interest
References
- Pai, M.; Behr, M.A.; Dowdy, D.; Dheda, K.; Divangahi, M.; Boehme, C.C.; Ginsberg, A.; Swaminathan, S.; Spigelman, M.; Getahun, H.; et al. Tuberculosis. Nat. Rev. Dis. Prim. 2016, 2, 16076. [Google Scholar] [CrossRef] [PubMed]
- World Health Organization. Global Tuberculosis Report 2021. Available online: https://www.who.int/teams/global-tuberculosis-programme/tb-reports (accessed on 10 November 2022).
- Chen, X.; Hu, T.Y. Strategies for advanced personalized tuberculosis diagnosis: Current technologies and clinical approaches. Precis. Clin.Med. 2021, 2, 35–44. [Google Scholar] [CrossRef] [PubMed]
- Hoog, A.H.V.; Meme, H.K.; Laserson, K.F.; Agaya, J.A.; Muchiri, B.G.; Githui, W.A.; Odeny, L.O.; Marston, B.J.; Borgdorff, M.W. Screening strategies for tuberculosis prevalence surveys: The value of chest radiography and symptoms. PLoS ONE 2012, 7, e38691. [Google Scholar] [CrossRef]
- Diagnostic Image Analysis Group. AI for radiology: An implementation guide 2020. Available online: https://grand-challenge.org/aiforradiology/ (accessed on 10 November 2022).
- Qin, Z.Z.; Ahmed, S.; Sarker, M.S.; Paul, K.; Adel, A.S.S.; Naheyan, T.; Barrett, R.; Banu, S.; Creswell, J. Tuberculosis detection from chest X-rays for triaging in a high tuberculosis-burden setting: An evaluation of five artificial intelligence algorithms. Lancet Digit. Health 2021, 3, e543–e554. [Google Scholar] [CrossRef]
- Liu, X.; Faes, L.; Kale, A.U.; Wagner, S.K.; Fu, D.J.; Bruynseels, A.; Mahendiran, T.; Moraes, G.; Shamdas, M.; Kern, C.; et al. A comparison of deep learning performance against health-care professionals in detecting diseases from medical imaging: A systematic review and meta-analysis. Lancet Digit. Health 2019, 1, e271–e297. [Google Scholar] [CrossRef] [PubMed]
- Harris, M.; Qi, A.; JeaGal, L.; Torabi, N.; Menzies, D.; Korobitsyn, A.; Pai, M.; Nathavitharana, R.R.; Khan, F.A. A systematic review of the diagnostic accuracy of artificial intelligence-based computer programs to analyze chest X-rays for pulmonary tuberculosis. PLoS ONE 2019, 14, e0221339. [Google Scholar] [CrossRef]
- Pande, T.; Cohen, C.; Pai, M.; Khan, F.A. Computer-aided detection of pulmonary tuberculosis on digital chest radiographs: A systematic review. Int. J. Tuberc. Lung Dis. 2016, 20, 1226–1230. [Google Scholar] [CrossRef]
- Puhan, M.A.; Gimeno-Santos, E.; Cates, C.J.; Troosters, T. Pulmonary rehabilitation following exacerbations of chronic obstructive pulmonary disease. Cochrane Database Syst. Rev. 2016, 2019, CD005305. [Google Scholar] [CrossRef]
- McInnes, M.D.F.; Moher, D.; Thombs, B.D.; McGrath, T.A.; Bossuyt, P.M.; Clifford, T.; Cohen, J.F.; Deeks, J.J.; Gatsonis, C.; Hooft, L.; et al. Preferred reporting items for a systematic review and meta-analysis of diagnostic test accuracy studies. The PRISMA-DTA Statement. JAMA 2018, 319, 388–396. [Google Scholar] [CrossRef]
- Maduskar, P.; Muyoyeta, M.; Ayles, H.; Hogeweg, L.; Peters-Bax, L.; Van Ginneken, B. Detection of tuberculosis using digital chest radiography: Automated reading vs. interpretation by clinical officers. Int. J. Tuberc. Lung Dis. 2013, 17, 1613–1620. [Google Scholar] [CrossRef]
- Muyoyeta, M.; Maduskar, P.; Moyo, M.; Kasese, N.; Milimo, D.; Spooner, R.; Kapata, N.; Hogeweg, L.; Van Ginneken, B.; Ayles, H. The sensitivity and specificity of using a computer aided diagnosis program for automatically scoring chest X-rays of presumptive TB patients compared with Xpert MTB/RIF in Lusaka Zambia. PLoS ONE 2014, 9, e93757. [Google Scholar] [CrossRef] [PubMed]
- Steiner, A.; Mangu, C.; Hombergh, J.V.D.; van Deutekom, H.; van Ginneken, B.; Clowes, P.; Mhimbira, F.; Mfinanga, S.; Rachow, A.; Reither, K.; et al. Screening for pulmonary tuberculosis in a Tanzanian prison and computer-aided interpretation of chest X-rays. Public Health Action 2015, 5, 249–254. [Google Scholar] [CrossRef] [PubMed][Green Version]
- Melendez, J.; Hogeweg, L.; Sánchez, C.I.; Philipsen, R.H.H.M.; Aldridge, R.; Hayward, A.C.; Abubakar, I.; van Ginneken, B.; Story, A. Accuracy of an automated system for tuberculosis detection on chest radiographs in high-risk screening. Int. J. Tuberc. Lung Dis. 2018, 22, 567–571. [Google Scholar] [CrossRef] [PubMed]
- Zaidi, S.M.A.; Habib, S.S.; Van Ginneken, B.; Ferrand, R.A.; Creswell, J.; Khowaja, S.; Khan, A. Evaluation of the diagnostic accuracy of computer-aided detection of tuberculosis on chest radiography among private sector patients in Pakistan. Sci. Rep. 2018, 8, 12339. [Google Scholar] [CrossRef] [PubMed]
- Qin, Z.Z.; Sander, M.S.; Rai, B.; Titahong, C.N.; Sudrungrot, S.; Laah, S.N.; Adhikari, L.M.; Carter, E.J.; Puri, L.; Codlin, A.J.; et al. Using artificial intelligence to read chest radiographs for tuberculosis detection: A multi-site evaluation of the diagnostic accuracy of three deep learning systems. Sci. Rep. 2019, 9, 15000. [Google Scholar] [CrossRef]
- Philipsen, R.H.H.M.; Sánchez, C.I.; Melendez, J.; Lew, W.J.; Van Ginneken, B. Automated chest X-ray reading for tuberculosis in the Philippines to improve case detection: A cohort study. Int. J. Tuberc. Lung Dis. 2019, 23, 805–810. [Google Scholar] [CrossRef]
- Murphy, K.; Habib, S.S.; Zaidi, S.M.A.; Khowaja, S.; Khan, A.; Melendez, J.; Scholten, E.T.; Amad, F.; Schalekamp, S.; Verhagen, M.; et al. Computer aided detection of tuberculosis on chest radiographs: An evaluation of the CAD4TB v6 system. Sci. Rep. 2020, 10, 5492. [Google Scholar] [CrossRef]
- Nash, M.; Kadavigere, R.; Andrade, J.; Sukumar, C.A.; Chawla, K.; Shenoy, V.P.; Pande, T.; Huddart, S.; Pai, M.; Saravu, K. Deep learning, computer-aided radiography reading for tuberculosis: A diagnostic accuracy study from a tertiary hospital in India. Sci. Rep. 2020, 10, 210. [Google Scholar] [CrossRef]
- Soares, T.R.; de Oliveira, R.D.; Liu, Y.E.; Santos, A.D.S.; dos Santos, P.C.P.; Monte, L.R.S.; de Oliveira, L.M.; Park, C.M.; Hwang, E.J.; Andrews, J.R.; et al. Evaluation of chest X-ray with automated interpretation algorithms for mass tuberculosis screening in prisons: A cross-sectional study. Lancet Reg. Health-Am. 2023, 17, 100388. [Google Scholar] [CrossRef]
- Breuninger, M.; Van Ginneken, B.; Philipsen, R.H.H.M.; Mhimbira, F.; Hella, J.J.; Lwilla, F.; Hombergh, J.V.D.; Ross, A.; Jugheli, L.; Wagner, D.; et al. Diagnostic accuracy of computer-aided detection of pulmonary tuberculosis in chest radiographs: A validation study from Sub-Saharan Africa. PLoS ONE 2014, 9, e106381. [Google Scholar] [CrossRef]
- Khan, F.A.; Majidulla, A.; Tavaziva, G.; Nazish, A.; Abidi, S.K.; Benedetti, A.; Menzies, D.; Johnston, J.C.; Khan, A.J.; Saeed, S. Chest X-ray analysis with deep learning-based software as a triage test for pulmonary tuberculosis: A prospective study of diagnostic accuracy for culture-confirmed disease. Lancet Digit. Health 2020, 2, e573–e581. [Google Scholar] [CrossRef] [PubMed]
- Young, C.; Barker, S.; Ehrlich, R.; Kistnasamy, B.; Yassi, A. Computer-aided detection for tuberculosis and silicosis in chest radiographs of gold miners of South Africa. Int. J. Tuberc. Lung Dis. 2020, 24, 444–451. [Google Scholar] [CrossRef] [PubMed]
- Liao, Q.; Feng, H.; Li, Y.; Lai, X.; Pan, J.; Zhou, F.; Zhou, L.; Chen, L. Evaluation of an artificial intelligence (AI) system to detect tuberculosis on chest X-ray at a pilot active screening project in Guangdong, China in 2019. J. X-ray Sci. Technol. 2022, 30, 221–230. [Google Scholar] [CrossRef] [PubMed]
- Codlin, A.J.; Dao, T.P.; Vo, L.N.Q.; Forse, R.J.; Van Truong, V.; Dang, H.M.; Nguyen, L.H.; Nguyen, H.B.; Nguyen, N.V.; Sidney-Annerstedt, K.; et al. Independent evaluation of 12 artificial intelligence solutions for the detection of tuberculosis. Sci. Rep. 2021, 11, 23895. [Google Scholar] [CrossRef]
- Habib, S.S.; Rafiq, S.; Zaidi, S.M.A.; Ferrand, R.A.; Creswell, J.; Van Ginneken, B.; Jamal, W.Z.; Azeemi, K.S.; Khowaja, S.; Khan, A. Evaluation of computer aided detection of tuberculosis on chest radiography among people with diabetes in Karachi Pakistan. Sci. Rep. 2020, 10, 6276. [Google Scholar] [CrossRef]
- Koesoemadinata, R.C.; Kranzer, K.; Livia, R.; Susilawati, N.; Annisa, J.; Soetedjo, N.N.M.; Ruslami, R.; Philipsen, R.; van Ginneken, B.; Soetikno, R.D.; et al. Computer-assisted chest radiography reading for tuberculosis screening in people living with diabetes mellitus. Int. J. Tuberc. Lung Dis. 2018, 22, 1088–1094. [Google Scholar] [CrossRef]
- Lee, J.H.; Park, S.; Hwang, E.J.; Goo, J.M.; Lee, W.Y.; Lee, S.; Kim, H.; Andrews, J.R.; Park, C.M. Deep learning–based automated detection algorithm for active pulmonary tuberculosis on chest radiographs: Diagnostic performance in systematic screening of asymptomatic individuals. Eur. Radiol. 2020, 31, 1069–1080. [Google Scholar] [CrossRef]
- Gelaw, S.M.; Kik, S.V.; Ruhwald, M.; Ongarello, S.; Egzertegegne, T.S.; Gorbacheva, O.; Gilpin, C.; Marano, N.; Lee, S.; Phares, C.R. Diagnostic accuracy of three computer-aided detection systems for detecting pulmonary tuberculosis on chest radiography when used for screening: Analysis of an international, multicenter migrants screening study. medRxiv 2022. [Google Scholar] [CrossRef]
- Ehrlich, R.; Barker, S.; Naude, J.T.W.; Rees, D.; Kistnasamy, B.; Naidoo, J.; Yassi, A. Accuracy of computer-aided detection of occupational lung disease: Silicosis and pulmonary tuberculosis in Ex-Miners from the South African gold mines. Int. J. Environ. Res. Public Health 2022, 19, 12402. [Google Scholar] [CrossRef]
- Kagujje, M.; Kerkhoff, A.D.; Nteeni, M.; Dunn, I.; Mateyo, K.; Muyoyeta, M. The performance of computer-aided detection digital chest X-ray reading technologies for triage of active tuberculosis among persons with a history of previous tuberculosis. Clin. Infect. Dis. 2022, ciac679. [Google Scholar] [CrossRef]
- Tavaziva, G.; Majidulla, A.; Nazish, A.; Saeed, S.; Benedetti, A.; Khan, A.J.; Khan, F.A. Diagnostic accuracy of a commercially available, deep learning-based chest X-ray interpretation software for detecting culture-confirmed pulmonary tuberculosis. Int. J. Infect. Dis. 2022, 122, 15–20. [Google Scholar] [CrossRef] [PubMed]
- Shen, R.; Cheng, I.; Basu, A. A hybrid knowledge-guided detection technique for screening of infectious pulmonary tuberculosis from chest radiographs. IEEE Trans. Biomed. Eng. 2010, 57, 2646–2656. [Google Scholar] [CrossRef] [PubMed]
- Melendez, J.; van Ginneken, B.; Maduskar, P.; Philipsen, R.H.H.M.; Reither, K.; Breuninger, M.; Adetifa, I.M.O.; Maane, R.; Ayles, H.; Sanchez, C.I. A novel multiple-instance learning-based approach to computer-aided detection of tuberculosis on chest X-rays. IEEE Trans. Med. Imaging 2015, 34, 179–192. [Google Scholar] [CrossRef] [PubMed]
- Pasa, F.; Golkov, V.; Pfeiffer, F.; Cremers, D. Efficient deep network architectures for fast chest X-ray tuberculosis screening and visualization. Sci. Rep. 2019, 9, 6268. [Google Scholar] [CrossRef]
- Xie, Y.; Wu, Z.; Han, X.; Wang, H.; Wu, Y.; Cui, L.; Feng, J.; Zhu, Z.; Chen, Z. Computer-aided system for the detection of multicategory pulmonary tuberculosis in radiographs. J. Healthc. Eng. 2020, 2020, 9205082. [Google Scholar] [CrossRef]
- Ma, L.; Wang, Y.; Guo, L.; Zhang, Y.; Wang, P.; Pei, X.; Qian, L.; Jaeger, S.; Ke, X.; Yin, X.; et al. Developing and verifying automatic detection of active pulmonary tuberculosis from multi-slice spiral CT images based on deep learning. J. X-ray Sci. Technol. 2020, 28, 939–951. [Google Scholar] [CrossRef]
- Rajpurkar, P.; O’Connell, C.; Schechter, A.; Asnani, N.; Li, J.; Kiani, A.; Ball, R.L.; Mendelson, M.; Maartens, G.; van Hoving, D.J.; et al. CheXaid: Deep learning assistance for physician diagnosis of tuberculosis using chest X-rays in patients with HIV. npj Digit. Med. 2020, 3, 115. [Google Scholar] [CrossRef]
- Oloko-Oba, M.; Viriri, S. Ensemble of EfficientNets for the diagnosis of tuberculosis. Comput. Intell. Neurosci. 2021, 2021, 9790894. [Google Scholar] [CrossRef]
- Mamalakis, M.; Swift, A.J.; Vorselaars, B.; Ray, S.; Weeks, S.; Ding, W.; Clayton, R.H.; Mackenzie, L.S.; Banerjee, A. DenResCov-19: A deep transfer learning network for robust automatic classification of COVID-19, pneumonia, and tuberculosis from X-rays. Comput. Med. Imaging Graph. 2021, 94, 102008. [Google Scholar] [CrossRef]
- Rajakumar, M.; Sonia, R.; Maheswari, B.U.; Karuppiah, S. Tuberculosis detection in chest X-ray using Mayfly-algorithm optimized dual-deep-learning features. J. X-ray Sci. Technol. 2021, 29, 961–974. [Google Scholar] [CrossRef]
- Sharma, A.; Sharma, A.; Malhotra, R.; Singh, P.; Chakrabortty, R.K.; Mahajan, S.; Pandit, A.K. An accurate artificial intelligence system for the detection of pulmonary and extra pulmonary tuberculosis. Tuberculosis 2021, 131, 102143. [Google Scholar] [CrossRef] [PubMed]
- Wang, L.; Ding, W.; Mo, Y.; Shi, D.; Zhang, S.; Zhong, L.; Wang, K.; Wang, J.; Huang, C.; Ye, Z.; et al. Distinguishing nontuberculous mycobacteria from Mycobacterium tuberculosis lung disease from CT images using a deep learning framework. Eur. J. Nucl. Med. 2021, 48, 4293–4306. [Google Scholar] [CrossRef] [PubMed]
- Showkatian, E.; Salehi, M.; Ghaffari, H.; Reiazi, R.; Sadighi, N. Deep learning-based automatic detection of tuberculosis disease in chest X-ray images. Pol. J. Radiol. 2022, 87, 118–124. [Google Scholar] [CrossRef] [PubMed]
- Zhou, W.; Cheng, G.; Zhang, Z.; Zhu, L.; Jaeger, S.; Lure, F.Y.M.; Guo, L. Deep learning-based pulmonary tuberculosis automated detection on chest radiography: Large-scale independent testing. Quant. Imaging Med. Surg. 2022, 12, 2344. [Google Scholar] [CrossRef] [PubMed]
- Rajaraman, S.; Zamzmi, G.; Folio, L.; Alderson, P.; Antani, S. Chest X-ray bone suppression for improving classification of tuberculosis-consistent findings. Diagnostics 2021, 11, 840. [Google Scholar] [CrossRef] [PubMed]
- Yan, C.; Wang, L.; Lin, J.; Xu, J.; Zhang, T.; Qi, J.; Li, X.; Ni, W.; Wu, G.; Huang, J.; et al. A fully automatic artificial intelligence–based CT image analysis system for accurate detection, diagnosis, and quantitative severity evaluation of pulmonary tuberculosis. Eur. Radiol. 2021, 32, 2188–2199. [Google Scholar] [CrossRef]
- Zhang, K.; Qi, S.; Cai, J.; Zhao, D.; Yu, T.; Yue, Y.; Yao, Y.; Qian, W. Content-based image retrieval with a Convolutional Siamese Neural Network: Distinguishing lung cancer and tuberculosis in CT images. Comput. Biol. Med. 2021, 140, 105096. [Google Scholar] [CrossRef]
- Arzhaeva, Y.; Hogeweg, L.; De Jong, P.A.; Viergever, M.A.; Van Ginneken, B. Global and local multi-valued dissimilarity-based classification: Application to computer-aided detection of tuberculosis. Med. Image Comput. Comput. Assist. Interv. 2009, 12 Pt 2, 724–731. [Google Scholar] [CrossRef]
- Jaeger, S.; Karargyris, A.; Candemir, S.; Folio, L.; Siegelman, J.; Callaghan, F.; Xue, Z.; Palaniappan, K.; Singh, R.K.; Antani, S.; et al. Automatic tuberculosis screening using chest radiographs. IEEE Trans. Med. Imaging 2014, 33, 233–245. [Google Scholar] [CrossRef]
- Chauhan, A.; Chauhan, D.; Rout, C. Role of Gist and PHOG features in computer-aided diagnosis of tuberculosis without segmentation. PLoS ONE 2014, 9, e112980. [Google Scholar] [CrossRef]
- Hogeweg, L.; Sanchez, C.I.; Maduskar, P.; Philipsen, R.; Story, A.; Dawson, R.; Theron, G.; Dheda, K.; Peters-Bax, L.; van Ginneken, B. Automatic detection of tuberculosis in chest radiographs using a combination of textural, focal, and shape abnormality analysis. IEEE Trans. Med. Imaging 2015, 34, 2429–2442. [Google Scholar] [CrossRef] [PubMed]
- Lakhani, P.; Sundaram, B. Deep learning at chest radiography: Automated classification of pulmonary tuberculosis by using Convolutional Neural Networks. Radiology 2017, 284, 574–582. [Google Scholar] [CrossRef] [PubMed]
- Han, D.; He, T.; Yu, Y.; Guo, Y.; Chen, Y.; Duan, H.; Yu, N. Diagnosis of active pulmonary tuberculosis and community acquired pneumonia using Convolution Neural Network based on transfer learning. Acad. Radiol. 2022, 29, 1486–1492. [Google Scholar] [CrossRef] [PubMed]
- An, L.; Peng, K.; Yang, X.; Huang, P.; Luo, Y.; Feng, P.; Wei, B. E-TBNet: Light Deep Neural Network for automatic detection of tuberculosis with X-ray DR Imaging. Sensors 2022, 22, 821. [Google Scholar] [CrossRef] [PubMed]
- Lee, S.; Yim, J.-J.; Kwak, N.; Lee, Y.J.; Lee, J.-K.; Lee, J.Y.; Kim, J.S.; Kang, Y.A.; Jeon, D.; Jang, M.-J.; et al. Deep learning to determine the activity of pulmonary tuberculosis on chest radiographs. Radiology 2021, 301, 435–442. [Google Scholar] [CrossRef] [PubMed]
- Khatibi, T.; Shahsavari, A.; Farahani, A. Proposing a novel multi-instance learning model for tuberculosis recognition from chest X-ray images based on CNNs, complex networks and stacked ensemble. Phys. Eng. Sci. Med. 2021, 44, 291–311. [Google Scholar] [CrossRef]
- Kim, T.K.; Yi, P.H.; Hager, G.D.; Lin, C.T. Refining dataset curation methods for deep learning-based automated tuberculosis screening. J. Thorac. Dis. 2020, 12, 5078–5085. [Google Scholar] [CrossRef] [PubMed]
- Feng, B.; Chen, X.; Chen, Y.; Lu, S.; Liu, K.; Li, K.; Liu, Z.; Hao, Y.; Li, Z.; Zhu, Z.; et al. Solitary solid pulmonary nodules: A CT-based deep learning nomogram helps differentiate tuberculosis granulomas from lung adenocarcinomas. Eur. Radiol. 2020, 30, 6497–6507. [Google Scholar] [CrossRef]
- Hwang, E.J.; Park, S.; Jin, K.-N.; Kim, J.I.; Choi, S.Y.; Lee, J.H.; Goo, J.M.; Aum, J.; Yim, J.-J.; Park, C.M.; et al. Development and validation of a deep learning–based automatic detection algorithm for active pulmonary tuberculosis on chest radiographs. Clin. Infect. Dis. 2019, 69, 739–747. [Google Scholar] [CrossRef]
- Heo, S.-J.; Kim, Y.; Yun, S.; Lim, S.-S.; Kim, J.; Nam, C.-M.; Park, E.-C.; Jung, I.; Yoon, J.-H. Deep learning algorithms with demographic information help to detect tuberculosis in chest radiographs in annual workers’ health examination data. Int. J. Environ. Res. Public Health 2019, 16, 250. [Google Scholar] [CrossRef]
- Aguiar, F.S.; Torres, R.C.; Pinto, J.V.F.; Kritski, A.L.; Seixas, J.M.; Mello, F.C.Q. Development of two artificial neural network models to support the diagnosis of pulmonary tuberculosis in hospitalized patients in Rio de Janeiro, Brazil. Med. Biol. Eng. Comput. 2016, 54, 1751–1759. [Google Scholar] [CrossRef] [PubMed]
- Faruk, O.; Ahmed, E.; Ahmed, S.; Tabassum, A.; Tazin, T.; Bourouis, S.; Khan, M.M. A novel and robust approach to detect tuberculosis using transfer learning. J. Healthc. Eng. 2021, 2021, 1002799. [Google Scholar] [CrossRef] [PubMed]
- Karki, M.; Kantipudi, K.; Yu, H.; Yang, F.; Kassim, Y.M.; Yaniv, Z.; Jaeger, S. Identifying drug-resistant tuberculosis in chest radiographs: Evaluation of CNN architectures and training strategies. In Proceedings of the 2021 43rd Annual International Conference of the IEEE Engineering in Medicine & Biology Society (EMBC), Mexico City, Mexico, 1–5 November 2021; pp. 2964–2967. [Google Scholar] [CrossRef]
- Dasanayaka, C.; Dissanayake, M.B. Deep learning methods for screening pulmonary tuberculosis using chest X-rays. Comput. Methods Biomech. Biomed. Eng. Imaging Vis. 2021, 9, 39–49. [Google Scholar] [CrossRef]
- Govindarajan, S.; Swaminathan, R. Extreme learning machine based differentiation of pulmonary tuberculosis in chest radiographs using integrated local feature descriptors. Comput. Methods Programs Biomed. 2021, 204, 106058. [Google Scholar] [CrossRef] [PubMed]
- Acharya, V.; Dhiman, G.; Prakasha, K.; Bahadur, P.; Choraria, A.; Prabhu, S.; Chadaga, K.; Viriyasitavat, W.; Kautish, S. AI-assisted tuberculosis detection and classification from chest X-rays using a deep learning normalization-free network model. Comput. Intell. Neurosci. 2022, 2022, 2399428. [Google Scholar] [CrossRef] [PubMed]
- Kadry, S.; Srivastava, G.; Rajinikanth, V.; Rho, S.; Kim, Y. Tuberculosis detection in chest radiographs using spotted hyena algorithm optimized deep and handcrafted features. Comput. Intell. Neurosci. 2022, 2022, 9263379. [Google Scholar] [CrossRef] [PubMed]
- Kazemzadeh, S.; Yu, J.; Jamshy, S.; Pilgrim, R.; Nabulsi, Z.; Chen, C.; Beladia, N.; Lau, C.; McKinney, S.M.; Hughes, T.; et al. Deep learning detection of active pulmonary tuberculosis at chest radiography matched the clinical performance of radiologists. Radiology 2023, 306, 124–137. [Google Scholar] [CrossRef] [PubMed]
- Margarat, G.S.; Hemalatha, G.; Mishra, A.; Shaheen, H.; Maheswari, K.; Tamijeselvan, S.; Kumar, U.P.; Banupriya, V.; Ferede, A.W. Early diagnosis of tuberculosis using deep learning approach for iot based healthcare applications. Comput. Intell. Neurosci. 2022, 2022, 3357508. [Google Scholar] [CrossRef]
- Skoura, E.; Zumla, A.; Bomanji, J. Imaging in tuberculosis. Int. J. Infect. Dis. 2015, 32, 87–93. [Google Scholar] [CrossRef]
- Owens, C.A.; Peterson, C.; Tang, C.; Koay, E.J.; Yu, W.; Mackin, D.S.; Li, J.; Salehpour, M.R.; Fuentes, D.T.; Court, L.; et al. Lung tumor segmentation methods: Impact on the uncertainty of radiomics features for non-small cell lung cancer. PLoS ONE 2018, 13, e0205003. [Google Scholar] [CrossRef]
- Bianconi, F.; Palumbo, I.; Fravolini, M.L.; Rondini, M.; Minestrini, M.; Pascoletti, G.; Nuvoli, S.; Spanu, A.; Scialpi, M.; Aristei, C.; et al. Form factors as potential imaging biomarkers to differentiate benign vs. malignant lung lesions on CT scans. Sensors 2022, 22, 5044. [Google Scholar] [CrossRef] [PubMed]
- Peikert, T.; Duan, F.; Rajagopalan, S.; Karwoski, R.A.; Clay, R.; Robb, R.A.; Qin, Z.; Sicks, J.; Bartholmai, B.J.; Maldonado, F. Novel high-resolution computed tomography-based radiomic classifier for screen-identified pulmonary nodules in the national lung screening trial. PLoS ONE 2018, 13, e0196910. [Google Scholar] [CrossRef] [PubMed]
- Bossuyt, P.M.; Reitsma, J.B.; Bruns, D.E.; Gatsonis, C.A.; Glasziou, P.P.; Irwig, L.; Lijmer, J.G.; Moher, D.; Rennie, D.; de Vet, H.C.W.; et al. STARD 2015: An updated list of essential items for reporting diagnostic accuracy studies. Clin. Chem. 2015, 61, 1446–1452. [Google Scholar] [CrossRef] [PubMed]
- Collins, G.S.; Reitsma, J.B.; Altman, D.G.; Moons, K.G.M. Transparent reporting of a multivariable prediction model for individual prognosis or diagnosis (TRIPOD): The TRIPOD statement. BMJ 2014, 350, g7594. [Google Scholar] [CrossRef]
- Page, M.J.; McKenzie, J.E.; Bossuyt, P.M.; Boutron, I.; Hoffmann, T.C.; Mulrow, C.D.; Shamseer, L.; Tetzlaff, J.M.; Akl, E.A.; Brennan, S.E.; et al. The PRISMA 2020 statement: An updated guideline for reporting systematic reviews. BMJ 2021, 372, n71. [Google Scholar] [CrossRef]


| First Author, Year | Imaging Modality | Computer Software/Model | Reference Standard | Accuracy Measures |
|---|---|---|---|---|
| Maduskar et al., 2013 [12] | CXR | CAD4TB (v 1.08) | AFB smear, MTB culture | TP, FP, TN, FN, AUC, ACC, Sn, Sp, PPV, NPV |
| Muyoyeta et al., 2014 [13] | CXR | CAD4TB (v 1.08) | Xpert MTB/RIF, human reader | TP, FP, TN, FN, AUC, ACC, Sn, Sp, PPV, NPV |
| Steiner et al., 2015 [14] | CXR | CAD4TB (v 3.07) | Human reader | AUC |
| Melendez et al., 2018 [15] | CXR | CAD4TB (v 5) | Human reader | TP, FP, TN, FN, AUC, ACC, Sn, Sp, PPV, NPV |
| Zaidi et al., 2018 [16] | CXR | CAD4TB (v 3.07) | Xpert MTB/RIF | TP, FP, TN, FN, AUC, ACC, Sn, Sp, PPV, NPV |
| Qin et al., 2019 [17] | CXR | CAD4TB (v 6), qXR (v 2), Lunit INSIGHT CXR (v 4.7.2) | Xpert MTB/RIF | TP, FP, TN, FN, AUC, ACC, Sn, Sp |
| Philipsen et al., 2019 [18] | CXR | CAD4TB (v 5) | Xpert MTB/RIF, human reader | TP, FP, TN, FN, AUC, ACC, Sn, Sp, PPV, NPV |
| Murphy et al., 2020 [19] | CXR | CAD4TB (v 6) | Xpert MTB/RIF | TP, FP, TN, FN, AUC, Sn, Sp |
| Nash et al., 2020 [20] | CXR | qXR (v 2) | AFB smear, Xpert MTB/RIF or MTB culture | AUC, Sn, Sp |
| Soares et al., 2023 [21] | CXR | CAD4TB (v 6), Lunit INSIGHT CXR (v 3.1.0.0), qXR (v 3) | Xpert MTB/RIF, MTB culture | AUC, Sn, Sp, PPV, NPV |
| Qin et al., 2021 [6] | CXR | CAD4TB (v 7), InferRead DR (v 2), Lunit INSIGHT CXR (v 4.9.0), JF CXR-1 (v 2), qXR, (v 3) | Xpert MTB/RIF | AUC, Sn, Sp |
| Breuninger et al., 2014 [22] | CXR | CAD4TB (v 3.07) | AFB smear, MTB culture | Sn, Sp, PPV, NPV |
| Khan et al., 2020 [23] | CXR | qXR (v 2), CAD4TB (v 6) | MTB culture | ACC, Sn, Sp, PPV, NPV |
| Young et al., 2020 [24] | CXR | Not named | Human reader | AUC, Sn, Sp |
| Liao et al., 2022 [25] | CXR | JF CXR-1 (v 2) | Human reader | TP, FP, TN, FN, AUC, ACC, Sn, Sp, PPV, NPV |
| Codlin et al., 2021 [26] | CXR | qXR (v 3), CAD4TB (v 7), Genki (v 2), Lunit INSIGHT CXR (v 3.1.0.0), JF CXR-1 (v 3.0), InferRead DR Chest (v 1.0.0.0), ChestEye (v 1), T-Xnet (v 1), XrayAME (v 1), COTO (v 1), SemanticMD (v 1), Dr CADx (v 0.1) | Xpert MTB/RIF | TP, FP, TN, FN, AUC, ACC, Sn, Sp, PPV, NPV |
| Habib et al., 2020 [27] | CXR | CAD4TB (v 3.07) | Xpert MTB/RIF | AUC, Sn, Sp, PPV, NPV |
| Koesoemadinata et al., 2018 [28] | CXR | CAD4TB (v 5) | Composite reference standard(s) | AUC, Sn, Sp |
| Lee et al., 2020 [29] | CXR | Lunit INSIGHT CXR (v 4.7.2) | MTB culture, AFB smear, TB polymerase chain reaction, human reader | TP, FP, TN, FN, AUC, ACC, Sn, Sp, PPV, NPV |
| Gelaw et al., 2022 [30] | CXR | CAD4TB (v 6), Lunit INSIGHT CXR (v 4.9.0), qXR (v 2) | Xpert MTB/RIF, Mycobacterium tuberculosis (MTB) culture | TP, FP, TN, FN, Sn, Sp |
| Ehrlich et al., 2022 [31] | CXR | CAD4TB (v 7) | Human reader | TP, FP, TN, FN, AUC, Sn, Sp |
| Kagujje et al., 2022 [32] | CXR | CAD4TB (v 7), qXR (v 3) | Xpert MTB/RIF | TP, FP, TN, FN, AUC, Sn, Sp |
| Tavaziva et al., 2022 [33] | CXR | Lunit INSIGHT CXR (v 4.9.0) | Xpert MTB/RIF, Mycobacterium tuberculosis (MTB) culture | TP, FP, TN, FN, AUC, ACC, Sn, Sp |
| Shen et al., 2010 [34] | CXR | Bayesian classifier | Human reader | ACC |
| Melendez et al., 2015 [35] | CXR | si-miSVM+PEDD | Human reader | AUC |
| Pasa et al., 2019 [36] | CXR | CNN | Human reader | AUC, ACC |
| Xie et al., 2020 [37] | CXR | RCNN | Human reader | AUC, ACC, Sn, Sp |
| Ma et al., 2020 [38] | CT | U-Net | Sputum smear | AUC, ACC, Sn, Sp, PPV, NPV |
| Rajpurkar et al., 2020 [39] | CXR | DenseNet | Xpert MTB/RIF, MTB culture | ACC, Sn, Sp |
| Oloko-Oba et al., 2021 [40] | CXR | EfficientNets | Human reader | AUC, ACC, Sn, Sp |
| Mamalakis et al., 2021 [41] | CXR | DenseNet-121, ResNet-50 | Human reader | AUC, F1, precision, recall |
| Rajakumar et al., 2021 [42] | CXR | VGG16, VGG19, KNN | Human reader | ACC, Sn, Sp, NPV |
| Sharma et al., 2021 [43] | CXR | Tree, SVM, Naïve Bayes | Composite reference standard(s) | AUC, F1, CA, precision, recall |
| Wang et al., 2021 [44] | CT | 3D-ResNet | AFB smear, MTB culture | AUC, Sn, Sp, ACC, F1 |
| Showkatian et al., 2022 [45] | CXR | ConvNet | Human reader | AUC, ACC, F1, precision, recall |
| Zhou et al., 2022 [46] | CXR | ResNet | Human reader | AUC, ACC, Sn, Sp, PPV, NPV |
| Rajaraman et al., 2021 [47] | CXR | ImageNet, VGG-16 | Human reader | AUC, ACC, Sn, Sp, F1, precision |
| Yan et al., 2021 [48] | CT | SeNet-ResNet-18 | Human reader | ACC, precision, recall |
| Zhang et al., 2021 [49] | CT | CBIR-CSNN | Composite reference standard(s) | AUC, ACC |
| Arzhaeva et al., 2009 [50] | CXR | MVDB | Human reader | AUC |
| Jaeger et al., 2014 [51] | CXR | SVM | Human reader | AUC, ACC |
| Chauhan et al., 2014 [52] | CXR | SVM | Human reader | AUC, ACC, Sn, Sp, F1, precision |
| Hogeweg et al., 2015 [53] | CXR | RF50, GB50, LDA, KNN13 | MTB culture, human reader | AUC |
| Lakhani et al., 2017 [54] | CXR | AlexNet, GoogLeNet | Human reader | AUC, ACC, Sn, Sp |
| Han et al., 2021 [55] | CXR | VGG16 | Human reader | AUC, Sn, Sp |
| An et al., 2022 [56] | CXR | E-TBNet (ResNet) | Human reader | ACC, Sn, Sp, NPV, ppv, F1 |
| Lee et al., 2021 [57] | CXR | EfficientNet | Xpert MTB/RIF, MTB culture, human reader | AUC |
| Khatibi et al., 2021 [58] | CXR | CNN, CCNSE | Human reader | AUC, ACC |
| Kim et al., 2020 [59] | CXR | DCNN | Human reader | AUC, Sn, Sp, NPV, PPV, F1 |
| Feng et al., 2020 [60] | CT | CNN | Composite reference standard(s) | AUC, ACC, Sn, Sp |
| Hwang et al., 2019 [61] | CXR | CNN | Human reader | AUC, Sn, Sp |
| Heo et al., 2019 [62] | CXR | I-CNN(VGG19), D-CNN(VGG19) | Human reader | AUC |
| Aguiar et al., 2016 [63] | CXR | MLP | Human reader | AUC, Sn, Sp, PPV, NPV |
| Faruk et al., 2021 [64] | CT | Xception, InceptionV3, InceptionResNetV2, MobileNetV2 | Human reader | Sn, precision, recall, F1 |
| Karki et al., 2021 [65] | CXR | InceptionV3, Xception | Human reader | AUC |
| Dasanayaka et al., 2021 [66] | CXR | VGG16, InceptionV3, Ensemble | Human reader | ACC, Sn, Sp |
| Govindarajan et al., 2021 [67] | CXR | ELM, OSELM | Human reader | Sn, Sp, precision, F1 |
| Acharya et al., 2022 [68] | CXR | ImageNet fine-tuned normalization-free networks | Human reader | Sn, Sp, AUC, ACC, precision, recall |
| Kadry et al., 2022 [69] | CXR | VGG16, Fine Tree | Xpert MTB/RIF, Mycobacterium tuberculosis (MTB) culture, human reader | Sn, Sp, ACC, NPV |
| Kazemzadeh et al., 2023 [70] | CXR | NR | Human reader | Sn, Sp, AUC |
| Margarat et al., 2022 [71] | CXR | DBN-AMBO | Human reader | Sp, ACC, precision, recall, NPV |
| Studies | Sensitivity (95%CI) | Specificity (95%CI) | DOR (95%CI) | AUC (95%CI) |
|---|---|---|---|---|
| All (23) | 0.91(0.89–0.93) | 0.65(0.55–0.75) | 20(13–29) | 0.91(0.89–0.94) |
| Study Design | ||||
| Prospective (12) | 0.91(0.87–0.94) | 0.48(0.34–0.62) | 9(4–20) | 0.85(0.82–0.88) |
| Nonprospective (11) | 0.87(0.78–0.93) | 0.75(0.53–0.89) | 20(5–84) | 0.90(0.87–0.92) |
| Software | ||||
| CAD4TB (18) | 0.89(0.82–0.94) | 0.57(0.42–0.70) | 11(4–30) | 0.83(0.80–0.86) |
| qXR (8) | 0.79(0.61–0.90) | 0.55(0.24–0.83) | 5(1–38) | 0.77(0.73–0.80) |
| Lunit INSIGHT CXR (8) | 0.88(0.75–0.94) | 0.78(0.40–0.95) | 25(3–211) | 0.91(0.88–0.93) |
| Reference standard | ||||
| Human reader (5) | 0.90(0.84–0.94) | 0.90(0.80–0.95) | 77(22–269) | 0.95(0.93–0.97) |
| Xpert MTB/RIF (9) | 0.90(0.85–0.93) | 0.36(0.24–0.50) | 5(2–12) | 0.79(0.75–0.82) |
| AI type | ||||
| Deep learning (13) | 0.91(0.89–0.92) | 0.62(0.48–0.74) | 16(10–23) | 0.91(0.88–0.93) |
| Machine learning (9) | 0.93(0.85–0.97) | 0.61(0.46–0.75) | 21(11–42) | 0.87(0.83–0.89) |
Disclaimer/Publisher’s Note: The statements, opinions and data contained in all publications are solely those of the individual author(s) and contributor(s) and not of MDPI and/or the editor(s). MDPI and/or the editor(s) disclaim responsibility for any injury to people or property resulting from any ideas, methods, instructions or products referred to in the content. |
© 2022 by the authors. Licensee MDPI, Basel, Switzerland. This article is an open access article distributed under the terms and conditions of the Creative Commons Attribution (CC BY) license (https://creativecommons.org/licenses/by/4.0/).
Share and Cite
Zhan, Y.; Wang, Y.; Zhang, W.; Ying, B.; Wang, C. Diagnostic Accuracy of the Artificial Intelligence Methods in Medical Imaging for Pulmonary Tuberculosis: A Systematic Review and Meta-Analysis. J. Clin. Med. 2023, 12, 303. https://doi.org/10.3390/jcm12010303
Zhan Y, Wang Y, Zhang W, Ying B, Wang C. Diagnostic Accuracy of the Artificial Intelligence Methods in Medical Imaging for Pulmonary Tuberculosis: A Systematic Review and Meta-Analysis. Journal of Clinical Medicine. 2023; 12(1):303. https://doi.org/10.3390/jcm12010303
Chicago/Turabian StyleZhan, Yuejuan, Yuqi Wang, Wendi Zhang, Binwu Ying, and Chengdi Wang. 2023. "Diagnostic Accuracy of the Artificial Intelligence Methods in Medical Imaging for Pulmonary Tuberculosis: A Systematic Review and Meta-Analysis" Journal of Clinical Medicine 12, no. 1: 303. https://doi.org/10.3390/jcm12010303
APA StyleZhan, Y., Wang, Y., Zhang, W., Ying, B., & Wang, C. (2023). Diagnostic Accuracy of the Artificial Intelligence Methods in Medical Imaging for Pulmonary Tuberculosis: A Systematic Review and Meta-Analysis. Journal of Clinical Medicine, 12(1), 303. https://doi.org/10.3390/jcm12010303