
Sarcopenia and Myosteatosis Are Associated with Neutrophil to Lymphocyte Ratio but Not Glasgow Prognostic Score in Colorectal Cancer Patients

 , ,
, ,  , , ,
, , ,
Abstract
:1. Introduction
2. Materials and Methods
2.1. Data Collection
2.2. Body Composition Measurements
2.3. Statistical Analysis
3. Results
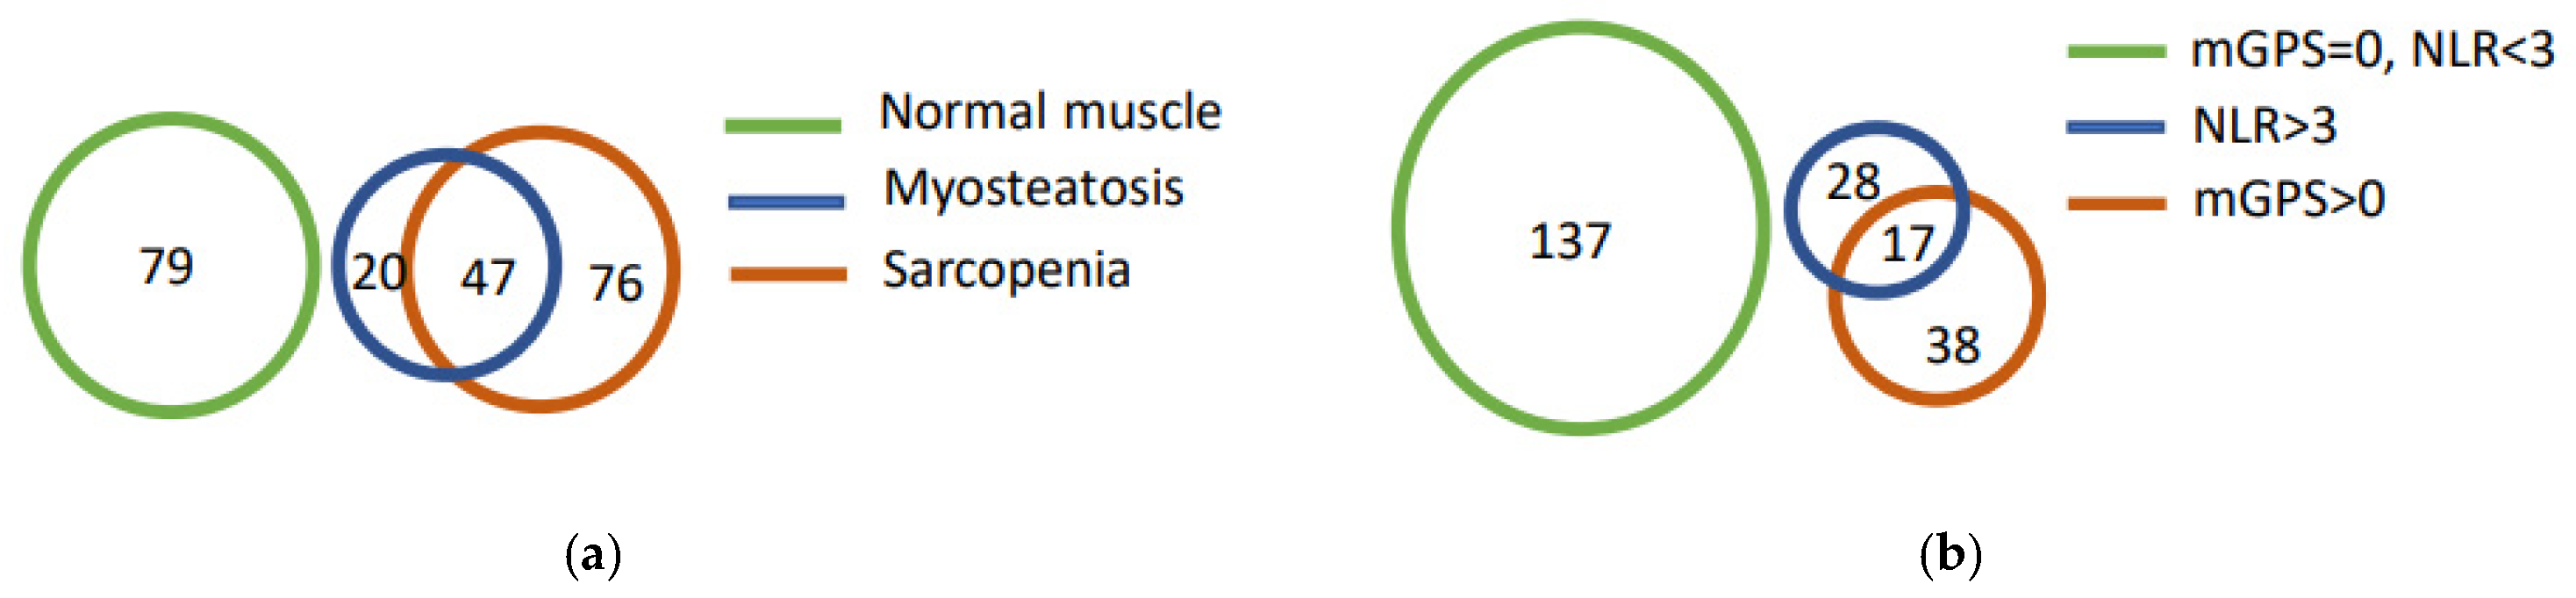
3.1. Patients Characteristics
3.2. Sarcopenia and Myosteatosis in Relation to Clinicopathological Characteristics
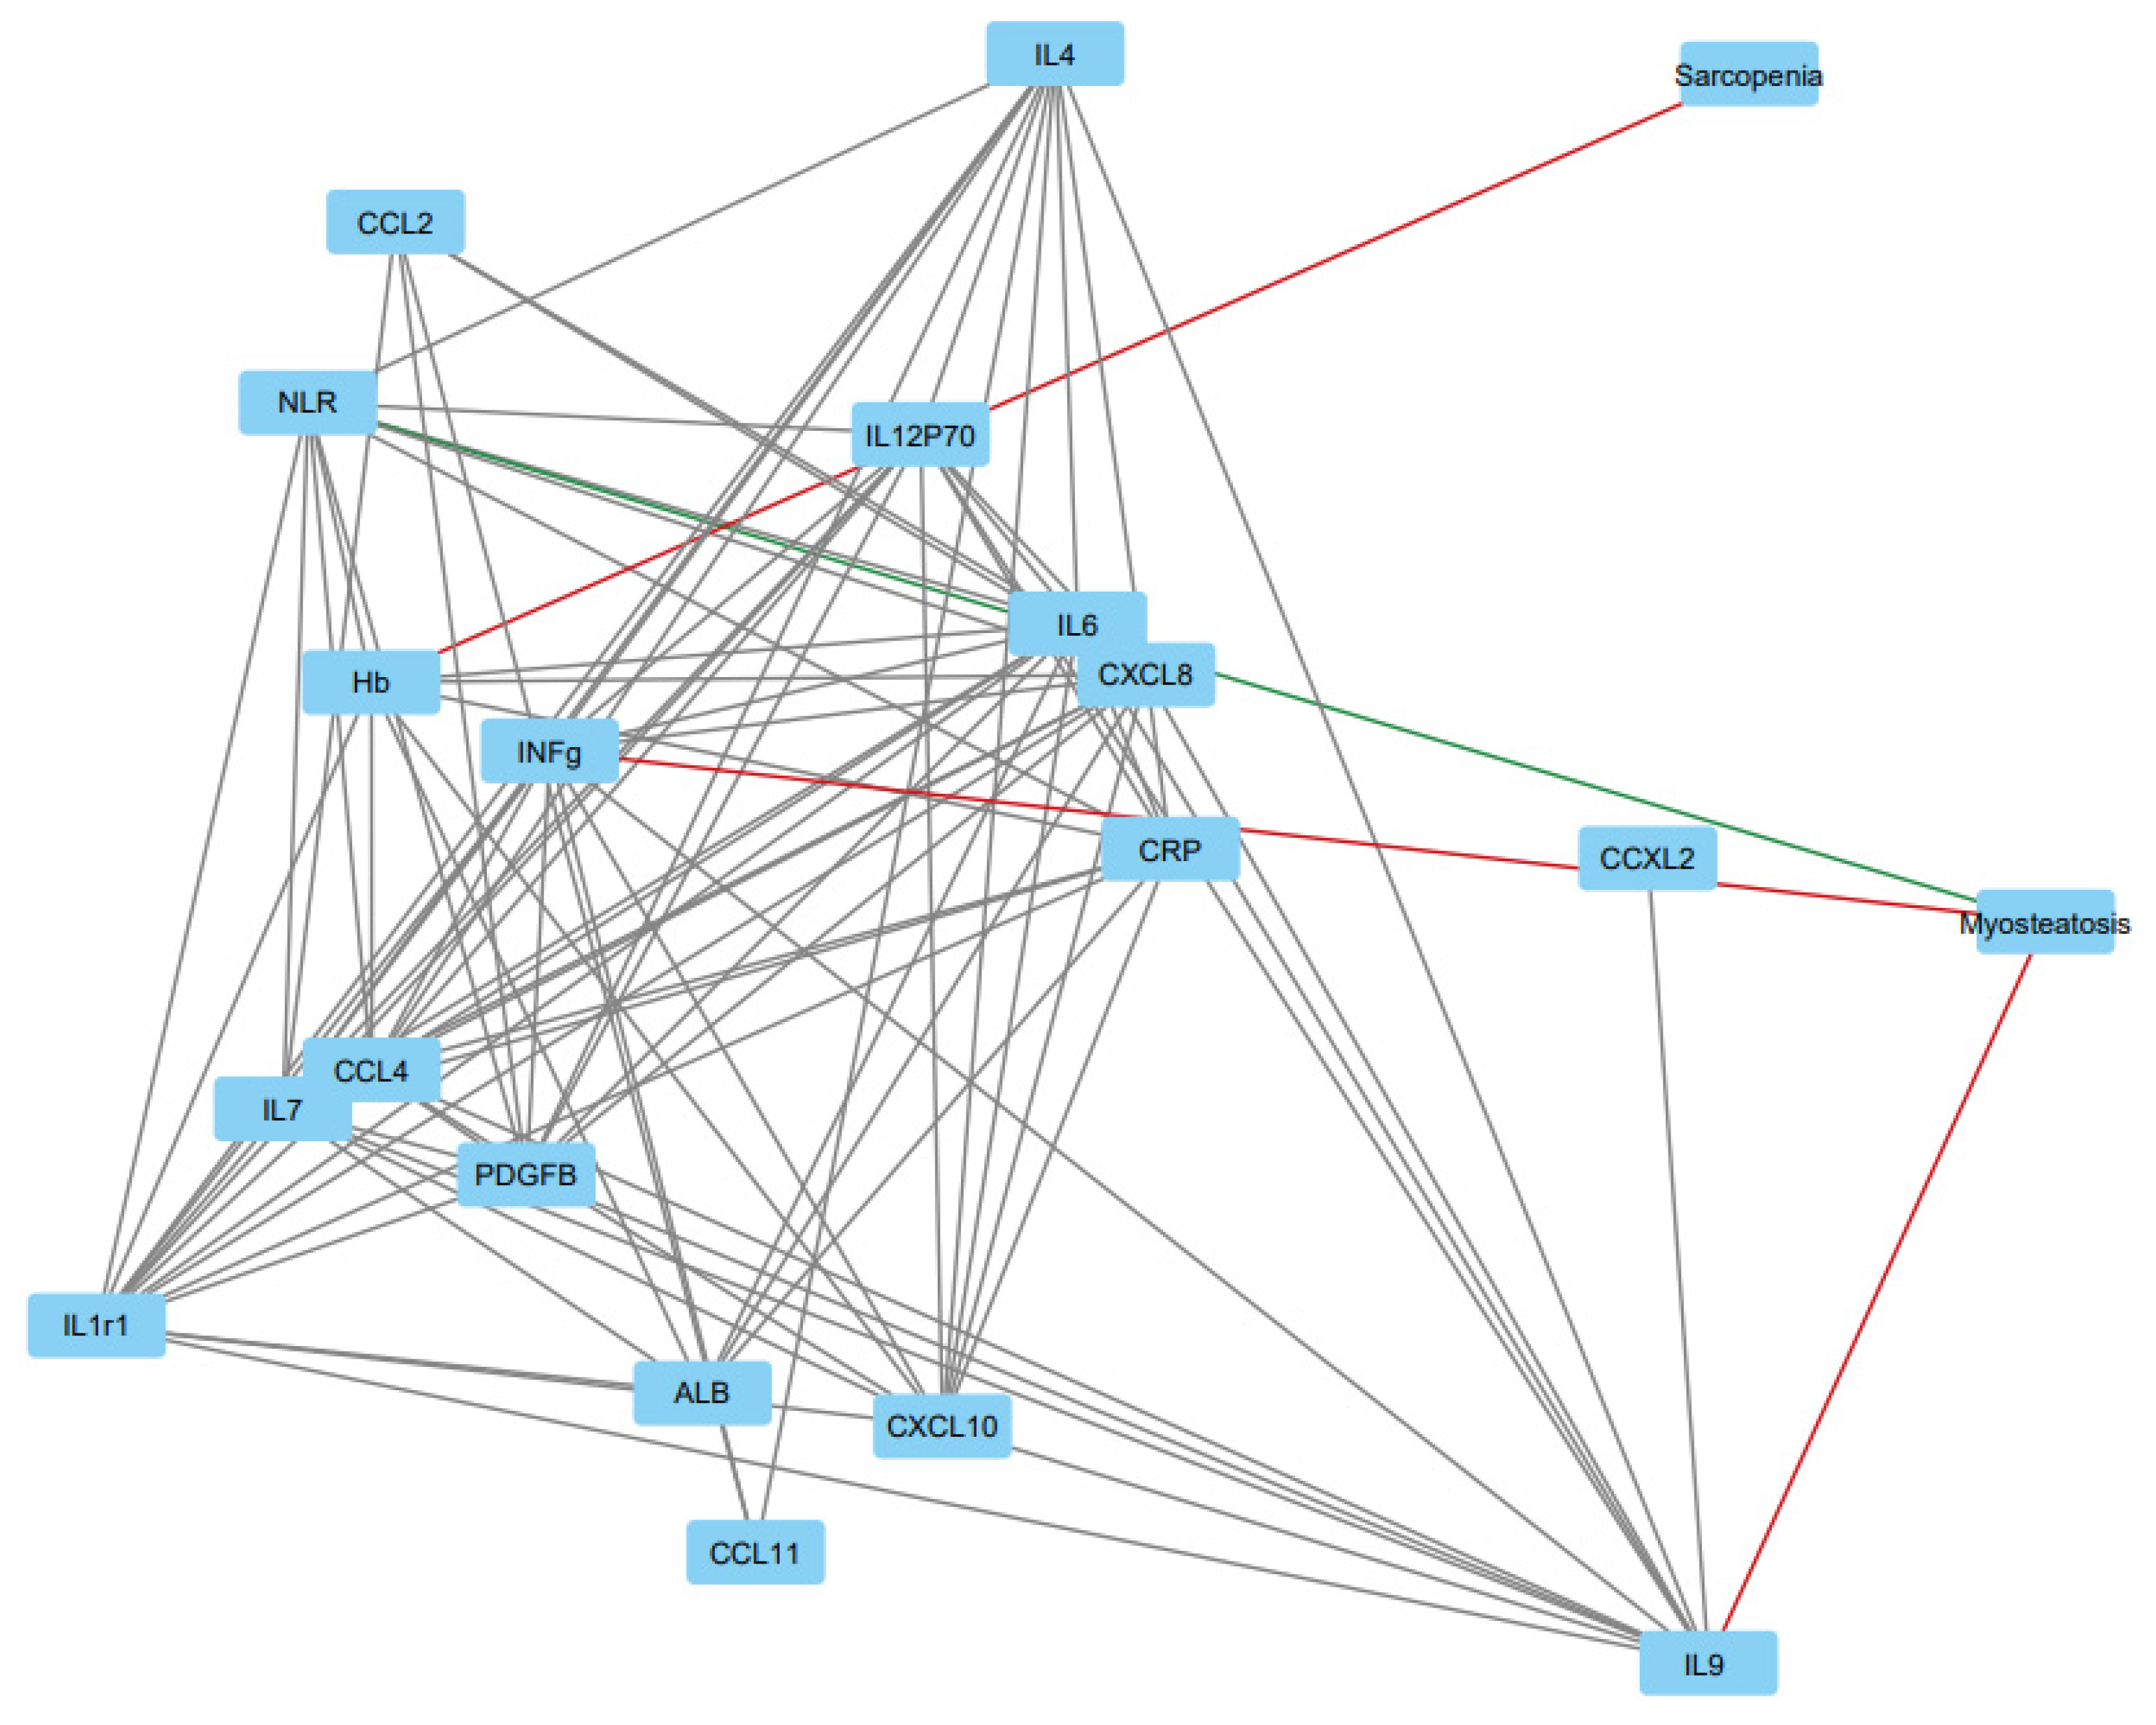
3.3. Sarcopenia and Myosteatosis in Relation to Systemic Inflammatory Markers
3.4. Multivariable Analyses
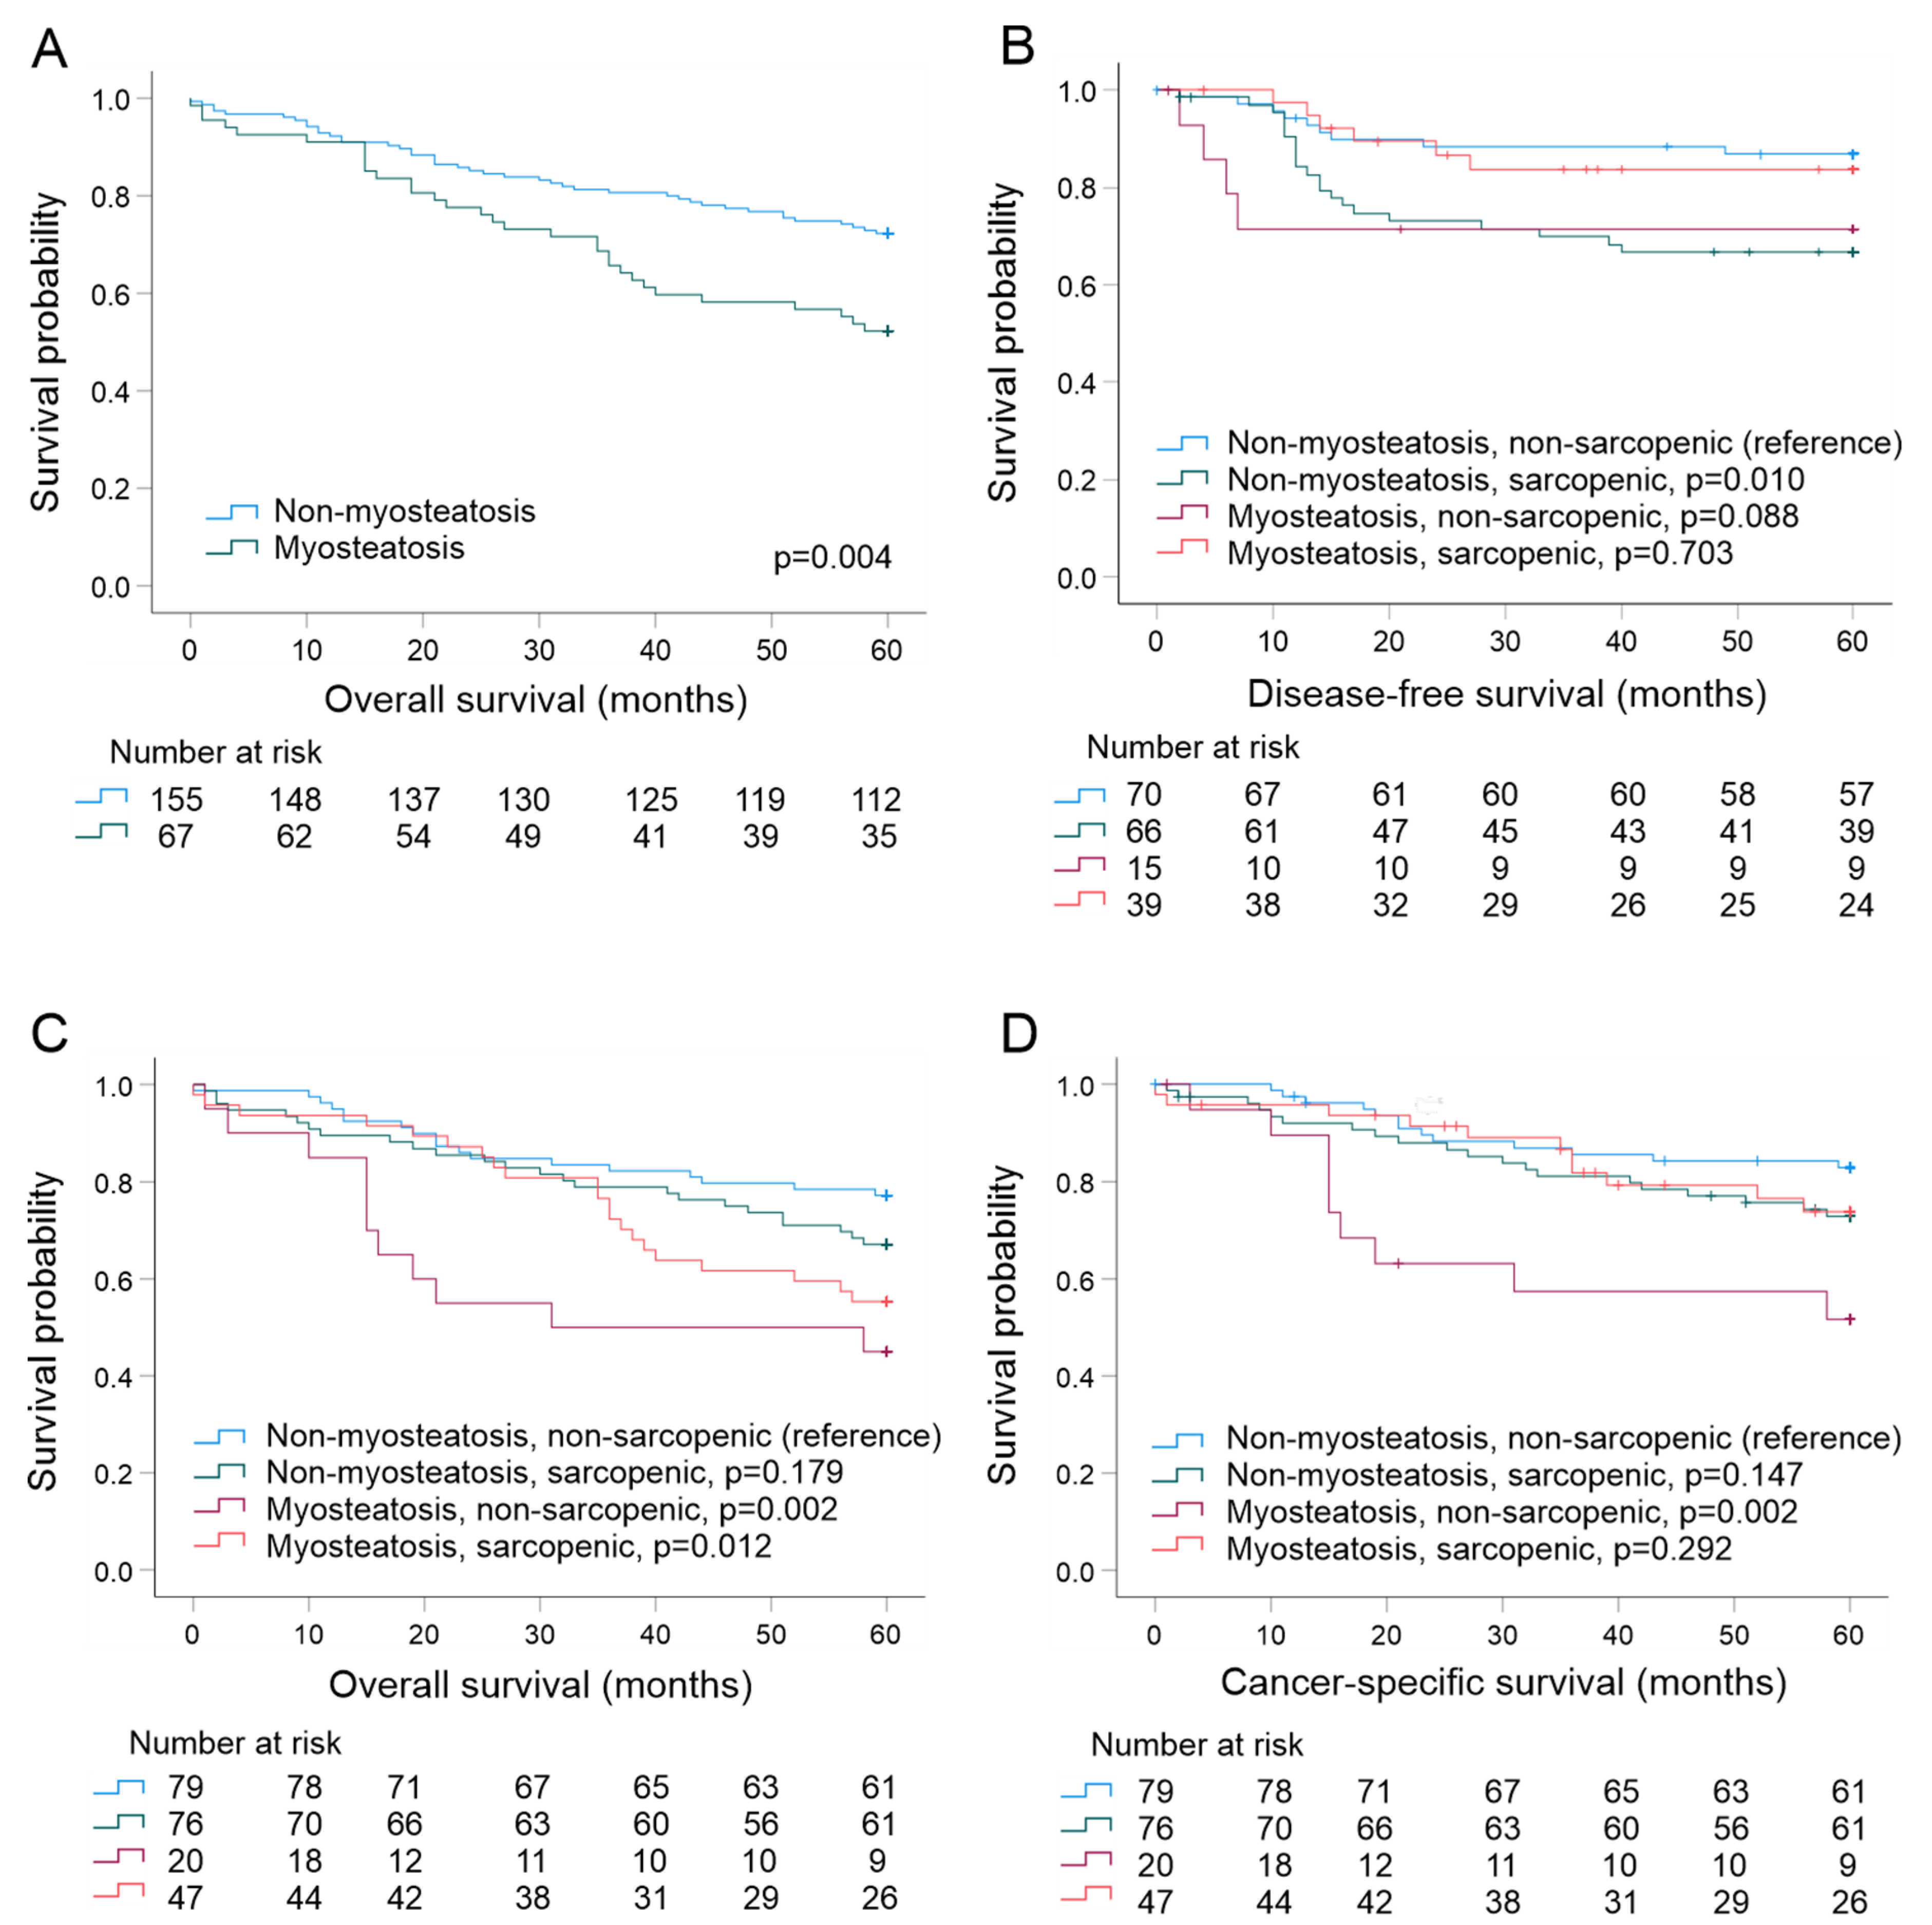
3.5. Survival Analyses
3.6. Sarcopenia and Myosteatosis in Stage I–III CRC
4. Discussion
5. Conclusions
Supplementary Materials
Author Contributions
Funding
Institutional Review Board Statement
Informed Consent Statement
Data Availability Statement
Acknowledgments
Conflicts of Interest
References
- Aro, R.; Mäkäräinen-Uhlbäck, E.; Ämmälä, N.; Rautio, T.; Ohtonen, P.; Saarnio, J.; Meriläinen, S. The impact of sarcopenia and myosteatosis on postoperative outcomes and 5-year survival in curatively operated colorectal cancer patients—A retrospective register study. Eur. J. Surg. Oncol. 2020, 46, 1656–1662. [Google Scholar] [CrossRef] [PubMed]
- Malietzis, G.; Currie, A.C.; Athanasiou, T.; Johns, N.; Anyamene, N.; Glynne-Jones, R.; Kennedy, R.H.; Fearon, K.C.H.; Jenkins, J.T. Influence of body composition profile on outcomes following colorectal cancer surgery. Br. J. Surg. 2016, 103, 572–580. [Google Scholar] [CrossRef] [PubMed]
- Van Vugt, J.L.A.; Coebergh van den Braak, R.R.J.; Lalmahomed, Z.S.; Vrijland, W.W.; Dekker, J.W.T.; Zimmerman, D.D.E.; Vles, W.J.; Coene, P.-P.L.O.; IJzermans, J.N.M. Impact of Low Skeletal Muscle Mass and Density on Short and Long-Term Outcome after Resection of Stage I-III Colorectal Cancer. Eur. J. Surg. Oncol. 2018, 44, 1354–1360. [Google Scholar] [CrossRef]
- Almasaudi, A.S.; Dolan, R.D.; Edwards, C.A.; McMillan, D.C. hypoalbuminemia reflects nutritional risk, body composition and systemic inflammation and is independently associated with survival in patients with colorectal cancer. Cancers 2020, 12, 1986. [Google Scholar] [CrossRef] [PubMed]
- Cederholm, T.; Barazzoni, R.; Austin, P.; Ballmer, P.; Biolo, G.; Bischoff, S.C.; Compher, C.; Correia, I.; Higashiguchi, T.; Holst, M.; et al. ESPEN guidelines on definitions and terminology of clinical nutrition. Clin. Nutr. 2017, 36, 49–64. [Google Scholar] [CrossRef]
- Cederholm, T.; Jensen, G.L.; Correia, M.I.T.D.; Gonzalez, M.C.; Fukushima, R.; Higashiguchi, T.; Baptista, G.; Barazzoni, R.; Blaauw, R.; Coats, A.J.S.; et al. GLIM Criteria for the diagnosis of malnutrition—A consensus report from the Global Clinical Nutrition Community. J. Cachexia Sarcopenia Muscle 2019, 10, 207–217. [Google Scholar] [CrossRef] [Green Version]
- Bauer, J.; Morley, J.E.; Schols, A.M.W.J.; Ferrucci, L.; Cruz-Jentoft, A.J.; Dent, E.; Baracos, V.E.; Crawford, J.A.; Doehner, W.; Heymsfield, S.B.; et al. Sarcopenia: A time for action. An SCWD position paper. J. Cachexia Sarcopenia Muscle 2019, 10, 956–961. [Google Scholar] [CrossRef]
- Fuggle, N.; Shaw, S.; Dennison, E.; Cooper, C. Sarcopenia. Best Pract. Res. Clin. Rheumatol. 2017, 31, 218–242. [Google Scholar] [CrossRef] [PubMed] [Green Version]
- Cruz-Jentoft, A.J.; Romero-Yuste, S.; Chamizo Carmona, E.; Nolla, J.M. Sarcopenia, immune-mediated rheumatic diseases, and nutritional interventions. Aging Clin. Exp. Res. 2021, 33, 2929–2939. [Google Scholar] [CrossRef] [PubMed]
- Hamrick, M.W.; McGee-Lawrence, M.E.; Frechette, D.M. Fatty Infiltration of skeletal muscle: Mechanisms and comparisons with bone marrow adiposity. Front. Endocrinol. 2016, 7, 69. [Google Scholar] [CrossRef] [Green Version]
- Lieffers, J.R.; Bathe, O.F.; Fassbender, K.; Winget, M.; Baracos, V.E. Sarcopenia is associated with postoperative infection and delayed recovery from colorectal cancer resection surgery. Br. J. Cancer 2012, 107, 931–936. [Google Scholar] [CrossRef] [PubMed] [Green Version]
- Nakanishi, R.; Oki, E.; Sasaki, S.; Hirose, K.; Jogo, T.; Edahiro, K.; Korehisa, S.; Taniguchi, D.; Kudo, K.; Kurashige, J.; et al. Sarcopenia is an independent predictor of complications after colorectal cancer surgery. Surg. Today 2018, 48, 151–157. [Google Scholar] [CrossRef] [PubMed]
- Vergara-Fernandez, O.; Trejo-Avila, M.; Salgado-Nesme, N. Sarcopenia in patients with colorectal cancer: A comprehensive review. World J. Clin. Cases 2020, 8, 1188–1202. [Google Scholar] [CrossRef]
- Lee, C.M.; Kang, J. Prognostic impact of myosteatosis in patients with colorectal cancer: A systematic review and meta-analysis. J. Cachexia Sarcopenia Muscle 2020, 11, 1270–1282. [Google Scholar] [CrossRef] [PubMed]
- Tuomisto, A.E.; Mäkinen, M.J.; Väyrynen, J.P. Systemic inflammation in colorectal cancer: Underlying factors, effects, and prognostic significance. World J. Gastroenterol. 2019, 25, 4383–4404. [Google Scholar] [CrossRef] [PubMed]
- Kantola, T.; Klintrup, K.; Väyrynen, J.P.P.; Vornanen, J.; Bloigu, R.; Karhu, T.; Herzig, K.-H.; Näpänkangas, J.; Mäkelä, J.; Karttunen, T.J.J.; et al. Stage-dependent alterations of the serum cytokine pattern in colorectal carcinoma. Br. J. Cancer 2012, 107, 1729–1736. [Google Scholar] [CrossRef] [PubMed] [Green Version]
- McMillan, D.C. The systemic inflammation-based glasgow prognostic score: A decade of experience in patients with cancer. Cancer Treat. Rev. 2013, 39, 534–540. [Google Scholar] [CrossRef] [PubMed]
- Park, J.H.; Watt, D.G.; Roxburgh, C.S.D.; Horgan, P.G.; McMillan, D.C. Colorectal cancer, systemic inflammation, and outcome. Ann. Surg. 2016, 263, 326–336. [Google Scholar] [CrossRef]
- McMillan, D.C.; Canna, K.; McArdle, C.S. Systemic inflammatory response predicts survival following curative resection of colorectal cancer. Br. J. Surg. 2003, 90, 215–219. [Google Scholar] [CrossRef] [PubMed]
- McMillan, D.C.; Crozier, J.E.M.; Canna, K.; Angerson, W.J.; McArdle, C.S. Evaluation of an inflammation-based prognostic score (GPS) in patients undergoing resection for colon and rectal cancer. Int. J. Colorectal Dis. 2007, 22, 881–886. [Google Scholar] [CrossRef] [PubMed]
- Dolan, R.D.; McSorley, S.T.; Horgan, P.G.; Laird, B.; McMillan, D.C. The role of the systemic inflammatory response in predicting outcomes in patients with advanced inoperable cancer: Systematic review and meta -analysis. Crit. Rev. Oncol. Hematol. 2017, 116, 134–146. [Google Scholar] [CrossRef] [PubMed] [Green Version]
- Dolan, R.D.; Almasaudi, A.S.; Dieu, L.B.; Horgan, P.G.; McSorley, S.T.; McMillan, D.C. The relationship between computed tomography-derived body composition, systemic inflammatory response, and survival in patients undergoing surgery for colorectal cancer. J. Cachexia Sarcopenia Muscle 2019, 10, 111–122. [Google Scholar] [CrossRef] [PubMed]
- McSorley, S.T.; Black, D.H.; Horgan, P.G.; McMillan, D.C. The relationship between tumour stage, systemic inflammation, body composition and survival in patients with colorectal cancer. Clin. Nutr. 2018, 37, 1279–1285. [Google Scholar] [CrossRef] [PubMed] [Green Version]
- Malietzis, G.; Johns, N.; Al-Hassi, H.O.; Knight, S.C.; Kennedy, R.H.; Fearon, K.C.H.; Aziz, O.; Jenkins, J.T. Low muscularity and myosteatosis is related to the host systemic inflammatory response in patients undergoing surgery for colorectal cancer. Ann. Surg. 2016, 263, 320–325. [Google Scholar] [CrossRef] [PubMed]
- Reisinger, K.W.; Derikx, J.P.M.; van Vugt, J.L.A.; Von Meyenfeldt, M.F.; Hulsewé, K.W.; Olde Damink, S.W.M.; Stoot, J.H.M.B.; Poeze, M. Sarcopenia is associated with an increased inflammatory response to surgery in colorectal cancer. Clin. Nutr. 2016, 35, 924–927. [Google Scholar] [CrossRef] [PubMed]
- Väyrynen, J.P.; Tuomisto, A.; Väyrynen, S.A.; Klintrup, K.; Karhu, T.; Mäkelä, J.; Herzig, K.-H.; Karttunen, T.J.; Mäkinen, M.J. Preoperative anemia in colorectal cancer: Relationships with tumor characteristics, systemic inflammation, and survival. Sci. Rep. 2018, 8, 1126. [Google Scholar] [CrossRef]
- Väyrynen, J.P.; Vornanen, J.; Tervahartiala, T.; Sorsa, T.; Bloigu, R.; Salo, T.; Tuomisto, A.; Mäkinen, M.J. Serum MMP-8 Levels increase in colorectal cancer and correlate with disease course and inflammatory properties of primary tumors. Int. J. Cancer 2012, 131, E463–E474. [Google Scholar] [CrossRef]
- Malietzis, G.; Giacometti, M.; Askari, A.; Nachiappan, S.; Kennedy, R.H.; Faiz, O.D.; Aziz, O.; Jenkins, J.T. A preoperative neutrophil to lymphocyte ratio of 3 predicts disease-free survival after curative elective colorectal cancer surgery. Ann. Surg. 2014, 260, 287–292. [Google Scholar] [CrossRef]
- Tuppurainen, K.; Mäkinen, J.M.; Junttila, O.; Liakka, A.; Kyllönen, A.P.; Tuominen, H.; Karttunen, T.J.; Mäkinen, M.J. Morphology and microsatellite instability in sporadic serrated and non-serrated colorectal cancer. J. Pathol. 2005, 207, 285–294. [Google Scholar] [CrossRef]
- Bosman, F.T.; Carneiro, F.; Hruban, R.H.; Theise, N.D. (Eds.) WHO Classification of Tumours of the Digestive System, 4th ed.; International Agency for Research on Cancer: Lyon, France, 2010; Volume 3. [Google Scholar]
- Sajanti, S.A.; Sirniö, P.; Väyrynen, J.P.; Tuomisto, A.; Klintrup, K.; Mäkelä, J.; Ristimäki, A.; Mäkinen, M.J. VE1 Immunohistochemistry accurately detects BRAF V600E mutations in colorectal carcinoma and can be utilized in the detection of poorly differentiated colorectal serrated adenocarcinoma. Virchows Arch. 2014, 464, 637–643. [Google Scholar] [CrossRef] [PubMed]
- Martin, L.; Birdsell, L.; Macdonald, N.; Reiman, T.; Clandinin, M.T.; McCargar, L.J.; Murphy, R.; Ghosh, S.; Sawyer, M.B.; Baracos, V.E. Cancer cachexia in the age of obesity: Skeletal muscle depletion is a powerful prognostic factor, independent of body mass index. J. Clin. Oncol. 2013, 31, 1539–1547. [Google Scholar] [CrossRef]
- Hopkins, J.J.; Reif, R.L.; Bigam, D.L.; Baracos, V.E.; Eurich, D.T.; Sawyer, M.B. The impact of muscle and adipose tissue on long-term survival in patients with stage I to III colorectal cancer. Dis. Colon Rectum 2019, 62, 549–560. [Google Scholar] [CrossRef] [PubMed]
- Chen, W.-Z.; Chen, X.-D.; Ma, L.-L.; Zhang, F.-M.; Lin, J.; Zhuang, C.-L.; Yu, Z.; Chen, X.-L.; Chen, X.-X. Impact of visceral obesity and sarcopenia on short-term outcomes after colorectal cancer surgery. Dig. Dis. Sci. 2018, 63, 1620–1630. [Google Scholar] [CrossRef]
- Choi, M.H.; Oh, S.N.; Lee, I.K.; Oh, S.T.; Won, D.D. Sarcopenia is negatively associated with long-term outcomes in locally advanced rectal cancer. J. Cachexia Sarcopenia Muscle 2018, 9, 53–59. [Google Scholar] [CrossRef]
- Huang, D.-D.; Wang, S.-L.; Zhuang, C.-L.; Zheng, B.-S.; Lu, J.-X.; Chen, F.-F.; Zhou, C.-J.; Shen, X.; Yu, Z. Sarcopenia, as defined by low muscle mass, strength and physical performance, predicts complications after surgery for colorectal cancer. Colorectal Dis. 2015, 17, O256–O264. [Google Scholar] [CrossRef]
- Xiao, J.; Caan, B.J.; Cespedes Feliciano, E.M.; Meyerhardt, J.A.; Kroenke, C.H.; Baracos, V.E.; Weltzien, E.; Kwan, M.L.; Alexeeff, S.E.; Castillo, A.L.; et al. the association of medical and demographic characteristics with sarcopenia and low muscle radiodensity in patients with nonmetastatic colorectal cancer. Am. J. Clin. Nutr. 2019, 109, 615–625. [Google Scholar] [CrossRef] [PubMed]
- Abbass, T.; Dolan, R.D.; Laird, B.J.; McMillan, D.C. The relationship between imaging-based body composition analysis and the systemic inflammatory response in patients with cancer: A systematic review. Cancers 2019, 11, 1304. [Google Scholar] [CrossRef] [Green Version]
- Boonpipattanapong, T.; Chewatanakornkul, S. Preoperative carcinoembryonic antigen and albumin in predicting survival in patients with colon and rectal carcinomas. J. Clin. Gastroenterol. 2006, 40, 592–595. [Google Scholar] [CrossRef]
- Guthrie, G.J.K.; Charles, K.A.; Roxburgh, C.S.D.; Horgan, P.G.; McMillan, D.C.; Clarke, S.J. The systemic inflammation-based neutrophil-lymphocyte ratio: Experience in patients with cancer. Crit. Rev. Oncol. Hematol. 2013, 88, 218–230. [Google Scholar] [CrossRef] [PubMed]
- Gabay, C.; Kushner, I. Acute-phase proteins and other systemic responses to inflammation. N. Engl. J. Med. 1999, 340, 448–454. [Google Scholar] [CrossRef] [PubMed]
- Nagareddy, P.R.; Murphy, A.J.; Stirzaker, R.A.; Hu, Y.; Yu, S.; Miller, R.G.; Ramkhelawon, B.; Distel, E.; Westerterp, M.; Huang, L.-S.; et al. Hyperglycemia promotes myelopoiesis and impairs the resolution of atherosclerosis. Cell Metab. 2013, 17, 695–708. [Google Scholar] [CrossRef] [PubMed] [Green Version]
- Guo, X.; Zhang, S.; Zhang, Q.; Liu, L.; Wu, H.; Du, H.; Shi, H.; Wang, C.; Xia, Y.; Liu, X.; et al. Neutrophil:Lymphocyte ratio is positively related to type 2 diabetes in a large-scale adult population: A Tianjin chronic low-grade systemic inflammation and health cohort study. Eur. J. Endocrinol. 2015, 173, 217–225. [Google Scholar] [CrossRef] [PubMed] [Green Version]
- Mertoglu, C.; Gunay, M. Neutrophil-lymphocyte ratio and platelet-lymphocyte ratio as useful predictive markers of prediabetes and diabetes mellitus. Diabetes Metab. Syndr. 2017, 11 (Suppl. 1), S127–S131. [Google Scholar] [CrossRef] [PubMed]
- Dhillon, R.J.S.; Hasni, S. Pathogenesis and Management of Sarcopenia. Clin. Geriatr. Med. 2017, 33, 17–26. [Google Scholar] [CrossRef] [PubMed] [Green Version]
- Mäkinen, M.J. Colorectal serrated adenocarcinoma. Histopathology 2007, 50, 131–150. [Google Scholar] [CrossRef] [PubMed]
- Mukhopadhyay, S.; Vander Heiden, M.G.; McCormick, F. The metabolic landscape of RAS-driven cancers from biology to therapy. Nat. Cancer 2021, 2, 271–283. [Google Scholar] [CrossRef] [PubMed]
- He, P.; Zou, Y.; Qiu, J.; Yang, T.; Peng, L.; Zhang, X. Pretreatment 18F-FDG PET/CT imaging predicts the KRAS/NRAS/BRAF gene mutational status in colorectal cancer. J. Oncol. 2021, 2021, 6687291. [Google Scholar] [CrossRef]
- Shirdel, M.; Andersson, F.; Myte, R.; Axelsson, J.; Rutegård, M.; Blomqvist, L.; Riklund, K.; van Guelpen, B.; Palmqvist, R.; Gylling, B. Body composition measured by computed tomography is associated with colorectal cancer survival, also in early-stage disease. Acta Oncol. 2020, 59, 799–808. [Google Scholar] [CrossRef]
- Mäkinen, M.J.; George, S.M.; Jernvall, P.; Mäkelä, J.; Vihko, P.; Karttunen, T.J. colorectal carcinoma associated with serrated adenoma--prevalence, histological features, and prognosis. J. Pathol. 2001, 193, 286–294. [Google Scholar] [CrossRef]
- Cespedes Feliciano, E.M.; Kroenke, C.H.; Meyerhardt, J.A.; Prado, C.M.; Bradshaw, P.T.; Kwan, M.L.; Xiao, J.; Alexeeff, S.; Corley, D.; Weltzien, E.; et al. Association of systemic inflammation and sarcopenia with survival in nonmetastatic colorectal cancer. JAMA Oncol. 2017, 3, e172319. [Google Scholar] [CrossRef]
- Aleixo, G.F.P.; Shachar, S.S.; Nyrop, K.A.; Muss, H.B.; Malpica, L.; Williams, G.R. Myosteatosis and prognosis in cancer: Systematic review and meta-analysis. Crit. Rev. Oncol. Hematol. 2020, 145, 102839. [Google Scholar] [CrossRef] [PubMed]
- Kroenke, C.H.; Prado, C.M.; Meyerhardt, J.A.; Weltzien, E.K.; Xiao, J.; Cespedes Feliciano, E.M.; Caan, B.J. Muscle radiodensity and mortality in patients with colorectal cancer. Cancer 2018, 124, 3008–3015. [Google Scholar] [CrossRef] [PubMed]
- Miyamoto, Y.; Baba, Y.; Sakamoto, Y.; Ohuchi, M.; Tokunaga, R.; Kurashige, J.; Hiyoshi, Y.; Iwagami, S.; Yoshida, N.; Yoshida, M.; et al. Sarcopenia is a negative prognostic factor after curative resection of colorectal cancer. Ann. Surg. Oncol. 2015, 22, 2663–2668. [Google Scholar] [CrossRef] [PubMed]
- McShane, L.M.; Altman, D.G.; Sauerbrei, W.; Taube, S.E.; Gion, M.; Clark, G.M. Statistics subcommittee of the NCI-EORTC working group on cancer diagnostics REporting recommendations for tumour MARKer prognostic studies (REMARK). Br. J. Cancer 2005, 93, 387–391. [Google Scholar] [CrossRef] [PubMed] [Green Version]


| Colorectal Cancer Patients (n = 222) | n (%) |
|---|---|
| Body composition | |
| Normal muscle | 79 (35.6%) |
| Myosteatosis alone | 20 (9.0%) |
| Sarcopenia alone | 76 (34.2%) |
| Both myosteatosis and sarcopenia | 47 (21.2%) |
| Age | |
| <70 years old | 95 (42.8%) |
| ≥70 years old | 127 (57.2%) |
| Gender | |
| Male | 117 (52.7%) |
| Female | 105 (47.3%) |
| BMI categories | |
| Underweight < 18.5 kg/m2 | 3 (1.4%) |
| Normal weight 18.5–24.9 kg/m2 | 73 (32.9%) |
| Overweight 25–29.9 kg/m2 | 92 (41.4%) |
| Obese ≥ 30 kg/m2 | 54 (24.3%) |
| Tumor location | |
| Proximal colon | 89 (40.1%) |
| Distal colon | 58 (26.1%) |
| Rectum | 75 (33.8%) |
| TNM stage | |
| Stage I | 42 (18.9%) |
| Stage II | 75 (33.8%) |
| Stage III | 73 (32.9%) |
| Stage IV | 32 (14.4%) |
| Depth of invasion | |
| T1 | 13 (5.9%) |
| T2 | 43 (19.4%) |
| T3 | 152 (68.5%) |
| T4 | 14 (6.3%) |
| Nodal metastases | |
| N0 | 120 (54.1%) |
| N1 | 67 (30.2%) |
| N2 | 35 (15.8%) |
| Distant metastases | |
| M0 | 190 (85.6%) |
| M1 | 32 (14.4%) |
| Morphology | |
| conventional | 156 (70.3%) |
| serrated | 66 (29.7%) |
| Operation type | |
| Curative | 192 (86.5%) |
| Palliative | 30 (13.5%) |
| ASA classification | |
| 1 (no systemic diseases) | 13 (5.9%) |
| 2 (mild systemic disease) | 96 (43.2%) |
| 3 (severe systemic disease) | 84 (37.8%) |
| 4 (very severe systemic disease) | 18 (8.1%) |
| Coronary artery disease | |
| No | 177 (79.7%) |
| Yes | 45 (20.3%) |
| Diabetes | |
| No | 185 (83.3%) |
| Yes | 37 (16.7%) |
| Preoperative blood samples | |
| Hemoglobin, g/L | 125.7 (±17.0) [86–167] |
| CEA, μg/L | 32.3 (±188.8) [0.5–2423.0] |
| Albumin, g/L | 42.7 (±4.4) [21–69] |
| C-reactive protein, mg/L | 10.4 (±25.3) [0.0–189.0] |
| NLR | |
| ≤3 | 165 (75%) |
| >3 | 55 (25%) |
| Modified Glasgow prognostic score | |
| 0 | 177 (79.7%) |
| 1 | 41 (18.5%) |
| 2 | 4 (1.8%) |
| 5-year cancer recurrence | 43 (19.4%) |
| Died in 90 days | 8 (3.6%) |
| Died in 5 years | 75 (33.8%) |
| Follow-up, month | 82 (± 45.3) [0.10–164.5] |
| Factors | Neither Sarcopenia Nor Myosteatosis (n = 79) | Sarcopenia Only, No Myosteatosis (n = 76) | Myosteatosis Only, No Sarcopenia (n = 20) | Both Sarcopenia and Myosteatosis (n = 47) | p-Value |
|---|---|---|---|---|---|
| Age, mean, years, (±SD) | 65 (±11.2) | 70 (±11.0) | 72 (±9.9) | 76 (±9.7) | <0.001 |
| Age | |||||
| ≤70 years (n = 95) | 51 (64.6%) | 27 (35.5%) | 6 (30.0%) | 11 (23.4%) | <0.001 |
| >70 years (n = 127) | 28 (35.4%) | 49 (64.5%) | 14 (70.0%) | 36 (76.6%) | |
| Gender | |||||
| Male (n = 117) | 48 (60.8%) | 40 (52.6%) | 8 (40.0%) | 21 (44.7%) | 0.211 |
| Female (n = 105) | 31 (39.2%) | 36 (47.4%) | 12 (60.0%) | 26 (55.3%) | |
| BMI, kg/m2 | |||||
| <18.5 (n = 3) | 1 (1.3%) | 2 (2.6%) | 0 (0.0%) | 0 (0.0%) | <0.001 |
| 18.5–24.9 (n = 73) | 27 (34.2%) | 15 (19.7%) | 6 (30.0%) | 25 (53.2%) | |
| 25–29.9 (n = 92) | 24 (30.4%) | 47 (61.8%) | 7 (35.0%) | 14 (29.8%) | |
| >30 (n = 54) | 27 (34.2%) | 12 (15.8%) | 7 (35.0%) | 8 (17.0%) | |
| Tumor location | |||||
| Proximal colon (n = 89) | 28 (35.4%) | 24 (31.6%) | 11 (55.0%) | 26 (55.3%) | 0.039 |
| Distal colon (n = 58) | 17 (21.5%) | 26 (34.2%) | 5 (25.0%) | 10 (21.3%) | |
| Rectum (n = 75) | 34 (43.0%) | 26 (34.2%) | 4 (20.0%) | 11 (23.4%) | |
| WHO grade | |||||
| Grade 1 (n = 56) | 20 (25.3%) | 16 (21.1%) | 6 (30.0%) | 14 (29.8%) | 0.176 |
| Grade 2 (n = 140) | 53 (67.1%) | 49 (64.5%) | 14 (70.0%) | 24 (51.1%) | |
| Grade 3 (n = 26) | 6 (7.6%) | 11 (14.5%) | 0 (0.0%) | 9 (19.1%) | |
| TNM stage | |||||
| I (n = 42) | 18 (22.8%) | 8 (10.5%) | 5 (25.0%) | 11 (23.4%) | 0.398 |
| II (n = 75) | 27 (34.2%) | 27 (35.5%) | 5 (25.0%) | 16 (34.0%) | |
| III (n = 73) | 24 (30.4%) | 31 (40.8%) | 5 (25.0%) | 13 (27.7%) | |
| IV (n = 32) | 10 (12.7%) | 10 (13.2%) | 5 (25.0%) | 7 (14.9%) | |
| Depth of invasion | |||||
| T1 (n = 13) | 7 (8.9%) | 3 (3,9%) | 1 (5.0%) | 2 (4.3%) | 0.193 |
| T2 (n = 43) | 16 (20.3%) | 9 (11.8%) | 6 (30.0%) | 12 (25.5%) | |
| T3 (n = 152) | 50 (63.3%) | 61 (80.3%) | 13 (65.0%) | 28 (59.6%) | |
| T4 (n = 14) | 6 (7.6%) | 3 (3.9%) | 0 (0.0%) | 5 (10.6%) | |
| Nodal metastases | |||||
| N0 (n = 120) | 46 (58.2%) | 36 (47.4%) | 10 (50.0%) | 28 (59.6%) | 0.382 |
| N1 (n = 67) | 19 (24.1%) | 30 (39.5%) | 5 (25.0%) | 13 (27.7%) | |
| N2 (n = 35) | 14 (17.7%) | 10 (13.2%) | 5 (25.0%) | 6 (12.8%) | |
| Distant metastases | |||||
| M0 (n = 190) | 69 (87.3%) | 66 (86.8%) | 15 (75.0%) | 40 (85.1%) | 0.541 |
| M1 (n = 32) | 10 (12.7%) | 10 (13.2%) | 5 (25.0%) | 7 (14.9%) | |
| Serrated morphology | |||||
| yes (n = 66) | 18 (22.8%) | 15 (19.7%) | 9 (45.0%) | 24 (51.1%) | <0.001 |
| no (n = 156) | 61 (77.2%) | 61 (80.3%) | 11 (55.0%) | 23 (48.9%) | |
| ASA grade | |||||
| I (n = 13) | 7 (9.1%) | 4 (5.4%) | 1 (5.6%) | 1 (2.4%) | 0.004 |
| II (n = 96) | 46 (59.7%) | 34 (45.9%) | 4 (22.2%) | 12 (28.6%) | |
| III (n = 84) | 18 (23.4%) | 31 (41.9%) | 11 (61.1%) | 24 (57.1%) | |
| IV (n = 18) | 6 (7.8%) | 5 (6.8%) | 2 (11.1%) | 5 (11.9%) | |
| Diabetes | |||||
| No (n = 185) | 66 (83.5%) | 67 (88.2%) | 15 (75.0%) | 37 (78.7%) | 0.354 |
| Yes (n = 37) | 13 (16.6%) | 9 (11.8%) | 5 (25.0%) | 10 (21.3%) | |
| Coronary artery disease | |||||
| No (n = 177) | 67 (84.8%) | 62 (81.6%) | 13 (65.0%) | 35 (74.5%) | 0.177 |
| Yes (n = 45) | 12 (15.2%) | 14 (18.4%) | 7 (35.0%) | 12 (25.5%) | |
| Use of blood pressure lowering medication | |||||
| No (n = 95) | 43 (54.4%) | 31 (40.3%) | 6 (30.0%) | 15 (31.9%) | 0.043 |
| Yes (n = 127) | 36 (45.6%) | 45 (59.2%) | 14 (70.0%) | 32 (68.1%) | |
| Use of cholesterol lowering medication | |||||
| No (n = 146) | 54 (68.4%) | 46 (60.5%) | 11 (55.0%) | 35 (74.5%) | 0.290 |
| Yes (n = 76) | 25 (31.6%) | 30 (39.5%) | 9 (45.0%) | 12 (25.5%) | |
| CRP, mg/L | |||||
| ≤10 (n = 176) | 63 (79.7%) | 60 (78.9%) | 18 (90.0%) | 35 (74.5%) | 0.584 |
| >10 (n = 46) | 16 (20.3%) | 16 (21.1%) | 2 (10.0%) | 12 (25.5%) | |
| Modified Glasgow prognostic score | |||||
| 0 (n = 177) | 63 (79.7%) | 61 (80.3%) | 18 (90.0%) | 35 (74.5%) | 0.331 |
| 1 (n = 41) | 16 (20.3%) | 14 (18.4%) | 2 (11.8%) | 9 (19.1%) | |
| 2 (n = 4) | 0 (0.0%) | 1 (1.3%) | 0 (0.0%) | 3 (6.4%) | |
| NLR | |||||
| ≤3 (n = 165) | 68 (87.2%) | 53 (70.7%) | 16 (76.5%) | 28 (59.6%) | 0.005 |
| >3 (n = 55) | 10 (12.8%) | 22 (29.3%) | 4 (23.5%) | 19 (40.4%) | |
| Albumin, g/L | |||||
| ≤35 (n = 9) | 0 (0.0%) | 3 (3.9%) | 1 (5.0%) | 5 (10.6%) | 0.018 |
| >35 (n = 213) | 79 (100.0%) | 73 (96.1%) | 19 (95.0%) | 42 (89.4%) | |
| BRAF VE1 immunohistochemistry | |||||
| Negative (n = 196) | 72 (91.1%) | 70 (92.1%) | 16 (80.0%) | 38 (80.9%) | 0.126 |
| Positive (n = 26) | 7 (8.9%) | 6 (7.9%) | 4 (20.0%) | 9 (19.1%) |
| Factors | Neither Sarcopenia Nor Myosteatosis 1 | Sarcopenia Only, No Myosteatosis 2 | Myosteatosis Only, No Sarcopenia 3 | Both Sarcopenia and Myosteatosis 4 | p-Value |
|---|---|---|---|---|---|
| Laboratory parameters, median (IQR) | data | data | |||
| Serum CRP, mg/L | 2.24 (0.70–8.17) | 2.00 (0.71–7.00) | 2.80 (0.91–7.00) | 4.00 (1.00–11.81) | 0.536 |
| Serum Albumin, g/L | 43.00 (41.0–45.0) | 43.0 (41.0–45.0) | 43.0 (39.3–44.8) | 42.0 (38.0–45.0) | 0.264 |
| Blood leukocytes 5 | 6.70 (5.60–7.90) | 6.65 (5.60–7.98) | 7.60 (6.48–8.70) | 7.00 (5.80–8.80) | 0.197 |
| Blood neutrophils 5 | 3.80 (2.88–4.99) | 4.00 (2.90–5.00) | 4.70 (3.93–5.80) | 4.40 (3.30–5.50) | 0.102 |
| Blood lymphocytes 5 | 1.90 (1.50–2.33) | 1.80 (1.30–2.10) | 1.95 (1.63–2.58) | 1.70 (1.20–2.30) | 0.133 |
| Blood NLR | 2.08 (1.47–2.62) | 2.22 (1.60–3.26) | 2.09 (1.64–2.83) | 2.67 (1.71–3.43) | 0.017 |
| Blood monocytes 5 | 0.60 (0.46–0.70) | 0.60 (0.40–0.74) | 0.70 (0.53–0.80) | 0.70 (0.50–0.80) | 0.024 |
| Hemoglobin, g/L | 130 (118–142) | 128 (110–139) | 123 (111–140) | 120 (109–129) | 0.011 |
| CEA, μg/L | 1.60 (1.00–3.98) | 1.80 (1.10–7.90) | 2.85 (1.00–20.68) | 2.70 (1.40–6.73) | 0.104 |
| Cytokines, pg/mL, median (IQR) | |||||
| IL-1R1 | 80.8 (50.8) | 61.9 (58.8) | 46.6 (68.7) | 50.7 (83.5) | 0.664 |
| IL-4 | 1.00 (0.37) | 0.86 (0.50) | 0.78 (0.28) | 0.87 (0.41) | 0.336 |
| IL-6 | 6.47 (5.96) | 4.50 (4.51) | 4.58 (3.46) | 4.69 (10.20) | 0.474 |
| IL-7 | 6.24 (3.35) | 5.34 (3.61) | 5.01 (2.24) | 4.84 (4.00) | 0.577 |
| CXCL8 | 13.4 (6.90) | 10.9 (8.03) | 11.5 (3.39) | 11.3 (10.34) | 0.713 |
| IL-9 | 9.62 (7.27) | 7.57 (10.70) | 6.88 (10.13) | 5.65 (8.04) | 0.106 |
| IL-12 | 30.4 (25.6) | 31.6 (24.1) | 31.7 (24.2) | 27.9 (30.5) | 0.684 |
| IFNg | 37.7 (17.4) | 30.8 (22.9) | 25.3 (16.9) | 27.3 (20.6) | 0.104 |
| CXCL10 | 858 (489) | 924 (539) | 1068 (1055) | 973 (738) | 0.763 |
| CCL2 | 14.6 (9.3) | 15.4 (20.5) | 17.5 (11.3) | 14.7 (17.1) | 0.639 |
| CCL4 | 64.5 (35.7) | 59.4 (18.6) | 58.6 (59.1) | 69.0 (39.8) | 0.550 |
| CCL11 | 138 (67.6) | 123 (83.8) | 155 (96.7) | 114 (77.7) | 0.492 |
| PDGF-BB | 9280 (4823) | 8412 (5360) | 8935 (7759) | 8577 (10810) | 0.986 |
| Factors | OR | 95% CI | p-Value |
|---|---|---|---|
| Age (<70 vs. ≥70 years) | 1.92 | 0.87–4.23 | 0.105 |
| Tumor location (proximal vs. distal colon) | 0.583 | 0.24–1.40 | 0.231 |
| Tumor location (proximal colon vs. rectum) | 0.61 | 0.27–1.36 | 0.228 |
| Serrated morphology (yes vs. no) | 3.76 | 1.82–7.76 | <0.001 |
| ASA grade (I–II vs. III–IV) | 2.66 | 1.20–5.93 | 0.017 |
| NLR (<3 vs. >3) | 1.39 | 0.64–2.96 | 0.407 |
| Albumin level (<35 g/L vs. >35 g/L) | 0.32 | 0.07–1.51 | 0.153 |
| Blood pressure lowering medication (yes/no) | 1.15 | 0.53–2.50 | 0.730 |
| Factors | OR | 95% CI | p-Value |
|---|---|---|---|
| Age (<70 vs. ≥70 years) | 3.23 | 1.65–6.31 | <0.001 |
| Tumor location (proximal vs. distal colon) | 1.78 | 0.80–3.95 | 0.157 |
| Tumor location (proximal colon vs. rectum) | 1.12 | 0.55–2.28 | 0.751 |
| Serrated morphology (yes vs. no) | 1.13 | 0.58–2.21 | 0.723 |
| ASA grade (I–II vs. III–IV) | 1.07 | 0.52–2.19 | 0.860 |
| NLR (<3 vs. >3) | 2.34 | 1.13–4.84 | 0.022 |
| Albumin level (<35 g/L vs. >35 g/L) | 0.22 | 0.03–2.02 | 0.181 |
| Blood pressure lowering medication (yes/no) | 0.84 | 0.43–1.65 | 0.612 |
| Factors | HR | 95% CI | p-Value |
|---|---|---|---|
| Age (<70 vs. ≥70) | 2.69 | 1.58–4.60 | <0.001 |
| Tumor invasion (T1–T2 vs. T3–T4) | 1.22 | 0.68–2.19 | 0.497 |
| Nodal metastases (N0 vs. N1–N2) | 2.74 | 1.60–4.68 | <0.001 |
| Distant metastases (M0 vs. M1) | 5.54 | 3.19–9.62 | <0.001 |
| Myosteatosis (No vs. Yes) | 1.55 | 0.96–2.50 | 0.075 |
Publisher’s Note: MDPI stays neutral with regard to jurisdictional claims in published maps and institutional affiliations. |
© 2022 by the authors. Licensee MDPI, Basel, Switzerland. This article is an open access article distributed under the terms and conditions of the Creative Commons Attribution (CC BY) license (https://creativecommons.org/licenses/by/4.0/).
Share and Cite
Aro, R.; Meriläinen, S.; Sirniö, P.; Väyrynen, J.P.; Pohjanen, V.-M.; Herzig, K.-H.; Rautio, T.T.; Mäkäräinen, E.; Häivälä, R.; Klintrup, K.; et al. Sarcopenia and Myosteatosis Are Associated with Neutrophil to Lymphocyte Ratio but Not Glasgow Prognostic Score in Colorectal Cancer Patients. J. Clin. Med. 2022, 11, 2656. https://doi.org/10.3390/jcm11092656
Aro R, Meriläinen S, Sirniö P, Väyrynen JP, Pohjanen V-M, Herzig K-H, Rautio TT, Mäkäräinen E, Häivälä R, Klintrup K, et al. Sarcopenia and Myosteatosis Are Associated with Neutrophil to Lymphocyte Ratio but Not Glasgow Prognostic Score in Colorectal Cancer Patients. Journal of Clinical Medicine. 2022; 11(9):2656. https://doi.org/10.3390/jcm11092656
Chicago/Turabian StyleAro, Raila, Sanna Meriläinen, Päivi Sirniö, Juha P. Väyrynen, Vesa-Matti Pohjanen, Karl-Heinz Herzig, Tero T. Rautio, Elisa Mäkäräinen, Reetta Häivälä, Kai Klintrup, and et al. 2022. "Sarcopenia and Myosteatosis Are Associated with Neutrophil to Lymphocyte Ratio but Not Glasgow Prognostic Score in Colorectal Cancer Patients" Journal of Clinical Medicine 11, no. 9: 2656. https://doi.org/10.3390/jcm11092656
APA StyleAro, R., Meriläinen, S., Sirniö, P., Väyrynen, J. P., Pohjanen, V.-M., Herzig, K.-H., Rautio, T. T., Mäkäräinen, E., Häivälä, R., Klintrup, K., Mäkinen, M. J., Saarnio, J., & Tuomisto, A. (2022). Sarcopenia and Myosteatosis Are Associated with Neutrophil to Lymphocyte Ratio but Not Glasgow Prognostic Score in Colorectal Cancer Patients. Journal of Clinical Medicine, 11(9), 2656. https://doi.org/10.3390/jcm11092656