Article

Echocardiography Nomogram for Predicting Survival among Chronic Lung Disease Patients with Severe Pulmonary Hypertension

1
Department of Cardiopulmonary Circulation, Shanghai Pulmonary Hospital, Tongji University School of Medicine, Shanghai 200433, China
2
Department of Health Statistics, Naval Medical University, 800 Xiangyin Road, Shanghai 200433, China
3
Department of Cardiology, Peking Union Medical College Hospital, Chinese Academy of Medical Sciences, 1 Shuai-Fu-Yuan, Dongcheng District, Beijing 100730, China
*
Author to whom correspondence should be addressed.
These authors contributed equally to this work.
J. Clin. Med. 2022, 11(6), 1603; https://doi.org/10.3390/jcm11061603
Submission received: 7 January 2022 / Revised: 12 February 2022 / Accepted: 12 March 2022 / Published: 14 March 2022
(This article belongs to the Section Pulmonology)

Abstract

:
Severe pulmonary hypertension in chronic lung diseases (severe CLD-PH) differs significantly from other types of PH in physiology and prognosis. We aimed to assess whether echocardiography helps predict long-term survival in patients with severe CLD-PH. This single-centre, observational cohort study enrolled 100 patients with severe CLD-PH (mean pulmonary arterial pressure ≥35 mm Hg or ≥25 mm Hg with cardiac index <2.0 L/min/m2 or pulmonary vascular resistance ≥6 Wood units) between 2009 and 2014. The population was randomly divided into a derivation and validation cohort in a 2:1 ratio. To construct a nomogram, a multivariable logistic regression model was applied, and scores were assigned based on the hazard ratio of independent echocardiographic predictors. Multivariate Cox hazards analysis identified the strongest predictors of mortality as pulmonary arterial systolic pressure (PASP), tricuspid annular plane systolic excursion, and right ventricular end-diastolic transverse dimension. The three independent predictors were entered into the nomogram. Compared with PASP alone, the nomogram resulted in an integrated discrimination improvement of 15.5% (95% confidence interval, 5.52–25.5%, p = 0.002) with a net improvement in model discrimination (C-statistic from 0.591 to 0.746). Using echocardiographic parameters, we established and validated a novel nomogram to predict all-cause death for patients with severe CLD-PH.

1. Introduction

Pulmonary hypertension due to chronic lung diseases (CLD-PH) is classified as World Health Organization (WHO) Group 3, per the classification of the World Symposium on PH [1,2,3]. According to right heart catheterization (RHC), PH in CLD is classified as without/mild PH or severe CLD-PH, where severe CLD-PH is defined as a mean pulmonary artery pressure (mPAP) ≥35 mm Hg or ≥25 mm Hg with a low cardiac index (CI) (<2 L/min/m2) [2]. Severe CLD-PH accounts for a minority of patients with CLD and seems to be characterized by extensive general vascular remodelling and a poor prognosis [4,5]. As these patients have the “pulmonary vascular phenotype”, pulmonary arterial hypertension (PAH)-targeted therapy may be considered for the treatment of severe CLD-PH. It is important to predict the survival of severe CLD-PH patients because the most at-risk patients could be considered for lung transplantation if eligible.
Echocardiography is considered to be the best non-invasive method for screening and evaluating PH. Because they provide accurate information on cardiac structure and physiology, echocardiographic-derived multivariable risk models can reliably predict survival in WHO Group 1 PH patients [6,7,8,9]. However, the ability to estimate pulmonary artery systolic pressure (PASP) by assessing peak tricuspid regurgitation velocity has been limited in CLD patients [10,11]. Per the 6th World Symposium on PH [12], alternative PH signs such as ventricular septal shift, right ventricle (RV) enlargement, pulmonary artery dilation, impaired RV function, etc., were predictors of unfavourable outcomes and were routinely used for risk stratification in WHO Group 1 [13,14]. In our previous study, we established a novel scoring index with guideline-recommended echocardiographic parameters to predict severe CLD-PH [15]. Whether echocardiographic parameters can predict mortality in severe CLD-PH remains unknown.
Our study aimed to explore the prognostic value of guideline-recommended echocardiographic parameters for all-cause mortality in patients with severe CLD-PH.

2. Materials and Methods

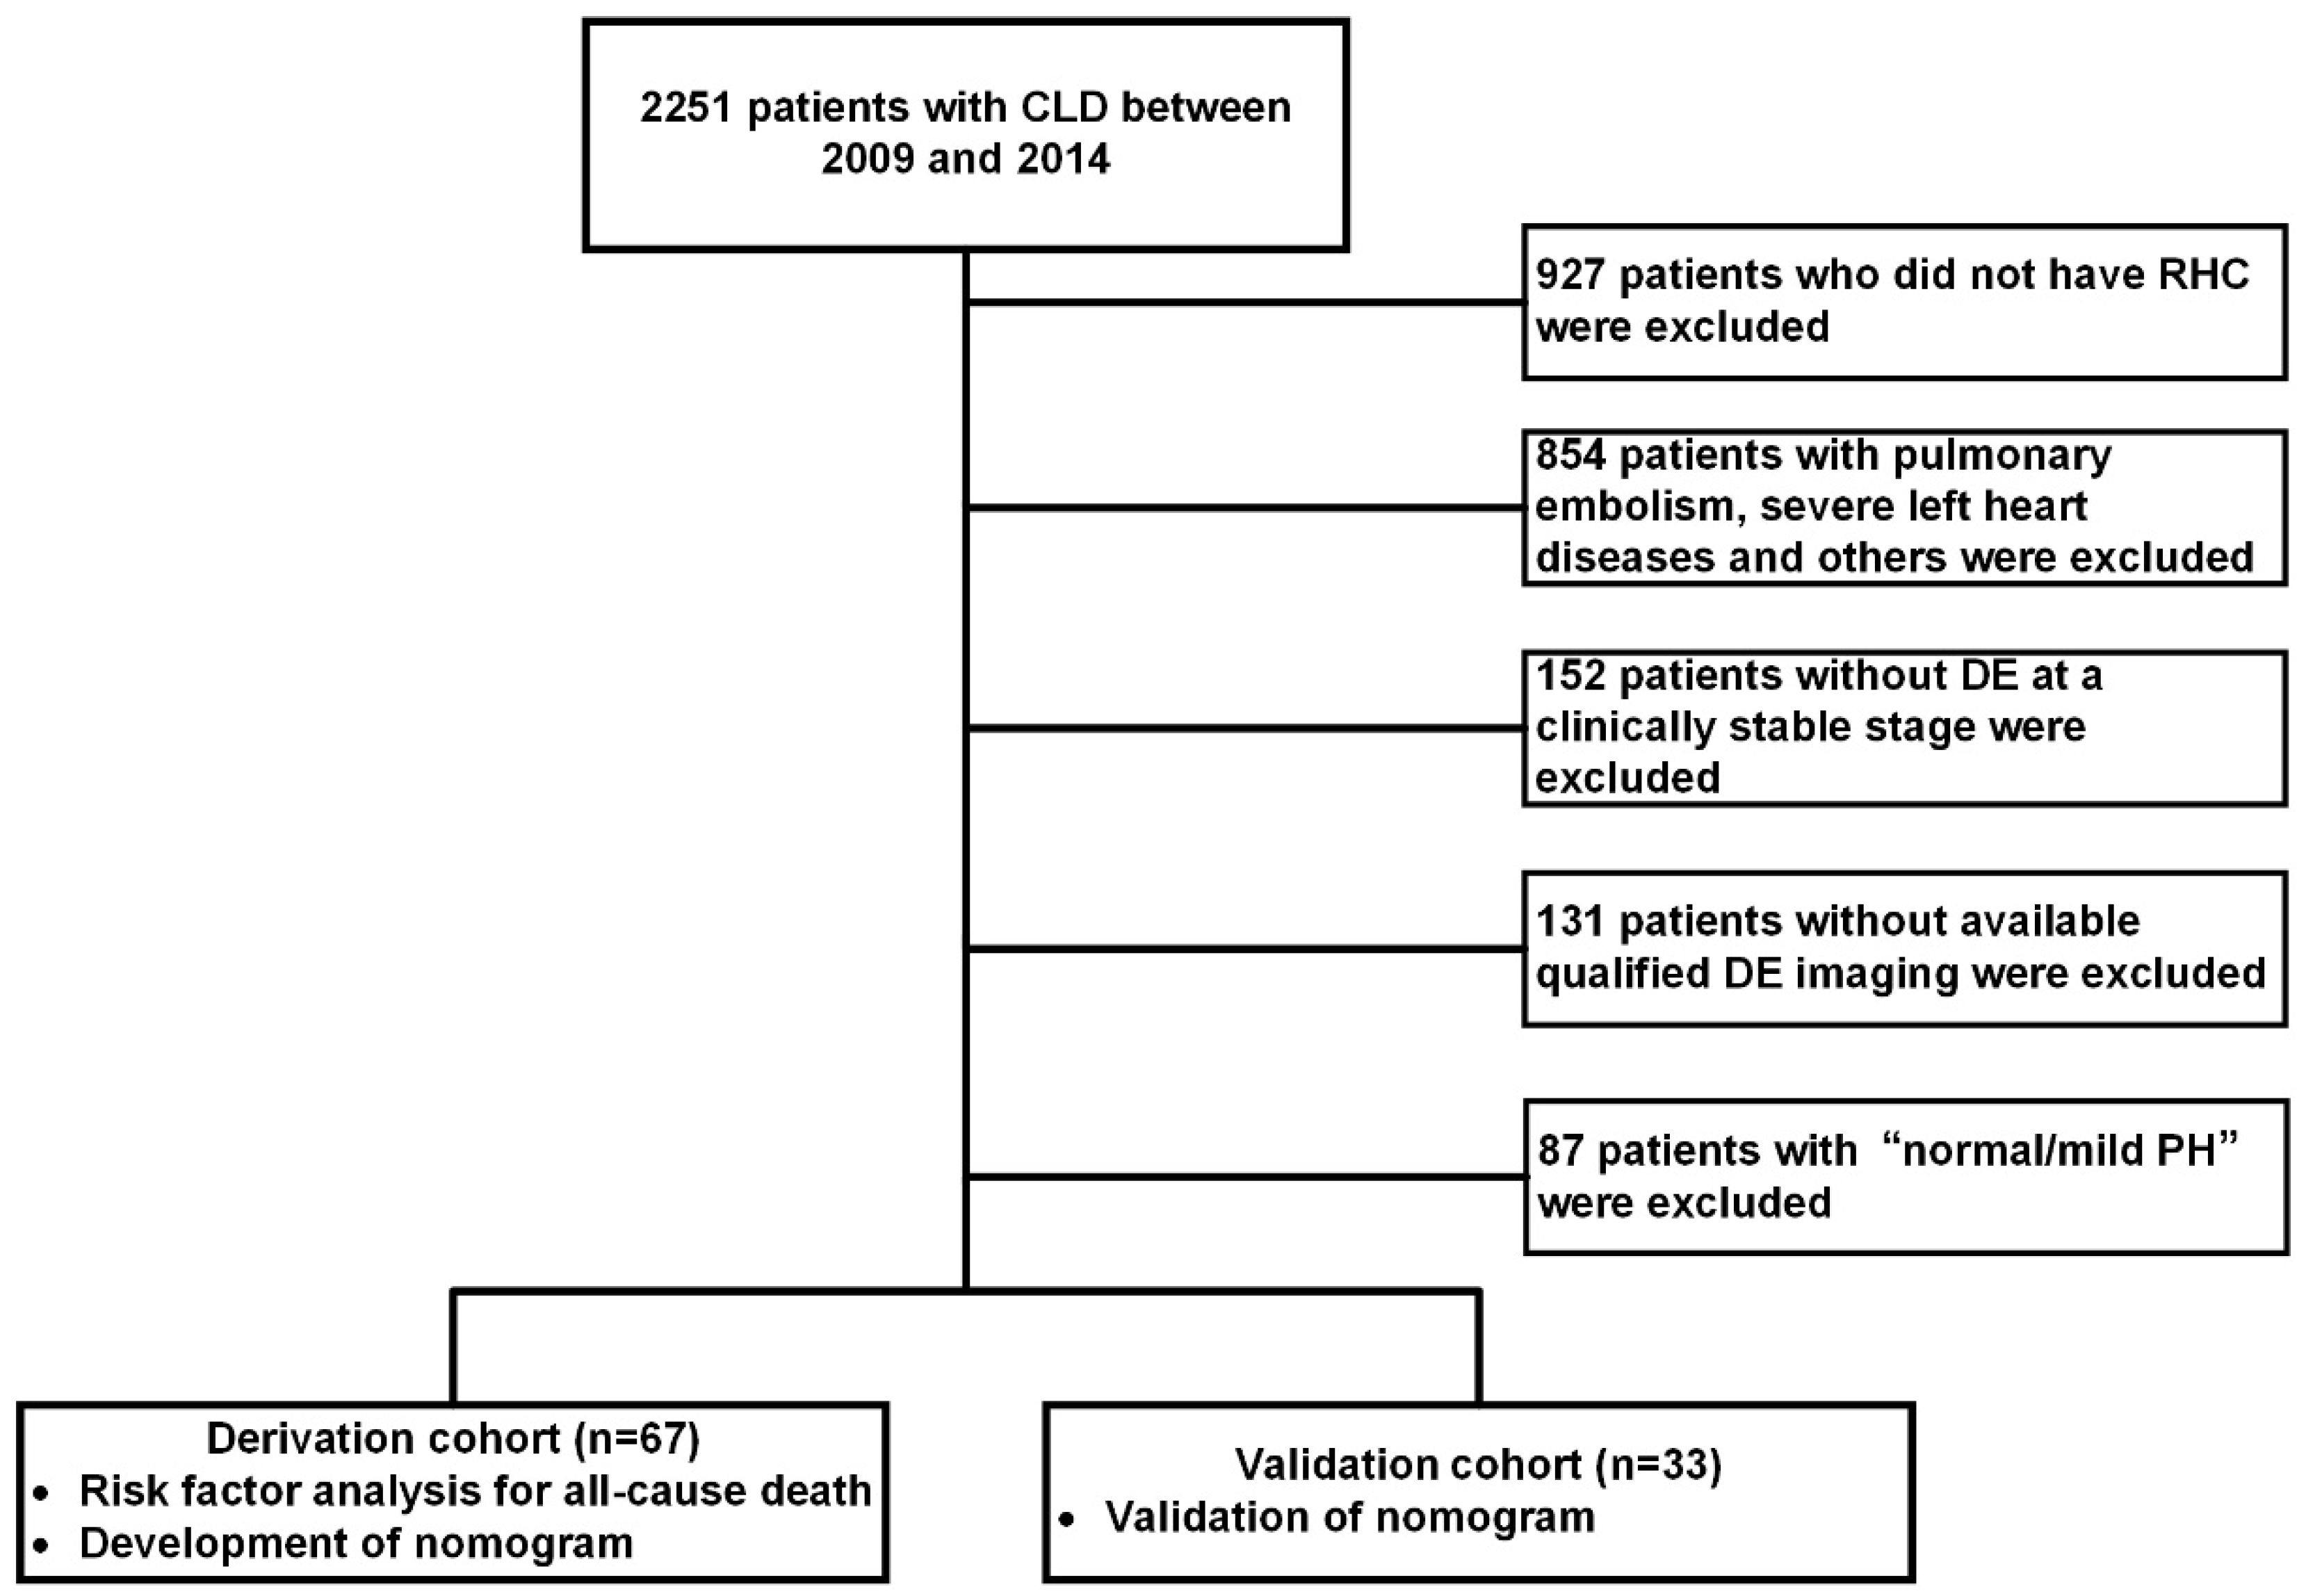
2.1. Patient Selection and Study Design

This was a retrospective study. We reviewed incident patients with suspected PH associated with CLD referred to our centre between 2009 and 2014. All patients underwent Doppler echocardiography and RHC for haemodynamic evaluation. For the haemodynamic characteristics, patients were classified into 3 subsets [2,3]: without PH (mPAP < 25 mmHg); mild PH (25 ≤ mPAP < 35 mmHg); and severe PH (mPAP ≥ 35 mmHg or 25 mmHg ≤ mPAP < 35 mmHg with CI < 2.0 L/min/m2 or pulmonary vascular resistance [PVR] > 6 Wood units). The inclusion criteria were (1) diagnosis of CLD confirmed by experienced specialists according to the appropriate guidelines [16,17]; (2) severe PH [1,2,3]; and (3) echocardiography and RHC performed after patients received optimal medical treatment. The exclusion criteria were (1) CLD patients with mild PH or without PH; (2) patients in other WHO PH groups on the basis of the NICE criteria [1]; (3) no RHC or echocardiography at a clinically stable stage; or (4) other severe comorbidities, such as severe left heart diseases and pulmonary embolism.
Patients were randomly assigned to either the derivation or validation cohort in a 2:1 ratio by a permuted randomization protocol after they were diagnosed with severe CLD-PH. Risk factor analysis and nomogram development were created in the derivation cohort and verified in the validation cohort.
This study was approved by the ethics committee of Shanghai Pulmonary Hospital (K08-015C) and conducted in accordance with the amended Declaration of Helsinki. All participants provided written informed consent.

2.2. Echocardiographic Measurement

The process of transthoracic echocardiography was described in our previously published article [15,18]. Guideline-recommended additional PH sign parameters included right ventricular end-diastolic transverse dimension (RVEDTD), right ventricular end-diastolic longitudinal dimension (RVEDLD), right atrial transverse dimension (RATD), right atrial longitudinal dimension (RALD), pulmonary artery dimension (PAd) and ventricular septal shift reflected by the end-systolic stage left ventricular eccentricity index (ENDSEI). PASP was measured by peak tricuspid regurgitation velocity combined with right atrial pressure (RAP), which was estimated by inferior cava diameter and inspiratory collapse. RV function, which was reflected by tricuspid annular plane systolic excursion (TAPSE) and peak velocities of the lateral tricuspid annulus (TV s’), was calculated from tissue Doppler images. Left ventricular cardiac structure and function, including the left ventricular end-diastolic transverse dimension (LVDED) and left ventricular end-systolic transverse dimension (LVSED), were also measured. The two cardiologists who performed the echocardiography were blinded to the patients’ information.

2.3. Haemodynamic Measurements

RHC was performed by using standard techniques with haemodynamic measurements obtained at rest [19]. The haemodynamic variables included mean RAP (mRAP), mPAP, pulmonary artery wedge pressure (PAWP), cardiac output (CO), CI, and PVR.

Follow-up

Clinical, demographic, echocardiographic and RHC parameters were collected from hospital records. Mortality information during follow-up was obtained from chart review, outpatient clinic visits or telephone interviews. The follow-up period lasted from the date of echocardiography until the patient was censored or died at the end of the study (31 June 2017). The primary endpoint was all-cause mortality.

2.4. Statistical Analysis

The baseline characteristics of the two cohorts are described as the mean ± standard deviation, median (25th–75th percentile), or counts (proportions) for normally distributed variables, variables with a skewed distribution and categorical variables, respectively. The optimal cut-off values of the parameters from log-rank χ2 statistics were identified by the X-tile program (http://www.tissuearray.org/rimmlab/, accessed on 31 March 2018) and divided into low- and high-risk subsets [20].
Univariate and multivariate Cox proportional hazards regression analyses were applied to assess the relations between all-cause mortality and the covariates of interest. The variables that were significant in univariate analysis were included in the multivariate Cox regression model analysis. Independent predictors of all-cause mortality were identified with a p-to-enter of 0.10 or less and a p-to-remove of 0.15 or more. Integer scores distributed on the basis of multiples of rounded β-coefficients from the refitted model were applied to create a new composite scoring system. The composite scoring system was then used for each patient and included in the Cox multivariate analysis for all-cause mortality prediction. Wald chi-square statistics and 95 confidence intervals (CIs) were used to calculate the significance of the estimates at a level of 0.05. The discriminatory ability of scores to predict all-cause death was assessed by receiver operating characteristic (ROC) curves, and sensitivity and specificity were calculated. Event-free survival was estimated from the time of echocardiography, with all-cause mortality as the endpoint. Kaplan–Meier survival curves and log-rank tests identified scores for survival outcomes. A nomogram for significant parameters associated with 1-, 3-, and 5-year survival was generated.
Statistical analysis was performed using R software (version 4.05; http://www.r-project.org, accessed on 31 March 2021) and SPSS 21.0 software (SPSS Inc., Chicago, IL, USA). In all univariate analyses, p < 0.05 was considered indicative of statistical significance.

3. Results

3.1. Study Population

A total of 2251 patients with CLD from May 2009 to October 2014 were entered into our centre database (Figure 1). Finally, severe CLD-PH patients were enrolled and randomly divided into a derivation (n = 67) or validation (n = 33) cohort in a 2:1 ratio after ineligible patients were excluded (Figure 1). A comparison of the demographics and baseline characteristics was made between the severe CLD-PH patients in the derivation cohort and those in the validation cohort (Table 1). Furthermore, Supplementary Table S1 shows the comparison of lung function tests in the derivation cohort, stratified by obstructive or restrictive pattern, mixed restrictive/obstructive pattern, and hypoxia without lung disease.

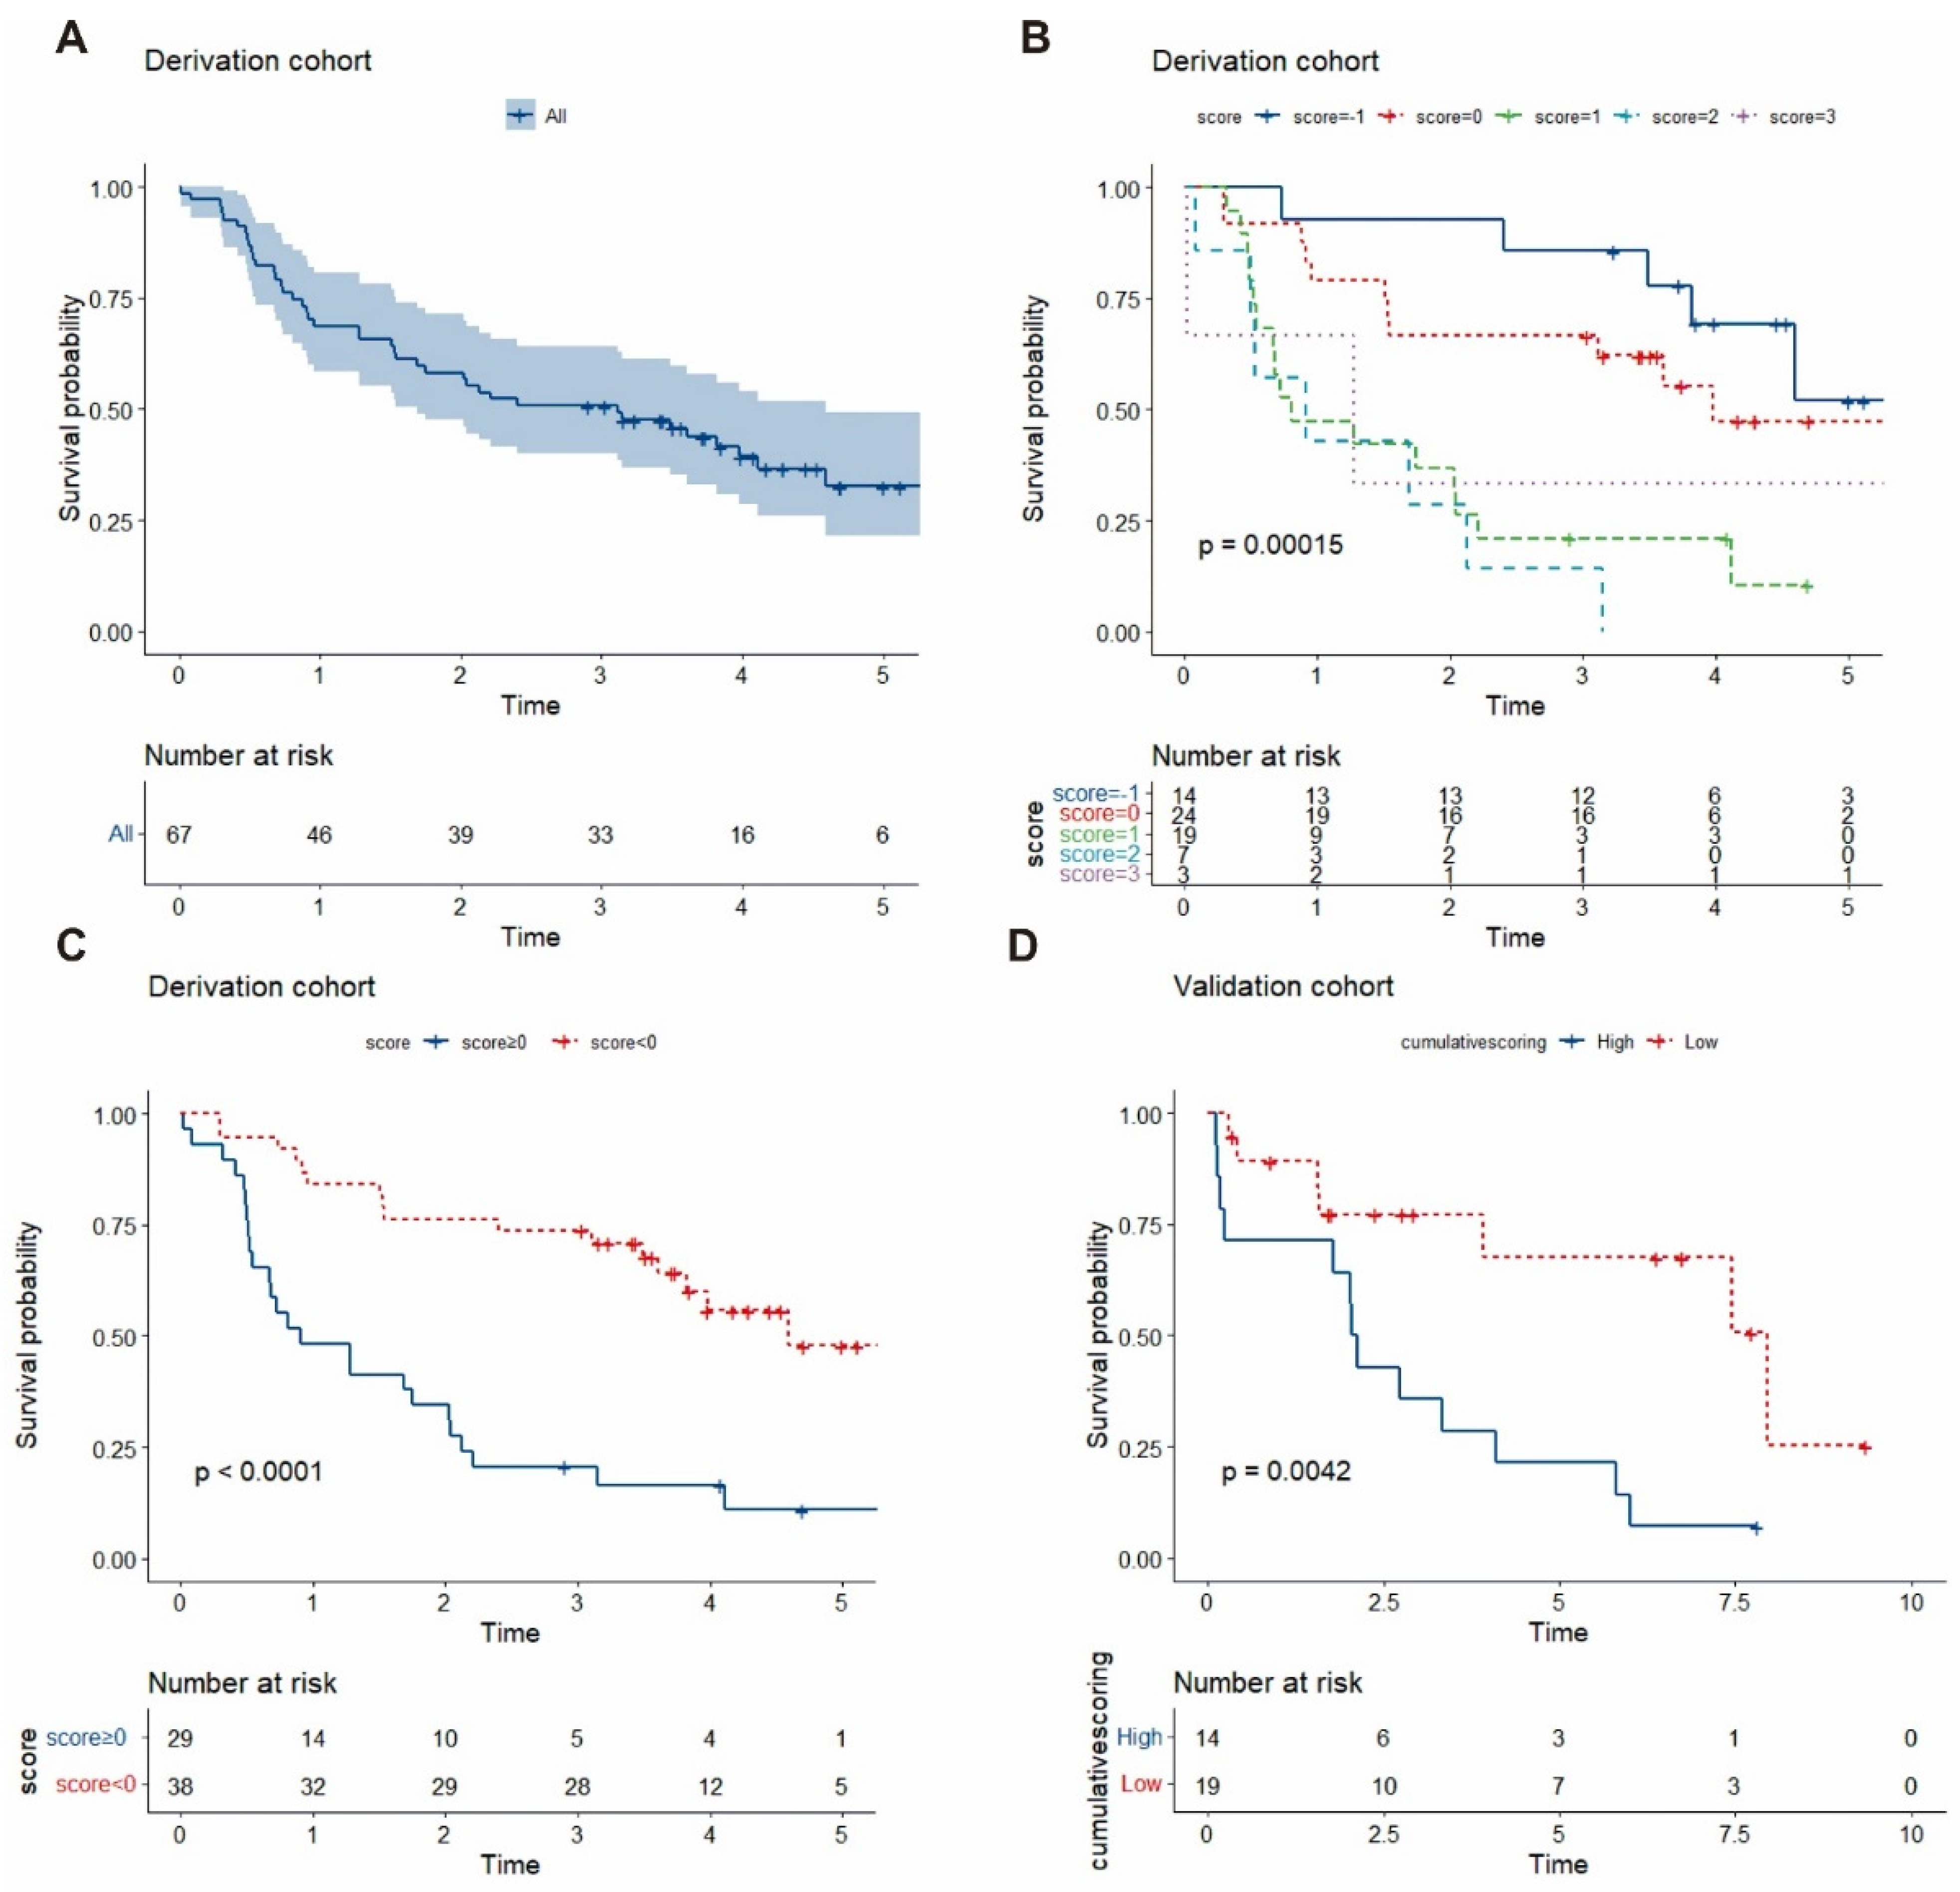
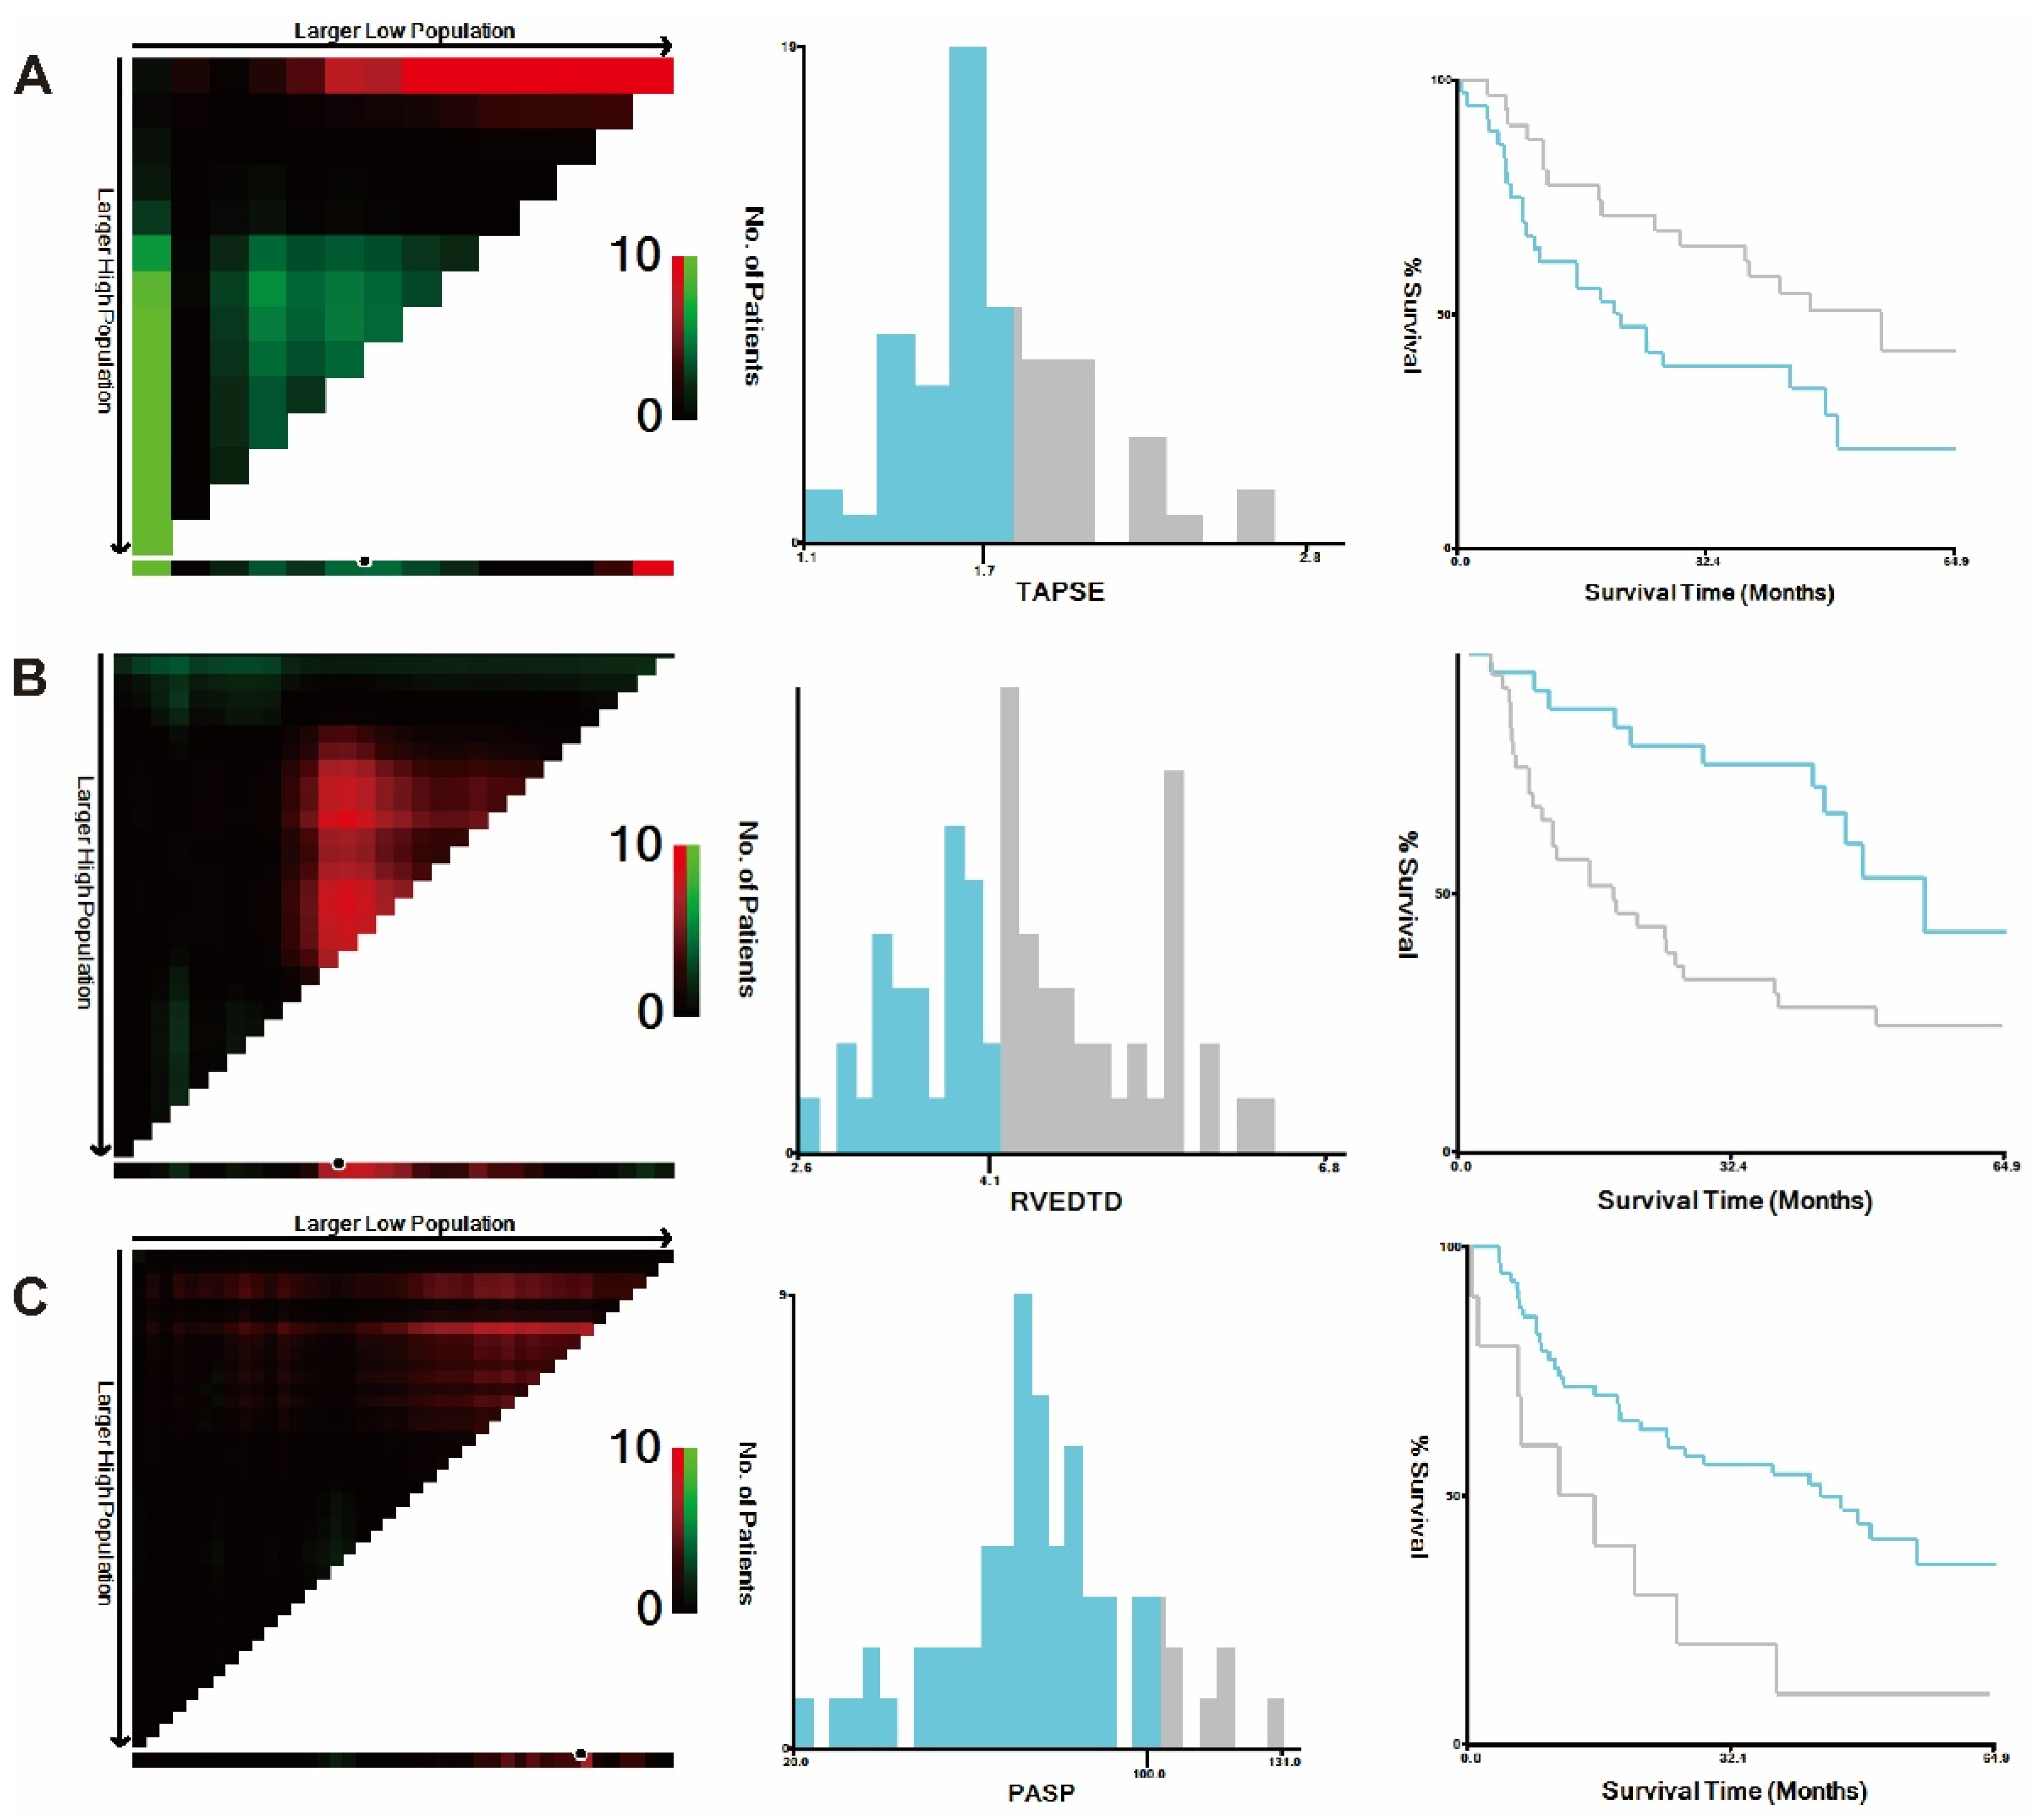
3.2. Risk Score Construction in the Derivation Cohort

The majority of patients were male (56.7%), and there was a large proportion of chronic obstructive pulmonary disease (COPD) in the cohort (77.6%), as shown by a mPAP of 46.0 mmHg, CI of 3.1 L/min/m2 and PVR of 8.0 Wood units (Table 1). When first admitted to our centre, most patients were initiated on bronchodilator treatment and oxygen- and PAH-targeted drugs, including prostacyclin analogues, phosphodiesterase-5 inhibitors and endothelin receptor antagonists. All-cause mortality occurred in 40 (61.2%) patients during a median follow-up of 2.4 (0.8, 5.4) years. The follow-up rate was 100%. Most patients discontinued PAH-targeted drugs after 3 to 6 months but with the long-term sustainability of respiratory support therapy, such as bronchodilators. The survival rates were 68.7% (CI, 57.5–79.9%) at 1 year, 49.3% (CI, 37.2–61.2%) at 3 years, and 8.9% (CI, 19.1–46.1%) at 5 years (Figure 2A).
Overall, 80.6% of patients had an enlarged right atrium (RATD ≥ 4.4 cm or RALD ≥ 5.1 cm), while 83.6% of patients had an enlarged RV, namely, RVEDTD ≥ 3.5 cm or RVEDLD ≥ 8.6 cm (Table 1). TAPSE < 20 mm was present in 77.6% of patients, while only 25.4% had a TAPSE < 15 mm, suggesting mildly impaired RV in most patients. Furthermore, while TV s’ < 12 cm/s was present in 34.3% of patients, it was below 8 cm/sec in only 7.4% of patients. The PASP was measured at a clinically stable stage in 94.0% of all patients. The degree of left ventricular compression by the RV, defined as ENDSEI > 1.0, was present in 74.6% of patients. Overall, pulmonary artery dilation, defined as a PAd ≥ 2.7 cm, was present in 70.1% of patients, and nearly half (43.2%) had a PAd ≥ 3.0 cm.
The independent prognostic parameters by univariate Cox regression analysis were LVSED, RVEDTD, PASP, TAPSE, ENDSEI, forced expiratory volume in 1 s (FEV1)/forced vital capacity (FVC) and diffusing capacity for carbon monoxide (DLco) predicted %. The high- and low-risk subgroups were divided in terms of 5-year all-cause mortality by the X-tile program (Figure 3). Then, the above parameters were transformed into binary variables based on the cut-offs by the X-tile software.
Moreover, based on clinical significance and significant differences, LVSED, RVEDTD, PASP, TAPSE and ENDSEI were selected for multivariate Cox regression. As predictors of all-cause mortality, multivariate Cox regression identified TAPSE, RVEDTD, and PASP, with cut-offs of 1.8 cm, 4.2 cm and 103 mmHg, respectively. In the multivariable analysis, TAPSE (HR 0.414, 95% CI 0.196–0.873, p = 0.021), RVEDTD (HR 2.248, 95% CI 1.062–4.759, p = 0.034) and PASP (HR 5.039, 95% CI 2.002–12.680, p = 0.001) were associated with all-cause death (Table 2). Integer scores were assigned values of −1, 1 and 2 for the β-coefficient associated with HRs of −0.882, 0.810 and 1.617, respectively. A composite score based on the strongest β-coefficients in the final model (Table 3) was generated: one point was attributed to RVEDTD ≥ 4.2 cm, one point was attributed to PASP ≥ 103 mm Hg and minus one point was attributed to TAPSE ≥ 1.8 cm.
PASP ≥ 103 mm Hg displayed 22.0% sensitivity and 96.2% specificity [area under the curve (AUC): 0.591, 95% CI: 0.464–0.709, p = 0.214] by ROC analysis. Compared with PASP, the composite score resulted in an integrated discrimination improvement of 15.5% (95% CI: 5.52–25.5%, p = 0.002) and a net improvement in model discrimination with a C-statistic from 0.591 to 0.746 (Figure 4).
In Kaplan–Meier analysis, significant differences in survival were observed among patients with scores of −1, 0, 1, 2 and 3 (log rank = 14.756, p = 0.00015; Figure 2B). Compared with severe CLD-PH patients with a score ≥ 0, those with a score < 0 had a higher survival rate (estimated 5-year survival of 13.2% vs. 3.4%; p < 0.0001) (Figure 2C).

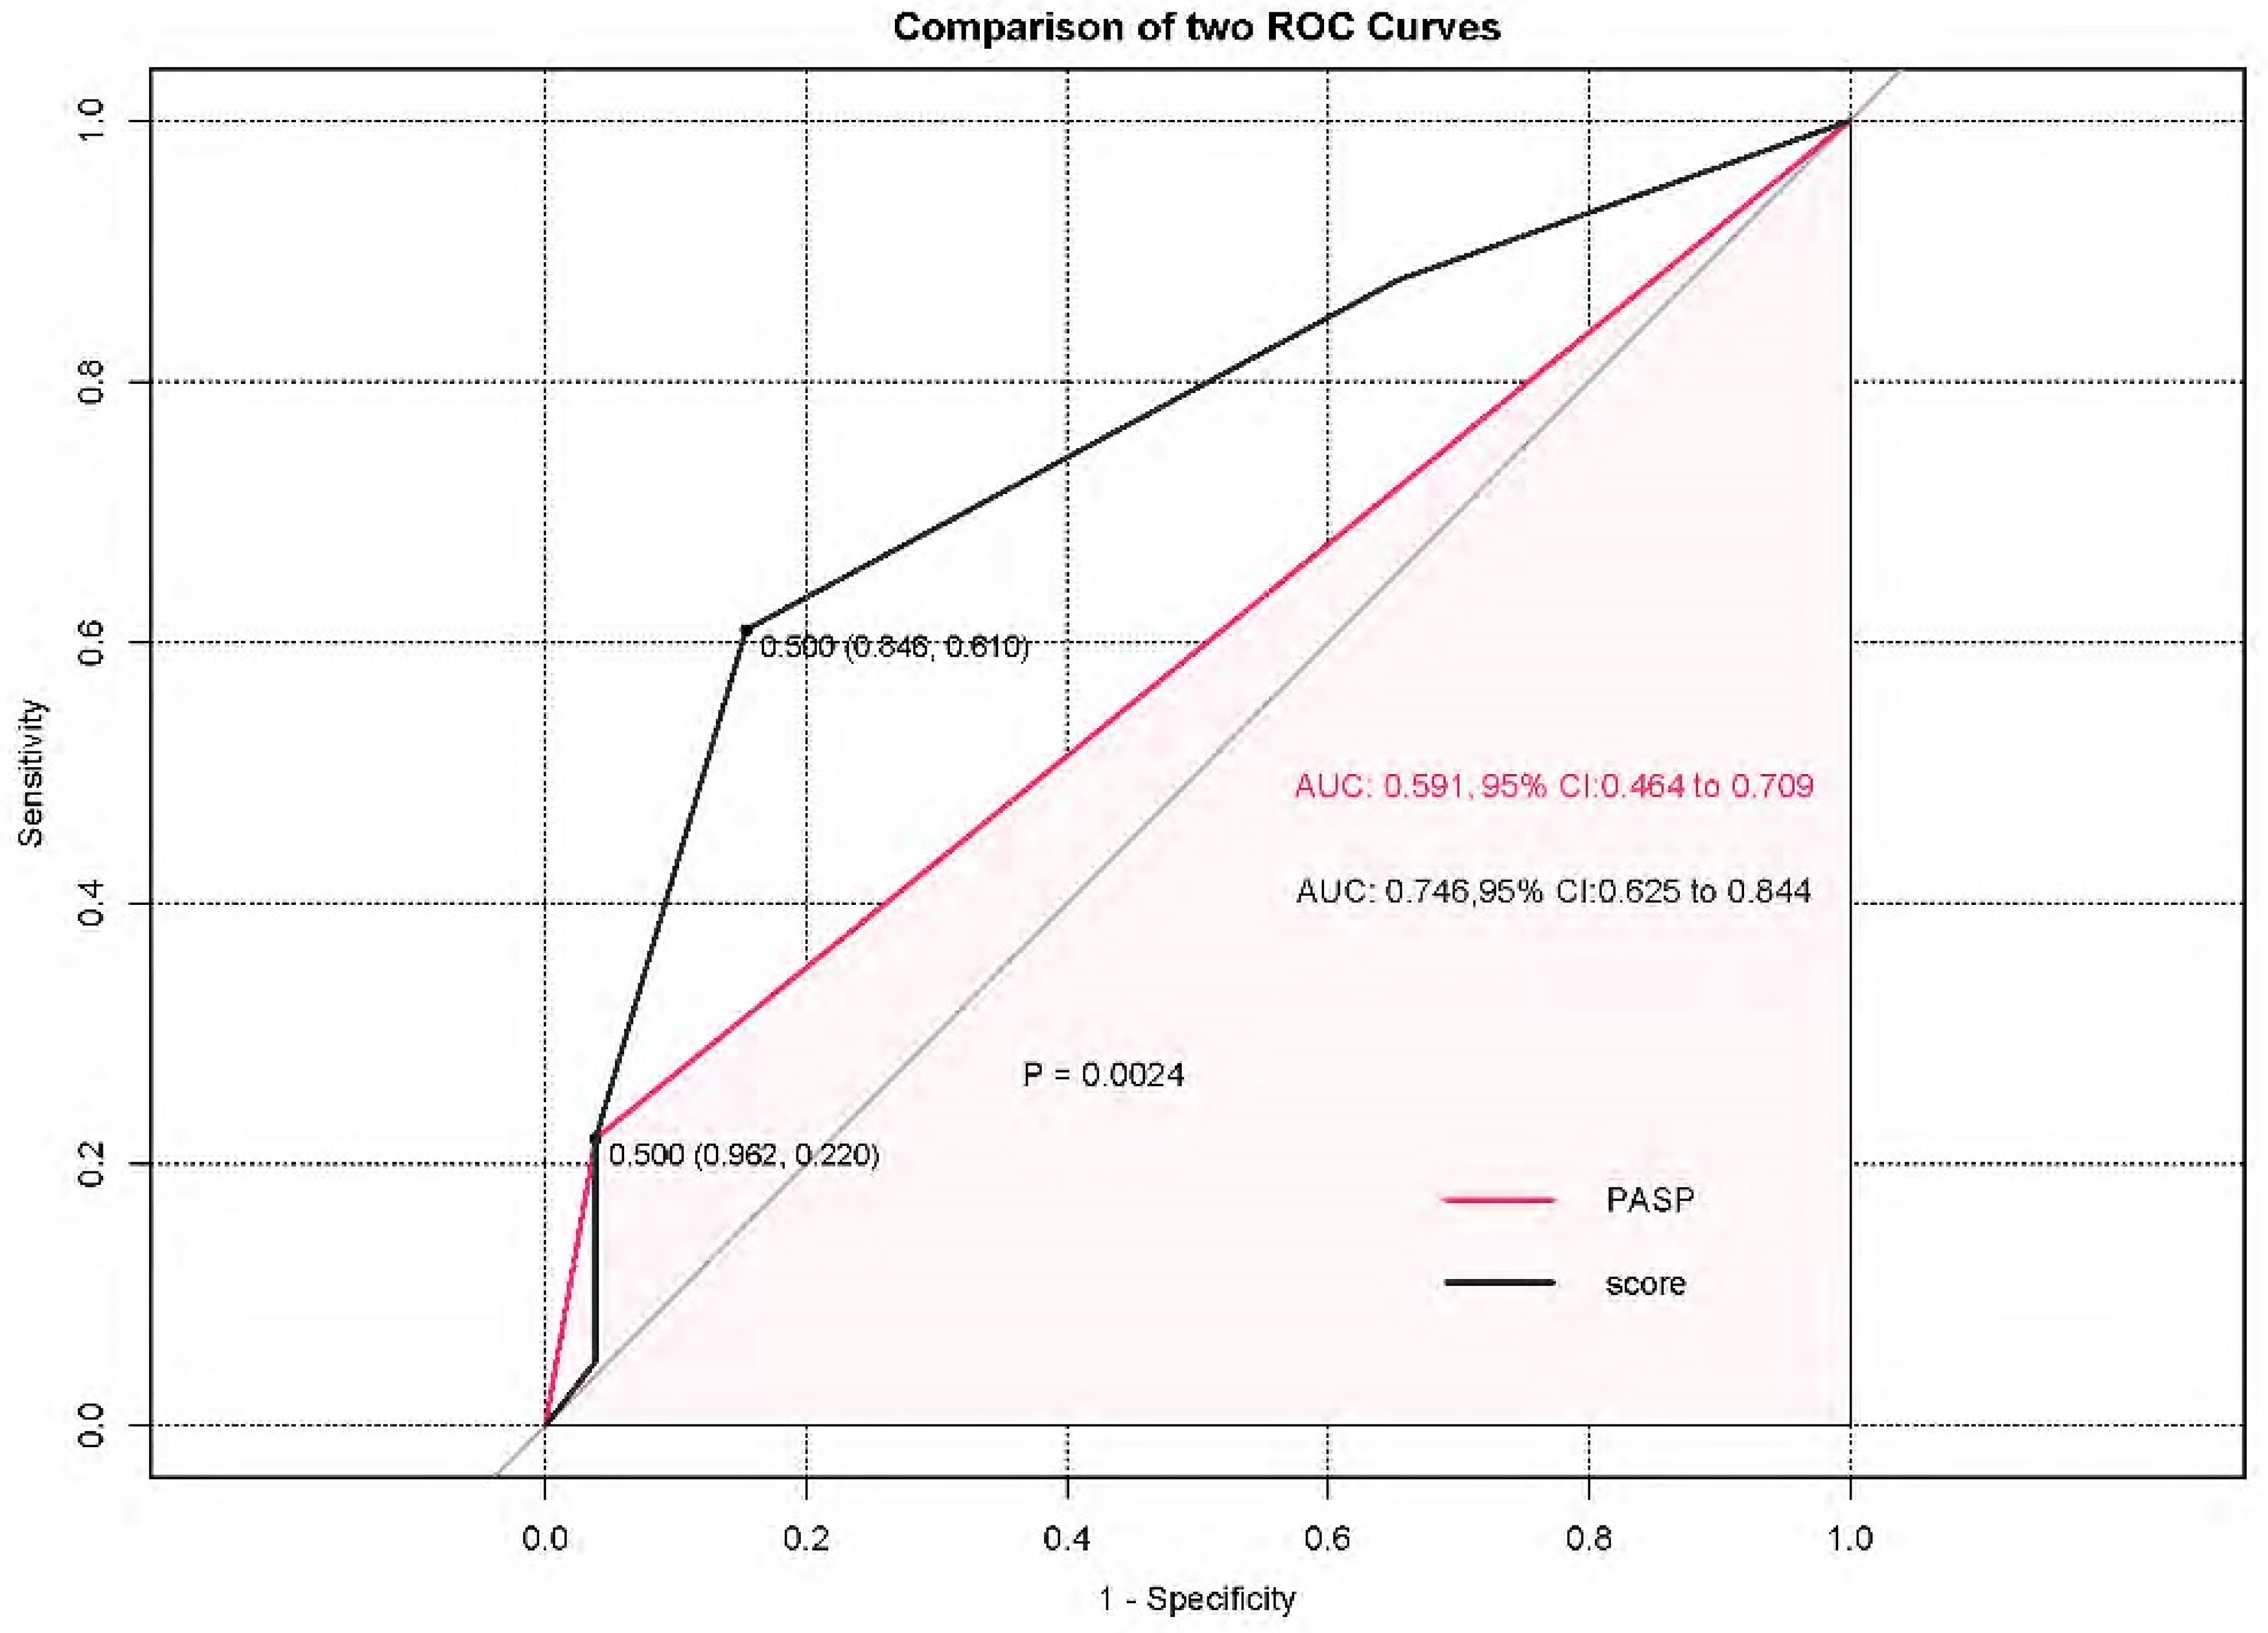
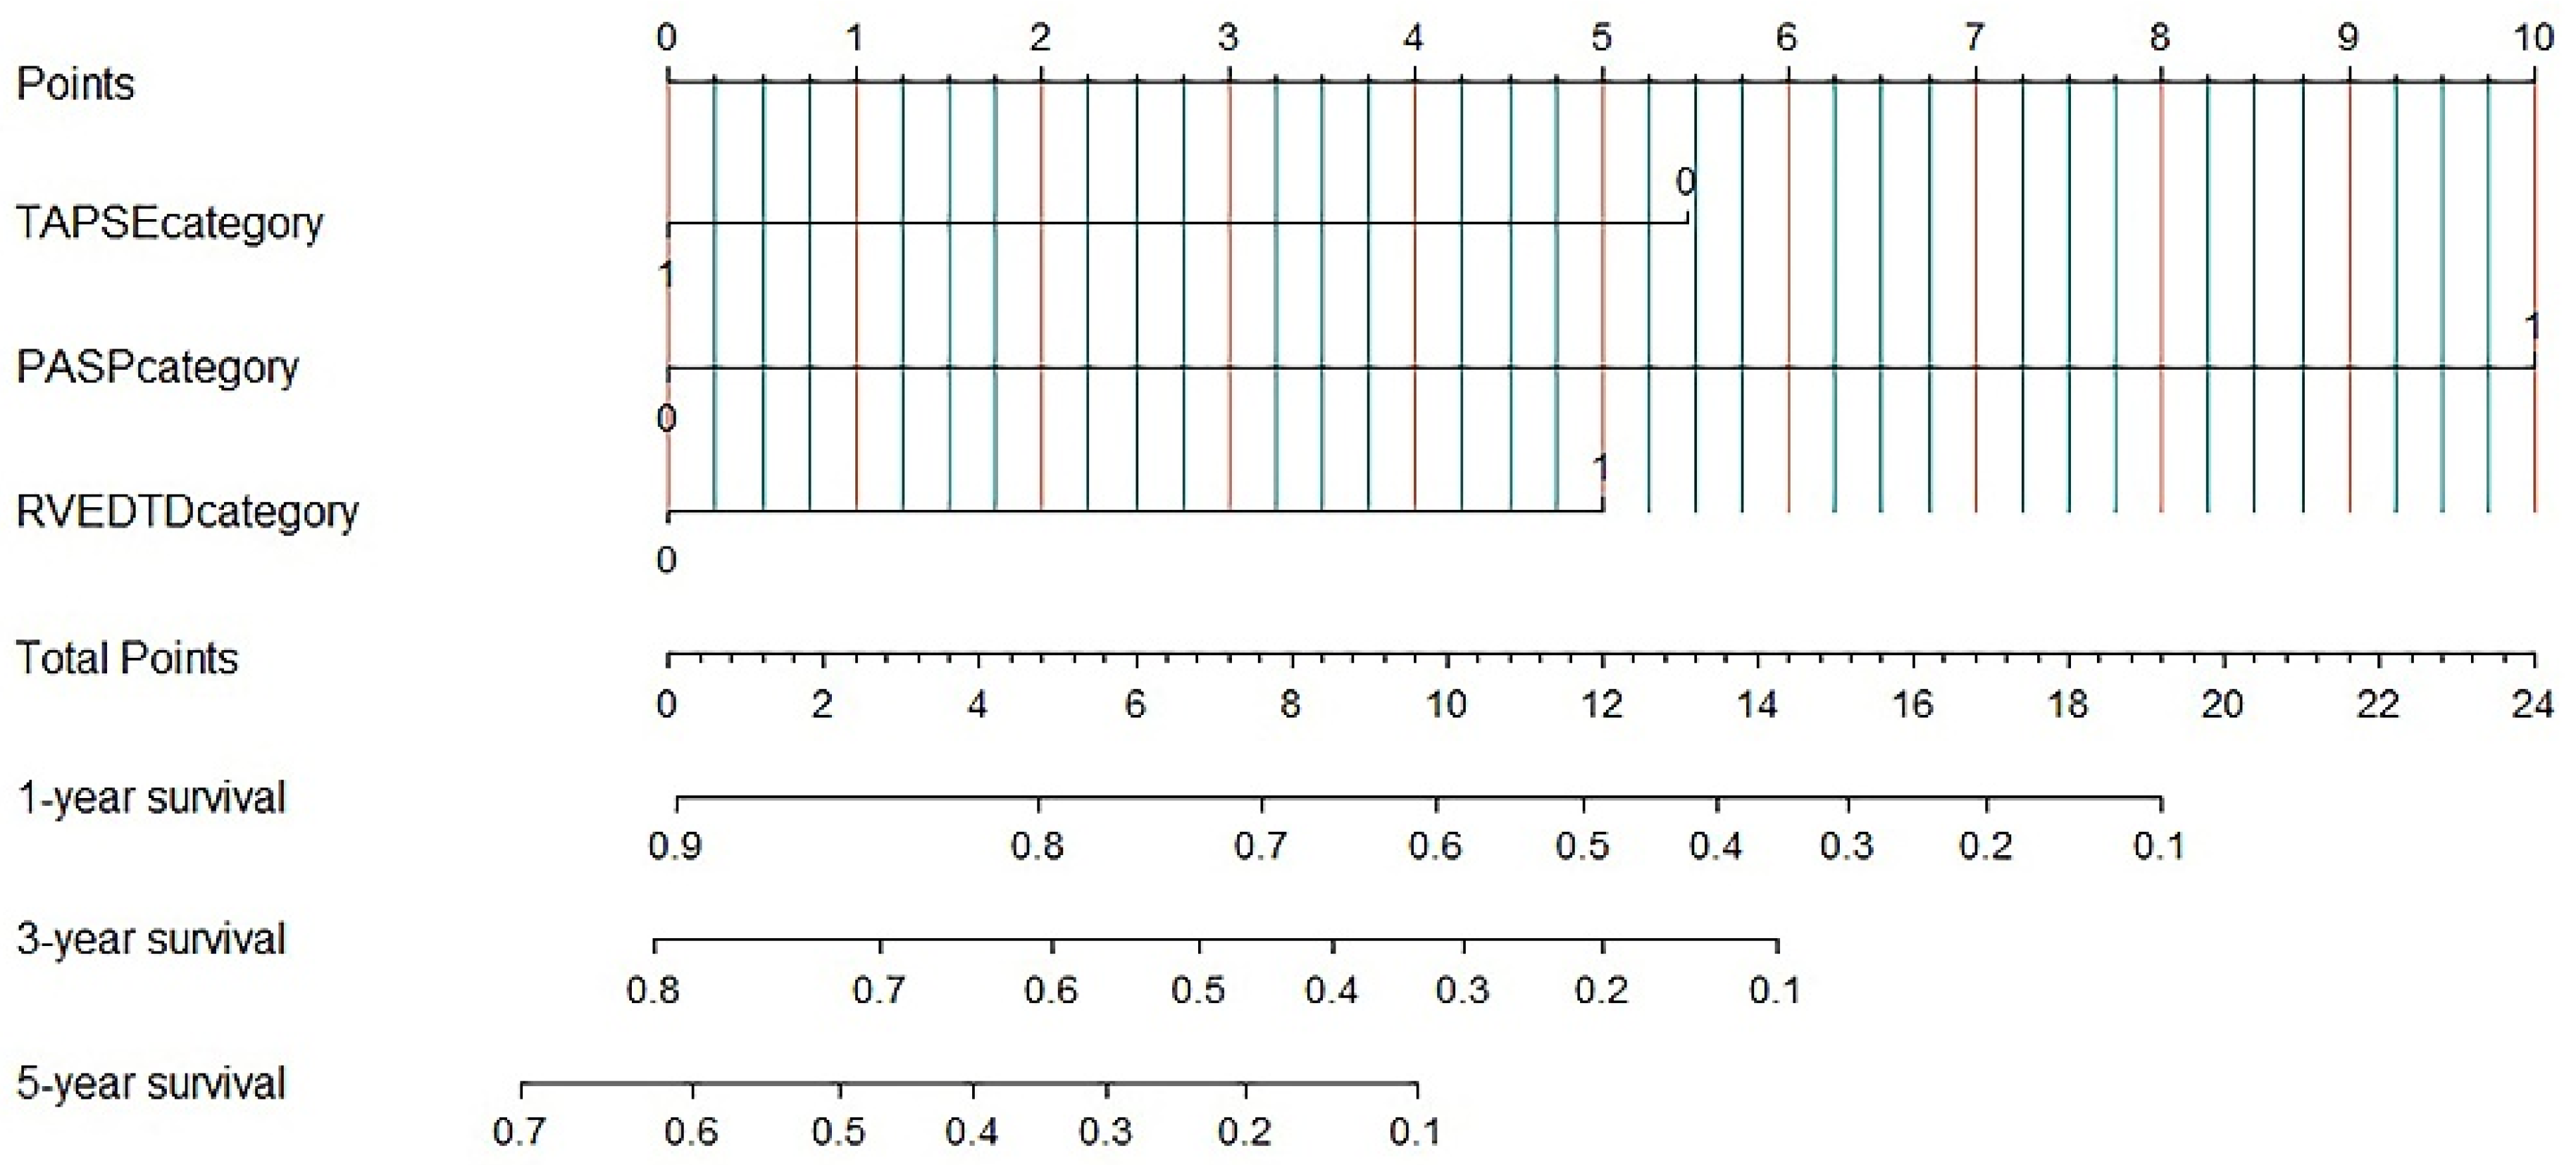
3.3. Nomogram for Predicting All-Cause Mortality

We used a nomogram on the basis of the results of the multivariate analyses to predict 5-year overall survival rates. PASP, RVEDTD and TAPSE levels were included for the cohort (Figure 5). The predictive models showed that high RVEDTD and PASP were adverse prognostic factors, while a high TAPSE level was a favourable factor.

3.4. External Validation in the Validation Cohort

In the validation cohort, all-cause mortality occurred in 24 (72.7%) patients, and the nomogram had a C index of 0.737 (95% CI 0.526–1.474, p < 0.0001). There were also perfect calibration curves for all-cause death according to the mean of the total points calculated by summing each patient’s nomogram (mean survival of 3.84 vs. 2.74 years, high risk vs. low risk, respectively, p = 0.0042) (Figure 2D).

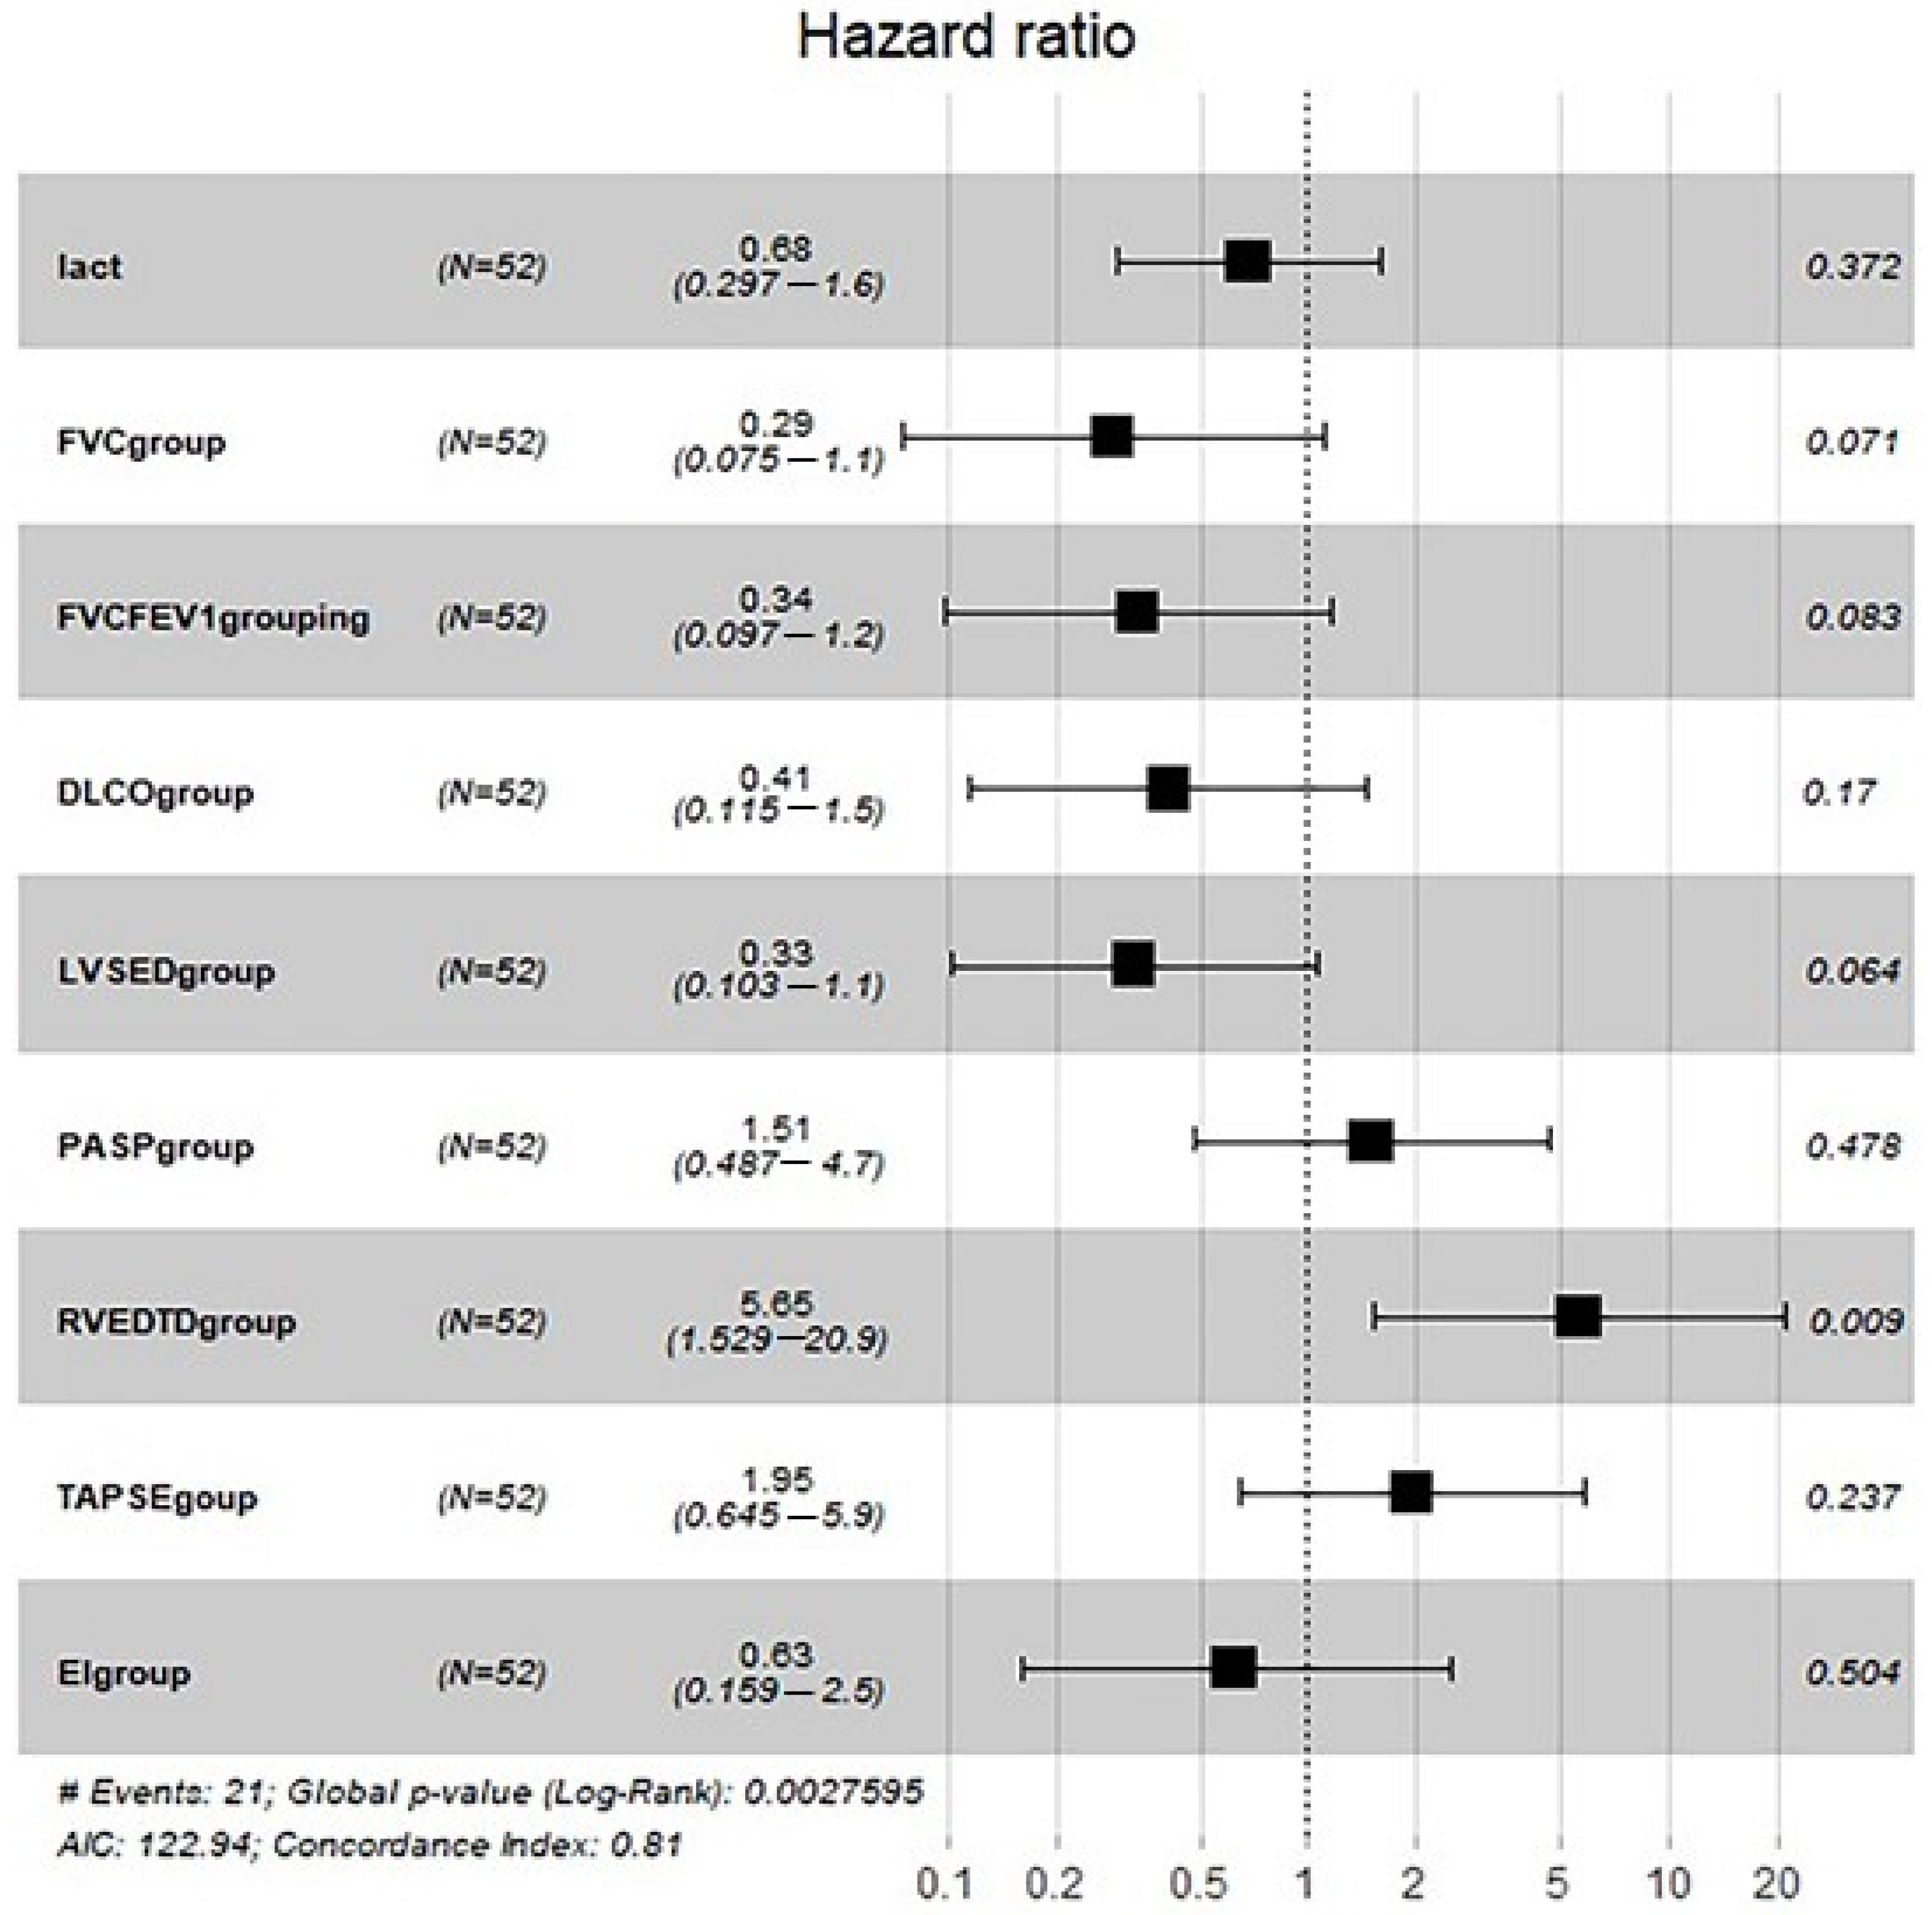
3.5. Subgroup Analysis

We analysed 52 COPD patients in the derivation cohort, and all-cause mortality occurred in 33 patients. Lactic acid, FVC, FEV1/FVC, DLco, LVSED, RVEDTD, PASP, TAPSE and ENDSEI were selected for multivariate Cox regression (Table 4). The predictor of all-cause mortality was RVEDTD, with a cut-off of 4.1 cm. The risk of all-cause death increased by 5.65 (95% CI: 1.529–20.9, p = 0.009) with an RVEDTD ≥ 4.1 cm by Cox regression analysis (Figure 6).

4. Discussion

The association of specific echocardiographic parameters associated with clinical outcomes has been investigated in multiple PAH studies [6,14,21,22,23,24]. However, it is relatively unclear which particular metrics are most suitable in CLD patients with severe PH or add information to risk scores. Our study aimed to compare and evaluate the relationships between multiple echocardiographic parameters and all-cause mortality in patients with severe CLD-PH. We revealed that the new composite echocardiographic scores had a good ability to predict all-cause mortality in severe CLD-PH. The nomogram may be applied for risk stratification of patients with severe CLD-PH.
Our data confirm significant differences between severe CLD-PH and other types of PAH. In 2007, we reported a Chinese registry and survival study of idiopathic PAH (IPAH) [25]. Similar to IPAH patients in the US National Institutes of Health registry in the 1980s, i.e., the traditional management era, the 1- and 3-year survival rates were only 68% and 39%, respectively, in China [26]. In the modern management era, the 1-, 3- and 5-year survival rates of IPAH/familial PAH patients were 85%, 68% and 57% and 85.7%, 69.6% and 54.9% in the REVEAL Registry [7,27] and the French Registry [28], respectively. PAH patients in China benefit from targeted therapies, and the 1- and 3-year survival rates were 92.1% and 75.1%, respectively, in patients with IPAH and 85.4% and 53.6%, respectively, in those with PAH associated with connective tissue diseases (CTD-PAH) [29]. However, our study revealed that patients with severe CLD-PH had a much poorer prognosis than IPAH and CTD-PAH patients, even in the traditional management era.
In contrast to Andersen et al. [30], who studied mild PH related to end-stage COPD, we recognized a significant adverse effect on 5-year survival of severe CLD-PH in our present study (8.9% vs. 37%). Interestingly, 1-year survival rates were lower in the present study group than in those with mild PH in advanced idiopathic pulmonary fibrosis (IPF) (68.7% vs. 72%) [31]. Similar to the characteristics of IPAH, morphologic lesions can be observed in PH associated with COPD that develop to levels characteristic of IPAH [32]. The extent of pulmonary vascular lesions in COPD was correlated with the severity of PH [32]. Compared with CLD patients without or with mild PH, those with severe PH exhibited higher mortality [13,33]. Therefore, it is essential to detect severe PH earlier and to initiate optimal therapy, such as lung transplantation, to improve patient prognosis.
RV function was associated with prognosis, and the longitudinal function of the RV, reflected by the TAPSE, was maintained or mildly impaired and associated with poor prognosis in our study. Although other known echocardiographic parameters, such as EI and pericardial effusion [14], showed prognostic value in IPAH, ENDSEI and pericardial effusion did not predict outcomes in our cohort. Nevertheless, the LVSED, which also represents the degree of LV compression, appears to be predictive beyond the ENDSEI. Pulmonary artery dilatation was common in our severe CLD-PH cohort and present in nearly half of the patients; however, it did not have prognostic value for all-cause death.
Compared with that of IPAH patients, the long-term prognosis of severe CLD-PH patients was far from normal due to more aggressive disease progression. RV dilation reflects longstanding pressure overload and ensuing right heart failure (RHF) [34]. Multiorgan involvement and ultimately RHF play important pathophysiological roles [34]. However, the relationship between RV size and survival was active in the present research. The stiffness of a hypertrophied RV is a predisposing factor for arrhythmia, such as ventricular or supraventricular arrhythmia, leading to rapid and fatal haemodynamic damage and sudden death in patients with severe PAH [35].
To predict severe CLD-PH, we created a comprehensive echocardiographic scoring index combining PASP and additional PH signs [15], which displayed a satisfactory ability to predict severe PH and was recommended for application because of its cost-effectiveness and non-invasive nature.
The severity of PH should be judged in terms of hard endpoints, such as mortality, not just by pulmonary artery pressure (PAP). Unlike our previous diagnostic study, the present study strengthened the predictive nature of the composite scores of echocardiography regarding hard endpoints.
Despite the availability of PAH-targeted drugs, no such drugs are approved for CLD-PH, and their usage would be considered off-label in such populations. As a PH screening tool, PASP can be recommended for early screening and assessment of the prognosis of patients with IPAH, CTD-PAH or chronic thromboembolic PH [36]. Nevertheless, in patients with CLD, PASP estimation is often inaccurate and requires optimal visualization of the regurgitant jet and the presence of sufficient tricuspid regurgitation (TR). Moreover, the TR velocity might be underestimated in CLD patients due to marked respiratory variations and hyperinflation of the lungs [37]. At present, the ESC guidelines recommend grading the probability of PH based on TR velocity and other prespecified echocardiographic variables that suggest PH [13]. This raises the question of whether echocardiography can be applied to identify a high-risk population that could benefit from aggressive treatment, such as lung transplantation. In this study, we derived a comprehensive score combining RVEDTD, TAPSE, and PASP, and this score had a high AUC (C-statistic from 0.591 to 0.746) on ROC analysis.
In our analysis of the COPD subgroup, due to the small population, only RVEDTD was associated with all-cause death by multivariate Cox regression. This result implied that right ventricular remodelling predicted long-term adverse events. Echocardiography can evaluate right ventricular remodelling, including size and function.
From another point of view, our data may not be suitable for subgroup analysis because of the relatively small number of patients included in this study, although it would have been interesting to provide survival for each category, such as COPD, interstitial lung disease (ILD) and pneumoconiosis. Another important reason is that many patients with CLD usually have multiple causes and risk factors in the real world. Because of the complexity of the disease, it is sometimes very difficult to determine the accuracy category. Studying patients with CLD as a whole population in the real world may have more clinical significance. We will continue to accumulate more patients and provide survival data for each category in future studies.

Study Limitations

First, this study may have patient selection bias because of its single-centre retrospective nature. Nevertheless, patients admitted to our centre come from all over China, which may reduce bias. It is necessary to design a new multicentre study for further evaluation and verification of the results. Second, the treatment of the underlying CLD or PAH-targeted therapies were not adjusted in this analysis due to heterogeneity. However, the included patients received similar levels of therapy and support.

5. Conclusions

Based on comprehensive echocardiography, the risk score can be used in routine follow-up of patients with severe CLD-PH. Our study supports the use of echocardiographic parameters, including PASP, RVEDTD and TAPSE, for predicting severe CLD-PH patient outcomes regarding all-cause mortality.

Supplementary Materials

The following are available online at https://www.mdpi.com/article/10.3390/jcm11061603/s1: Table S1: Comparisons of pulmonary function tests in the derivation cohort.

Author Contributions

R.J. and L.W. contributed to the conceptualization; C.W. contributed to the formal analysis and methodology; R.J. and Q.-H.Z. contributed to the project administration; S.W. and C.W. contributed to the software; R.J. and S.W. contributed to the data curation; L.W. and J.-M.L. contributed to the funding acquisition; P.Y., S.-G.G. and R.Z. contributed to the validation; W.-H.W., J.H. and H.-L.Q. contributed to the visualization; P.Y., C.-J.L. and R.J. contributed to the original draft; J.-M.L. and Z.-C.J. contributed to the review and editing; R.J., L.W. and Z.-C.J. contributed to the supervision. All authors have read and agreed to the published version of the manuscript.

Funding

The work was funded by the Program of the National Natural Science Foundation of China (81870042, 81700045), the Program of Shanghai Pulmonary Hospital (FKLY20005), the Three-year Action Plan to Promote Clinical Skills and Clinical Innovation in Municipal Hospitals (SHDC2020CR4021) and the Department Development Fund of Shanghai Pulmonary Hospital (201906-0314).

Institutional Review Board Statement

This study was approved by the ethics committee of Shanghai Pulmonary Hospital (K08-015C) and conducted in accordance with the amended Declaration of Helsinki.

Informed Consent Statement

All participants provided written informed consent.

Data Availability Statement

The datasets used and/or analysed during the current study are available from the corresponding author on reasonable request.

Conflicts of Interest

The authors declare no conflict of interest.

Abbreviations

CLDchronic lung diseases
ENDSEIend-systolic stage left ventricular eccentricity index
mPAPmean pulmonary artery pressure
PAdpulmonary artery dilation
PAHpulmonary arterial hypertension
RALDright atrial longitudinal dimension
RATDright atrial transverse dimension
RVEDLDright ventricular end-diastolic longitudinal dimension
RVEDTDright ventricular end-diastolic transverse dimension
TAPSEtricuspid annular plane systolic excursion

References

  1. Simonneau, G.; Gatzoulis, M.A.; Adatia, I.; Celermajer, D.; Denton, C.; Ghofrani, A.; Sanchez, M.A.G.; Kumar, R.K.; Landzberg, M.; Machado, R.F.; et al. Updated clinical classification of pulmonary hypertension. J. Am. Coll. Cardiol. 2013, 62 (Suppl. 25), D34–D41. [Google Scholar] [CrossRef] [PubMed] [Green Version]
  2. Seeger, W.; Adir, Y.; Barbera, J.A.; Champion, H.; Coghlan, J.G.; Cottin, V.; De Marco, T.; Galiè, N.; Ghio, S.; Gibbs, S.; et al. Pulmonary hypertension in chronic lung diseases. J. Am. Coll. Cardiol. 2013, 62 (Suppl. 25), D109–D116. [Google Scholar] [CrossRef] [PubMed]
  3. Hoeper, M.M.; Andreas, S.; Bastian, A.; Claussen, M.; Ghofrani, H.A.; Gorenflo, M.; Grohé, C.; Günther, A.; Halank, M.; Hammerl, P.; et al. Pulmonary hypertension due to chronic lung disease: Updated Recommendations of the Cologne Consensus Conference 2011. Int. J. Cardiol. 2011, 154 (Suppl. 1), S45–S53. [Google Scholar] [CrossRef]
  4. Bunel, V.; Guyard, A.; Dauriat, G.; Danel, C.; Montani, D.; Gauvain, C.; Thabut, G.; Humbert, M.; Castier, Y.; Dorfmüller, P.; et al. Pulmonary Arterial Histologic Lesions in Patients With COPD With Severe Pulmonary Hypertension. Chest 2019, 156, 33–44. [Google Scholar] [CrossRef] [PubMed]
  5. Kovacs, G.; Agusti, A.; Barbera, J.A.; Celli, B.; Criner, G.; Humbert, M.; Sin, D.D.; Voelkel, N.; Olschewski, H. Pulmonary Vascular Involvement in Chronic Obstructive Pulmonary Disease. Is There a Pulmonary Vascular Phenotype? Am. J. Respir. Crit. Care Med. 2018, 198, 1000–1011. [Google Scholar] [CrossRef]
  6. Fine, N.M.; Chen, L.; Bastiansen, P.M.; Frantz, R.P.; Pellikka, P.A.; Oh, J.K.; Kane, G.C. Outcome Prediction by Quantitative Right Ventricular Function Assessment in 575 Subjects Evaluated for Pulmonary Hypertension. Circ. Cardiovasc. Imaging 2013, 6, 711–721. [Google Scholar] [CrossRef] [Green Version]
  7. Benza, R.L.; Miller, D.P.; Gomberg-Maitland, M.; Frantz, R.P.; Foreman, A.J.; Coffey, C.S.; Coffey, C.S.; Frost, A.; Barst, R.J.; Badesch, D.B.; et al. Predicting survival in pulmonary arterial hypertension: Insights from the Registry to Evaluate Early and Long-Term Pulmonary Arterial Hypertension Disease Management (REVEAL). Circulation 2010, 122, 164–172. [Google Scholar] [CrossRef] [PubMed] [Green Version]
  8. Thenappan, T.; Glassner, C.; Gomberg-Maitland, M. Validation of the Pulmonary Hypertension Connection Equation for Survival Prediction in Pulmonary Arterial Hypertension. Chest 2012, 141, 642–650. [Google Scholar] [CrossRef]
  9. Mourani, P.M.; Sontag, M.K.; Younoszai, A.; Ivy, D.D.; Abman, S.H. Clinical Utility of Echocardiography for the Diagnosis and Management of Pulmonary Vascular Disease in Young Children With Chronic Lung Disease. Pediatrics 2008, 121, 317–325. [Google Scholar] [CrossRef] [PubMed] [Green Version]
  10. Greiner, S.; Jud, A.; Aurich, M.; Hess, A.; Hilbel, T.; Hardt, S.; Katus, H.A.; Mereles, D. Reliability of Noninvasive Assessment of Systolic Pulmonary Artery Pressure by Doppler Echocardiography Compared to Right Heart Catheterization: Analysis in a Large Patient Population. J. Am. Heart Assoc. 2014, 3, e001103. [Google Scholar] [CrossRef] [PubMed] [Green Version]
  11. Fisher, M.R.; Criner, G.J.; Fishman, A.P.; Hassoun, P.M.; Minai, O.A.; Scharf, S.M.; Fessler, H.E. Estimating pulmonary artery pressures by echocardiography in patients with emphysema. Eur. Respir. J. 2007, 30, 914–921. [Google Scholar] [CrossRef] [Green Version]
  12. Galie, N.; McLaughlin, V.V.; Rubin, L.J.; Simonneau, G. An overview of the 6th World Symposium on Pulmonary Hypertension. Eur. Respir. J. 2019, 53, 1802148. [Google Scholar] [CrossRef] [PubMed] [Green Version]
  13. Galie, N.; Humbert, M.; Vachiery, J.L.; Gibbs, S.; Lang, I.; Torbicki, A.; Simonneau, G.; Peacock, A.; Noordegraaf, A.V.; Beghetti, M.; et al. 2015 ESC/ERS Guidelines for the diagnosis and treatment of pulmonary hypertension: The Joint Task Force for the Diagnosis and Treatment of Pulmonary Hypertension of the European Society of Cardiology (ESC) and the European Respiratory Society (ERS): Endorsed by: Association for European Paediatric and Congenital Cardiology (AEPC), International Society for Heart and Lung Transplantation (ISHLT). Eur. Heart J. 2016, 37, 67–119. [Google Scholar] [PubMed]
  14. Raymond, R.J.; Hinderliter, A.L.; Willis, P.W.; Ralph, D.; Caldwell, E.J.; Williams, W.; Ettinger, N.A.; Hill, N.S.; Summer, W.R.; de Boisblanc, B.; et al. Echocardiographic predictors of adverse outcomes in primary pulmonary hypertension. J. Am. Coll. Cardiol. 2002, 39, 1214–1219. [Google Scholar] [CrossRef] [Green Version]
  15. Jiang, R.; Wu, C.; Pudasaini, B.; Wang, L.; Zhao, Q.-H.; Zhang, R.; Wu, W.-H.; Yuan, P.; Jing, Z.-C.; Liu, J.-M. A novel scoring index by Doppler echocardiography for predicting severe pulmonary hypertension due to chronic lung diseases: A cross-sectional diagnostic accuracy study. Int. J. Chronic Obstr. Pulm. Dis. 2017, 12, 1741–1751. [Google Scholar] [CrossRef] [PubMed] [Green Version]
  16. Vestbo, J.; Hurd, S.S.; Agusti, A.G.; Jones, P.W.; Vogelmeier, C.; Anzueto, A.; Barnes, P.J.; Fabbri, L.M.; Martinez, F.J.; Nishimura, M.; et al. Global strategy for the diagnosis, management, and prevention of chronic obstructive pulmonary disease: GOLD executive summary. Am. J. Respir. Crit. Care Med. 2013, 187, 347–365. [Google Scholar] [CrossRef]
  17. Meyer, K.C.; Raghu, G.; Baughman, R.P.; Brown, K.K.; Costabel, U.; Du Bois, R.M.; Drent, M.; Haslam, P.L.; Kim, D.S.; Nagai, S.; et al. An Official American Thoracic Society Clinical Practice Guideline: The Clinical Utility of Bronchoalveolar Lavage Cellular Analysis in Interstitial Lung Disease. Am. J. Respir. Crit. Care Med. 2012, 185, 1004–1014. [Google Scholar] [CrossRef] [PubMed]
  18. Rudski, L.G.; Lai, W.W.; Afilalo, J.; Hua, L.; Handschumacher, M.D.; Chandrasekaran, K.; Solomon, S.D.; Louie, E.K.; Schiller, N.B. Guidelines for the echocardiographic assessment of the right heart in adults: A report from the American Society of Echocardiography endorsed by the European Association of Echocardiography, a registered branch of the European Society of Cardiology, and the Canadian Society of Echocardiography. J. Am. Soc. Echocardiogr. 2010, 23, 685–713. [Google Scholar]
  19. Jiang, R.; Ai, Z.-S.; Jiang, X.; Yuan, P.; Liu, D.; Zhao, Q.-H.; He, J.; Wang, L.; Gomberg-Maitland, M.; Jing, Z.-C. Intravenous fasudil improves in-hospital mortality of patients with right heart failure in severe pulmonary hypertension. Hypertens. Res. 2015, 38, 539–544. [Google Scholar] [CrossRef]
  20. Camp, R.L.; Dolled-Filhart, M.; Rimm, D.L. X-tile: A new bio-informatics tool for biomarker assessment and outcome-based cut-point optimization. Clin. Cancer Res. 2004, 10, 7252–7259. [Google Scholar] [CrossRef] [PubMed] [Green Version]
  21. Forfia, P.R.; Fisher, M.R.; Mathai, S.C.; Housten-Harris, T.; Hemnes, A.R.; Borlaug, B.A.; Chamera, E.; Corretti, M.C.; Champion, H.C.; Abraham, T.P.; et al. Tricuspid Annular Displacement Predicts Survival in Pulmonary Hypertension. Am. J. Respir. Crit. Care Med. 2006, 174, 1034–1041. [Google Scholar] [CrossRef] [PubMed]
  22. Haeck, M.L.; Scherptong, R.W.; Marsan, N.A.; Holman, E.R.; Schalij, M.J.; Bax, J.J.; Vliegen, H.W.; Delgado, V. Prognostic Value of Right Ventricular Longitudinal Peak Systolic Strain in Patients With Pulmonary Hypertension. Circ. Cardiovasc. Imaging 2012, 5, 628–636. [Google Scholar] [CrossRef] [PubMed] [Green Version]
  23. Siddiqui, I.; Rajagopal, S.; Brucker, A.; Chiswell, K.; Christopher, B.; Alenezi, F.; Mandawat, A.; Rivera, D.; Arges, K.; Tapson, V.; et al. Clinical and Echocardiographic Predictors of Outcomes in Patients With Pulmonary Hypertension. Am. J. Cardiol. 2018, 122, 872–878. [Google Scholar] [CrossRef] [PubMed]
  24. Eysmann, S.B.; Palevsky, H.I.; Reichek, N.; Hackney, K.; Douglas, P.S. Two-dimensional and Doppler-echocardiographic and cardiac catheterization correlates of survival in primary pulmonary hypertension. Circulation 1989, 80, 353–360. [Google Scholar] [CrossRef] [PubMed] [Green Version]
  25. Jing, Z.-C.; Xu, X.-Q.; Han, Z.-Y.; Wu, Y.; Deng, K.-W.; Wang, H.; Wang, Z.-W.; Cheng, X.-S.; Xu, B.; Hu, S.-S.; et al. Registry and Survival Study in Chinese Patients With Idiopathic and Familial Pulmonary Arterial Hypertension. Chest 2007, 132, 373–379. [Google Scholar] [CrossRef]
  26. D’Alonzo, G.E.; Barst, R.J.; Ayres, S.M.; Bergofsky, E.H.; Brundage, B.H.; Detre, K.M.; Fishman, A.P.; Goldring, R.M.; Groves, B.M.; Kernis, J.T.; et al. Survival in Patients with Primary Pulmonary Hypertension. Ann. Intern. Med. 1991, 115, 343–349. [Google Scholar] [CrossRef] [PubMed]
  27. Benza, R.L.; Miller, D.; Barst, R.J.; Badesch, D.B.; Frost, A.E.; McGoon, M.D. An Evaluation of Long-term Survival From Time of Diagnosis in Pulmonary Arterial Hypertension From the REVEAL Registry. Chest 2012, 142, 448–456. [Google Scholar] [CrossRef] [PubMed]
  28. Humbert, M.; Sitbon, O.; Chaouat, A.; Bertocchi, M.; Habib, G.; Gressin, V.; Yaïci, A.; Weitzenblum, E.; Cordier, J.-F.; Chabot, F.; et al. Survival in patients with idiopathic, familial, and anorexigen-associated pulmonary arterial hypertension in the modern management era. Circulation 2010, 122, 156–163. [Google Scholar] [CrossRef] [PubMed] [Green Version]
  29. Zhang, R.; Dai, L.-Z.; Xie, W.-P.; Yu, Z.-X.; Wu, B.-X.; Pan, L.; Yuan, P.; Jiang, X.; He, J.; Humbert, M.; et al. Survival of Chinese Patients With Pulmonary Arterial Hypertension in the Modern Treatment Era. Chest 2011, 140, 301–309. [Google Scholar] [CrossRef]
  30. Andersen, K.H.; Iversen, M.; Kjaergaard, J.; Mortensen, J.; Nielsen-Kudsk, J.E.; Bendstrup, E.; Videbaek, R.; Carlsen, J. Prevalence, predictors, and survival in pulmonary hypertension related to end-stage chronic obstructive pulmonary disease. J. Heart Lung Transplant. 2012, 31, 373–380. [Google Scholar] [CrossRef] [PubMed]
  31. Lettieri, C.J.; Nathan, S.D.; Barnett, S.D.; Ahmad, S.; Shorr, A.F. Prevalence and Outcomes of Pulmonary Arterial Hypertension in Advanced Idiopathic Pulmonary Fibrosis. Chest 2006, 129, 746–752. [Google Scholar] [CrossRef] [PubMed]
  32. Carlsen, J.; Andersen, K.H.; Boesgaard, S.; Iversen, M.; Steinbrüchel, D.; Andersen, C.B. Pulmonary arterial lesions in explanted lungs after transplantation correlate with severity of pulmonary hypertension in chronic obstructive pulmonary disease. J. Heart Lung Transplant. 2013, 32, 347–354. [Google Scholar] [CrossRef] [PubMed]
  33. Barberà, J.A.; Blanco, I. Management of Pulmonary Hypertension in Patients with Chronic Lung Disease. Curr. Hypertens. Rep. 2015, 17, 62. [Google Scholar] [CrossRef] [PubMed]
  34. Weitzenblum, E.; Chaouat, A. Cor pulmonale. Chronic Respir. Disease. 2009, 6, 177–185. [Google Scholar] [CrossRef]
  35. Wanamaker, B.; Cascino, T.; McLaughlin, V.; Oral, H.; Latchamsetty, R.; Siontis, K.C. Atrial Arrhythmias in Pulmonary Hypertension: Pathogenesis, Prognosis and Management. Arrhythmia Electrophysiol. Rev. 2018, 7, 43–48. [Google Scholar] [CrossRef]
  36. Pristera, N.; Musarra, R.; Schilz, R.; Hoit, B.D. The Role of Echocardiography in the Evaluation of Pulmonary Arterial Hypertension. Echocardiography 2015, 33, 105–116. [Google Scholar] [CrossRef]
  37. Arcasoy, S.M.; Christie, J.D.; Ferrari, V.A.; Sutton, M.S.J.; Zisman, D.A.; Blumenthal, N.P.; Pochettino, A.; Kotloff, R.M. Echocardiographic Assessment of Pulmonary Hypertension in Patients with Advanced Lung Disease. Am. J. Respir. Crit. Care Med. 2003, 167, 735–740. [Google Scholar] [CrossRef] [Green Version]
Figure 1. Flow diagram of patient enrolment and study design. CLD: chronic lung diseases; DE: Doppler echocardiography; RHC: right heart catheterization.
Jcm 11 01603 g001
Figure 2. Kaplan–Meier survival for all-cause mortality of severe CLD-PH: (A) in the derivation cohort population; (B) in subgroups with scores of −1, 0, 1, 2 and 3; (C) in subgroups with scores < 0 vs. scores ≥ 0; (D) in the validation cohort according to the mean value of the total points calculated by each patient’s nomogram.
Jcm 11 01603 g002
Figure 3. Cut-off values for echocardiographic parameters calculated using the X-tile program. X-tile analyses of TAPSE (A), PASP (B) and RVEDTD (C) levels in the cohort population with severe CLD-PH. X-tile plots for the cohort patients are shown in the left panels; black circles highlight the cut-off values, which are also shown in histograms (middle panels). Kaplan–Meier plots are presented in the right panels. RVEDTD: right ventricular end-diastolic transverse dimension; PASP: pulmonary arterial systolic pressure; TAPSE: tricuspid annular plane systolic excursion.
Jcm 11 01603 g003
Figure 4. Comparisons of ROC curves of PASP alone and the composite scores in predicting all-cause mortality in patients with severe CLD-PH. AUC: area under the curve; PASP: pulmonary arterial systolic pressure; CLD: chronic lung diseases; PH: pulmonary hypertension; ROC: receiver operating characteristic.
Jcm 11 01603 g004
Figure 5. Nomogram for predicting all-cause mortality in severe CLD-PH. PASP: pulmonary arterial systolic pressure; RVEDTD: right ventricular end-diastolic transverse dimension; TAPSE: tricuspid annular plane systolic excursion.
Jcm 11 01603 g005
Figure 6. Cox univariate regression analyses for all-cause mortality among COPD patients. COPD: chronic obstructive pulmonary diseases; FEV1: forced expiratory volume in 1 s; FVC: forced vital capacity; DLco: diffusing capacity for carbon monoxide; RVEDTD: right ventricular end-diastolic transverse dimension; PASP: pulmonary arterial systolic pressure; ENDSEI: end-systolic stage eccentricity index; TAPSE: tricuspid annular plane systolic excursion.
Jcm 11 01603 g006
Table 1. Demographics and Baseline Characteristics of Severe PH in the Derivation and Validation Cohorts.
VariableDerivation CohortValidation Cohortp Value
(n = 67)(n = 33)
Age (years)58.0 ± 12.961.8 ± 11.30.142
Male, n (%)38 (56.7)24 (84.8)0.187
BSA (m2)1.60 ± 0.21.59 ± 0.10.797
Aetiology, n (%)
COPD52 (77.6)24 (72.4)0.490
Interstitial lung disease8 (11.9)2 (6.1)0.339
Asthma3 (4.5)00.549
Pneumoconiosis2 (3.0)1 (3.0)1.000
CPFE3 (4.5)1 (3.0)0.928
Post tubercular sequelae1 (1.5)01.000
Sleep-disordered breathing2 (3.0)1 (3.0)1.000
Chest wall abnormalities1 (1.5)01.000
Comorbidities, n (%)
Systemic hypertension10 (14.9)4 (12.1)1.000
Diabetes mellitus2 (3.0)1 (3.0)1.000
Coronary heart disease1 (1.5)1 (3.0)1.000
Malignant tumour1 (1.5)01.000
Arrhythmia3 (4.5)2 (6.1)1.000
Hyperlipidaemia01 (3.0)0.330
Previous cerebral infarction1 (1.5)01.000
Pulmonary function test
FEV1% predicted32.3 (24.0, 44.0)35.5 (35.6, 49.4)0.127
FVC% predicted54.9 (40.9, 63.4)60.1 (57.9, 72.7)0.081
FEV1/FVC47.4 (42.9, 56.1)47.7 (47.1, 56.1)0.823
RV% predicted197.9 (137.9, 251.4)116.4 (155.7, 206.3)0.220
TLC% predicted115.5 (92.0, 131.7)108.8 (98.7, 117.6)0.440
DLco% predicted40.9 (27.9, 56.2)40.9 (36.4, 61.6)1.000
Haemodynamics
mRAP, mmHg7.0 (4.8, 9.3)7.0 (5.6, 8.5)0.541
mPAP, mm Hg46.0 (42.0, 55.0)44.0 (41.8, 49.2)0.108
PAWP, mm Hg9.0 (6.0, 13.0)8.0 (7.6, 10.2)0.348
CO, L/min4.6 (4.0, 5.7)4.5 (4.1, 5.3)0.139
CI, L/min/m23.1 (2.6, 3.7)2.7 (2.5, 3.1)0.035
PVR, Wood units8.0 (6.3, 10.2)8.0 (7.1, 9.1)0.895
Echocardiography
LVEF, %70.9 ± 9.068.9 ± 9.90.315
LA, cm3.1 ± 0.63.5 ± 0.70.799
LVDED, cm4.0 (3.5, 4.4)3.9 (3.7, 4.2)0.629
LVSED, cm2.3 ± 0.62.4 ± 0.60.949
RATD, cm4.8 (4.3, 5.5)4.9 (4.8, 5.6)0.200
RALD, cm5.2 (4.3, 5.9)5.0 (5.4, 5.9)0.175
RVEDTD, cm4.3 (3.8, 5.0)4.3 (4.0, 4.9)0.670
RVEDLD, cm6.6 ± 0.96.8 ± 0.90.271
PASP, mmHg76.2 ± 22.674.1 ± 24.40.533
TAPSE, cm1.7 (1.5, 1.9)1.8 (1.6, 1.8)0.921
PAd, cm2.9 (2.6, 3.2)3.1 (2.9, 3.4)0.208
ENDSEI1.3 (1.0, 1.5)1.1 (1.1, 1.3)0.158
TV s’, cm/s12.0 (9.0, 13.0)11.2 (10.1, 11.6)0.608
PASP/TAPSE, mmHg/cm44.3 ± 14.444.4 ± 16.30.975
Blood gas analysis
pH7.39 (7.35, 7.42)7.40 (7.38, 7.42)0.189
PaO2, mmHg58 (46, 60)59.5 (50.8, 69.5)0.591
PaCO2, mmHg50.3 (39.7, 60.1)46.5 (37.7, 58.6)0.236
SaO2, %87.0 (79.3, 91.7)93.8 (83.1, 93.8)0.136
PAH-targeted therapy
PDE5I47 (70.1)30 (90.1)0.127
ERA5 (7.5)1 (3.3)0.661
Prostacyclin6 (9.0)1 (3.3)0.420
None9 (13.4)2 (6.1)0.330
Traditional treatment
Oxygen67 (100)33 (100)1.000
ICS/LABA59 (88.1)30 (90.9)1.000
Values are expressed as the mean ± SD or median (quartile range). mPAP: mean pulmonary artery pressure; RAP: right atrial pressure; PAWP: pulmonary artery wedge pressure; CO: cardiac output; CI: cardiac index; PVR: pulmonary vascular resistance; COPD: chronic obstructive pulmonary disease; CPFE: combined pulmonary fibrosis and emphysema; PH: pulmonary hypertension; FEV1: forced expiratory volume in 1 s; FVC: forced vital capacity; RV: residual volume; TLC: total lung capacity; DLco: diffusing capacity for carbon monoxide; RVEDTD: right ventricular end-diastolic transverse dimension; RVEDLD: right ventricular end-diastolic longitudinal dimension; RATD: right atrial transverse dimension; RALD: right atrial longitudinal dimension; PASP: pulmonary arterial systolic pressure; ENDSEI: end-systolic stage eccentricity index; PAd: pulmonary artery dimension; TAPSE: tricuspid annular plane systolic excursion; LVEF: left ventricular ejection fraction; LVDED: left ventricular end-diastolic transverse dimension; LVSED: left ventricular end-systolic transverse dimension; TV s’: tricuspid myocardial systolic velocity; PaO2: oxygen partial pressure; PaCO2: partial pressure of carbon dioxide: SaO2: oxygen saturation; ICS/LABA, inhaled corticosteroids/long-acting β2-agonists; PDE5I: phosphodiesterase-5 inhibitors; ERA: endothelin receptor antagonist; PDE5I included sildenafil, vardenafil and tadalafil; ERA indicated bosentan; Prostacyclins included beraprost and inhaled iloprost.
Table 2. Cox univariate and multivariate regression analyses for all-cause mortality in the derivation cohort.
Variable *Univariate AnalysisMultivariate Analysis
HR [95% CI]p ValueHR [95% CI]p Valueβ-CoefficientWeighted Scores
Age, years1.581 (0.779, 3.206)0.204
Sex0.691 (0.370, 1.290)0.246
BSA1.004 (0.263, 3.833)1.004
PaO2, mm Hg0.983 (0.963, 1.004)0.119
PaCO2, mm Hg1.010 (0.984, 1.036)0.471
SaO2, %0.973 (0.940, 1.008)0.125
Lactic acid, mmol/L1.355 (0.891, 2.062)0.155
Echocardiography
LVEF, %0.531 (0.223, 1.268)0.154
LA, cm0.666 (0.350, 1.265)0.214
LVDED, cm0.608 (0.310, 1.193)0.148
LVSED, cm0.408 (0.220, 0.756)0.004
RATD, cm0.485 (0.201, 1.168)0.107
RALD, cm1.588 (0.809, 3.118)0.179
RVEDTD, cm2.583 (1.311, 5.091)0.0062.248 (1.062, 4.759)0.0340.8101
RVEDLD, cm1.363 (0.738, 2.519)0.322
PASP, mmHg2.599 (1.232, 5.485)0.0125.039 (2.002, 12.680)0.0011.6172
TAPSE, cm0.514 (0.273, 0.969)0.0400.414 (0.196, 0.873)0.021−0.882−1
PAd, cm0.537 (0.253, 1.295)0.181
ENDSEI2.342 (1.071, 5.123)0.033
Pulmonary function test
FEV1% pred0.753 (0.390, 1.455)0.399
FVC% pred0.674 (0.362, 1.257)0.215
FEV1/FVC0.427 (0.202, 0.904)0.026
RV% pred1.197 (0.615, 2.330)0.597
TLC% pred1.354 (0.660, 2.780)0.409
DLco% pred0.437 (0.217, 0.879)0.020
* Data in parentheses are 95% confidence intervals (CIs). * Variables were transformed into binary variables according to optimum cut-off values. Abbreviations as in Table 1. If PASP ≥ 103 mm Hg, the weighted score = 2; If RVEDTD ≥ 4.2 cm, the weighted score = 1; If TAPSE ≥ 1.8 cm, the weighted score = −1.
Table 3. Example of score and point allocation.
VariablesValue
TAPSE ≥ 1.8 cm−1
LVSED < 2.3 cm0
RVEDTD ≥ 4.2 cm+1
RVEDTD < 4.2 cm0
PASP ≥ 103 mm Hg+2
PASP < 103 mm Hg0
Total Scores−1~3
RVEDTD: right ventricular end-diastolic transverse dimension; PASP: pulmonary arterial systolic pressure; LVSED: left ventricular end-systolic transverse dimension; CI: cardiac index; TAPSE: tricuspid annular plane systolic excursion.
Table 4. Cox univariate regression analyses for all-cause mortality among COPD patients in the derivation cohort.
Variable *HR [95% CI]p Value
Lactic acid, mmol/L2.877 (1.103, 7.503)0.031
Echocardiography
LVSED, cm0.460 (0.231, 0.915)0.027
RVEDTD, cm3.708 (1.156, 9.069)0.004
PASP, mmHg1.432 (0.717, 2.858)0.309
TAPSE, cm2.040 (0.986, 4.218)0.055
ENDSEI2.267 (1.121, 4.587)0.023
Pulmonary function test
FVC% pred0.467 (0.226, 0.966)0.040
FEV1/FVC0.473 (0.224, 0.997)0.049
DLco% pred0.260 (0.100, 0.676)0.006
* Data in parentheses are 95% confidence intervals (CIs). * Variables were transformed into binary variables according to optimum cut-off values. Abbreviations as in Table 1.
Publisher’s Note: MDPI stays neutral with regard to jurisdictional claims in published maps and institutional affiliations.

