
Mortality Predictive Value of the C2HEST Score in Elderly Subjects with COVID-19—A Subanalysis of the COLOS Study

 , ,
, ,  , , , , , ,
 , , , add
Show full author list
, , , add
Show full author list
Abstract
:1. Introduction
2. Materials and Methods
2.1. Study Design and Population
2.2. Clinical Follow-Up and Outcomes
2.3. Study Groups
- –
- the low-risk of 0 to 1 point,
- –
- the medium-risk of 2 to 3 points,
- –
- the high-risk of ≥ 4 points.
2.4. Statistical Analysis
3. Results
3.1. Patients Baseline Characteristics
3.2. Laboratory Assays
3.3. Drug Therapy and Applied Treatment during Hospitalization
3.3.1. Drug Therapy
3.3.2. Treatment Procedures
3.4. Clinical Outcome
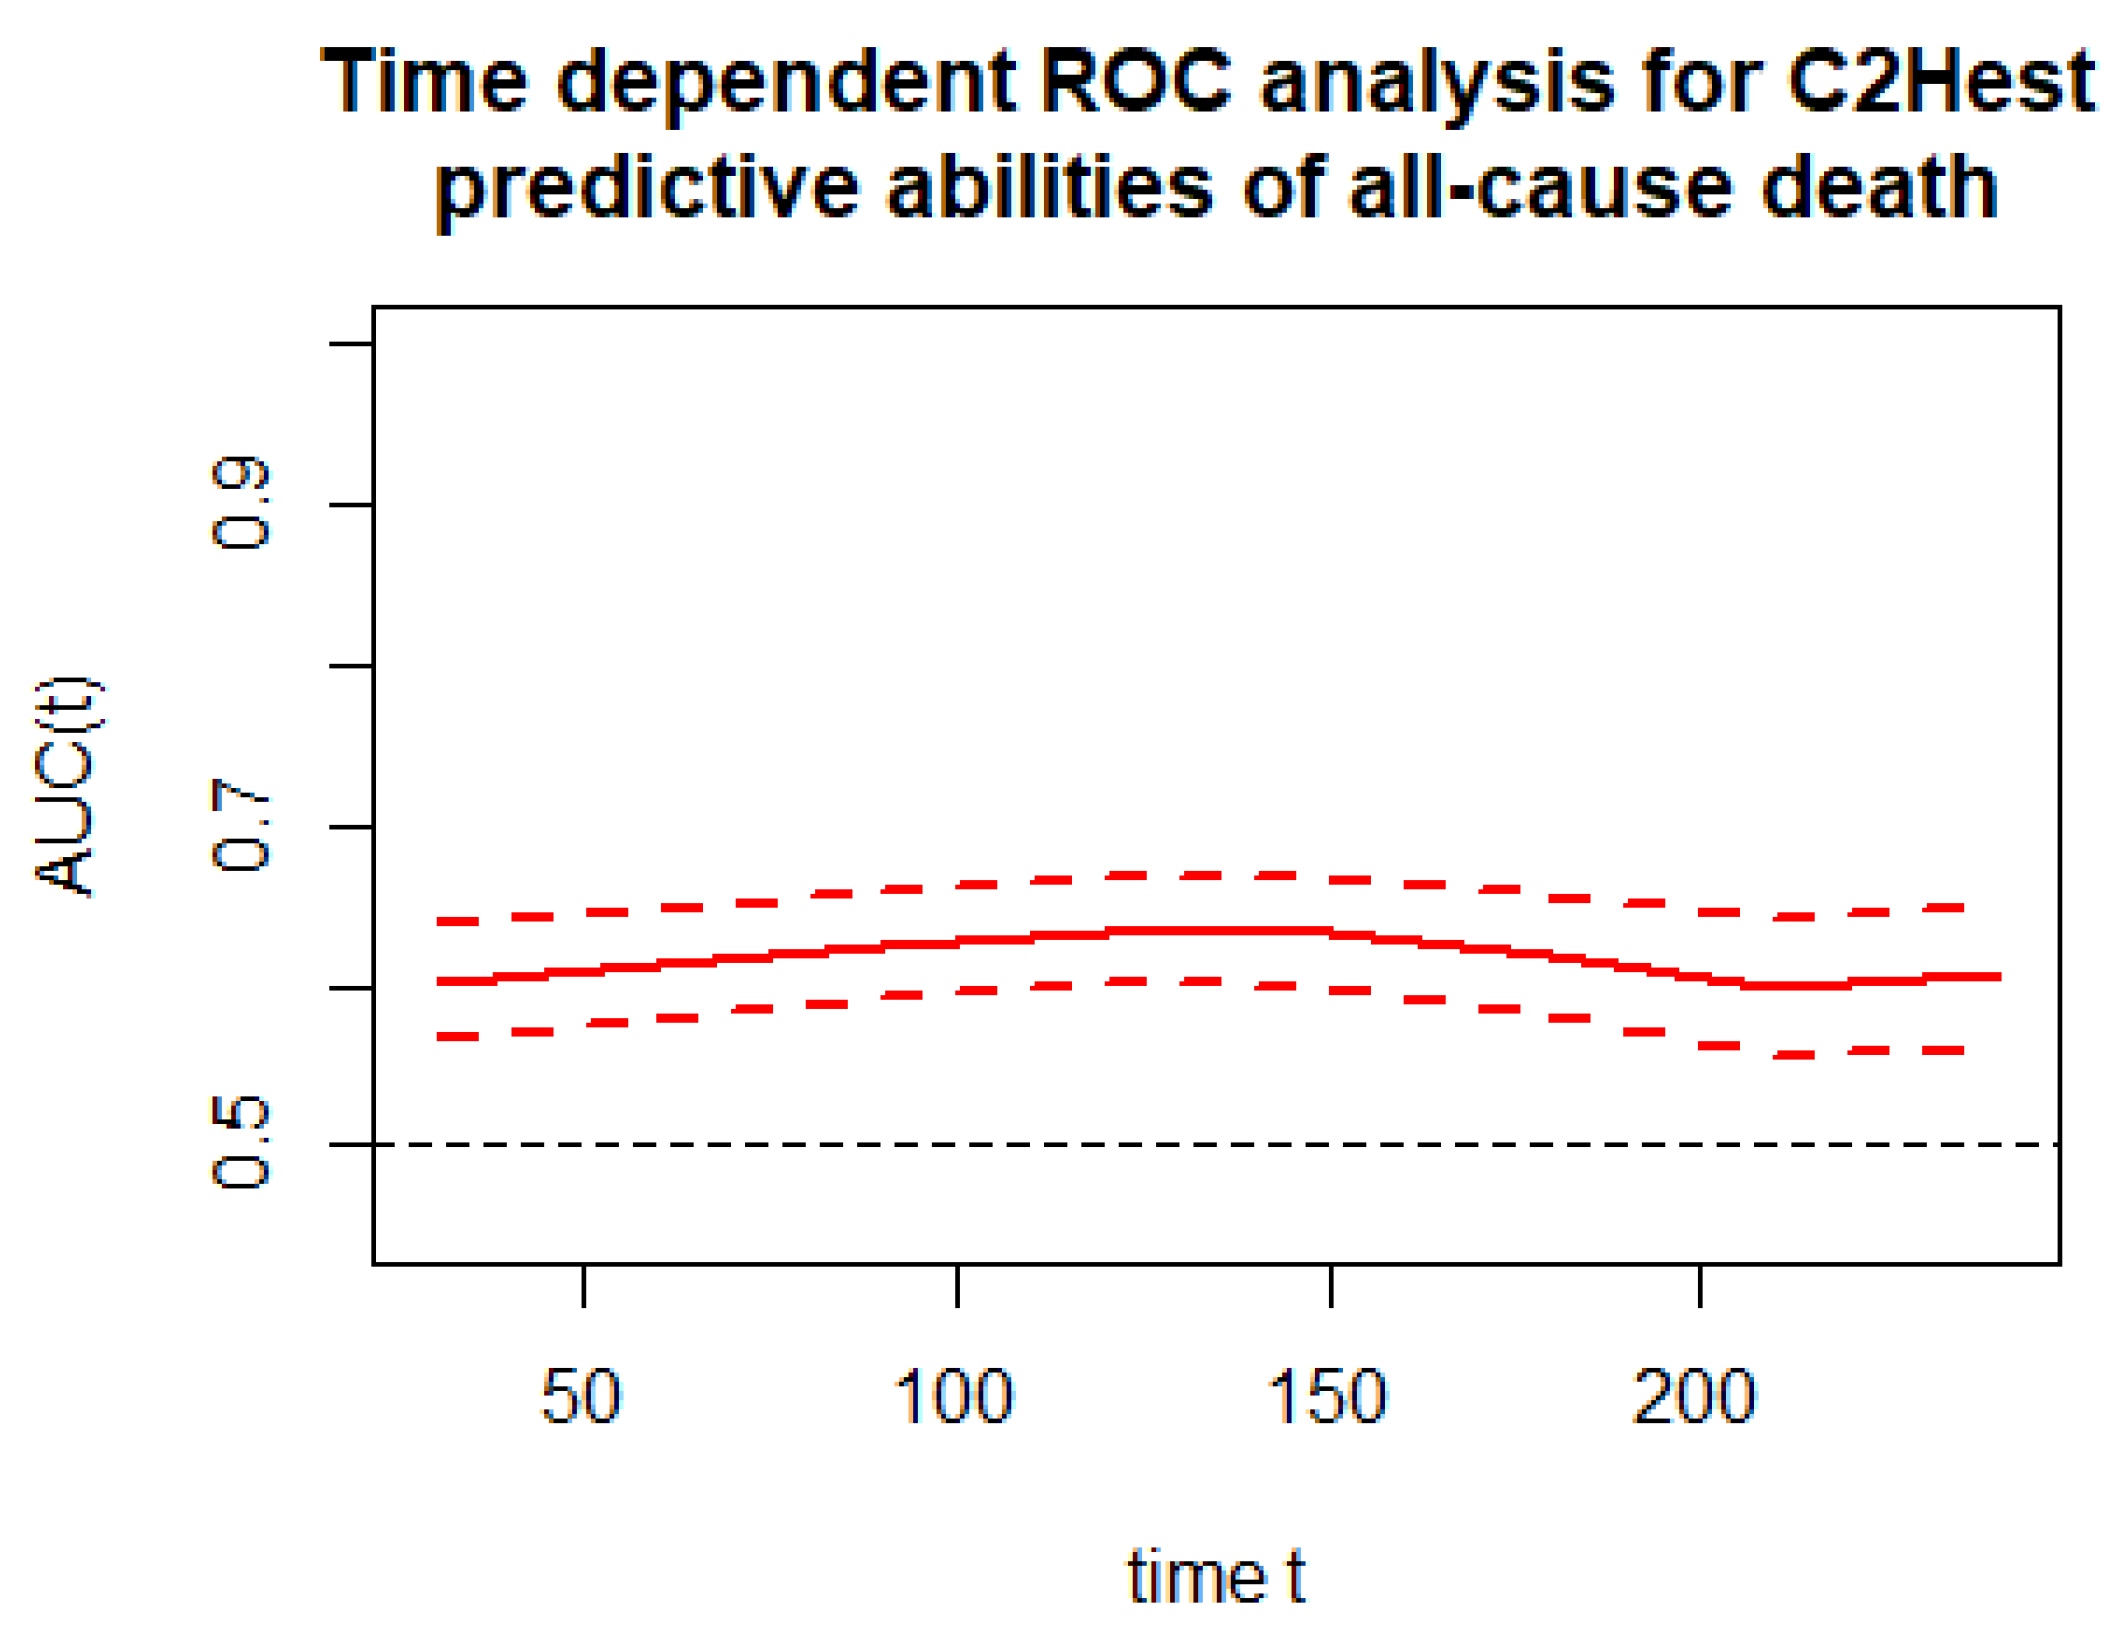
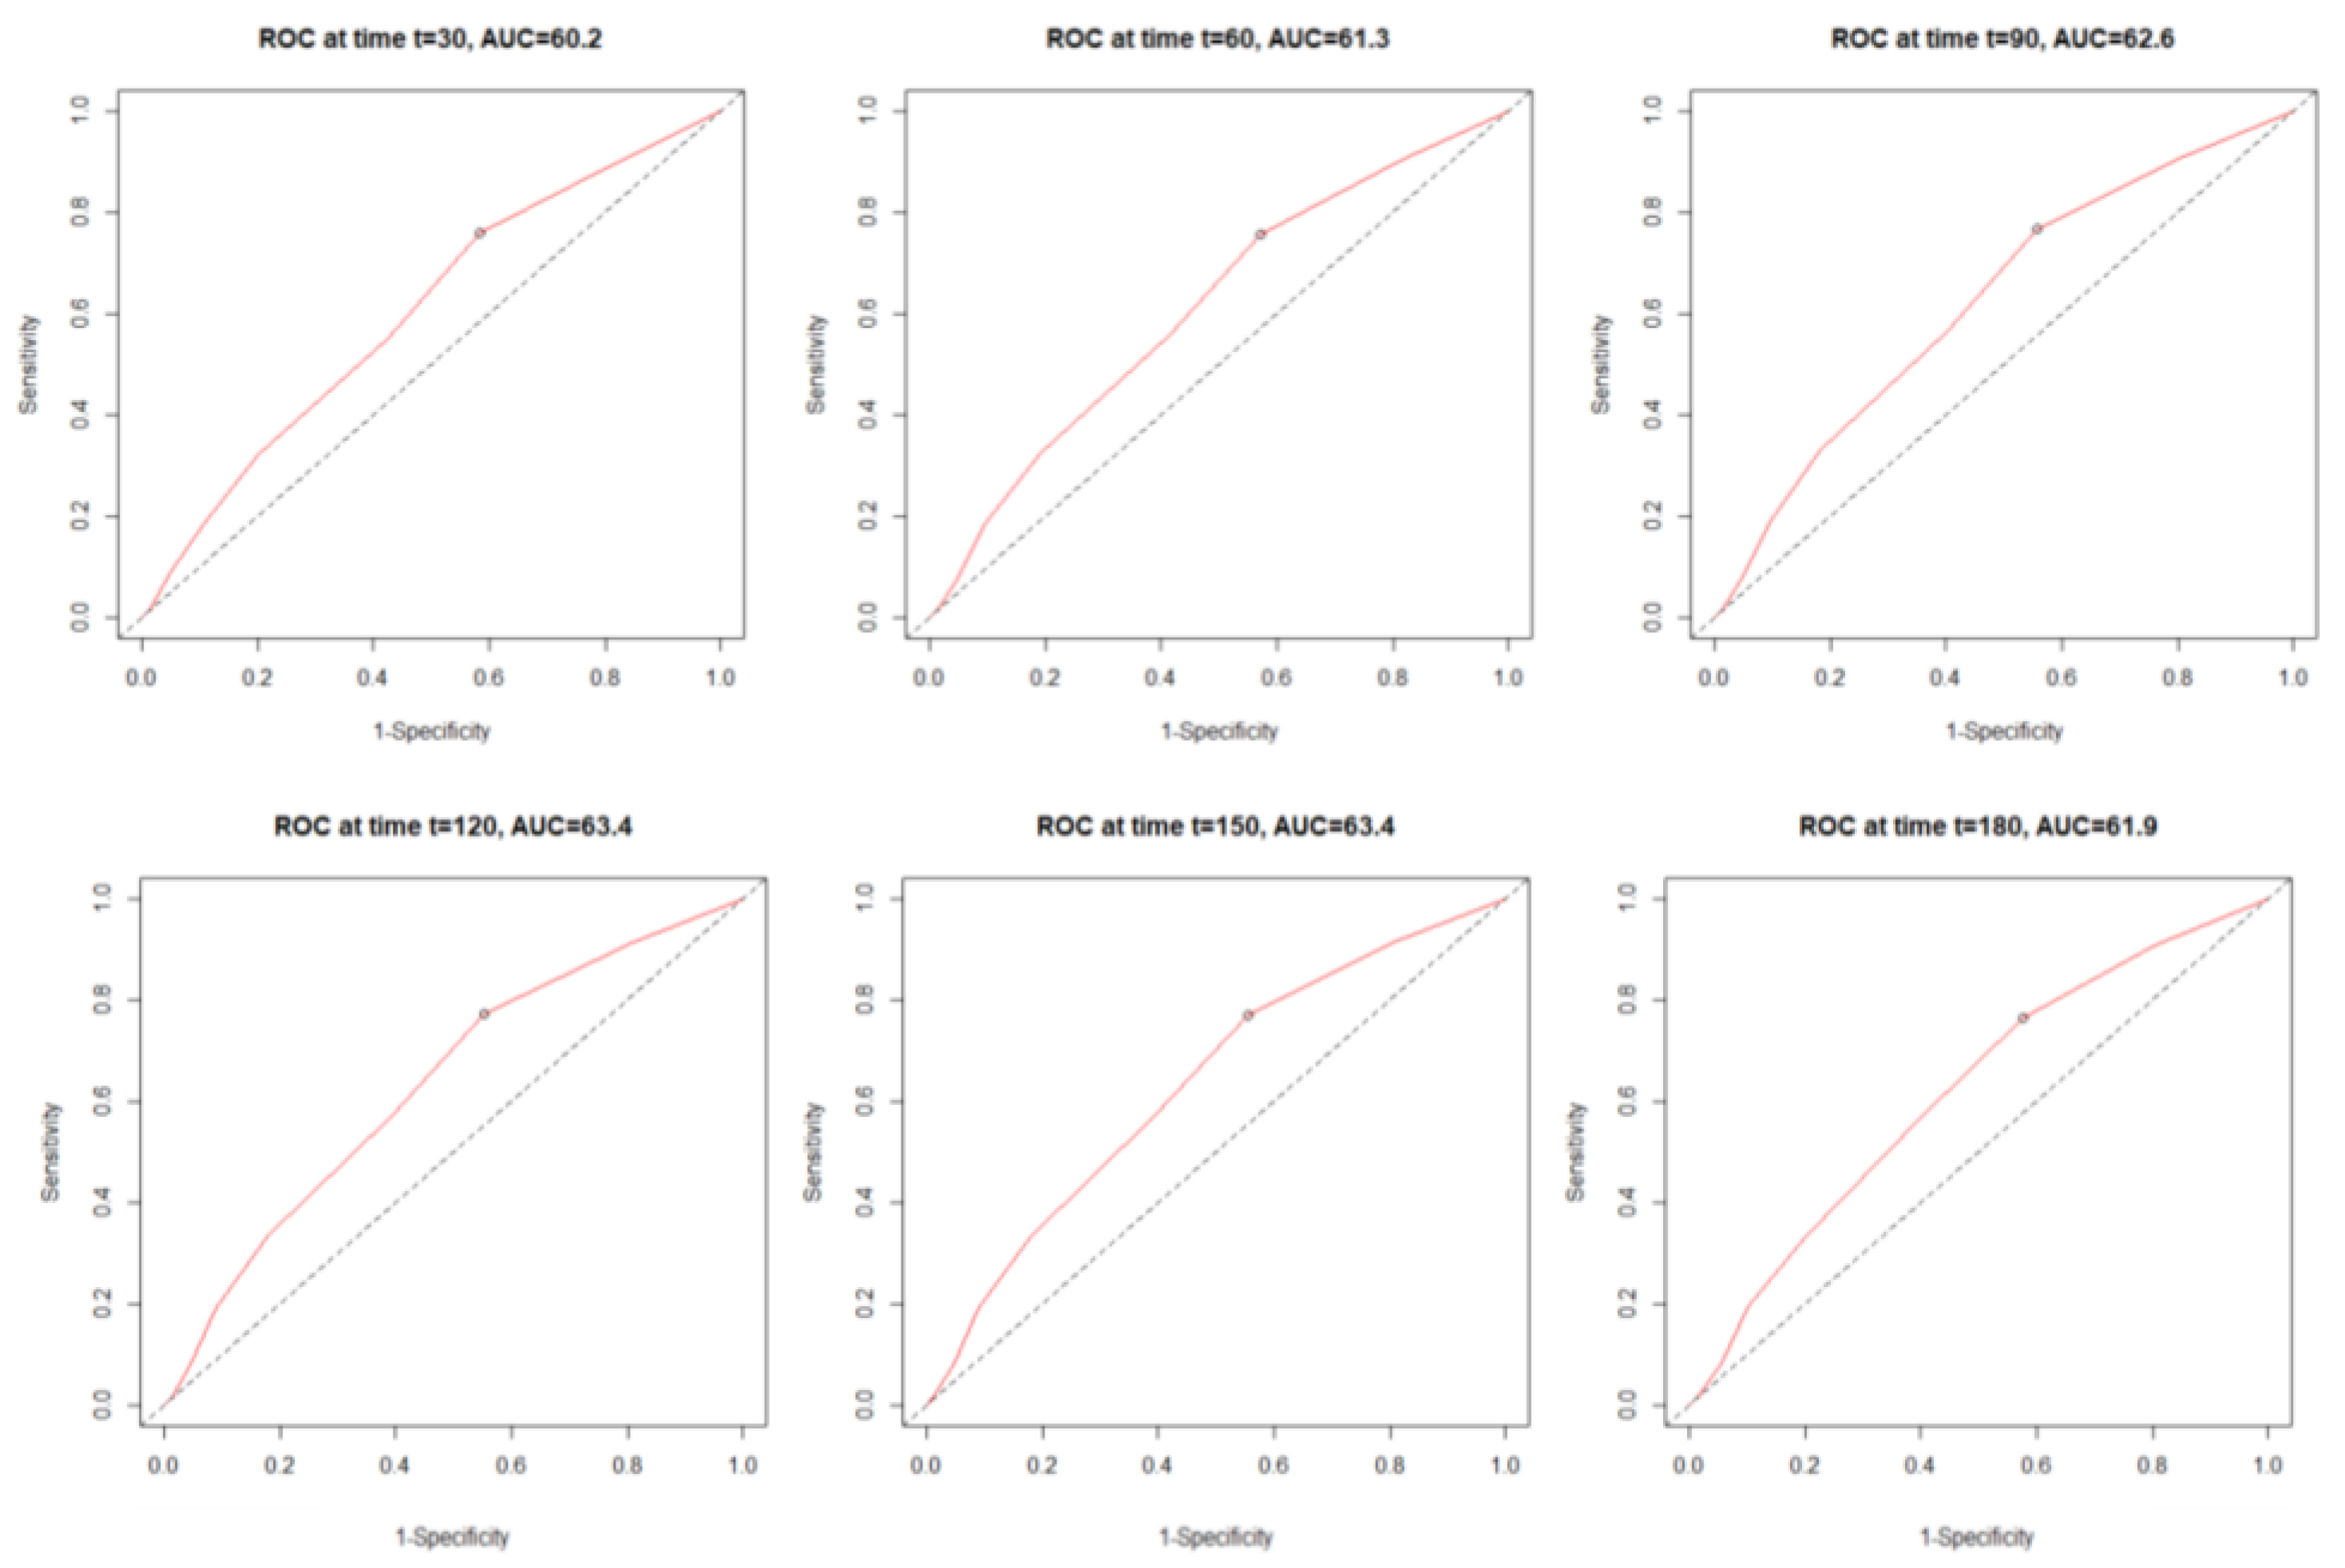
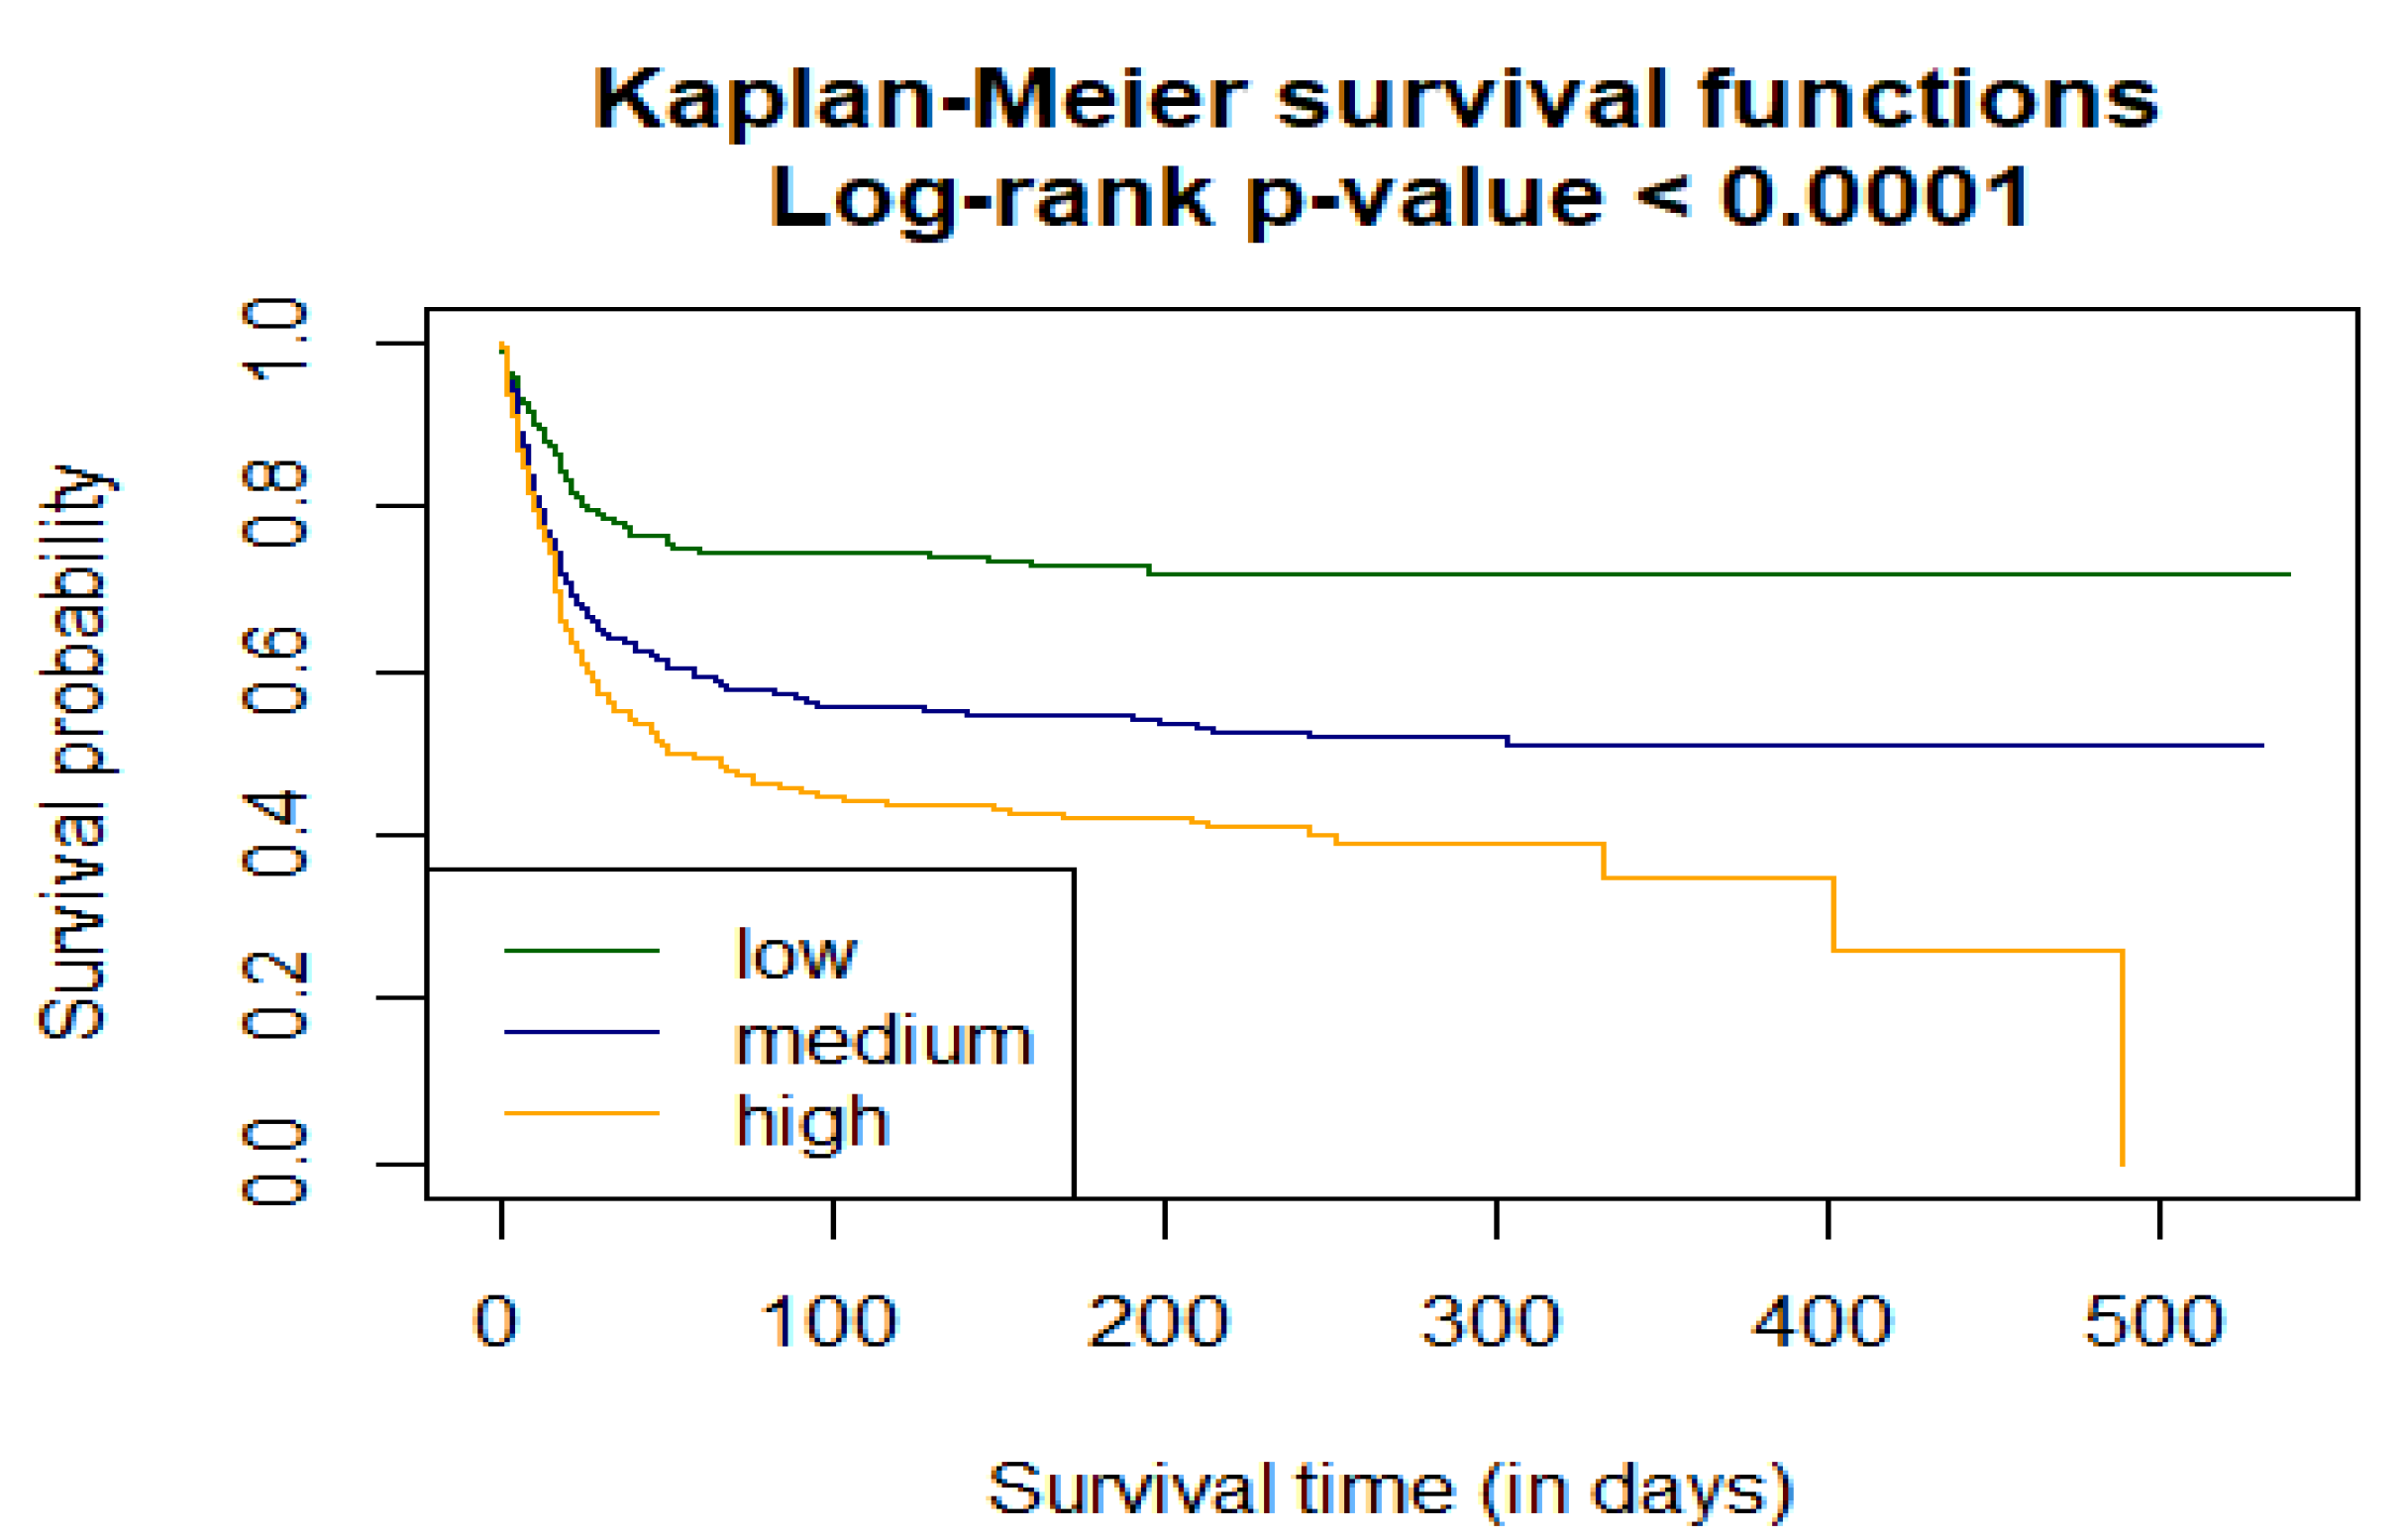
3.4.1. Correlation of C2HEST Score Results and Mortality
3.4.2. Correlation of the C2HEST Score with Secondary Outcome
4. Discussion
Limitations
5. Conclusions
Supplementary Materials
Author Contributions
Funding
Institutional Review Board Statement
Informed Consent Statement
Data Availability Statement
Acknowledgments
Conflicts of Interest
References
- Zhu, N.; Zhang, D.; Wang, W.; Li, X.; Yang, B.; Song, J.; Zhao, X.; Huang, B.; Shi, W.; Lu, R.; et al. A novel coronavirus from patients with pneumonia in China, 2019. N. Engl. J. Med. 2020, 382, 727–733. [Google Scholar] [CrossRef] [PubMed]
- Maniaci, A.; Ferlito, S.; Bubbico, L.; Ledda, C.; Rapisarda, V.; Iannella, G.; La Mantia, I.; Grillo, C.; Vicini, C.; Privitera, E.; et al. Comfort rules for face masks among healthcare workers during COVID-19 spread. Ann. Ig. 2021, 33, 615–627. [Google Scholar] [PubMed]
- Gao, Y.D.; Ding, M.; Dong, X.; Zhang, J.J.; KursatAzkur, A.; Azkur, D.; Gan, H.; Sun, Y.L.; Fu, W.; Li, W.; et al. Risk factors for severe and critically ill COVID-19 patients: A review. Allergy 2021, 76, 428–455. [Google Scholar] [CrossRef] [PubMed]
- Marin, B.G.; Aghagoli, G.; Lavine, K.; Yang, L.; Siff, E.J.; Chiang, S.S.; Salazar-Mather, T.P.; Dumenco, L.; Savaria, M.C.; Aung, S.N.; et al. Predictors of COVID-19 severity: A literature review. Rev. Med. Virol. 2021, 31, 1–10. [Google Scholar] [CrossRef] [PubMed]
- Maestre-Muñiz, M.M.; Arias, Á.; Arias-González, L.; Angulo-Lara, B.; Lucendo, A.J. Prognostic Factors at Admission for In-Hospital Mortality from COVID-19 Infection in an Older Rural Population in Central Spain. J. Clin. 2021, 10, 318. [Google Scholar] [CrossRef]
- Li, Y.G.; Pastori, D.; Farcomeni, A.; Yang, P.S.; Jang, E.; Joung, B.; Wang, Y.T.; Guo, Y.T.; Lip, G. A simple clinical risk score (C2HEST) for predicting incident atrial fibrillation in Asian subjects: Derivation in 471,446 Chinese subjects, with internal validation and external application in 451,199 Korean subjects. Chest 2019, 155, 510–518. [Google Scholar] [CrossRef]
- Liang, W.; Wu, Y.; Xue, R.; Wu, Z.; Wu, D.; He, J.; Dong, Y.; Lip, G.Y.; Zhu, W.; Liu, C. C 2 HEST score predicts clinical outcomes in heart failure with preserved ejection fraction: A secondary analysis of the TOPCAT trial. BMC Med. 2021, 19, 44. [Google Scholar] [CrossRef]
- Robin, X.; Turck, N.; Hainard, A.; Tiberti, N.; Lisacek, F.; Sanchez, J.C.; Müller, M. pROC: An open-source package for R and S+ to analyze and compare ROC curves. BMC Bioinform. 2011, 12, 77. [Google Scholar] [CrossRef]
- Therneau, T. A Package for Survival Analysis in R. R Package Version 3.2-7. Available online: https://CRAN.R-project.org/package=survival (accessed on 16 December 2021).
- Hothorn, T.; Hornik, K.; Van De Wiel, M.A.; Zeileis, A. A lego system for conditional inference. Am. Stat. 2006, 60, 257–263. [Google Scholar] [CrossRef] [Green Version]
- Schratz, P. R Package ‘Oddsratio’: Odds Ratio Calculation for GAM(M)s & GLM(M)s, Version 1.0.2. 2017. Available online: https://doi.org/10.5281/zenodo.1095473 (accessed on 1 December 2021).
- Gupta, S.; Hayek, S.S.; Wang, W.; Chan, L.; Mathews, K.S.; Melamed, M.L.; Brenner, S.K.; Leonberg-Yoo, A.; Schenck, E.J.; Radbel, J.; et al. Factors associated with death in critically ill patients with coronavirus disease 2019 in the US. JAMA Intern. Med. 2020, 180, 1436–1447. [Google Scholar] [CrossRef]
- García-Cabrera, L.; Pérez-Abascal, N.; Montero-Errasquín, B.; Rexach Cano, L.; Mateos-Nozal, J.; Cruz-Jentoft, A. Characteristics, hospital referrals and 60-day mortality of older patients living in nursing homes with COVID-19 assessed by a liaison geriatric team during the first wave: A research article. BMC Geriatr. 2021, 21, 610. [Google Scholar] [CrossRef]
- Min, L.; Yoon, W.; Mariano, J.; Wenger, N.S.; Elliott, M.N.; Kamberg, C.; Saliba, D. The vulnerable elders-13 survey predicts 5-year functional decline and mortality outcomes in older ambulatory care patients. J. Am. Geriatr. Soc. 2009, 57, 2070–2076. [Google Scholar] [CrossRef] [Green Version]
- Bell, S.P.; Schnelle, J.; Nwosu, S.K.; Schildcrout, J.; Goggins, K.; Cawthon, C.; Mixon, A.S.; Vasilevskis, E.E.; Kripalani, S. Development of a multivariable model to predict vulnerability in older American patients hospitalised with cardiovascular disease. BMJ Open 2015, 5, e008122. [Google Scholar] [CrossRef] [PubMed]
- Ho, F.K.; Petermann-Rocha, F.; Gray, S.R.; Jani, B.D.; Katikireddi, S.V.; Niedzwiedz, C.L.; Foster, H.; Hastie, C.E.; Mackay, D.F.; Gill, J.M.R.; et al. Is older age associated with COVID-19 mortality in the absence of other risk factors? General population cohort study of 470,034 participants. PLoS ONE 2020, 15, e0241824. [Google Scholar] [CrossRef] [PubMed]
- Assis, F.C.; Silva, M.; Geber-Júnior, J.C.; Roschel, H.; Peçanha, T.; Drager, L.F.; Santana, A. Association of health vulnerability with adverse outcomes in older people with COVID-19: A prospective cohort study. Clinics 2021, 76, e3369. [Google Scholar] [CrossRef] [PubMed]
- Liu, F.; Li, L.; Xu, M.; Wu, J.; Luo, D.; Zhu, Y.; Li, B.; Song, X.; Zhou, X. Prognostic value of interleukin-6, C-reactive protein, and procalcitonin in patients with COVID-19. J. Clin. Virol. 2020, 127, 104370. [Google Scholar] [CrossRef]
- Li, L.; Li, J.; Gao, M.; Fan, H.; Wang, Y.; Xu, X.; Chen, C.; Liu, J.; Kim, J.; Aliyari, R.; et al. Interleukin-8 as a biomarker for disease prognosis of coronavirus disease-2019 patients. Front. Immunol. 2021, 11, 3432. [Google Scholar] [CrossRef] [PubMed]
- Li, X.; Liu, C.; Mao, Z.; Xiao, M.; Wang, L.; Qi, S.; Zhou, F. Predictive values of neutrophil-to-lymphocyte ratio on disease severity and mortality in COVID-19 patients: A systematic review and meta-analysis. Crit. Care 2020, 24, 647. [Google Scholar] [CrossRef] [PubMed]
- Li, Y.G.; Bisson, A.; Bodin, A.; Herbert, J.; Grammatico-Guillon, L.; Joung, B.; Wang, Y.T.; Lip, G.Y.; Fauchier, L. C2 HEST Score and prediction of incident atrial fibrillation in poststroke patients: A French Nationwide Study. J. Am. Heart Assoc. 2019, 8, e012546. [Google Scholar] [CrossRef] [Green Version]
- Loffi, M.; Piccolo, R.; Regazzoni, V.; Di Tano, G.; Moschini, L.; Robba, D.; Quinzani, F.; Esposito, G.; Franzone, A.; Danzi, G.B. Coronary artery disease in patients hospitalised with Coronavirus disease 2019 (COVID-19) infection. Open Heart 2020, 7, e001428. [Google Scholar] [CrossRef] [PubMed]
- Jung, Y.; Wee, J.H.; Kim, J.H.; Choi, H.G. The Effects of Previous Asthma and COPD on the Susceptibility to and Severity of COVID-19: A Nationwide Cohort Study in South Korea. J. Clin. Med. 2021, 10, 4626. [Google Scholar] [CrossRef] [PubMed]
- Du, Y.; Zhou, N.; Zha, W.; Lv, Y. Hypertension is a clinically important risk factor for critical illness and mortality in COVID-19: A meta-analysis. Nutr. Metab. Cardiovasc. Dis. 2021, 31, 745–755. [Google Scholar] [CrossRef] [PubMed]
- Grasselli, G.; Greco, M.; Zanella, A.; Albano, G.; Antonelli, M.; Bellani, G.; Bonanomi, E.; Cabrini, L.; Carlesso, E.; Castelli, G.; et al. Risk factors associated with mortality among patients with COVID-19 in intensive care units in Lombardy, Italy. JAMA Intern. Med. 2020, 180, 1345–1355. [Google Scholar] [CrossRef] [PubMed]
- Lvarez-Garcia, J.; Lee, S.; Gupta, A.; Cagliostro, M.; Joshi, A.A.; Rivas-Lasarte, M.; Contreras, J.; Mitter, S.S.; LaRocca, G.; Tlachi, P.; et al. Prognostic impact of prior heart failure in patients hospitalized with COVID-19. J. Am. Coll. Cardiol. 2020, 76, 2334–2348. [Google Scholar] [CrossRef]
- Damara, F.A.; Muchamad, G.R.; Ikhsani, R.; Syafiyah, A.H.; Bashari, M.H. Thyroid disease and hypothyroidism are associated with poor COVID-19 outcomes: A systematic review, meta-analysis, and meta-regression. Diabetes Metab. Syndr. Clin. Res. Rev. 2021, 15, 102312. [Google Scholar] [CrossRef]
- Gerayeli, F.V.; Milne, S.; Cheung, C.; Li, X.; Yang, C.W.; Tam, A.; Choi, L.H.; Bae, A.; Sin, D.D. COPD and the risk of poor outcomes in COVID-19: A systematic review and meta-analysis. EClin. Med. 2021, 33, 100789. [Google Scholar] [CrossRef]
- Pietrobon, A.J.; Teixeira, F.M.E.; Sato, M.N. Immunosenescence and Inflammaging: Risk Factors of Severe COVID-19 in Older People. Front. Immunol. 2020, 11, 579220. [Google Scholar] [CrossRef]
- Gao, Y.; Cai, G.Y.; Fang, W.; Li, H.Y.; Wang, S.Y.; Chen, L.; Yu, Y.; Liu, D.; Xu, S.; Cui, P.F.; et al. Machine learning based early warning system enables accurate mortality risk prediction for COVID-19. Nat. Commun. 2020, 11, 5033. [Google Scholar] [CrossRef]
- Bertsimas, D.; Lukin, G.; Mingardi, L.; Nohadani, O.; Orfanoudaki, A.; Stellato, B.; Wiberg, H.; Gonzalez-Garcia, S.; Parra-Calderon, C.L.; Robinson, K.; et al. COVID-19 mortality risk assessment: An international multi-center study. PLoS ONE 2020, 15, e0243262. [Google Scholar] [CrossRef]
- Yadaw, A.S.; Li, Y.C.; Bose, S.; Iyengar, R.; Bunyavanich, S.; Pandey, G. Clinical features of COVID-19 mortality: Development and validation of a clinical prediction model. Lancet Digit. Health 2020, 2, e516–e525. [Google Scholar] [CrossRef]
- Du, R.-H.; Liang, L.-R.; Yang, C.-Q. Predictors of mortality for patients with COVID-19 pneumonia caused by SARS-CoV-2: A Prospective Cohort Study. Eur. Respir. J. 2020, 55, 2000524. [Google Scholar] [CrossRef] [PubMed] [Green Version]


| Low Risk (0–1) | Medium Risk (2–3) | High Risk (>4) | OMNIBUS p Value | p-Value (for Post-Hoc Analysis) | |
|---|---|---|---|---|---|
| Variables, Units (N) | Mean ± SD Min–Max (N) or n/N(% of Risk Category) | Mean ± SD Min–Max (N) or n/N (% of Risk Category) | Mean ± SD Min–Max (N) or n/N (% of Risk Category) | ||
| demographics | |||||
| Age, years (1047) | 69.0 ± 2.79 65–74 (376) | 79.0 ± 8.11 65–100 (419) | 80.3 ± 7.26 65–100 (252) | <0.0001 | <0.0001 a,b 0.082 c |
| Male gender (1047) | 211/376 (56.11%) | 172/419 (41.1%) | 123/252 (48.8%) | 0.00012 | <0.0001 a 0.2578 b 0.18001 c |
| BMI, kg/m2 (207) | 28.5 ± 4.59 20.05–40.4 (81) | 28.57 ± 5.17 18.6–47.75 (66) | 27.29 ± 5.39 16.41–45.82 (60) | 0.30822 | N/A |
| Cigarette smoking never/previous/current (1043) | 348/376 (92.55%) 16/376 (4.26%) 12 376 (3.19%) | 377/416 (90.63%) 25/416 (6.01%) 14/416 (3.37%) | 203/251 (80.88%) 32/251 (12.75%) 16/251 (6.37%) | <0.0001 | 1.0 a 0.00014 b 0.00412 c |
| Co-morbidities | |||||
| Hypertension (1047) | 194/376 (51.6%) | 296/419 (70.64%) | 228/252 (90.48%) | <0.0001 | <0.0001 a,b,c |
| DM (1045) | 106/376 (28.2%) | 130/418 (29.7%) | 103/251 (41.0%) | 0.00091 | 1.0 a 0.0018 b 0.00578 c |
| Dyslipidemia (506) | 104/152 (68.42%) | 149/196 (76.02%) | 133/158 (84.18%) | 0.0049 | 0.4353 a 0.0052 b 0.02339 c |
| AF/AFL (1047) | 32/376 (8.51%) | 97/419 (23.15%) | 124/252 (49.2%) | <0.0001 | <0.0001 a,b,c |
| Previous coronary revascularization (1047) | 5/376 (1.33%) | 26/419 (6.21%) | 97/252 (38.5%) | <0.0001 | 0.0023 a <0.0001 b,c |
| Previous MI (1047) | 8/376 (2.13%) | 39/419 (9.31%) | 103/252 (40.9%) | <0.0001 | <0.00011 a <0.0001 b,c |
| HF (1047) | 0/376 (0%) | 32/419 (7.64%) | 180/252 (71.43%) | <0.0001 | <0.0001a,b,c |
| Moderate or severe valvular heart disease or previous valve heart surgery (1047) | 6/376 (1.6%) | 23/419 (5.49%) | 48/252 (19.05%) | <0.0001 | 0.0188 a <0.0001 b,c |
| PAD (1047) | 16/376 (4.26%) | 25/419 (5.97%) | 38/252 (15.05%) | <0.0001 | 1.0 a <0.0001 b 0.00047 c |
| Previous stroke/TIA (1047) | 25/376 (6.65%) | 53/419 (12.65%) | 52/252 (20.63%) | <0.0001 | 0.0196 a <0.0001 b 0.0243 c |
| CKD (1047) | 25/376 (6.65%) | 56/(13.37%) | 82/252 (32.54%) | <0.0001 | 0.00789 a <0.0001 b,c |
| Haemodialysis (1047) | 4/376 (1.06%) | 13/492 (3.1%) | 11/252 (4.37%) | 0.0332 | 0.2464 a 0.0507 b 1.0 c |
| Asthma (1047) | 12/376 (3.19%) | 16/419 (3.82%) | 10/252 (3.97%) | 0.847 | N/A |
| COPD (1047) | 4/376 (1.06%) | 20/419 (4.77%) | 38/252 (15.08%) | <0.0001 | 0.0134 a <0.0001 b,c |
| Thyroid disease, none/hypothyroidism/ hyperthyroidism, (1047) | 363/376 (96.5%) 12/376 (3.19%) 1/376 (0.27%) | 368/419 (87.8%) 44/419 (10.5%) 7/419 (1.67%) | 189/252 (75.0%) 58/252 (23.02%) 5/252 (1.98%) | <0.0001 | <0.0001 a,b 0.000018 c |
| Low Risk (0–1) | Medium Risk (2–3) | High Risk (>4) | OMNIBUS p-Value | p-Value (for Post-Hoc Analysis) | |
|---|---|---|---|---|---|
| Variables, Units (N) | n/N (% of Risk Category) | n/N (% of Risk Category) | n/N (% of Risk Category) | ||
| Treatment applied before hospitalization | |||||
| ACEI (1047) | 66/376 (17.55%) | 96/419 (22.91%) | 106/252 (42.06%) | <0.0001 | 0.2230 a <0.0001 b,c |
| ARBs (1047) | 31/376 (8.24%) | 34/419 (8.11%) | 29/252 (11.51%) | 0.2721 | N/A |
| MRAs (1047) | 9/376 (2.39%) | 26/419 (6.21%) | 43/252 (17.06%) | <0.0001 | 0.04377 a <0.0001 b,c |
| Sacubitril/valsartan (1047) | 1/376 (0.27%) | 3/419 (0.72%) | 1/252 (0.4%) | 0.8502 | N/A |
| β-blocker (1047) | 93/376 (24.73%) | 141/419 (33.65%) | 143/252 (56.75%) | <0.0001 | 0.02232 a <0.0001 b,c |
| Digitalis glycoside (1047) | 3/376 (0.8%) | 5/419 (1.2%) | 10/252 (3.97%) | 0.0129 | 1.0 a 0.0259 b 0.0844 c |
| Calcium channel blocker (non-dihydropiridines) (1047) | 6/376 (1.6%) | 10/419 (2.39%) | 13/252 (5.16%) | 0.0236 | 1.0 a 0.0614 b 0.2718 c |
| Calcium channel blocker (dihydropiridines) (1047) | 44/376 (11.7%) | 69/419 (16.47%) | 69/252 (27.38%) | <0.0001 | <0.0001 a.b 0.00467 c |
| α-adrenergic blocker (1047) | 45/376 (11.9%) | 34/419 (8.11%) | 39/252 (14.2%) | <0.0001 | 0.2065 a <0.0001b 0.0030 c |
| Thiazide or thiazide-like diuretic (1047) | 30/376 (7.97%) | 43/419 (10.26%) | 32/252 (12.7%) | 0.152 | N/A |
| Loop diuretic (1047) | 22/376 (5.85%) | 50/419 (11.93%) | 73/252 (28.97%) | <0.0001 | 0.0127 a <0.0001 b,c |
| Statin (1047) | 59/376 (15.69%) | 106/419 (25.3%) | 113/252 (44.84%) | <0.0001 | 0.0035 a <0.0001 b,c |
| Acetylsalicylic acid (1047) | 40/376 (10.64%) | 79/419 (18.85%) | 72/252 (28.57%) | <0.0001 | 0.005 a <0.0001 b 0.0143 c |
| The second antiplatelet drug-P2Y12 inhibitor (1047) | 3/376 (0.8%) | 6/419 (1.43%) | 20/252 (7.94%) | <0.0001 | 1.0 a <0.0001 b 0.00017 c |
| LMWH (1047) | 30/376 (8.0%) | 35/419 (8.35%) | 24/252 (9.52%) | 0.7856 | N/A |
| VKA (1047) | 4/376 (1.06%) | 13/419 (3.1%) | 21/252 (8.33%) | <0.0001 | 0.2464 a <0.0001b 0.00149 c |
| NOAC (1047) | 9/376 (2.39%) | 33/419 (7.88%) | 49/252 (19.44%) | <0.0001 | 0.003 a <0.0001b, c |
| Insulin (1047) | 30/376 (7.98%) | 23/419 (5.49%) | 32/252 (12.7%) | 0.0041 | 0.6203 a 0.2123 b 0.0049 c |
| Metformin (1047) | 56/376 (14.89%) | 58/419 (13.84%) | 44/252 (17.46%) | 0.4437 | N/A |
| SGLT2 inhibitor (1047) | 3/376 (0.8%) | 5/419 (1.19%) | 9/252 (3.57%) | 0.0274 | 1.0 a 0.0504 b 0.1487 c |
| Oral antidiabetics other than SGLT2 inhibitor and metformin (1047) | 19/376 (5.05%) | 33/419 (7.88) | 24/252 (9.52%) | 0.0874 | N/A |
| Proton pump inhibitor (1047) | 30/376 (8.0%) | 61/419 (14.56%) | 80/252 (31.75%) | <0.0001 | 0.0154 a <0.0001 b,c |
| Oral corticosteroid (1047) | 18/376 (4.79%) | 21/419 (5.01%) | 4/252 (1.59) | 0.068 | N/A |
| Immunosuppression other than oral corticosteroid (1047) | 11/376 (2.93%) | 17/419 (4.06%) | 1/252 (0.37%) | 0.0194 | 1.0 a 0.146 b 0.0284 c |
| Low Risk (0–1) | Medium Risk (2–3) | High Risk (>4) | OMNIBUS p-Value | p-Value (for Post-Hoc Analysis) | |
|---|---|---|---|---|---|
| Variables, Units (N) | Mean ± SD Min–Max (N) or n/N (% of Risk Category) | Mean ± SD Min–Max (N) or n/N (% of Risk Category) | Mean ± SD Min–Max (N) or n/N (% of Risk Category) | ||
| Patient-reported symptoms | |||||
| Cough (1047) | 94/376 (25%) | 105/419 (25.06%) | 64/252 (25.4%) | 0.9931 | N/A |
| Dyspnoea (1047) | 153/376 (40.69%) | 172/419 (41.05) | 135/252 (53.57%) | 0.0019 | 1.0 a 0.0059 b 0.0064 c |
| Chest pain (1047) | 18/376 (4.79%) | 29/419 (6.92%) | 24/252 (9.52%) | 0.068 | N/A |
| Hemoptysis (1047) | 1/376 (0.27%) | 2/419 (0.48%) | 4/252 (1.59%) | 0.15 | N/A |
| Smell dysfunction (1047) | 11/376 (2.93%) | 10/419 (2.29%) | 4/252 (1.59%) | 0.56 | N/A |
| Taste dysfunction (1047) | 9/376 (2.39%) | 9/419 (2.15%) | 6/252 (2.38%) | 0.968 | N/A |
| Abdominal pain (1047) | 25/376 (6.65%) | 23/419 (5.49%) | 16/252 (6.35%) | 0.78 | N/A |
| Diarrhoea (1047) | 29/376 (7.71%) | 29/419 (6.92%) | 17/252 (6.75%) | 0.872 | N/A |
| Nausea and/or vomiting (1047) | 18/376 (4.79%) | 23/419 (5.49%) | 13/252 (5.16%) | 0.905 | N/A |
| Measured vital signs | |||||
| Body temperature °C (522) | 36.98 ± 0.87 35.0–40.0 (189) | 36.89 ± 0.9 35.0–40.0 (203) | 36.94 ± 0.89 35.2–40.0 (130) | 0.572 | N/A |
| Heart rate beats/minute (823) | 86.64 ± 16.72 60–150 (280) | 84.06 ± 16.52 50–160 (325) | 84.75 ± 18.92 36–170 (218) | 0.156 | N/A |
| Respiratory rate breaths/minute (152) | 18.25 ± 6.1 12–50 (52) | 18.79 ± 5.71 12–45 (58) | 19.52 ± 6.33 12–50 (42) | 0.619 | N/A |
| SBP mmHg (832) | 134.92 ± 23.13 60–237 (283) | 134.55 ± 25.87 50–270 (327) | 134.0 ± 24.39 70–210 (222) | 0.912 | N/A |
| DBP mmHg (826) | 78.23 ± 13.8 40–150 (282) | 77.54 ± 13.68 40–157 (322) | 75.54 ± 15.43 40–143 (222) | 0.1197 | N/A |
| SpO2 on room air, % (FiO2 = 21%) (587) | 90.5 ± 7.85 50–100 (194) | 89.2 ± 9.74 50–100 (238) | 90.02 ± 8.48 50–99 (155) | 0.3383 | N/A |
| Abnormalities detected during physical examination | |||||
| Cracles (1047) | 56/376 (14.89%) | 84/419 (20.05%) | 58/252 (23.02%) | 0.029 | 0.21 a 0.0391 b 1.0 c |
| Wheezing (1047) | 35/376 (9.31%) | 51/419 (12.17%) | 61/252 (24.21%) | <0.0001 | 0.071 a <0.0001b 0.00024 c |
| Pulmonary congestion (1047) | 66/376 (17.55%) | 90/419 (21.48%) | 71/252 (28.17%) | 0.0066 | 0.5784 a 0.066 b 0.1831 c |
| Peripheral oedema (1047) | 27/376 (7.18%) | 48/419 (11.46%) | 47/274 (18.65%) | <0.0001 | 0.1581 a <0.0001 b 0.04 c |
| VES-13, points | 0.067 | N/A | |||
| mean ± SD | 4.24 ± 2.99 | 5.58 ± 3.3 | 6.54 ± 2.89 | ||
| min–max | 1–9 | 1–12 | 3–13 | ||
| N = 75 | 17 | 36 | 22 | ||
| GCS, points | 0.305 | N/A | |||
| mean ± SD | 14.57 ± 1.75 | 14.38 ± 1.81 | 14.18 ± 2.27 | ||
| min–max | 3–15 | 3–15 | 3–15 | ||
| N = 402 | 133 | 160 | 109 | ||
| Parameter | Time of Assessment | Units | Low Risk (0–1) | Medium Risk (2–3) | High Risk (>4) | OMNIBUS p-Value | p-Value for Post-Hoc Analysis |
|---|---|---|---|---|---|---|---|
| Mean ± SD Min–Max (N) or n/N (% of Risk Category) (N) | Mean ± SD Min–Max (N) or n/N (% of Risk Category) (N) | Mean ± SD Min–Max (N) or n/N (% of Risk Category) (N) | |||||
| Complete Blood Count (CBC) | |||||||
| Leucocytes (1020) | On admission | 103/µL | 8.8 ± 8.75 0.51–150.93 (364) | 9.55 ± 12.26 0.51–215.97 (410) | 9.37 ± 8.13 1.19–99.73 (246) | 0.5472 | N/A |
| (1020) | On discharge | 9.17 ± 5.97 0.67–53.2 (364) | 10.83 ± 17.42 0.44–314.44 (410) | 10.2 ± 7.38 1.19–58.49 (246) | 0.063 | N/A | |
| Lymphocytes (697) | On admission | 103/µL | 1.17 ± 1.65 0.06–24.82 (237) | 1.16 ± 1.13 0.11–12.1 (278) | 1.44 ± 5.78 0.09–78.58 (182) | 0.8223 | N/A |
| (677) | On discharge | 1.57 ± 1.02 0.06–9.03 (237) | 1.48 ± 1.97 0.05–26.71 (278) | 1.55 ± 5.04 0.14–66.97 (182) | 0.787 | N/A | |
| Haemoglobin (1020) | On admission | g/dL | 13.11 ± 2.12 3.9–18.3 (364) | 12.55 ± 2.33 4.5–18.9 (410) | 11.93 ± 2.49 5.3–18.8 (246) | <0.0001 | 0.001a <0.0001b 0.005 c |
| (1020) | On discharge | 12.5 ± 2.18 7.1–18.3 (364) | 11.91 ± 2.33 4.5–18.9 (410) | 11.56 ± 2.35 5.5–17.6 (246) | <0.0001 | 0.0008 a <0.0001b 0.154 c | |
| Platelets (1020) | On admission | 103/µL | 245.79 ± 110.26 0–671 (364) | 228.85 ± 114.82 3–740 (410) | 216.78 ± 94.0 8–578 (246) | 0.0023 | 0.092 a 0.002 b 0.31 c |
| (1020) | On discharge | 272.04 ± 119.9 6–720 (364) | 241.95 ± 118.27 3–694 (410) | 211.63 ± 97.47 4–592 (246) | <0.0001 | <0.001 a <0.0001b 0.001 c | |
| Acid-base balance in the arterial blood gas | |||||||
| PH (175) | On admission | 7.43 ± 0.08 7.2–7.54 (43) | 7.43 ± 0.07 7.1–7.54 (74) | 7.41 ± 0.08 7.09–7.54 (58) | 0.3236 | N/A | |
| PaO2 (175) | On admission | <60 mmHg respiratory insufficiency | 27/43 (62.79%) | 44/74 (59.46%) | 34/58 (58.62%) | 0.9073 | N/A |
| ≥60 mmHg | 16/43 (37.21%) | 30/74 (40.54%) | 24/58 (41.38%) | ||||
| 76.3 ± 34.37 26.8–100 (43) | 75.46 ± 48.27 28.6–100 (74) | 72.91 ± 36.32 23.7–100 (58) | 0.8821 | N/A | |||
| PaCO2 (175) | On admission | ≥45 mmHg hypercapnia | 7/43 (16.28%) | 8/74 (10.81%) | 10/58 (17.24%) | 0.5265 | N/A |
| <45 mmHg | 36/43 (83.72%) | 66/74 (89.19%) | 48/58 (82.76%) | ||||
| 36.57 ± 8.0 25.2–61.4 (43) | 36.58 ± 8.02 23–67 (74) | 38.9 ± 11.43 19.7–88.4 (58) | 0.3899 | N/A | |||
| HCO3 standard (171) | On admission | mmol/L | 25.05 ± 3.7 12.1–30.7 (42) | 24.47 ± 4.17 14.3–39.5 (71) | 24.43 ± 4.72 13.5–38.6 (58) | 0.6908 | N/A |
| BE (74) | On admission | 1.64 ± 3.08 (–)3.3–7.1 (17) | 2.15 ± 4.88 (–)12.5–15.7 (37) | 2.41 ± 5.55 (–)7.4–14.6 (20) | 0.8345 | N/A | |
| Lactates (157) | On admission | 2.7 ± 2.28 0.7–12.8 (38) | 2.03 ± 0.85 0.5–5.7 (66) | 2.55 ± 1.91 0.6–12.0 (53) | 0.0602 | N/A | |
| Electrolytes. inflammatory and iron biomarkers | |||||||
| Na (1015) | On admission | mmol/L | 137.89 ± 5.16 106–159 (362) | 137.81 ± 7.37 101–175 (407) | 138.1 ± 6.98 108–174 (246) | 0.8784 | N/A |
| K (1018) | On admission | mmol/L | 4.07 ± 0.66 2.0–7.5 (363) | 4.12 ± 0.7 2.4–6.08 (409) | 4.27 ± 0.8 2.53–8.7 (246) | 0.0066 | 0.602 a 0.005 b 0.044 c |
| CRP (1015) | On admission | mg/L | 93.03 ± 91.05 0.32–496.98 (361) | 84.51 ± 88.21 0.29–538.55 (408) | 76.19 ± 80.82 0.4–390.94 (246) | 0.0574 | N/A |
| Procalcitonin (748) | On admission | ng/mL | 1.36 ± 6.32 0.01–61.28 (266) | 2.02 ± 13.06 0.01–196.04 (289) | 1.486.25 0.01–60.77 (193) | 0.7464 | N/A |
| IL-6 (330) | On admission | pg/mL | 66.81 ± 155.27 2–1000 (141) | 41.58 ± 53.49 2–398 (120) | 62.78 ± 98.77 2–421 (69) | 0.0751 | N/A |
| D-dimer (804) | On admission | µg/L | 4.56 ± 13.34 0.18–118.32 (298) | 6.37 ± 16.17 0.2–127.24 (319) | 5.77 ± 17.97 0.22–128.0 (187) | 0.301 | N/A |
| Prothrombin rate (958) | On admission | % | 82.6 ± 15.73 37–128 (343) | 79.43 ± 21.33 7–131 (382) | 70.49 ± 26.47 2–124 (252) | <0.0001 | 0.058 a <0.0001 b,c |
| INR (958) | On admission | >1.5 | 12/344 (3.49%) | 40/381 (10.5%) | 55/233 (23.61%) | <0.0001 | 0.0014 a <0.0001 b,c |
| aPTT (927) | On admission | >60 s | 3/331 (2.11%) | 6/369 (1.63%) | 10/227 (4.41%) | 0.092 | N/A |
| Urea (970) | On admission | mg/dL | 57.13 ± 46.17 8–307 (345) | 67.31 ± 49.77 12–353 (389) | 77.66 ± 52.55 12–369 (236) | <0.0001 | 0.012 a <0.0001b 0.04 c |
| Creatinine (1017) | On admission | mg/dL | 1.3 ± 1.31 0.49–14.77 (361) | 1.42 ± 1.15 0.48–9.56 (410) | 1.75 ± 1.54 0.44–11.3 (246) | 0.0009 | 0.349 a 0.0006 b 0.012 c |
| (1017) | On discharge | 1.16 ± 1.04 0.44–14.82 (361) | 1.39 ± 1.2 0.43–9.09 (410) | 1.59 ± 1.34 0.43–9.27 (246) | <0.0001 | 0.01 a <0.0001b 0.134 c | |
| eGFR (1017) | On admission | ml/min/1.73 m2 | 71.33 ± 27.92 3–170 (361) | 6.29 ± 27.45 4–137 (410) | 52.99 ± 28.95 5–180 (246) | <0.0001 | <0.0001 a,b 0.004 c |
| Total protein (334) | On admission | g/L | 5.99 ± 0.8 3.8–7.7 (100) | 5.87 ± 0.89 3.6–8.2 (123) | 5.73 ± 0.9 3.3–8.2 (111) | 0.0909 | N/A |
| Albumin (363) | On admission | g/L | 3.16 ± 0.54 1.7–4.4 (116) | 3.09 ± 0.55 1.1–4.4 (130) | 2.95 ± 0.62 0.7–4.9 (117) | 0.0191 | 0.528 a 0.014 b 0.151 c |
| AST (740) | On admission | IU/L | 70.12 ± 177.91 5–2405 (257) | 69.44 ± 281.44 7–4776 (290) | 90.01 ± 339.29 8–3866 (193) | 0.7435 | N/A |
| ALT (821) | On admission | IU/L | 55.67 ± 113.23 4–1411 (285) | 49.33 ± 206.01 4–3700 (329) | 54.0 ± 149.9 5–1361 (207) | 0.8911 | N/A |
| Bilirubin (736) | On admission | U/L | 0.91 ± 1.34 0.3–15.1 (257) | 0.83 ± 0.74 0.2–9.2 (296) | 0.88 ± 0.72 0.1–6.6 (183) | 0.6838 | N/A |
| LDH (623) | On admission | U/L | 466.34 ± 561.39 129–7100 (232) | 389.48 ± 191.8 44–1172 (237) | 453.63 ± 768.4 71–9505 (154) | 0.0978 | N/A |
| Cardiac biomarkers | |||||||
| BNP (244) | On admission | pg/mL | 198.97 ± 295.09 1.7–1674 (71) | 411.54 ± 765.61 3–4890.6 (85) | 950.94 ± 2052.17 12.4–13,368.4 (88) | 0.00051 | 0.052 a 0.003 b 0.059 c |
| (244) | On discharge | 187.85 ± 236.76 1.7–1130.8 (71) | 456.81 ± 1251.89 3–10,662.8 (85) | 894.93 ± 1965.08 11.9–13,368.4 (88) | 0.00104 | 0.133 a 0.003 b 0.188 c | |
| NT-proBNP (239) | On admission | ng/mL | 2647.61 ± 91,184.03 12–70,000 (63) | 8356.29 ± 14,376.9 49.6–70,000 (87) | 13,371.9 ± 18,707.7 119.6–70,000 (89) | <0.0001 | 0.01a <0.0001 b 0.116 c |
| (239) | On discharge | 2591.46 ± 6818.7 12–35,000 (63) | 9044.29 ± 15,277.1 49.6–70,000 (87) | 12,370.9 ± 16,896.4 119.6–70,000 (89) | <0.0001 | 0.002 a <0.0001 b 0.359 c | |
| Troponin T normal value: F ≤ 15.6 pg/mL M ≤ 34.2 pg/mL (665) | On admission | pg/mL | 171.38 ± 899.58 0.2–11,398.7 (228) | 1968.15 ± 12,515.9 2.0–125,593 (263) | 658.56 ± 2437.77 3.3–21,022.9 (174) | 0.0037 | 0.055 a 0.034 b 0.226 c |
| Troponin T (665) | On discharge | 152.13 ± 890.6 0.2–12,391.6 (228) | 1490.76 ± 9509.94 1.5–109,360 (263) | 664.38 ± 2887.8 1.8–29,828.3 (174) | 0.0074 | 0.062 a 0.064 b 0.385 c | |
| LDL-cholesterol. (268) | On admission | mg/dL | 87.7 ± 40.22 6–205 (80) | 89.79 ± 41.8 23–230 (106) | 75.59 ± 42.83 14–210 (82) | 0.0554 | N/A |
| Hormones | |||||||
| TSH (474) | On admission | mIU/L | 1.35 ± 1.52 0.07–14.08 (149) | 1.35 ± 1.69 0.01–12.1 (188) | 2.24 ± 4.09 0–38.24 (137) | 0.049 | 1.0 a 0.045 b 0.046 c |
| fT4 n (194) | On admission | pmol/L | 12.78 ± 2.27 6.68–19.05 (58) | 13.03 ± 3.4 7.56–36.6 (79) | 13.48 ± 4.17 7.87–35.46 (57) | 0.5257 | N/A |
| fT3 (176) | On admission | pmol/L | 2.08 ± 0.63 1.2–4.01 (57) | 1.88 ± 0.77 0.95–4.45 (71) | 1.93 ± 0.97 0.95–6.85 (48) | 0.2684 | N/A |
| Variables. Units (N) | Low Risk (0–1) | Medium Risk (2–3) | High Risk (>4) | OMNIBUS p Value | p Value (for Post-Hoc Analysis) |
|---|---|---|---|---|---|
| n/N (% of Risk Category) | n/N (% of Risk Category) | n/N (% of Risk Category) | |||
| Applied treatment and procedures | |||||
| Systemic corticosteroid (1047) | 212/376 (56.38%) | 211/419 (50.36%) | 129/252 (51.19%) | 0.2021 | N/A |
| Convalescent plasma (1047) | 56/376 (14.89%) | 32/419 (7.64%) | 27/252 (10.71%) | 0.0048 | 0.005 a 0.48885 b 0.6648 c |
| Tocilizumab (1047) | 6/376 (1.6%) | 2/419 (0.48%) | 1/252 (0.4%) | 0.2223 | N/A |
| Remdesivir (1047) | 68/376 (18.09%) | 59/419 (14.08%) | 32/252 (12.7%) | 0.1312 | N/A |
| Antibiotic (1047) | 230/376 (61.17%) | 264/419 (63.01%) | 175/252 (69.44%) | 0.09451 | N/A |
| Low Risk (0–1) | Medium Risk (2–3) | High Risk (>4) | OMNIBUS p-Value | p-Value (for Post-Hoc Analysis) | |
|---|---|---|---|---|---|
| Variables, Units (N) | Mean ± SD Min–Max (N) or n/N (% of Risk Category) | Mean ± SD Min–Max (N) or n/N (% of Risk Category) | Mean ± SD Min–Max (N) or n/N (% of Risk Category) | ||
| Applied treatment and procedures | |||||
| The most advanced respiratory support applied during the hospitalization (1047) | |||||
| no oxygen high flow nasal cannula (non-invasive ventilation) invasive ventilation | 159/376 (42.29%) 21/376 (5.59%) 47/376 (12.5%) | 168/418 (40.19%) 36/418 (8.61%) 41/418 (9.81%) | 86/252(34.13%) 22/252 (8.73%) 19/252 (7.54%) | 0.0415 | 0.9925 a 0.0188 b 0.6137 c |
| Oxygenation parameters from the period of qualification for advanced respiratory support: | |||||
| SpO2 (284) Respiratory rate, breaths/minute (62) | 87.35 ± 9.89 50–99 (86) 25.64 ± 6.96 14–40 (14) | 86.19 ± 9.79 55–99 (116) 30.11 ± 14.0 13–66 (27) | 85.53 ± 9.86 59–99 (82) 29.52 ± 13.19 14–72 (21) | 0.4815 0.3147 | N/A |
| Duration of mechanical ventilation, days (616) | 1.89 ± 5.52 0–39 (222) | 1.4 ± 5.18 0–51 (240) | 1.14 ± 4.07 0–29 (154) | 0.3134 | N/A |
| Therapy with catecholamines (1047) | 44/376 (11.7%) | 36/419 (8.6%) | 37/252 (14.7%) | 0.0486 | 0.5433 a 0.9949 b 0.0601 c |
| Coronary angiography (1047) | 5/376 (1.3%) | 10/419 (2.4%) | 7/252 (2.8%) | 0.4036 | N/A |
| Coronary revascularization (1047) | 4/376 (1.1%) | 9/419 (2.1%) | 6/252 (2.4%) | 0.3893 | N/A |
| Hemodialysis (1047) | 16/376 (4.3%) | 11/419 (2.6%) | 11/252 (4.7%) | 0.3644 | N/A |
| Low Risk (0–1) | Medium Risk (2–3) | High Risk (>4) | |||
|---|---|---|---|---|---|
| Variables, Units (N) | Mean ± SD Min–Max (N) or n/N (% of Risk Category) | Mean ± SD Min–Max (N) or n/N (% of Risk Category) | Mean ± SD Min–Max (N) or n/N (% of Risk Category) | OMNIBUS p-Value | p-Value (for Post-Hoc Analysis) |
| All-cause mortality rate | |||||
| In-hospital mortality (1047) | 54/376 (14.4%) | 101/419 (24.1%) | 90/252 (35.7%) | <0.0001 | 0.00223 a <0.0001 b 0.005 c |
| 3-month mortality (1047) | 97/376 (25.8%) | 182/419 (43.4%) | 137/252 (54.4%) | <0.0001 | <0.0001 a, b 0.023 c |
| 6-month mortality (810) | 102/260 (39.2%) | 190/330 (57.6%) | 145/220 (65.9%) | <0.0001 | <0.0001 a, b 0.1832 c |
| Total Death | |||
|---|---|---|---|
| Overall | HR | 95%CI | p-Value |
| 1.21 | NA | NA | |
| Risk strata | |||
| Low risk vs. Medium risk | 1.94 | 1.531–2.467 | <0.0001 |
| Low risk vs. High risk | 2.70 | 2.104–3.473 | <0.0001 |
| Component | HR | CI min. | CI max. | p-Value | |
|---|---|---|---|---|---|
| All-cause mortality | Coronary artery disease | 1.457 | 1.143 | 1.856 | 0.0023 |
| COPD | 1.128 | 0.787 | 1.615 | 0.5118 | |
| Age > 75 | 1.852 | 1.528 | 2.243 | < 0.0001 | |
| Thyroid disease | 0.781 | 0.579 | 1.052 | 0.1041 | |
| Hypertension | 0.867 | 0.706 | 1.065 | 0.1738 | |
| HFrEF | 1.412 | 1.117 | 1.783 | 0.0038 |
| h2 | h3 | h4 | h5 | h6 | h7 | h8 | |
|---|---|---|---|---|---|---|---|
| m1 | 54.9289 | 45.309 | 36.9829 | 22.3874 | 19.5331 | 4.391 | |
| m2 | 55.5515 | 64.8647 | 62.9116 | 55.5126 | 54.8399 | 7.4052 | |
| m3 | 43.3222 | 40.8103 | 33.8943 | 33.4495 | 5.7835 | ||
| m4 | 36.9734 | 36.2196 | 36.2402 | 5.9926 | |||
| m5 | 25.3749 | 24.3364 | 4.862 | ||||
| m6 | 5.0713 | 2.2214 | |||||
| m7 | 0.7235 |
| Low Risk (0–1) | Medium Risk (2–3) | High Risk (>4) | OasMNIBUS p-Value | p-Value (for Post-Hoc Analysis) | |
|---|---|---|---|---|---|
| Variables, Units (N) | Mean ± SD Min–Max (N) or n/N (% of Risk Category) | Mean ± SD Min–Max (N) or n/N (% of Risk Category) | Mean ± SD Min–Max (N) or n/N (% of Risk Category) | ||
| Hospitalization | |||||
| Duration of hospitalization,days (1047) | 13.45 ± 115.35 1–131 (376) | 13.13 ± 13.98 1–124 (419) | 15.79 ± 15.77 1–121 (252) | 0.07693 | N/A |
| Admission at ICU (1047) | 46/376 (12.2%) | 32/419 (7.6%) | 24/252 (9.5%) | 0.0916 | N/A |
| End of hospitalization (1047) | |||||
| death discharge home–full recovery transfer to another hospital–worsening transfer to another hospital–in recovery | 54/376 (14.4%) 210/376 (55.9%) 57/376 (15.2%) 55/376 (14.6%) | 101/419 (24.1%) 176/419 (42.0%) 87/419 (20.8%) 55/419 (13.1%) | 90/252 (36.6%) 92/252 (36.6%) 44/252 (17.5%) 26/252 (10.3%) | <0.0001 | 0.000283 a <0.0001 b 0.04329 c |
| Clinical events | |||||
| Aborted cardiac arrest (1047) | 9/376 (2.4%) | 1/419 (0.2%) | 5/252 (2.0%) | 0.0127 | 0.0242 a 1.0 b 0.0906 c |
| Shock (1047) hypovolemic shock cardiogenic shock septic shock | 39/376 (10.4%) 9/376 (2.4%) 0/376 (0%) 31/376 (8.2%) | 37/419 (8.8%) 6/419 (1.4%) 9/419 (2.2%) 25/419 (6.0%) | 29/252 (11.6%) 5/252 (2.0%) 13/252 (5.2%) 19/252 (7.5%) | 0.515 0.6274 <0.0001 0.4454 | N/A N/A 0.0349 a <0.0001 b 0.1734 c N/A |
| Venous thromboembolic disease (1047) | 28/376 (7.5%) | 28/419 (6.7%) | 15/252 (0.8%) | 0.7619 | N/A |
| Pulmonary embolism (1047) | 24/376 (6.4%) | 25/419 (6.0%) | 13/252 (6.0%) | 0.972 | N/A |
| Deep vein thrombosis (1047) | 1/376 (0.3%) | 1/419 (0.2%) | 0/252 (0.0%) | ||
| MI (1047) | 4/376 (1.1%) | 9/419 (2.2%) | 7/252 (2.8%) | 0.2629 | N/A |
| Acute HF (1047) | 3/376 (0.8%) | 14/419 (3.3%) | 44/252 (17.5) | <0.0001 | 0.0773 a <0.0001 b,c |
| Stroke/TIA (1047) | 6/376 (1.6%) | 16/419 (3.8%) | 7/252 (2.8%) | 0.1623 | N/A |
| Pneumonia (1047) | 224/376 (59.6%) | 264/419 (63.0%) | 168/252 (66.7%) | 0.1939 | N/A |
| SIRS (1040) | 37/373 (9.9%) | 38/416 (9.1%) | 33/251 (13.1%) | 0.2412 | N/A |
| Sepsis (405) | 2/137 (1.5%) | 7/153 (4.6%) | 6/115 (5.2%) | 0.1866 | N/A |
| Acute kidney injury (1047) | 37/376 (9.8%) | 59/419 (14.1%) | 53/252 (21.0%) | 0.000432 | 0.2546 a 0.000422 b 0.0769 c |
| Acute liver dysfunction (981) | 7/352 (2.0%) | 17/398 (4.3%) | 13/231 (5.6%) | 0.0623 | N/A |
| MODS (1047) | 6/376 (1.6%) | 5/419 (1.2%) | 6/252 (2.4%) | 0.4735 | N/A |
| LA (157) | 5/38 (13.2%) | 5/66 (7.6%) | 6/53 (11.3%) | 0.6287 | N/A |
| Hyperlactaemia (157) | 28/38 (73.7%) | 43/66 (65.2%) | 32/53 (60.4%) | 0.4174 | N/A |
| Bleedings (1047) | 19/376 (5.2%) | 21/419 (5.2%) | 22/252 (8.7%) | 0.09539 | N/A |
| Intracranial bleeding (1047) | 2/376 (0.5%) | 8/419 (1.9%) | 1/252 (0.4%) | 0.1166 | N/A |
| Respiratory tract bleeding (1047) | 6/376 (1.6%) | 2/419 (0.5%) | 6/252 (2.4%) | 0.0833 | N/A |
| Gastrointestinal tract bleeding (1047) | 9/376 (2.4%) | 8/419 (1.9%) | 10/252 (4.0%) | 0.2667 | |
| Urinary tract bleeding (1047) | 3/1418 (0.8%) | 4/492 (1.0%) | 5/252 (2.0%) | 0.4017 | N/A |
| CLINICAL EVENT | AUC | SENSITIVITY | SPECIFICITY |
|---|---|---|---|
| End of hospitalization–full recovery | 0.584 | 0.439 | 0.708 |
| End of hospitalization–deterioration | 0.511 | 0.697 | 0.371 |
| End of hospitalization–rehabilitation | 0.459 | 0.015 | 0.986 |
| End of hospitalization–death | 0.633 | 0.616 | 0.580 |
| All-cause shock | 0.521 | 0.914 | 0.156 |
| Hypovolemic shock | 0.477 | 0.900 | 0.149 |
| Cardiogenic shock | 0.774 | 1.000 | 0.367 |
| Septic shock | 0.498 | 0.920 | 0.154 |
| Pulmonary embolism | 0.491 | 0.087 | 0.941 |
| Deep vein thrombosis | 0.463 | 0.222 | 0.940 |
| Venous thromboembolic disease | 0.487 | 0.085 | 0.941 |
| Myocardial infarction | 0.609 | 0.650 | 0.537 |
| Myocardial injury | 0.612 | 0.769 | 0.396 |
| Acute heart failure | 0.824 | 0.721 | 0.789 |
| Stroke/TIA | 0.582 | 0.655 | 0.539 |
| SIRS | 0.531 | 0.537 | 0.539 |
| Sepsis | 0.655 | 0.800 | 0.495 |
| Acute kidney injury | 0.605 | 0.624 | 0.560 |
| Acute liver dysfunction | 0.626 | 0.811 | 0.365 |
| MODS | 0.577 | 0.647 | 0.537 |
| All bleedings | 0.579 | 0.354 | 0.766 |
| Intracranial bleeding | 0.581 | 0.727 | 0.537 |
| Respiratory tract bleeding | 0.556 | 0.428 | 0.762 |
| Upper-GI-tract bleeding | 0.583 | 0.300 | 0.873 |
| Lower-GI-tract-bleeding | 0.529 | 0.571 | 0.642 |
| Urinary tract bleeding | 0.619 | 0.416 | 0.873 |
| Pneumonia | 0.543 | 0.489 | 0.5729 |
Publisher’s Note: MDPI stays neutral with regard to jurisdictional claims in published maps and institutional affiliations. |
© 2022 by the authors. Licensee MDPI, Basel, Switzerland. This article is an open access article distributed under the terms and conditions of the Creative Commons Attribution (CC BY) license (https://creativecommons.org/licenses/by/4.0/).
Share and Cite
Rola, P.; Doroszko, A.; Trocha, M.; Giniewicz, K.; Kujawa, K.; Skarupski, M.; Gawryś, J.; Matys, T.; Szahidewicz-Krupska, E.; Gajecki, D.; et al. Mortality Predictive Value of the C2HEST Score in Elderly Subjects with COVID-19—A Subanalysis of the COLOS Study. J. Clin. Med. 2022, 11, 992. https://doi.org/10.3390/jcm11040992
Rola P, Doroszko A, Trocha M, Giniewicz K, Kujawa K, Skarupski M, Gawryś J, Matys T, Szahidewicz-Krupska E, Gajecki D, et al. Mortality Predictive Value of the C2HEST Score in Elderly Subjects with COVID-19—A Subanalysis of the COLOS Study. Journal of Clinical Medicine. 2022; 11(4):992. https://doi.org/10.3390/jcm11040992
Chicago/Turabian StyleRola, Piotr, Adrian Doroszko, Małgorzata Trocha, Katarzyna Giniewicz, Krzysztof Kujawa, Marek Skarupski, Jakub Gawryś, Tomasz Matys, Ewa Szahidewicz-Krupska, Damian Gajecki, and et al. 2022. "Mortality Predictive Value of the C2HEST Score in Elderly Subjects with COVID-19—A Subanalysis of the COLOS Study" Journal of Clinical Medicine 11, no. 4: 992. https://doi.org/10.3390/jcm11040992
APA StyleRola, P., Doroszko, A., Trocha, M., Giniewicz, K., Kujawa, K., Skarupski, M., Gawryś, J., Matys, T., Szahidewicz-Krupska, E., Gajecki, D., Adamik, B., Kaliszewski, K., Kilis-Pstrusinska, K., Letachowicz, K., Matera-Witkiewicz, A., Pomorski, M., Protasiewicz, M., Majchrzak, K., Sokołowski, J., ... Madziarska, K. (2022). Mortality Predictive Value of the C2HEST Score in Elderly Subjects with COVID-19—A Subanalysis of the COLOS Study. Journal of Clinical Medicine, 11(4), 992. https://doi.org/10.3390/jcm11040992