
Machine Learning for Screening Microvascular Complications in Type 2 Diabetic Patients Using Demographic, Clinical, and Laboratory Profiles

 , , , ,
Abstract
:1. Introduction
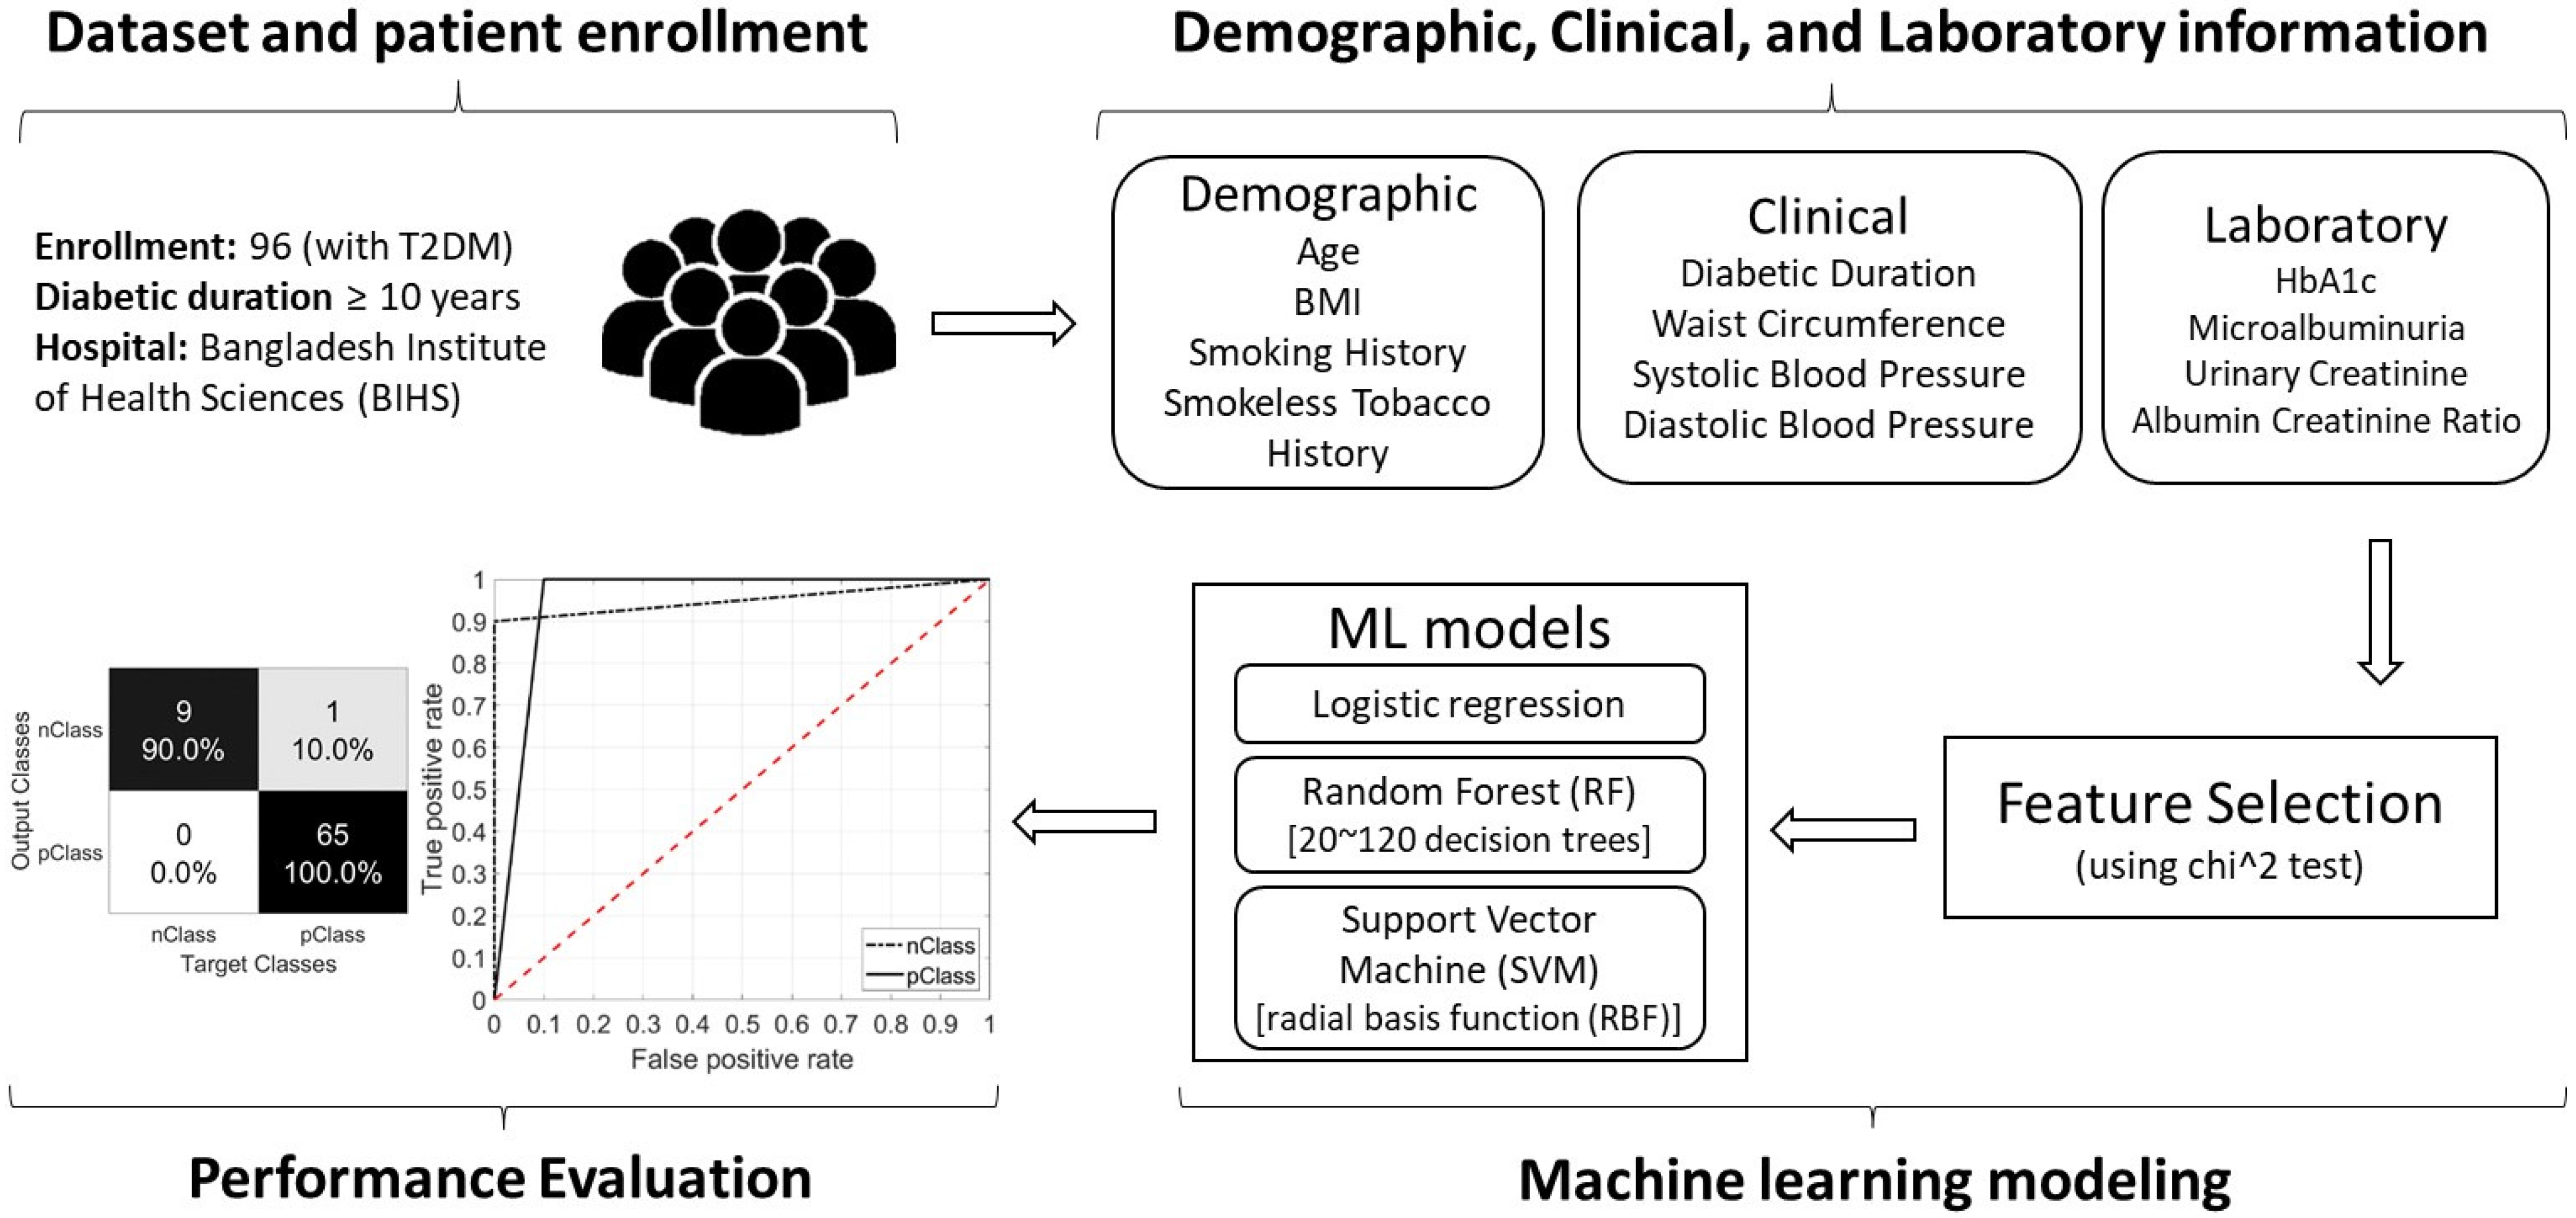
2. Materials and Methods
2.1. Study Type
2.2. Inclusion and Exclusion Criteria
2.3. Participants and Complications
2.4. Types of Variables
2.4.1. Demographic and Clinical Variables
2.4.2. Laboratory Data
2.5. Machine Learning Modeling
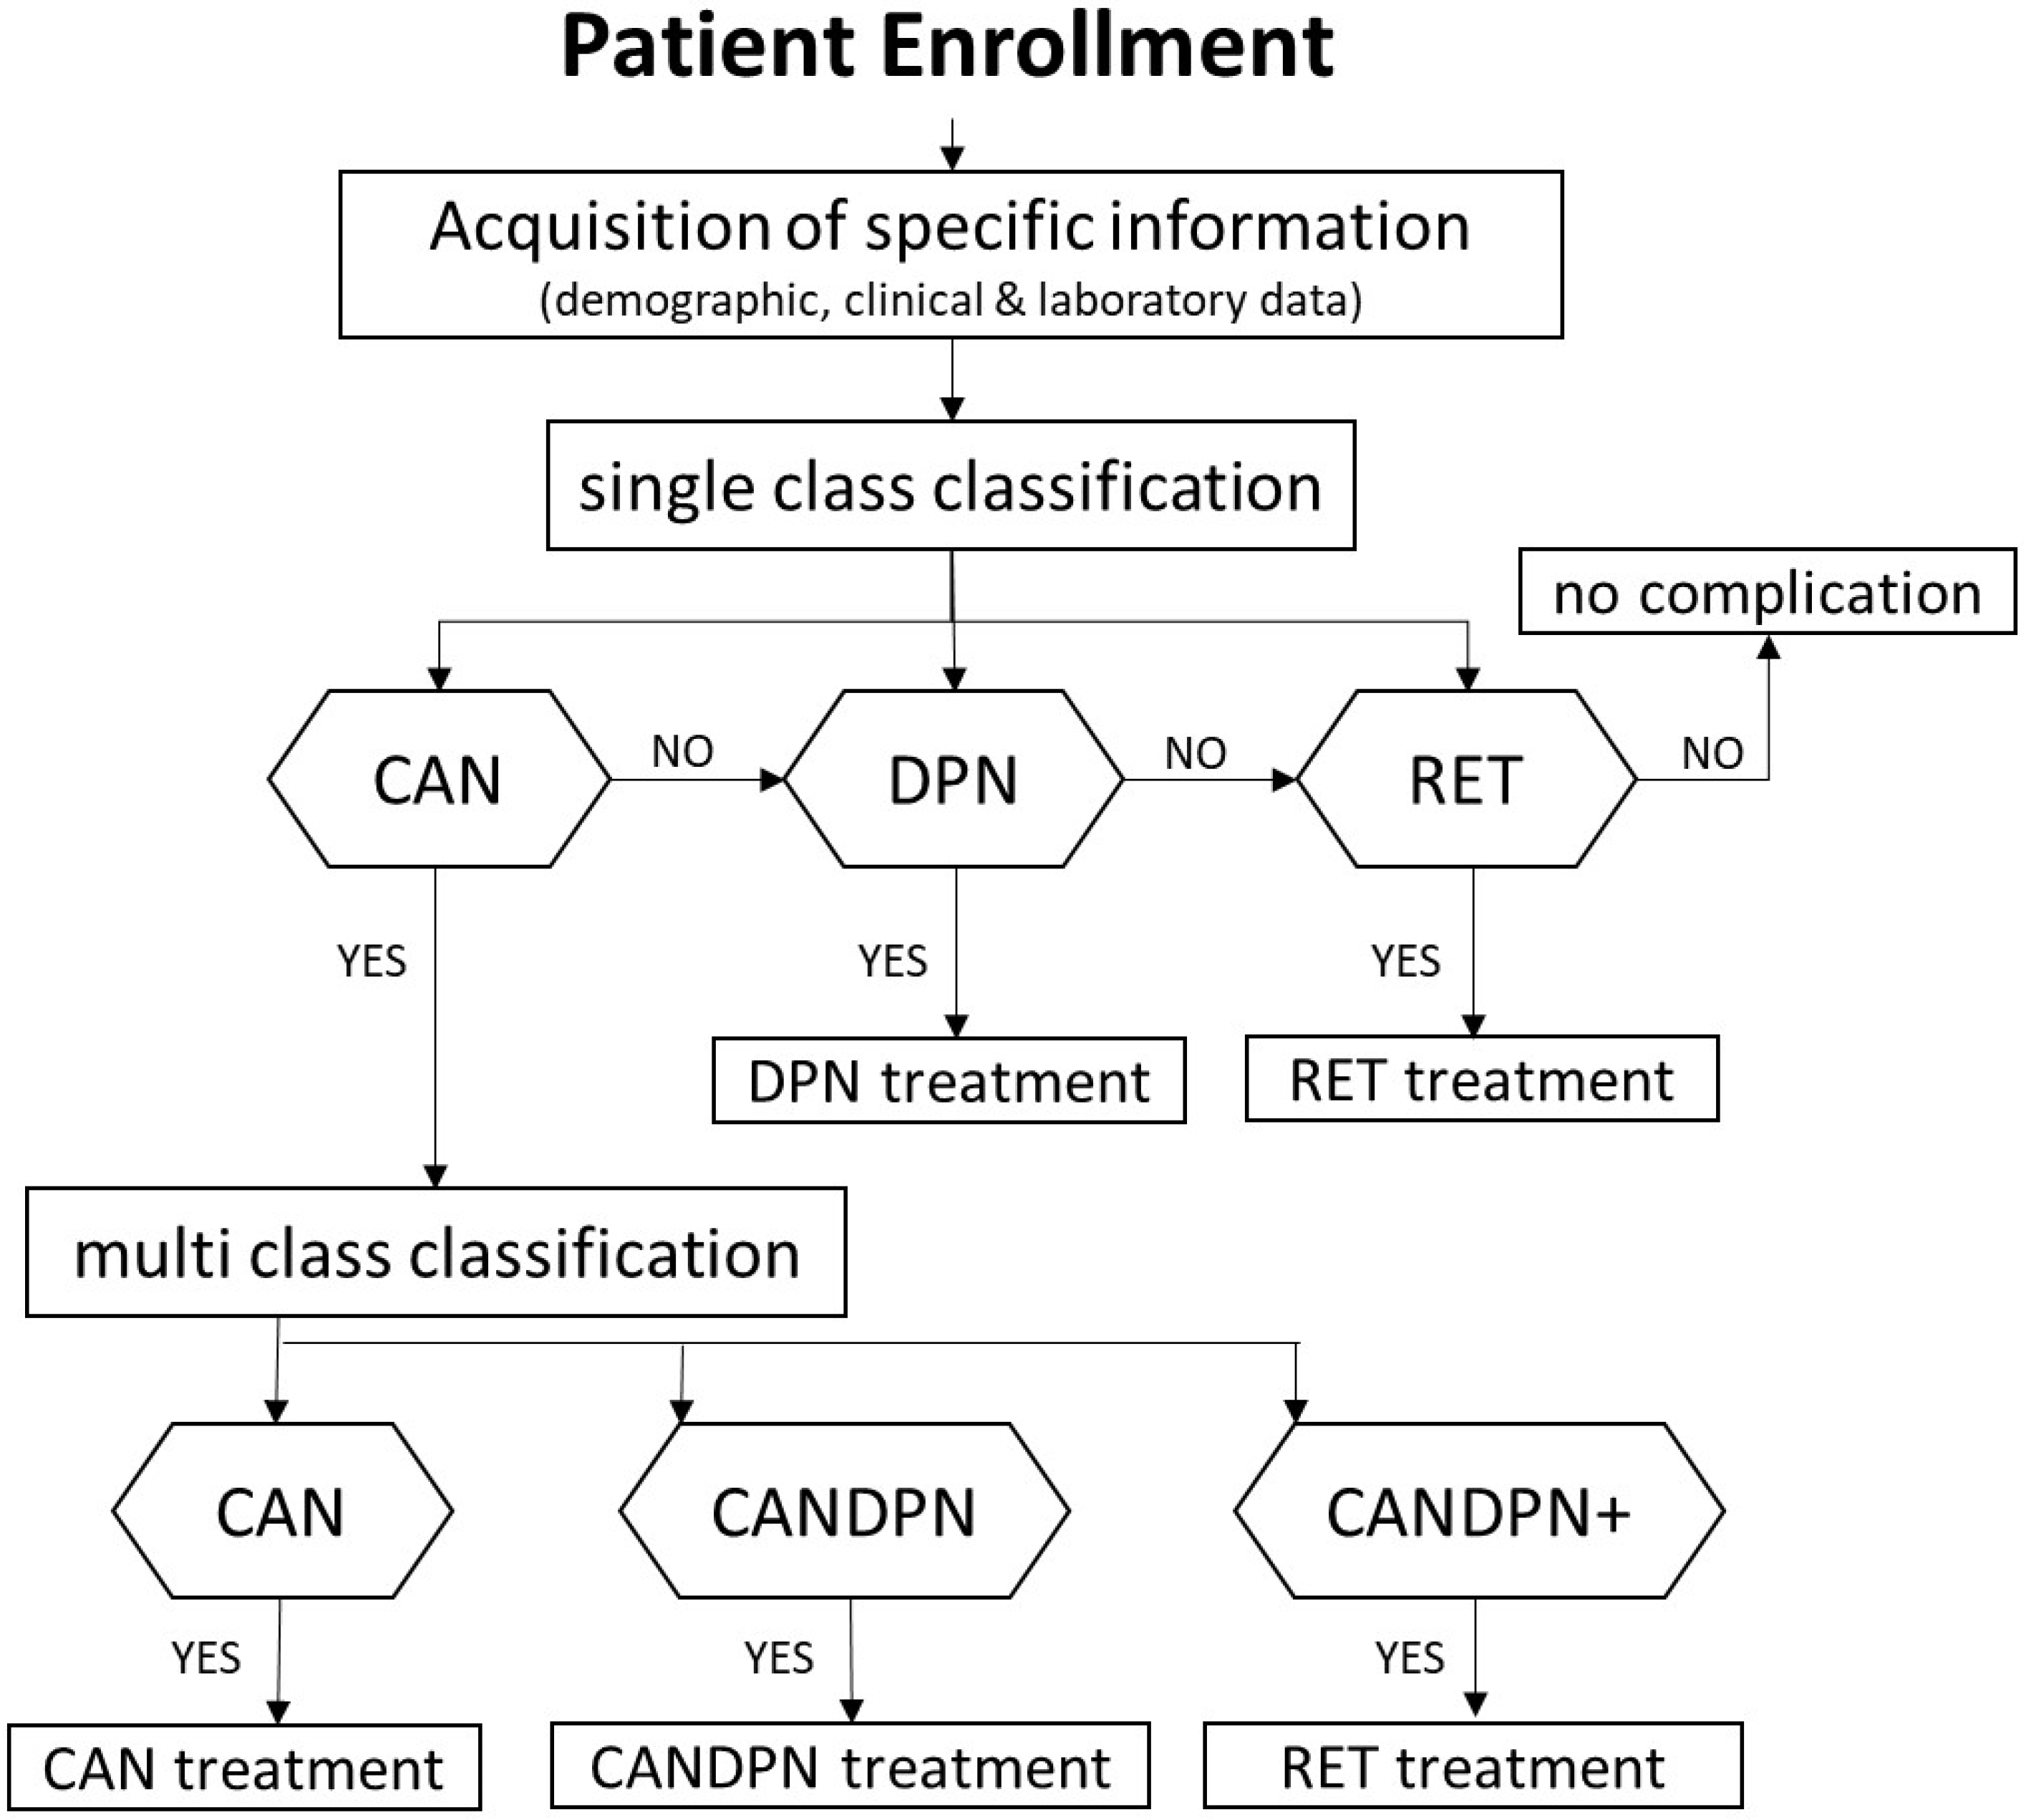
2.5.1. Clinical Testing Approach
2.5.2. Analysis of the Demographic Clinical and Laboratory Profiles
2.5.3. Support Vector Machine (SVM)
2.5.4. Random Forest (RF)
2.5.5. Logistic Regression
2.5.6. Training and Testing
2.5.7. Parameter Optimization
3. Results
3.1. Demographic, Clinical, and Laboratory Profiles
3.2. Complications of Type 2 Diabetes
3.3. Classification of Cardiac-Related Microvascular Complications
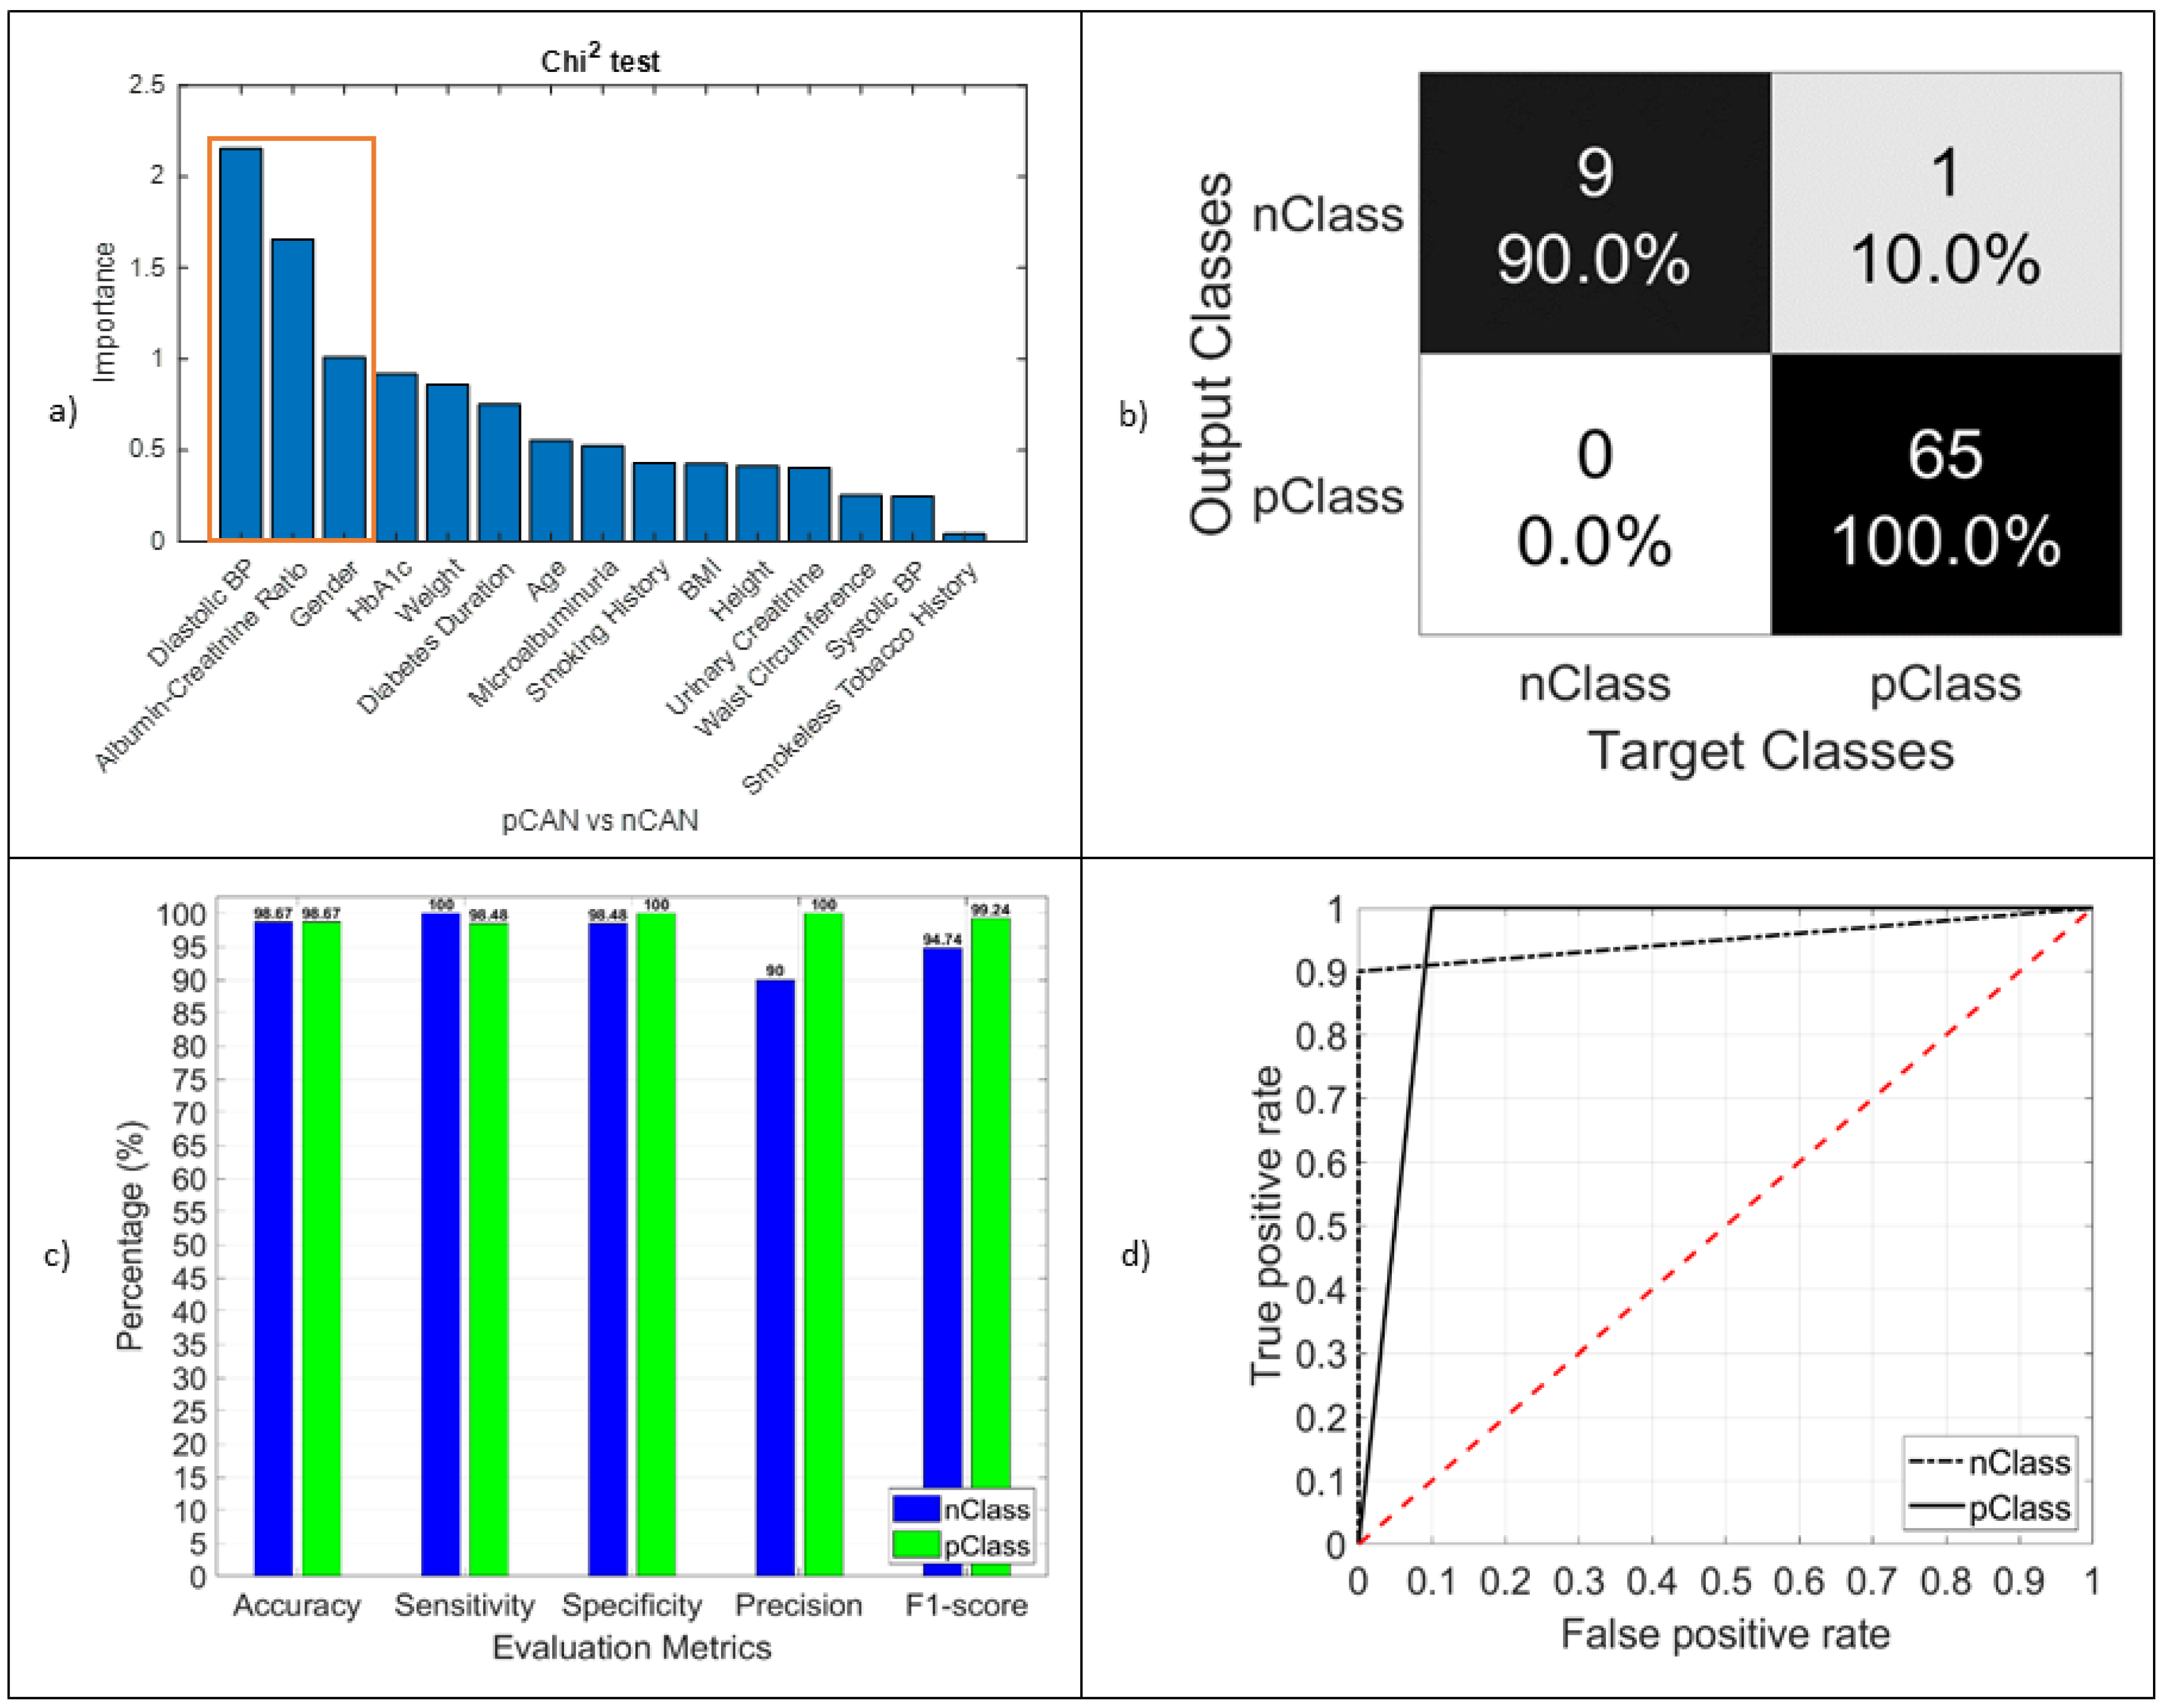
3.3.1. CAN
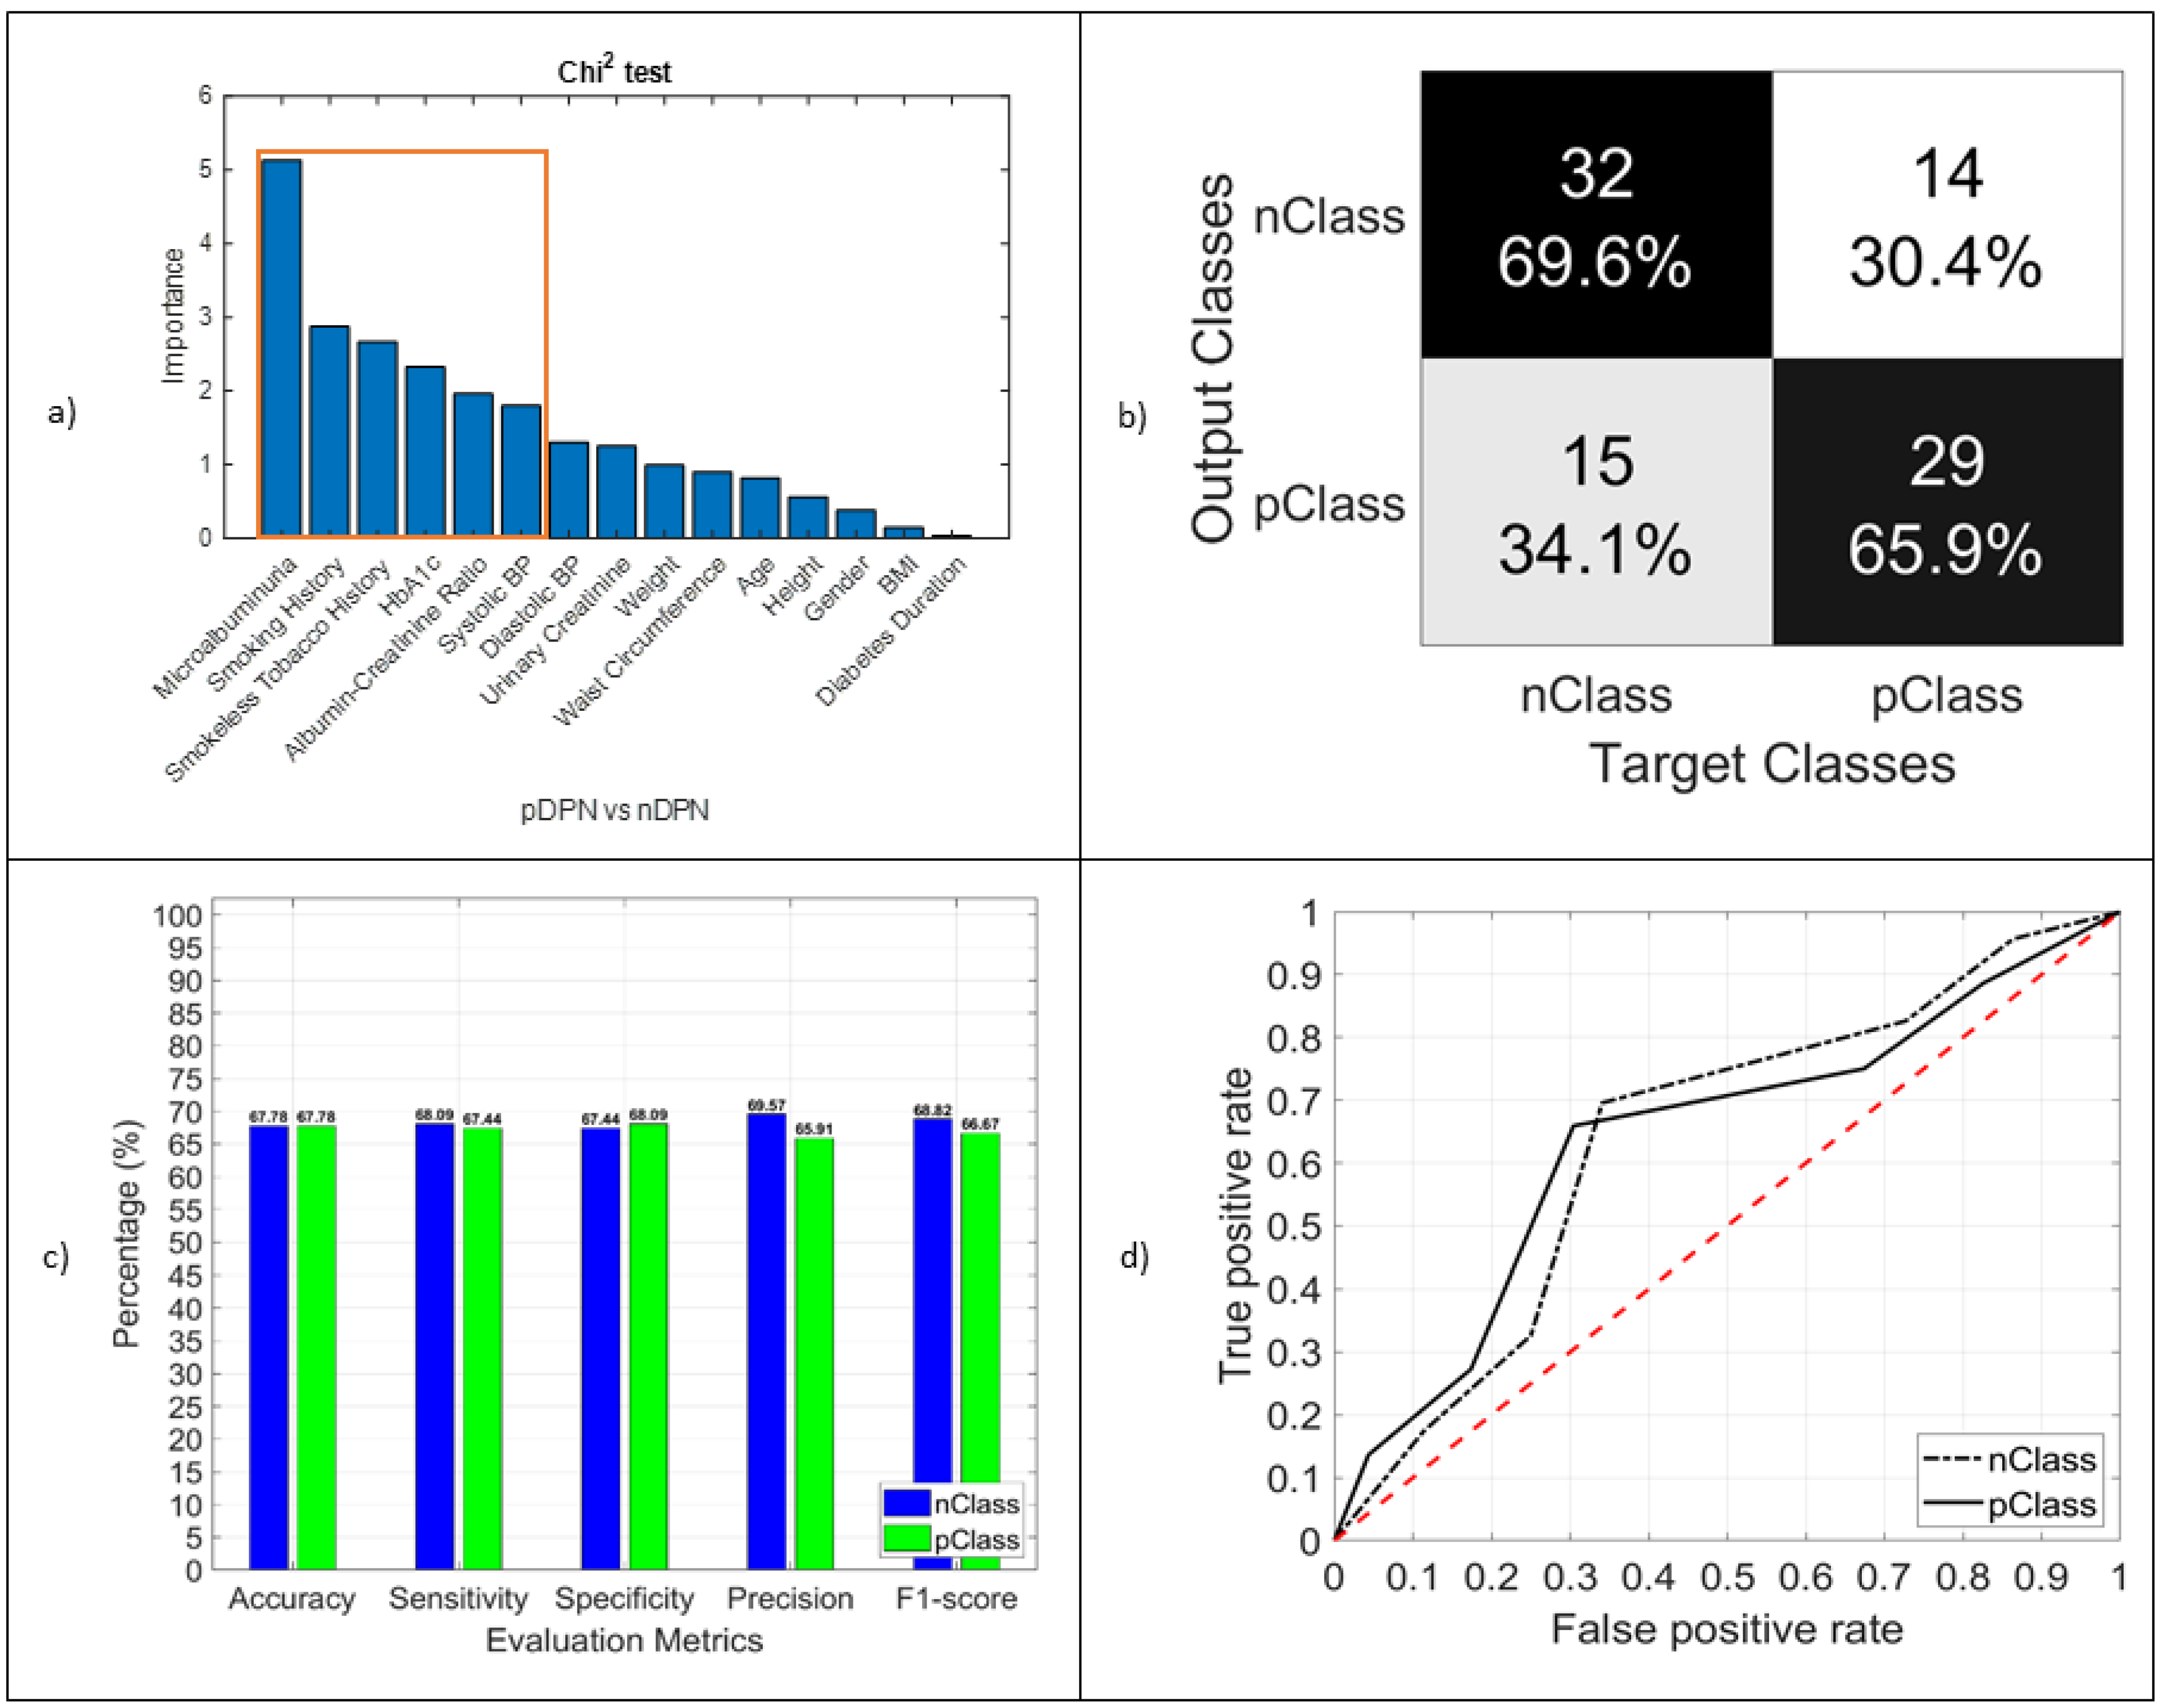
3.3.2. DPN
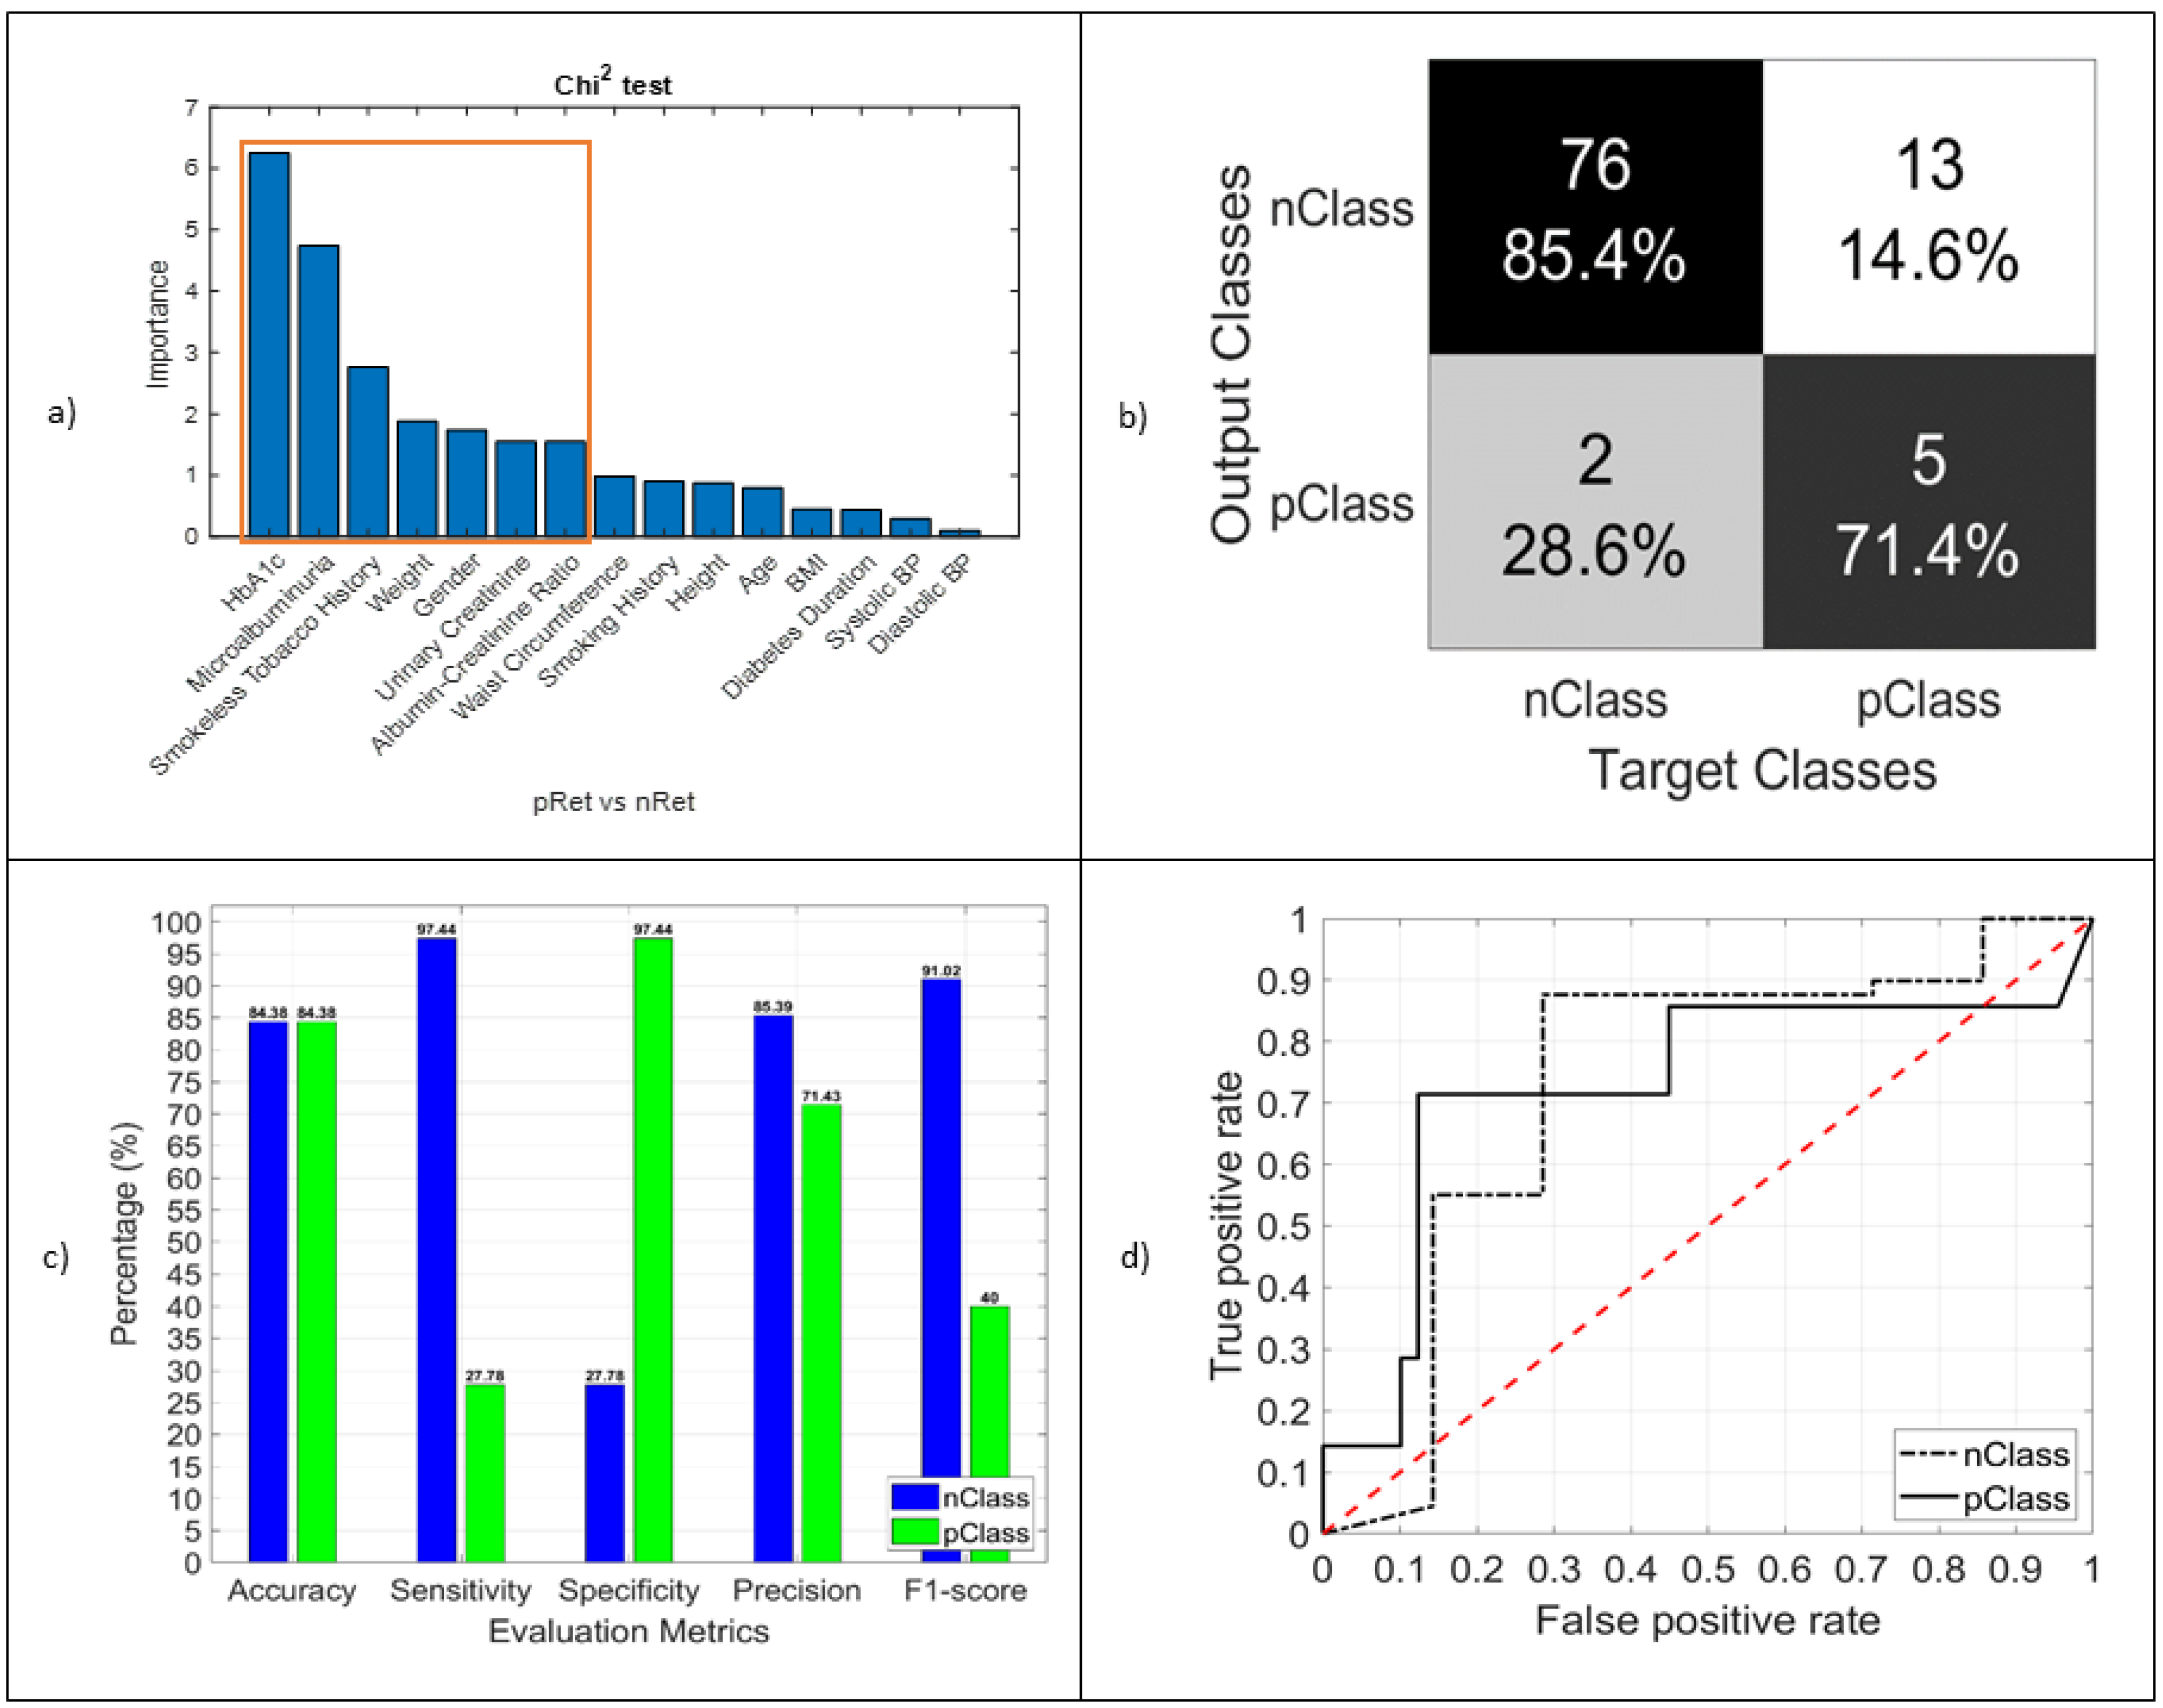
3.3.3. RET
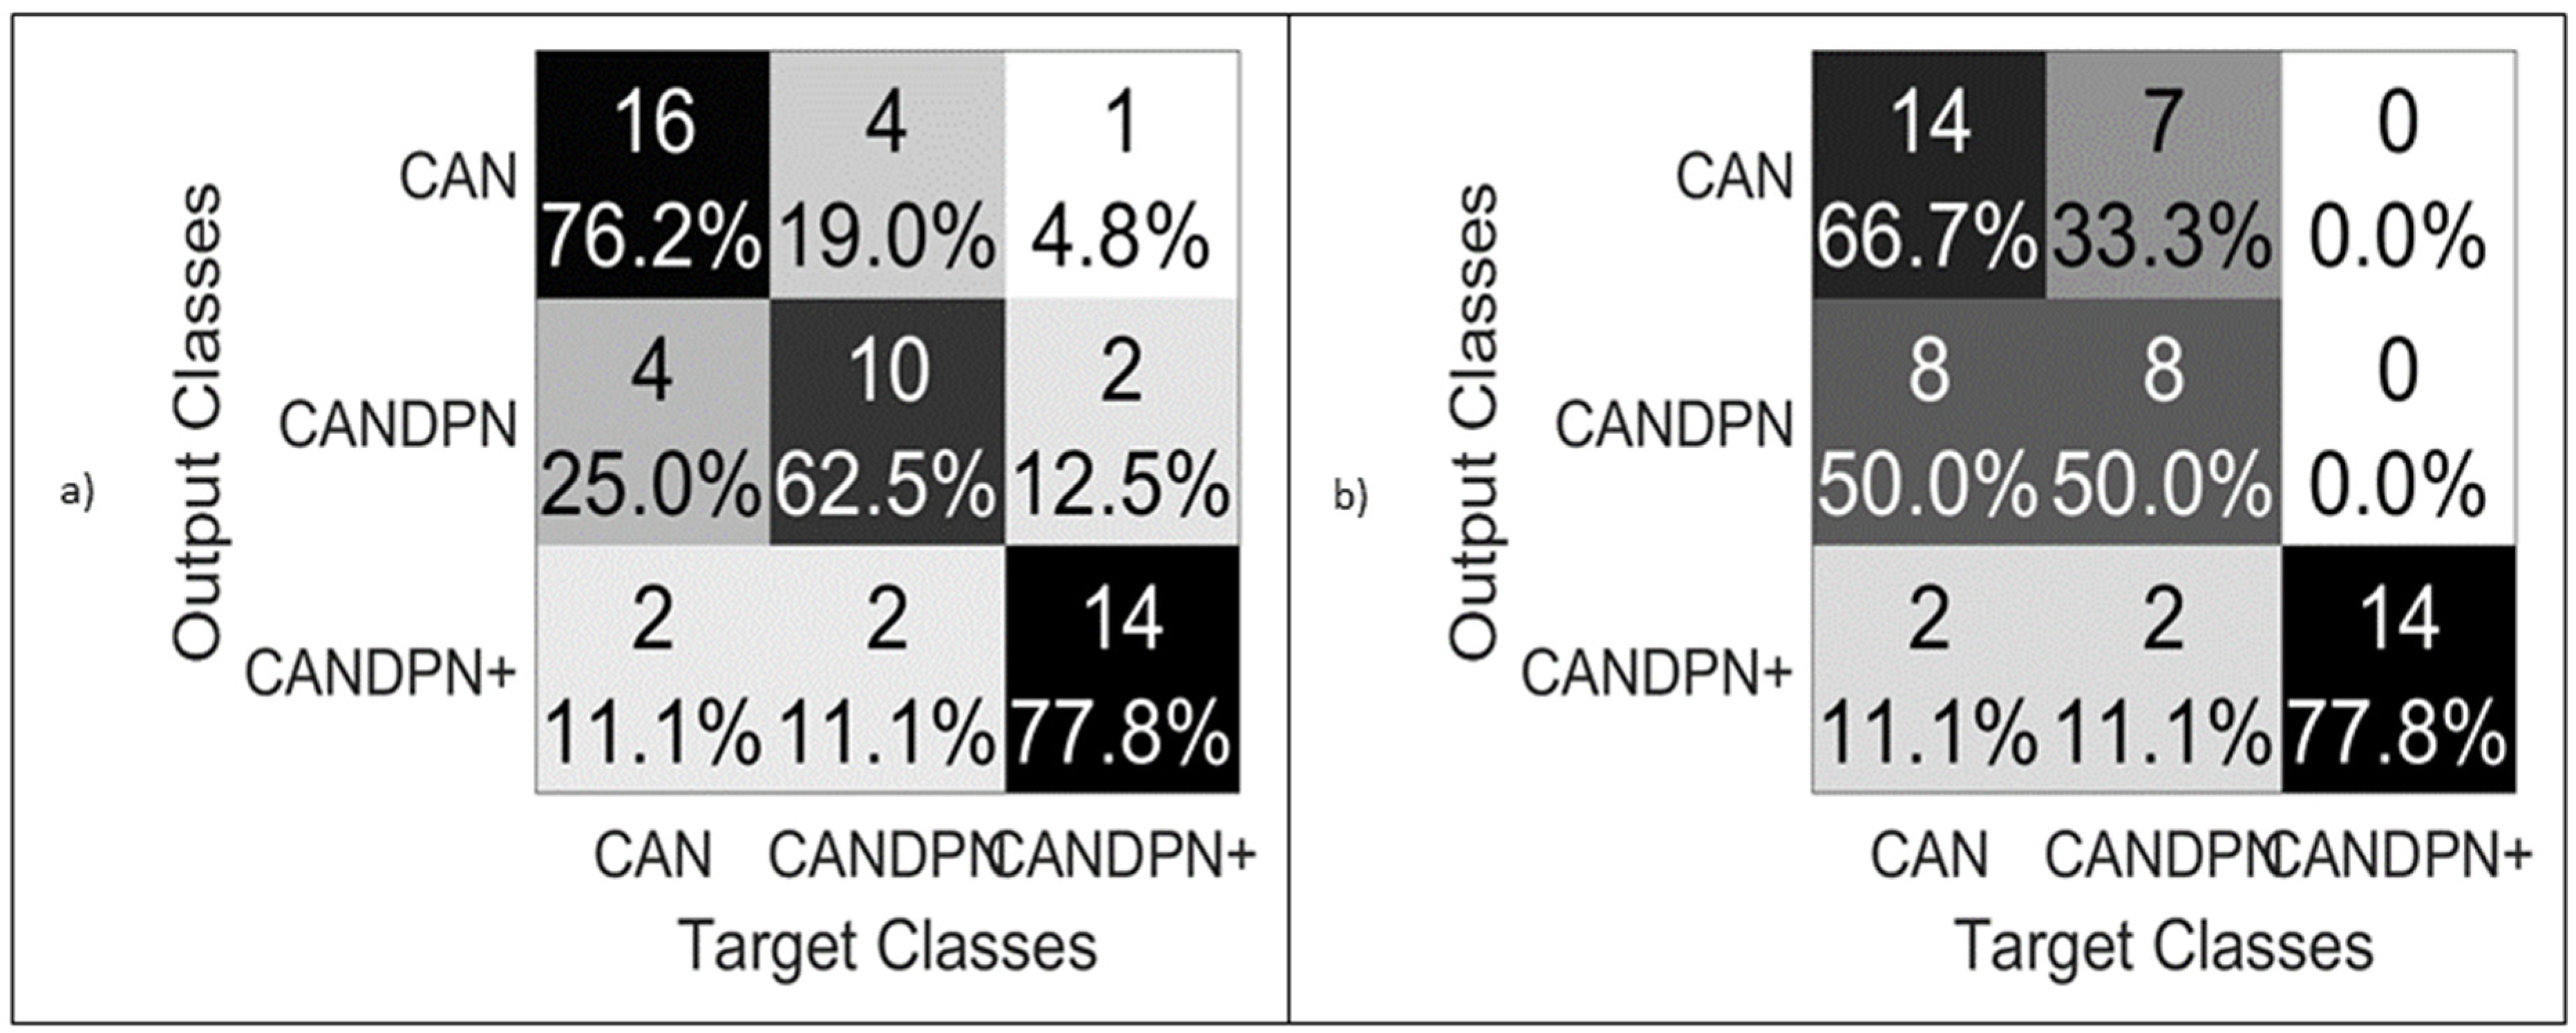
3.3.4. CANDPNOthers
4. Discussion
4.1. Demographic, Clinical, and Laboratory Profiles
4.2. Machine Learning as a Screening Tool
4.3. Clinical Relevance
4.4. Key Message to the Health Community of Bangladesh
5. Conclusions
Author Contributions
Funding
Institutional Review Board Statement
Informed Consent Statement
Data Availability Statement
Acknowledgments
Conflicts of Interest
Abbreviations
| CAN | cardiac autonomic neuropathy |
| DPN | diabetic peripheral neuropathy |
| Nep | nephropathy |
| Ret | retinopathy |
| NCV | nerve conduction velocity |
| CTS | carpal tunnel syndrome |
| ACR | albumin–creatinine ratio |
References
- Diabetes. Available online: https://www.who.int/health-topics/diabetes#tab=tab_1. (accessed on 23 August 2021).
- Ogurtsova, K.; da Rocha Fernandes, J.D.; Huang, Y.; Linnenkamp, U.; Guariguata, L.; Cho, N.H.; Cavan, D.; Shaw, J.E.; Makaroff, L.E. IDF Diabetes Atlas: Global estimates for the prevalence of diabetes for 2015 and 2040. Diabetes Res. Clin. Pract. 2017, 128, 40–50. [Google Scholar] [CrossRef] [Green Version]
- Chen, L.; Magliano, D.J.; Zimmet, P.Z. The worldwide epidemiology of type 2 diabetes mellitus—Present and future perspectives. Nat. Rev. Endocrinol. 2012, 8, 228–236. [Google Scholar] [CrossRef]
- Whiting, D.R.; Guariguata, L.; Weil, C.; Shaw, J. IDF diabetes atlas: Global estimates of the prevalence of diabetes for 2011 and 2030. Diabetes Res. Clin. Pract. 2011, 94, 311–321. [Google Scholar] [CrossRef]
- Wild, S.; Roglic, G.; Green, A.; Sicree, R.; King, H. Global prevalence of diabetes: Estimates for the year 2000 and projections for 2030. Diabetes Care 2004, 27, 1047–1053. [Google Scholar] [CrossRef] [Green Version]
- International Diabetes Federation, 8th ed. 2017. Available online: https://diabetesatlas.org/upload/resources/previous/files/8/IDF_DA_8e-EN-final.pdf (accessed on 15 November 2021).
- International Diabetes Federation, Diabetes Atlas. 2000. Available online: https://suckhoenoitiet.vn/download/Atla-benh-dai-thao-duong-2-1511669800.pdf (accessed on 15 November 2021).
- International Diabetes Federation, 7th ed. 2015. Available online: https://www.diabetesatlas.org/upload/resources/previous/files/7/IDF%20Diabetes%20Atlas%207th.pdf (accessed on 15 November 2021).
- Hira, R.; Miah, M.A.W.; Akash, D.H. Prevalence of Type 2 Diabetes Mellitus in Rural Adults (≥31years) in Bangladesh. Faridpur Med. Coll. J. 2018, 13, 20–23. [Google Scholar] [CrossRef]
- Saquib, N.; Saquib, J.; Ahmed, T.; Khanam, M.A.; Cullen, M.R. Cardiovascular diseases and type 2 diabetes in Bangladesh: A systematic review and meta-analysis of studies between 1995 and 2010. BMC Public Health 2012, 12, 434. [Google Scholar] [CrossRef] [Green Version]
- Katulanda, P.; Ranasinghe, P.; Jayawardena, R.; Constantine, G.R.; Sheriff, M.R.; Matthews, D.R. The prevalence, patterns and predictors of diabetic peripheral neuropathy in a developing country. Diabetol. Metab. Syndr. 2012, 4, 21. [Google Scholar] [CrossRef] [PubMed] [Green Version]
- Maser, R.E.; Mitchell, B.D.; Vinik, A.I.; Freeman, R. The association between cardiovascular autonomic neuropathy and mortality in individuals with diabetes a meta-analysis. Diabetes Care 2003, 26, 1895–1901. [Google Scholar] [CrossRef] [PubMed] [Green Version]
- Suarez, G.A.; Clark, V.M.; Norell, J.E.; Kottke, T.E.; Callahan, M.J.; O’Brien, P.C.; Low, P.A.; Dyck, P.J. Sudden cardiac death in diabetes mellitus: Risk factors in the Rochester diabetic neuropathy study. J. Neurol. Neurosurg. Psychiatry 2005, 76, 240–245. [Google Scholar] [CrossRef] [Green Version]
- Ziegler, D.; Dannehl, K.; Mühlen, H.; Spüler, M.; Gries, F.A. Prevalence of Cardiovascular Autonomic Dysfunction Assessed by Spectral Analysis, Vector Analysis, and Standard Tests of Heart Rate Variation and Blood Pressure Responses at Various Stages of Diabetic Neuropathy. Diabet. Med. 1992, 9, 806–814. [Google Scholar] [CrossRef]
- Abbott, C.A.; Carrington, A.L.; Ashe, H.; Bath, S.; Every, L.C.; Griffiths, J.; Hann, A.W.; Hussein, A.; Jackson, N.; Johnson, K.E.; et al. The North-West Diabetes Foot Care Study: Incidence of, and risk factors for, new diabetic foot ulceration in a community-based patient cohort. Diabet. Med. 2002, 19, 377–384. [Google Scholar] [CrossRef] [PubMed]
- Daousi, C.; MacFarlane, I.A.; Woodward, A.; Nurmikko, T.J.; Bundred, P.E.; Benbow, S.J. Chronic painful peripheral neuropathy in an urban community: A controlled comparison of people with and without diabetes. Diabet. Med. 2004, 21, 976–982. [Google Scholar] [CrossRef] [PubMed]
- Sima, A.A.F. Diabetic Neuropathy, 2nd Edition. P.J. Dyck and P.K. Thomas. Philadelphia: W.B. Saunders, 1999. No. of pages: 560. Price: £85.00. ISBN: 0721661823. Diabetes. Metab. Res. Rev. 1999, 15, 379. [Google Scholar] [CrossRef]
- Mørkrid, K.; Ali, L.; Hussain, A. Risk factors and prevalence of diabetic peripheral neuropathy: A study of type 2 diabetic outpatients in Bangladesh. Int. J. Diabetes Dev. Ctries. 2010, 30, 11–17. [Google Scholar] [CrossRef] [PubMed] [Green Version]
- Cabezas-Cerrato, J. The prevalence of clinical diabetic polyneuropathy in Spain: A study in primary care and hospital clinic groups. Neuropathy Spanish Study Group of the Spanish Diabetes Society (SDS). Diabetologia 1998, 41, 1263–1269. [Google Scholar] [CrossRef] [PubMed] [Green Version]
- Hussain, A.; Vaaler, S.; Sayeed, M.A.; Mahtab, H.; Ali, S.K.; Khan, A.A. Type 2 diabetes and impaired fasting blood glucose in rural Bangladesh: A population-based study. Eur. J. Public Health 2007, 17, 291–296. [Google Scholar] [CrossRef]
- Wu, A.Y.T.; Kong, N.C.T.; De Leon, F.A.; Pan, C.Y.; Tai, T.Y.; Yeung, V.T.F.; Yoo, S.J.; Rouillon, A.; Weir, M.R. An alarmingly high prevalence of diabetic nephropathy in Asian type 2 diabetic patients: The MicroAlbuminuria Prevalence (MAP) Study. Diabetologia 2005, 48, 17–26. [Google Scholar] [CrossRef] [Green Version]
- Akhter, A.; Fatema, K.; Ahmed, S.F.; Afroz, A.; Ali, L.; Hussain, A. Prevalence and Associated Risk Indicators of Retinopathy in a Rural Bangladeshi Population with and without Diabetes. Ophthalmic Epidemiol. 2013, 20, 220–227. [Google Scholar] [CrossRef]
- Yau, J.W.; Rogers, S.L.; Kawasaki, R.; Lamoureux, E.L.; Kowalski, J.W.; Bek, T.; Chen, S.J.; Dekker, J.M.; Fletcher, A.; Grauslund, J.; et al. Global prevalence and major risk factors of diabetic retinopathy. Diabetes Care 2012, 35, 556–564. [Google Scholar] [CrossRef] [Green Version]
- Biswas, T.; Islam, A.S.M.N.; Rawal, L.B.; Islam, S.M.S. Increasing prevalence of diabetes in Bangladesh: A scoping review. Public Health 2016, 138, 4–11. [Google Scholar] [CrossRef]
- Rahman, M.M.; Rahim, M.A.; Nahar, Q. Prevalence and risk factors of Type 2 diabetes in an urbanizing rural community of Bangladesh. Bangladesh Med. Res. Counc. Bull. 2007, 33, 48–54. [Google Scholar]
- Islam, S.M.S.; Niessen, L.W.; Seissler, J.; Ferrari, U.; Biswas, T.; Islam, A.; Lechner, A. Diabetes knowledge and glycemic control among patients with type 2 diabetes in Bangladesh. Springerplus 2015, 4, 1–7. [Google Scholar] [CrossRef] [Green Version]
- Saleh, F.; Mumu, S.J.; Ara, F.; Begum, H.A.; Ali, L. Knowledge and self-care practices regarding diabetes among newly diagnosed type 2 diabetics in Bangladesh: A cross-sectional study. BMC Public Health 2012, 12, 1–8. [Google Scholar] [CrossRef] [Green Version]
- Asghar, S.; Hussain, A.; Ali, S.M.K.; Khan, A.K.A.; Magnusson, A. Prevalence of depression and diabetes: A population-based study from rural Bangladesh. Diabet. Med. 2007, 24, 872–877. [Google Scholar] [CrossRef]
- Alcalá-Rmz, V.; Galván-Tejada, C.E.; García-Hernández, A.; Valladares-Salgado, A.; Cruz, M.; Galván-Tejada, J.I.; Celaya-Padilla, J.M.; Luna-Garcia, H.; Gamboa-Rosales, H. Identification of people with diabetes treatment through lipids profile using machine learning algorithms. Healthcare 2021, 9, 422. [Google Scholar] [CrossRef] [PubMed]
- Alcalá-Rmz, V.; Zanella-Calzada, L.A.; Galván-Tejada, C.E.; García-Hernández, A.; Cruz, M.; Valladares-Salgado, A.; Galván-Tejada, J.I.; Gamboa-Rosales, H. Identification of Diabetic Patients through Clinical and Para-Clinical Features in Mexico: An Approach Using Deep Neural Networks. Int. J. Environ. Res. Public Health 2019, 16, 381. [Google Scholar] [CrossRef] [Green Version]
- Zhou, H.; Myrzashova, R.; Zheng, R. Diabetes prediction model based on an enhanced deep neural network. EURASIP J. Wirel. Commun. Netw. 2020, 2020, 1–13. [Google Scholar] [CrossRef]
- Bae, S.; Park, T. Risk prediction of type 2 diabetes using common and rare variants. Int. J. Data Min. Bioinform. 2018, 20, 77–90. [Google Scholar] [CrossRef]
- Kannadasan, K.; Edla, D.R.; Kuppili, V. Type 2 diabetes data classification using stacked autoencoders in deep neural networks. Clin. Epidemiol. Glob. Health 2019, 7, 530–535. [Google Scholar] [CrossRef] [Green Version]
- Alharbi, A.; Alghahtani, M. Using Genetic Algorithm and ELM Neural Networks for Feature Extraction and Classification of Type 2-Diabetes Mellitus. Appl. Artif. Intell. 2019, 33, 311–328. [Google Scholar] [CrossRef]
- Alkhodari, M.; Rashid, M.; Mukit, M.A.; Ahmed, K.I.; Mostafa, R.; Parveen, S.; Khandoker, A.H. Screening Cardiovascular Autonomic Neuropathy in Diabetic Patients with Microvascular Complications Using Machine Learning: A 24-Hour Heart Rate Variability Study. IEEE Access 2021, 9, 119171–119187. [Google Scholar] [CrossRef]
- Von Elm, E.; Altman, D.G.; Egger, M.; Pocock, S.J.; Gøtzsche, P.C.; Vandenbroucke, J.P. The Strengthening the Reporting of Observational Studies in Epidemiology (STROBE) statement: Guidelines for reporting observational studies. J. Clin. Epidemiol. 2008, 61, 344–349. [Google Scholar] [CrossRef] [PubMed] [Green Version]
- Bangladesh Institute of Health Sciences Hospital. Available online: http://www.bihsh.org.bd/ (accessed on 12 September 2019).
- James, P.A.; Oparil, S.; Carter, B.L.; Cushman, W.C.; Dennison-Himmelfarb, C.; Handler, J.; Ortiz, E. Guía basada en la evidencia de 2014 para el manejo de la presión arterial alta en adultos: Informe de los miembros del panel designados para el Octavo Comité Nacional Conjunto (JNC 8). JAMA 2014, 311, 507–520. [Google Scholar] [CrossRef] [PubMed] [Green Version]
- Lin, K.; Wei, L.; Huang, Z.; Zeng, Q. Combination of Ewing test, heart rate variability, and heart rate turbulence analysis for early diagnosis of diabetic cardiac autonomic neuropathy. Medicine 2017, 96, e8296. [Google Scholar] [CrossRef] [PubMed]
- Kaplow, L.; Shavell, S. Fairness Versus Welfare; Havard University Press: Cambridge, MA, USA, 2006; Chapter 3. [Google Scholar]
- McCarty, C.A.; Taylor, K.I.; McKay, R.; Keeffe, J.E.; Working Group on Evaluation of NHMRC Diabetic Retinopathy Guidelines. Diabetic retinopathy: Effects of national guidelines on the referral, examination and treatment practices of ophthalmologists and optometrists. Clin. Experiment. Ophthalmol. 2001, 29, 52–58. [Google Scholar] [CrossRef] [PubMed]
- Abràmoff, M.D.; Garvin, M.K.; Sonka, M. Retinal imaging and image analysis. IEEE Rev. Biomed. Eng. 2010, 3, 169–208. [Google Scholar] [CrossRef] [Green Version]
- Antoch, J. A Guide to Chi-Squared Testing. Comput. Stat. Data Anal. 1997, 23, 565–566. [Google Scholar] [CrossRef]
- Müller, K.R.; Mika, S.; Rätsch, G.; Tsuda, K.; Schölkopf, B. An introduction to kernel-based learning algorithms. IEEE Trans. Neural Netw. 2001, 12, 181–201. [Google Scholar] [CrossRef] [Green Version]
- Moya, M.M.; Koch, M.W.; Hostetler, L.D. One-class classifier networks for target recognition applications. STIN 1993, 93, 24043. [Google Scholar]
- Ho, T.K. Random Decision Forest. In Proceedings of the 3rd International Conference on Document Analysis and Recognition, Montreal, QC, Canada, 14–16 August 1995; pp. 278–282. [Google Scholar]
- Wu, X.; Kumar, V.; Quinlan, J.R.; Ghosh, J.; Yang, Q.; Motoda, H.; McLachlan, G.J.; Ng, A.; Liu, B.; Philip, S.Y.; et al. Top 10 algorithms in data mining. Knowl. Inf. Syst. 2008, 14, 1–37. [Google Scholar] [CrossRef] [Green Version]
- Quinlan, J.R. {C4}.5—Programs for Machine Learning. In The Morgan Kaufmann Series in Machine Learning; Morgan Kaufmann: Burlington, MA, USA, 1993. [Google Scholar]
- LaValley, M.P. Logistic regression. Circulation 2008, 117, 2395–2399. [Google Scholar] [CrossRef] [PubMed] [Green Version]
- Nisbet, R.; Miner, G.; Yale, K. Data Understanding and Preparation. In Handbook of Statistical Analysis and Data Mining Applications; Elsevier: Amsterdam, Netherlands, 2018; pp. 55–82. [Google Scholar]
- Ramachandran, A. Specific problems of the diabetic foot in developing countries. Diabetes. Metab. Res. Rev. 2004, 20, S19–S22. [Google Scholar] [CrossRef] [PubMed]
- Hussain, A.; Rahim, M.A.; Azad Khan, A.K.; Ali, S.M.K.; Vaaler, S. Type 2 diabetes in rural and urban population: Diverse prevalence and associated risk factors in Bangladesh. Diabet. Med. 2005, 22, 931–936. [Google Scholar] [CrossRef] [PubMed]
- Boulton, A.J.M.; Cavanagh, P.R.; Rayman, G. The Foot in Diabetes, 4th ed.; Boulton, A.J., Cavanagh, P.R., Rayman, G., Eds.; Wiley: Toronto, ON, Canada, 2006. [Google Scholar]
- BÖRü, Ü.T.; Alp, R.; Sargin, H.; Koçer, A.; Sargin, M.; Lüleci, A.; Yayla, A. Prevalence of peripheral neuropathy in type 2 diabetic patients attending a diabetes center in Turkey. Endocr. J. 2004, 51, 563–567. [Google Scholar] [CrossRef] [PubMed] [Green Version]
- Mimi, O.; Teng, C.L.; Chia, Y.C. The prevalence of diabetic peripheral neuropathy in an outpatient setting. Med. J. Malays. 2003, 58, 533–538. [Google Scholar]
- Yang, C.P.; Lin, C.C.; Li, C.I.; Liu, C.S.; Lin, W.Y.; Hwang, K.L.; Yang, S.Y.; Chen, H.J.; Li, T.C. Cardiovascular risk factors increase the risks of diabetic peripheral neuropathy in patients with type 2 diabetes mellitus. Medicine 2015, 94, e1783. [Google Scholar] [CrossRef]
- Young, M.J.; Boulton, A.J.M.; MacLeod, A.F.; Williams, D.R.R.; Sonksen, P.H. A multicentre study of the prevalence of diabetic peripheral neuropathy in the United Kingdom hospital clinic population. Diabetologia 1993, 36, 150–154. [Google Scholar] [CrossRef] [Green Version]
- Ashok, S.; Ramu, M.; Deepa, R.; Mohan, V. Prevalence of neuropathy in type 2 diabetic patients attending a diabetes centre in South India. J. Assoc. Physicians India 2002, 50, 546–550. [Google Scholar] [PubMed]
- Hirsch, I.B.; Brownlee, M. Beyond hemoglobin A1c—Need for additional markers of risk for diabetic microvascular complications. JAMA J. Am. Med. Assoc. 2010, 303, 2291–2292. [Google Scholar] [CrossRef]
- Ayad, F.; Belhadj, M.; Pariés, J.; Attali, J.R.; Valensi, P. Association between cardiac autonomic neuropathy and hypertension and its potential influence on diabetic complications. Diabet. Med. 2010, 27, 804–811. [Google Scholar] [CrossRef] [PubMed]
- Karar, T.; Alniwaider, R.A.R.; Fattah, M.A.; Al Tamimi, W.; Alanazi, A.; Qureshi, S. Assessment of microalbuminuria and albumin creatinine ratio in patients with type 2 diabetes mellitus. J. Nat. Sci. Biol. Med. 2015, 6, S89. [Google Scholar] [PubMed] [Green Version]
- Parving, H.H.; Hommel, E.; Mathiesen, E.; Skøtt, P.; Edsberg, B.; Bahnsen, M.; Lauritzen, M.; Hougaard, P.; Lauritzen, E. Prevalence of microalbuminuria, arterial hypertension, retinopathy, and neuropathy in patients with insulin dependent diabetes. Br. Med. J. 1988, 296, 156–160. [Google Scholar] [CrossRef] [Green Version]
- Bell, D.S.; Ketchum, C.H.; Robinson, C.A.; Wagenknecht, L.E.; Williams, B.T. Microalbuminuria Associated with Diabetic Neuropathy. Diabetes Care 1992, 15, 528–531. [Google Scholar] [CrossRef] [PubMed]
- Škrha, J.; Šoupal, J.; Prázný, M. Glucose variability, HbA1c and microvascular complications. Rev. Endocr. Metab. Disord. 2016, 17, 103–110. [Google Scholar] [CrossRef]
- Nathan, D.M.; McGee, P.; Steffes, M.W.; Lachin, J.M.; DCCT/EDIC research group. Relationship of glycated albumin to blood glucose and HbA(1c) values and to retinopathy, nephropathy and cardiovascular outcomes in the DCCT/EDIC study. Diabetes 2014, 63, 282–290. [Google Scholar] [CrossRef] [PubMed] [Green Version]
- Sambyal, N.; Saini, P.; Syal, R. Microvascular Complications in Type-2 Diabetes: A Review of Statistical Techniques and Machine Learning Models. Wirel. Pers. Commun. 2020, 115, 1–26. [Google Scholar] [CrossRef]
- Jelinek, H.F.; Cornforth, D.J.; Kelarev, A.V. Machine Learning Methods for Automated Detection of Severe Diabetic Neuropathy. J. Diabet. Complicat. Med. 2016, 1, 1–7. [Google Scholar] [CrossRef] [Green Version]
- Cho, B.H.; Yu, H.; Kim, K.W.; Kim, T.H.; Kim, I.Y.; Kim, S.I. Application of irregular and unbalanced data to predict diabetic nephropathy using visualization and feature selection methods. Artif. Intell. Med. 2008, 42, 37–53. [Google Scholar] [CrossRef]
- Reddy, G.T.; Bhattacharya, S.; Ramakrishnan, S.S.; Chowdhary, C.L.; Hakak, S.; Kaluri, R.; Reddy, M.P.K. An Ensemble based Machine Learning model for Diabetic Retinopathy Classification. In Proceedings of the International Conference on Emerging Trends in Information Technology and Engineering, ic-ETITE 2020, Vellore, India, 24–25 February 2020. [Google Scholar]
- Walker, B.A.; Khandoker, A.H.; Black, J. Low cost ECG Monitor for Developing Countries. In Proceedings of the 2009 International Conference on Intelligent Sensors, Sensor Networks and Information Processing (ISSNIP), Melbourne, VIC, Australia, 7–10 December 2009; pp. 195–199. [Google Scholar]
- Khandoker, A.H.; Lai, D.T.; Begg, R.K.; Palaniswami, M. Wavelet-based feature extraction for support vector machines for screening balance impairments in the elderly. IEEE Trans. Neural Syst. Rehabil. Eng. 2007, 15, 587–597. [Google Scholar] [CrossRef]
- Qi, Y. Random forest for bioinformatics. In Ensemble Machine Learning; Springer: Boston, MA, USA, 2012; pp. 307–323. [Google Scholar]
- Alkhodari, M.; Jelinek, H.F.; Werghi, N.; Hadjileontiadis, L.J.; Khandoker, A.H. Estimating Left Ventricle Ejection Fraction Levels Using Circadian Heart Rate Variability Features and Support Vector Regression Models. IEEE J. Biomed. Health Inform. 2020, 25, 746–754. [Google Scholar] [CrossRef]


| Name of the Complication | Type | Number of Patients, N (%) | Total, N |
|---|---|---|---|
| CAN | pCAN (with CAN) | 65 (67.708) | 96 |
| nCAN (without CAN) | 10 (10.417) | ||
| Test result unavailable | 21 (21.875) | ||
| DPN | pDPN (with DPN) | 44 (45.833) | 96 |
| nDPN (without DPN) | 46 (47.917) | ||
| Test result unavailable | 6 (6.250) | ||
| RET | pRET (with RET) | 7 (7.292) | 96 |
| nRET (without RET) | 89 (92.708) |
| Types of Complications | Numerals, N (%) | Total, N | |
|---|---|---|---|
| nComp (no complication) | 4 (4.16) | 96 | |
| Single Complications | CAN | 21 (21.875) | |
| DPN | 3 (3.125) | ||
| NEP | 0 (0.00) | ||
| RET | 0 (0.00) | ||
| Combined Complications | CAN and DPN | 16 (16.67) | |
| CAN and NEP | 6 (6.25) | ||
| DPN and NEP | 2 (2.083) | ||
| CAN, DPN, and NEP | 12 (12.5) | ||
| CAN, DPN, and RET | 2 (2.083) | ||
| CAN, DPN, NEP, and RET | 4 (4.16) | ||
| Not sure (due to unavailable test results) | 26 (27.08) | ||
| Demographic Variables | ||||||
|---|---|---|---|---|---|---|
| Variables and their subdivisions | Male | Female | All | |||
| Mean ± SD | N (%of M) | Mean ± SD | N (% of F) | Mean ± SD | N (% of total) | |
| Patients | 47 (45.63) | 56 (54.37) | 103 (100) | |||
| Age (years) | 57.70 ± 9.78 | 47 (100) | 54.60 ± 7.93 | 56 (100) | 56.01 ± 8.91 | 103 (100) |
| ≥40 and <50 | 44.8 ± 3.22 | 10 (21.28) | 45.6 ± 2.95 | 15 (26.79) | 45.28 ± 3.02 | 25 (24.27) |
| ≥50 and <60 | 53.2 ± 2.7 | 15 (31.91) | 52.86 ± 3.17 | 22 (39.29) | 53 ± 2.95 | 37 (35.92) |
| ≥60 | 66.63 ± 4.78 | 22 (46.81) | 63.73 ± 3.79 | 19 (33.93) | 65.29 ± 4.54 | 41 (39.80) |
| CAN | 58.74 ± 9.63 | 31 (65.95) | 53.32 ± 7.40 | 37 (66.07) | 55.79 ± 8.85 | 68 (66.01) |
| DPN | 58.95 ± 10.33 | 21 (44.68) | 52.58 ± 6.33 | 24 (42.85) | 55.55 ± 8.93 | 45 (43.68) |
| Nep | 58.5 ± 10.37 | 12 (25.53) | 54.37 ± 8.75 | 16 (28.57) | 56.14 ± 9.52 | 28 (27.18) |
| Ret | 56.8 ± 11.64 | 5 (10.63) | 47.5 ± 0.707 | 2 (3.571) | 54.14 ± 10.54 | 7 (6.796) |
| BMI (kg/m2) | 25.53 ± 3.47 | 47 (100) | 27.93 ± 5.08 | 56 (100) | 26.84 ± 4.56 | 103 (100) |
| Underweight: <18.5 | 0 | 0 (0) | 0 | 0 (0) | 0 | 0 (0) |
| Normal: ≥18.5, <25 | 23.54 ± 1.45 | 27 (57.45) | 22.93 ± 1.69 | 17 (30.36) | 23.31 ± 1.56 | 44 (42.72) |
| Overweight: ≥25.0, <30 | 26.54 ± 1.03 | 15 (31.91) | 27.58 ± 1.32 | 24 (42.86) | 27.18 ± 1.31 | 39 (37.86) |
| Obese: ≥30 | 33.23 ± 4.09 | 5 (10.638) | 34.18 ± 4.77 | 15 (26.79) | 33.94 ± 4.52 | 20 (19.42) |
| CAN | 26.26 ± 3.71 | 31 (65.95) | 27.94 ± 5.82 | 37 (66.07) | 27.17 ± 5.01 | 68 (66.01) |
| DPN | 25.52 ± 3.56 | 21 (44.68) | 28.75 ± 5.01 | 24 (42.85) | 27.24 ± 4.64 | 45 (43.68) |
| Nep | 26.17 ± 4.22 | 12 (25.53) | 29.18 ± 5.60 | 16 (28.57) | 27.89 ± 5.19 | 28 (27.18) |
| Ret | 26.79 ± 5.53 | 5 (10.63) | 26.29 ± 2.09 | 2 (3.571) | 26.65 ± 4.60 | 7 (6.796) |
| Smoking history | 9 (19.15) | 0 (0) | 9 (8.74) | |||
| Smokeless tobacco history | 10 (21.28) | 17 (30.357) | 27 (26.21) | |||
| Clinical variables | ||||||
| Name of the Variables and their subdivisions | Male | Female | All | |||
| Mean ± SD | N (%of M) | Mean ± SD | N (% of F) | Mean ± SD | N (% of total) | |
| Diabetes duration (years) | 16.17 ± 6.07 | 47 (100) | 15.55 ± 5.76 | 56 (100) | 15.83 ± 5.88 | 103 (100) |
| ≥10 and <20 | 13.54 ± 2.76 | 37 (78.72) | 12.60 ± 2.64 | 41 (73.21) | 13.05 ± 2.73 | 78 (75.73) |
| ≥20 and <30 | 24 ± 3.116 | 8 (17.02) | 22.30 ± 1.93 | 13 (23.21) | 22.95 ± 2.52 | 21 (20.39) |
| ≥30 | 33.5 ± 2.12 | 2 (4.26) | 32 ± 2.828 | 2 (3.57) | 32.75 ± 2.22 | 4 (3.88) |
| CAN | 16.54 ± 6.20 | 31 (65.95) | 16.13 ± 6.01 | 37 (66.07) | 16.32 ± 6.05 | 68 (66.01) |
| DPN | 17.33 ± 7.43 | 21 (44.68) | 14.16 ± 4.80 | 24 (42.85) | 15.64 ± 6.30 | 45 (43.68) |
| Nep | 18.91 ± 8.11 | 12 (25.53) | 16.81 ± 6.63 | 16 (28.57) | 17.71 ± 7.24 | 28 (27.18) |
| Ret | 13 ± 2.828 | 5 (10.63) | 17.5 ± 3.535 | 2 (3.571) | 14.28 ± 3.49 | 7 (6.796) |
| Waist Circumference (cm) | 90.84 ± 8.61 | 47 (100) | 97.38 ± 9.46 | 56 (100) | 94.39 ± 9.61 | 103 (100) |
| Men ≥90 | 97.40 ± 6.7 | 23 (48.94) | ||||
| Women ≥80 | 97.72 ± 9.19 | 55 (98.21) | ||||
| CAN | 92.09 ± 8.47 | 31 (65.95) | 96.58 ± 9.30 | 37 (66.07) | 94.54 ± 9.15 | 68 (66.01) |
| DPN | 92.64 ± 8.13 | 21 (44.68) | 98.63 ± 9.07 | 24 (42.85) | 95.84 ± 9.06 | 45 (43.68) |
| Nep | 91.22 ± 6.71 | 12 (25.53) | 97.31 ± 9.80 | 16 (28.57) | 94.70 ± 9.00 | 28 (27.18) |
| Ret | 89.91 ± 5.26 | 5 (10.63) | 93.98 ± 14.36 | 2 (3.571) | 91.07 ± 7.53 | 7 (6.796) |
| Systolic blood pressure (mmHg) | 141.2 ± 19.5 | 47 (100) | 136.0 ± 20.14 | 56 (100) | 138.4 ± 19.94 | 103 (100) |
| ≤119 | 108 ± 5.29 | 4 (8.51) | 108.3 ± 8.96 | 12 (21.43) | 108.2 ± 8.03 | 16 (15.53) |
| ≥120 and <14 | 129.2 ± 6.67 | 19 (40.43) | 130.1 ± 4.98 | 19 (33.93) | 129.7 ± 5.82 | 38 (36.89) |
| ≥140 and <160 | 148.2 ± 7.52 | 15 (31.91) | 148.3 ± 5.71 | 19 (33.93) | 148.2 ± 6.47 | 34 (33.01) |
| ≥160 | 169.6 ± 9.72 | 9 (19.15) | 171.3 ± 6.40 | 6 (10.714) | 170.3 ± 8.33 | 15 (14.56) |
| CAN | 145.0 ± 20.16 | 31 (65.95) | 134.0 ± 21.30 | 37 (66.07) | 139.0 ± 21.35 | 68 (66.01) |
| DPN | 148.5 ± 20.82 | 21 (44.68) | 134.8 ± 15.96 | 24 (42.85) | 141.2 ± 19.43 | 45 (43.68) |
| Nep | 153.0 ± 15.16 | 12 (25.53) | 136.1 ± 17.22 | 16 (28.57) | 143.4 ± 18.19 | 28 (27.18) |
| Ret | 158.6 ± 16.14 | 5 (10.63) | 137.5 ± 17.67 | 2 (3.571) | 152.5 ± 18.21 | 7 (6.796) |
| Diastolic blood pressure (mmHg) | 78.97 ± 9.86 | 47 (100) | 76.42 ± 11.96 | 56 (100) | 77.59 ± 11.07 | 103 (100) |
| ≤79 | 71.36 ± 7.45 | 22 (46.81) | 67.96 ± 6.98 | 32 (57.14) | 69.35 ± 7.30 | 54 (52.43) |
| ≥80–89 | 82.73 ± 2.83 | 19 (40.43) | 83.81 ± 3.08 | 16 (28.57) | 83.22 ± 2.95 | 35 (33.98) |
| ≥90–99 | 94 ± 3.39 | 5 (10.64) | 94.14 ± 2.61 | 7 (12.5) | 94.08 ± 2.81 | 12 (11.65) |
| ≥100 | 100 ± 0 | 1 (2.13) | 105 ± 0 | 1 (1.79) | 102.5 ± 3.54 | 2 (1.94) |
| CAN | 78.45 ± 11.40 | 31 (65.95) | 75.48 ± 12.76 | 37 (66.07) | 76.83 ± 12.16 | 68 (66.01) |
| DPN | 78.19 ± 12.23 | 21 (44.68) | 76.87 ± 10.63 | 24 (42.85) | 77.48 ± 11.29 | 45 (43.68) |
| Nep | 74.91 ± 13.48 | 12 (25.53) | 75.93 ± 10.81 | 16 (28.57) | 75.5 ± 11.79 | 28 (27.18) |
| Ret | 84.6 ± 10.13 | 5 (10.63) | 72.5 ± 3.54 | 2 (3.571) | 81.14 ± 10.27 | 7 (6.796) |
| Types and Their Variables | Male | Female | All | |||
|---|---|---|---|---|---|---|
| Mean ± SD | N (%of M) | Mean ± SD | N (% of F) | Mean ± SD | N (% of total) | |
| HbA1c (mmol/mol,%) | ||||||
| Not specified | 9.066 ± 1.944 | 47 (45.63) | 8.621 ± 1.453 | 56 (54.37) | 8.824 ± 1.701 | 103 (100.0) |
| Optimal: <7 | 2 (4.26) | 8 (14.29) | 10 (9.71) | |||
| Fair: 7–8 | 12 (25.53) | 11 (19.64) | 23 (22.33) | |||
| High: >8 | 33 (70.21) | 37 (66.07) | 70 (67.96) | |||
| CAN | 9.213 ± 1.790 | 31 (45.59) | 8.716 ± 1.491 | 37 (54.41) | 8.943 ± 1.640 | 68 (66.02) |
| Optimal: <7 | 1 (3.23) | 4 (10.81) | 5 (7.35) | |||
| Fair: 7–8 | 6 (19.35) | 8 (21.62) | 14 (20.59) | |||
| High: >8 | 24 (77.42) | 25 (67.57) | 49 (72.06) | |||
| DPN | 9.291 ± 1.988 | 21 (46.67) | 8.930 ± 1.667 | 24 (53.33) | 9.098 ± 1.810 | 45 (43.69) |
| Optimal: <7 | 2 (9.52) | 3 (12.50) | 5 (11.11) | |||
| Fair: 7–8 | 3 (14.29) | 4 (16.67) | 7 (15.56) | |||
| High: >8 | 16 (76.19) | 17 (70.83) | 33 (73.33) | |||
| Nephropathy | 9.9750 ± 2.221 | 12 (42.86) | 8.763 ± 1.902 | 16 (57.14) | 9.282 ± 2.094 | 28 (27.18) |
| Optimal: <7 | 1 (8.33) | 3 (18.75) | 4 (14.29) | |||
| Fair: 7–8 | 1 (8.33) | 4 (25.00) | 5 (17.86) | |||
| High: >8 | 10 (83.33) | 9 (56.25) | 19 (67.86) | |||
| Retinopathy | 10.720 ± 3.334 | 5 (71.43) | 11.100 ± 1.980 | 2 (28.57) | 10.829 ± 2.846 | 7 (6.80) |
| Optimal: <7 | 0 (0.00) | 0 (0.00) | 0 (0.00) | |||
| Fair: 7–8 | 2 (40.00) | 0 (0.00) | 2 (28.57) | |||
| High: >8 | 3 (60.00) | 2 (100.00) | 5 (71.43) | |||
| Microalbuminuria (mg) | ||||||
| Not specified | 60.6164 ± 99.490 | 47 (46.08) | 49.571 ± 82.123 | 55 (53.92) | 54.661 ± 90.247 | 102 (99.03) |
| Optimal: <30 | 34 (72.34) | 38 (69.09) | 72 (70.59) | |||
| Microalbuminuria: 30–300 | 10 (21.28) | 15 (27.27) | 25 (24.51) | |||
| Macro albuminuria: >300 | 3 (6.38) | 2 (3.64) | 5 (4.90) | |||
| CAN | 88.439 ± 113.172 | 31 (45.59) | 56.981 ± 93.199 | 37 (54.41) | 71.322 ± 103.204 | 68 (66.02) |
| Optimal: <30 | 18 (58.06) | 25 (67.57) | 43 (63.24) | |||
| Microalbuminuria: 30–300 | 10 (32.26) | 10 (27.03) | 20 (29.41) | |||
| Macro albuminuria: >300 | 3 (9.68) | 2 (5.41) | 5 (7.35) | |||
| DPN | 121.925 ± 124.49 | 21 (47.73) | 55.2565 ± 87.479 | 23 (52.27) | 87.075 ± 110.720 | 44 (42.72) |
| Optimal: <30 | 10 (47.62) | 15 (65.22) | 25 (56.82) | |||
| Microalbuminuria: 30–300 | 8 (38.10) | 7 (30.43) | 15 (34.09) | |||
| Macro albuminuria: >300 | 3 (14.29) | 1 (4.35) | 4 (9.09) | |||
| Nephropathy | 210.308 ± 91.414 | 12 (42.86) | 144.519 ± 98.407 | 16 (57.14) | 172.7143 ± 99.417 | 28 (27.18) |
| Optimal: <30 | 0 (0.00) | 1 (6.25) | 1 (3.57) | |||
| Microalbuminuria: 30–300 | 9 (75.00) | 13 (81.25) | 22 (78.57) | |||
| Macro albuminuria: >300 | 3 (25.00) | 2 (12.50) | 5 (17.86) | |||
| Retinopathy | 158.62 ± 140.295 | 5 (71.43) | 136.15 ± 178.691 | 2 (28.57) | 152.20 ± 136.247 | 7 (6.80) |
| Optimal: <30 | 2 (40.00) | 1 (50.00) | 3 (42.86) | |||
| Microalbuminuria: 30–300 | 2 (40.00) | 1 (50.00) | 3 (42.86) | |||
| Macro albuminuria: >300 | 1 (20.00) | 0 (00.00) | 1 (14.28) | |||
| Urinary Creatinine (mg/ dL) | ||||||
| Not specified | 194.46 ± 139.83 | 130.87 ± 117.85 | 160.17 ± 131.70 | 102 (99.03) | ||
| Target 20–320 mg/ dL | 41 (87.23) | 50 (90.91) | 91 (89.22) | |||
| Non-Target >320 mg/ dL | 6 (12.77) | 4 (7.27) | 10 (9.80) | |||
| CAN | 236.15 ± 150.39 | 31 (45.59) | 123.28 ± 107.24 | 37 (54.41) | 174.74 ± 139.68 | 68 (66.02) |
| Target 20–320 mg/ dL | 25 (80.65) | 34 (91.89) | 59 (86.76) | |||
| Non-Target >320 mg/ dL | 6 (19.35) | 2 (5.41) | 8 (11.76) | |||
| DPN | 236.84 ± 160.20 | 21 (47.73) | 157.52 ± 149.63 | 23 (52.27) | 195.34 ± 158.11 | 44 (42.72) |
| Target 20–320 mg/ dL | 17 (80.95) | 20 (86.96) | 37 (84.09) | |||
| Non-Target >320 mg/ dL | 4 (19.05) | 3 (13.04) | 7 (15.91) | |||
| Nephropathy | 256.43 ± 205.44 | 12 (42.86) | 152.65 ± 77.99 | 16 (57.14) | 197.13 ± 152.68 | 28 (27.18) |
| Target 20–320 mg/ dL | 9 (75.00) | 16 (100.0) | 25 (89.29) | |||
| Non-Target >320 mg/ dL | 3 (25.00) | 0 (0.00) | 3 (10.71) | |||
| Retinopathy | 211.36 ± 55.58 | 5 (71.43) | 159.95 ± 135.98 | 2 (28.57) | 196.67 ± 75.96 | 7 (6.80) |
| Target 20–320 mg/ dL | 5 (100.0) | 2 (100.0) | 7 (100.0) | |||
| Non-Target >320 mg/ dL | 0 (0.00) | 0 (0.00) | 0 (0.00) | |||
| Albumin–Creatinine Ratio (mg/mmol) | ||||||
| Not Specified | 32.09 ± 52.45 | 47 (46.08) | 39.28 ± 74.58 | 55 (53.92) | 35.97 ± 65.11 | 102 (99.03) |
| Optimal: <3 | 12 (25.53) | 10 (18.18) | 22 (21.57) | |||
| Borderline high: 3–30 | 23 (48.94) | 29 (52.73) | 52 (50.98) | |||
| High: >30 | 12 (25.53) | 16 (29.09) | 28 (27.45) | |||
| CAN | 44.35 ± 60.99 | 31 (45.59) | 45.36 ± 86.19 | 37 (54.41) | 44.90 ± 75.22 | 68 (66.02) |
| Optimal: <3 | 7 (22.58) | 6 (16.22) | 13 (19.12) | |||
| Borderline high: 3–30 | 12 (38.71) | 20 (54.05) | 32 (47.06) | |||
| High: >30 | 12 (38.71) | 11 (29.73) | 23 (33.82) | |||
| DPN | 60.73 ± 68.22 | 21 (47.73) | 35.97 ± 51.28 | 23 (52.27) | 47.79 ± 60.55 | 44 (42.72) |
| Optimal: <3 | 6 (28.57) | 5 (21.74) | 11 (25.00) | |||
| Borderline high: 3–30 | 4 (19.05) | 11 (47.83) | 15 (34.09) | |||
| High: >30 | 11 (52.38) | 7 (30.43) | 18 (40.91) | |||
| Nephropathy | 105.960 ± 57.952 | 12 (42.86) | 111.404 ± 109.675 | 16 (57.14) | 109.071 ± 89.771 | 28 (27.18) |
| Optimal: <3 | 0 (0.00) | 0 (0.00) | 0 (0.00) | |||
| Borderline high: 3–30 | 0 (0.00) | 0 (0.00) | 0 (0.00) | |||
| High: >30 | 12 (100.0) | 16 (100.0) | 28 (100.0) | |||
| Retinopathy | 86.567 ± 87.999 | 5 (71.43) | 58.923 ± 61.616 | 2 (28.57) | 78.671 ± 77.312 | 7 (6.80) |
| Optimal: <3 | 0 (0.00) | 0 (0.00) | 0 (0.00) | |||
| Borderline high: 3–30 | 2 (40.00) | 1 (50.00) | 3 (42.86) | |||
| High: >30 | 3 (60.00) | 1 (50.00) | 4 (57.14) | |||
| Tests | CAN (pCAN vs. nCAN) | DPN (pDPN vs. nDPN) | RET (pRET vs. nRET) | |
|---|---|---|---|---|
| logistic regression | Accuracy, % | 80 | 55.56 | 88.54 |
| Sensitivity, % | 85.71 | 55.77 | 93.33 | |
| Specificity, % | 85.71 | 55.26 | 16.67 | |
| SVM | Accuracy, % | 77.33 | 67.8 | 80.5 |
| Sensitivity, % | 29.41 | 68.89 | 96.05 | |
| Specificity, % | 91.34 | 66.67 | 20 | |
| RF | Accuracy, % | 98.67 | 67.8 | 84.38 |
| Sensitivity, % | 100 | 68.09 | 97.44 | |
| Specificity, % | 98.48 | 67.44 | 27.78 | |
| Features | Mean | 95% CI (Lower Limit to Upper Limit) | |
|---|---|---|---|
| ‘Age’ | 56.167 | 54.315 | 58.018 |
| ‘Waist Circumference’ | 141.382 | 136.503 | 146.262 |
| ‘Diabetes Duration’ | 15.844 | 14.571 | 17.117 |
| ‘BMI’ | 26.657 | 25.694 | 27.621 |
| ‘Systolic BP’ | 138.900 | 134.847 | 142.953 |
| ‘Diastolic BP’ | 77.600 | 75.355 | 79.845 |
| ‘Weight’ | 65.517 | 63.634 | 67.400 |
| ‘Height’ | 157.399 | 155.252 | 159.546 |
| ‘HbA1c’ | 8.799 | 8.465 | 9.133 |
| ‘Microalbuminuria’ | 55.741 | 36.539 | 74.943 |
| ‘Urinary Creatinine’ | 160.656 | 131.724 | 189.588 |
| ‘Albumin–Creatinine Ratio’ | 37.387 | 23.178 | 51.595 |
| Features | Mean | 95% CI (Lower Limit to Upper Limit) | |
|---|---|---|---|
| ‘Age’ | 55.844 | 54.017 | 57.671 |
| ‘Waist Circumference’ | 140.642 | 135.853 | 145.432 |
| ‘Diabetes Duration’ | 15.781 | 14.580 | 16.983 |
| ‘BMI’ | 26.657 | 25.713 | 27.600 |
| ‘Systolic BP’ | 138.385 | 134.449 | 142.322 |
| ‘Diastolic BP’ | 77.615 | 75.473 | 79.756 |
| ‘Weight’ | 65.658 | 63.824 | 67.491 |
| ‘Height’ | 157.603 | 155.475 | 159.730 |
| ‘HbA1c’ | 8.902 | 8.554 | 9.251 |
| ‘Microalbuminuria’ | 55.269 | 36.692 | 73.847 |
| ‘Urinary Creatinine’ | 160.770 | 133.508 | 188.032 |
| ‘Albumin-Creatinine Ratio’ | 36.744 | 23.202 | 50.286 |
| Features | Mean | 95% CI (Lower Limit to Upper Limit) | |
|---|---|---|---|
| ‘Age’ | 55.707 | 53.651 | 57.763 |
| ‘Waist Circumference’ | 139.958 | 134.525 | 145.391 |
| ‘Diabetes Duration’ | 15.827 | 14.486 | 17.167 |
| ‘BMI’ | 26.817 | 25.683 | 27.951 |
| ‘Systolic BP’ | 138.813 | 134.153 | 143.474 |
| ‘Diastolic BP’ | 77.347 | 74.802 | 79.891 |
| ‘Weight’ | 65.601 | 63.476 | 67.727 |
| ‘Height’ | 157.177 | 154.610 | 159.744 |
| ‘HbA1c’ | 8.955 | 8.553 | 9.356 |
| ‘Microalbuminuria’ | 67.648 | 44.636 | 90.660 |
| ‘Urinary Creatinine’ | 172.120 | 139.197 | 205.044 |
| ‘Albumin-Creatinine Ratio’ | 44.128 | 27.134 | 61.123 |
Publisher’s Note: MDPI stays neutral with regard to jurisdictional claims in published maps and institutional affiliations. |
© 2022 by the authors. Licensee MDPI, Basel, Switzerland. This article is an open access article distributed under the terms and conditions of the Creative Commons Attribution (CC BY) license (https://creativecommons.org/licenses/by/4.0/).
Share and Cite
Rashid, M.; Alkhodari, M.; Mukit, A.; Ahmed, K.I.U.; Mostafa, R.; Parveen, S.; Khandoker, A.H. Machine Learning for Screening Microvascular Complications in Type 2 Diabetic Patients Using Demographic, Clinical, and Laboratory Profiles. J. Clin. Med. 2022, 11, 903. https://doi.org/10.3390/jcm11040903
Rashid M, Alkhodari M, Mukit A, Ahmed KIU, Mostafa R, Parveen S, Khandoker AH. Machine Learning for Screening Microvascular Complications in Type 2 Diabetic Patients Using Demographic, Clinical, and Laboratory Profiles. Journal of Clinical Medicine. 2022; 11(4):903. https://doi.org/10.3390/jcm11040903
Chicago/Turabian StyleRashid, Mamunur, Mohanad Alkhodari, Abdul Mukit, Khawza Iftekhar Uddin Ahmed, Raqibul Mostafa, Sharmin Parveen, and Ahsan H. Khandoker. 2022. "Machine Learning for Screening Microvascular Complications in Type 2 Diabetic Patients Using Demographic, Clinical, and Laboratory Profiles" Journal of Clinical Medicine 11, no. 4: 903. https://doi.org/10.3390/jcm11040903
APA StyleRashid, M., Alkhodari, M., Mukit, A., Ahmed, K. I. U., Mostafa, R., Parveen, S., & Khandoker, A. H. (2022). Machine Learning for Screening Microvascular Complications in Type 2 Diabetic Patients Using Demographic, Clinical, and Laboratory Profiles. Journal of Clinical Medicine, 11(4), 903. https://doi.org/10.3390/jcm11040903