Abstract
Cyclin D1 binding protein 1 (CCNDBP1) is considered a tumor suppressor, and when expressed in tumor cells, CCNDBP1 can contribute to the viability of cancer cells by rescuing these cells from chemotherapy-induced DNA damage. Therefore, this study focused on investigating the function of CCNDBP1, which is directly related to the survival of cancer cells by escaping DNA damage and chemoresistance. Hepatocellular carcinoma (HCC) cells and tissues obtained from Ccndbp1 knockout mice were used for the in vitro and in vivo examination of the molecular mechanisms of CCNDBP1 associated with the recovery of cells from DNA damage. Subsequently, gene and protein expression changes associated with the upregulation, downregulation, and irradiation of CCNDBP1 were assessed. The overexpression of CCNDBP1 in HCC cells stimulated cell growth and showed resistance to X-ray-induced DNA damage. Gene expression analysis of CCNDBP1-overexpressed cells and Ccndbp1 knockout mice revealed that Ccndbp1 activated the Atm–Chk2 pathway through the inhibition of Ezh2 expression, accounting for resistance to DNA damage. Our study demonstrated that by inhibiting EZH2, CCNDBP1 contributed to the activation of the ATM–CHK2 pathway to alleviate DNA damage, leading to chemoresistance.
1. Introduction
Cyclin D1 binding protein 1 (CCNDBP1, also known as GCIP and HHM) is a cyclin D-binding dominant-negative helix–loop–helix protein with no DNA binding region [1,2]. It is expressed in various tissues, including the thymus, spleen, liver, small intestine, colon, brain, muscle, heart, kidney, lung, and peripheral leukocytes [3,4]. Furthermore, it interacts with various proteins, including cyclin D1 [5], SYF2 [6,7,8], E12 [4], CT847 [9], Jab1 [10], Sirt6 [5], MyoD [11], and Olig1 [12]. The molecular mechanisms of the interaction of CCNDBP1 with these proteins involve G1/S cell cycle phase progression in hepatocytes [13]; tumor suppression in liver cancer [10,14,15,16], breast cancer [15,17,18,19], gastric cancer (GC) [19], lung cancer [20], prostate cancer [19], and colon cancer [5]; regulation of TGF-β target genes, including the Olig1-Smad synexpression group [12]; and regulation of skeletal myogenesis interacting with MyoD [11]. The significant downregulation of CCNDBP1 in non-immortalized human cell lines was recently reported to result in chromosomal imbalance [21]. In addition, Takami et al. reported that CCNDBP1 protein expression in hepatocellular carcinoma (HCC) was associated with pathologic differentiation by demonstrating its expression upon the initiation of hepatocarcinogenesis and a more positive staining in well-differentiated HCC than in poorly differentiated HCC [10]. These results indicated the possibility that CCNDBP1 is expressed upon cell proliferation in the early stage of malignant transformation [22] and contributes to the maintenance of chromosomal stability as a tumor suppressor of malignant cell growth; suppression of its function may further enhance the malignant potential. The similar mechanism of tumor suppressor gene, Bcl11b, has been reported by showing the vulnerability of cells and tissues to DNA replication stress and damages. These reports implicate these tumor suppressor genes in the remedy for DNA replication stress and maintenance of genomic integrity [23,24].
Furthermore, CCNDBP1 methylation in cancer cells was reported to be related with the chemosensitivity of colorectal cancer to 5-fluorouracil [25], suggesting that CCNDBP1 expression in cancer cells might be related with tumor viability upon the initiation of antitumor agents. These results were supported by evidence that its interactor SYF2 induced apoptosis in neuronal [6] and retinal ganglion cells [8]; however, upregulation of SYF2 in esophageal cancer cells contributed to the chemoresistance and caused DNA damage in the cells. These results indicated that when expressed in tumor cells, CCNDBP1 may contribute to the viability of cancer cells by rescuing them from DNA damage [7].
CCNDBP1 functions as a tumor suppressor as it negatively regulates TGF-β signal-induced cell migration depending on the surrounding condition [26]. The direct interaction of MEK2 was recently reported to phosphorylate CCNDBP1 at its Ser313 and Ser356 residues, thereby promoting its turnover by ubiquitin-mediated proteasomal degradation, which led to cancer cell proliferation, migration, and invasion [27]. However, the function of CCNDBP1 that is directly related with the survival from DNA damage and chemoresistance in cancer cells has not been investigated. Therefore, this study aimed to investigate the molecular mechanisms of CCNDBP1, focusing on the recovery from DNA damage of liver cancer cells and in Ccndbp1 knockout mice.
2. Materials and Methods
2.1. Plasmids
The CCNDBP1-expressing plasmid, which contained a chicken β-actin promoter, cytomegalovirus enhancer, and an IRES, was generated through a multistep and ligation-based cloning procedure using the full-length complementary DNA of the human homolog of Ccndbp1. The plasmid was purified using a Plasmid Mega Kit (Qiagen, Hilde, Germany). The purity of the plasmid preparation was checked by absorbance at 260 and 280 nm and 1% agarose gel electrophoresis.
2.2. Cells
Human hepatoma HLE and HepG2 cell lines were purchased from the Japanese Collection of Research Bioresources Cell Bank (National Institutes of Biomedical Innovation, Health and Nutrition, Ibaraki, Osaka) and were cultured in Dulbecco’s Modified Eagle Medium (gibco, 11885-084, Thermo Fisher Scientific, Waltham, MA, USA), which contained 10% fetal bovine serum and 100 IU/mL of penicillin and streptomycin. Cells were placed in a 5% CO2-humidified incubator at 37 °C. Either mock or CCNDBP1 cloned vectors were transfected into the HLE and HepG2 cells using FuGENE HD Transfection Reagent (Promega, Madison, WI, USA), followed by G418 sulfate selection. From each of the four cell lines, three independent clones were isolated and used for assay.
The expressions of CCNDBP1 and glyceraldehyde 3 phosphate dehydrogenase (GAPDH) genes, and CCNDBP1 and β-actin proteins in the cell lines were confirmed by reverse transcription polymerase chain reaction (PCR) or Western blotting. For these analyses, the RNA Easy Mini kit (Qiagen, Valencia, CA) was used to prepare the total RNA from cells, according to the protocol recommended by the manufacturer. Using SuperScript II Reverse Transcriptase (Invitrogen, Carlsbad, CA, USA), complementary DNA was synthesized from 1–5 mg of total RNA using an oligo (dT) primer; 1–2 aliquots of complementary DNA products PCR were used with the following primers:
- CCNDBP1 (forward): GCTGTGGAAGAATGTGACC
- CCNDBP1 (reverse): AGAGCCAAATCATCCACA
- GAPDH (forward): AGGTCGGTGTGAACGGATTTG
- GAPDH (reverse): TGTAGACCATGTAGTTGAGGTCA
Multiplex PCR was carried out similarly, and GAPDH primers were always included as the reference. The PCR products were separated by electrophoresis in 1% agarose gel and stained with ethidium bromide for visualization. The PCR protocol was as follows: 10 min at 95 °C, followed by 35 cycles (30 s at 95 °C, 30 s at 55 °C and 1 min at 72 °C) and a 7-min extension at 72 °C. The details of the Western blotting are summarized in Section 2.6.
2.3. Animals
All animal experiments were approved by and conducted in full compliance with the regulations of the Institutional Animal Care and Use Committee at Niigata University, Niigata, Japan. Male BALB/c mice (n = 50, 8 weeks of age, 25–30 g) were purchased from CLEA Japan, Inc. (Tokyo, Japan). Ccndbp1 knockout mice (n = 50, 8 weeks of age, and 25–30 g) were kindly provided by Yamaguchi University. The mice were housed in specific pathogen-free facilities under standard conditions at a temperature of 20–23 °C and humidity of 45–55% and were fed a standard diet.
2.4. Irradiation
The cells and mice were irradiated with X-ray at 160.0 kV, 5.0 mA, 400 mm, and 0.8 Gy/min for 3 minutes and at 160.0 kV, 5.0 mA, 400 mm, and 1 Gy/min for 10 min using MBR-1605RA (Hitachi Power Solutions Co., Ltd., Hitachi, Ibaraki, Japan). The samples from the cells were collected at appropriate time points, and animals were sacrificed at 12 h after irradiation for tissue collection according to the previous reports [23,24] and preliminary results.
2.5. Cell Growth Assay
Mock-HLE, Mock-HepG2, CCNDBP1-HLE, and CCNDBP1-HepG2 cells were plated in 96-well tissue culture dishes at 1 × 10⁴ cells per well in 100 μL of the aforementioned medium and were treated with and without X-ray (0.8 Gy/min, 3 min) or 20 µM of cisplatin (CDDP). The reagent 3-(4,5-dimethylthiazol-2-yl)-2,5-diphenyltetrazolium bromide (MTT) was added to the cells at the indicated times after treatment, followed by counting with Premix WST-1 Cell Proliferation Assay System (Takara Inc., Kyoto, Japan), according to the instructions supplied.
2.6. Western Blotting
The cells and tissues samples from the mice were collected for Western blotting at the appropriate time points; suspended in phosphate-buffered saline; and mixed with an equal volume of lysis buffer, 50-mM Tris–HCl (pH 8.0), 1.5% TritonX-100, 150-mM NaCl, 1-mM CaCl2, 1-mM MgCl2, and protease inhibitor; and homogenized with an electric homogenizer. The extract was subjected to gel electrophoresis using 8–16% MINI-PROTEAN TGX Stain Free Gels (No. 456-8105; Bio-Rad Laboratories, Inc., Hercules, CA, USA) and blotted onto PVDF membranes (Transfer Pack, No. 1704156; Bio-Rad Laboratories, Inc., Hercules, CA, USA) by Trans-Blot Turbo (No. 1704150J1; Bio-Rad Laboratories, Inc., Hercules, CA, USA) using either 10× Tris/ Glycine/ SDS buffer (No. 161-0732; Bio-Rad Laboratories, Inc., Hercules, CA, USA) or 10× Tris/ CAPS Buffer (No. 161-0778; Bio-Rad Laboratories, Inc., Hercules, CA, USA). The membranes were then blocked by EzBlockChemi (AE-1475; ATTO Corporation Taito-ku, Tokyo, Japan). The following antibodies were used to detect the proteins:
Anti-CCNDBP1 (ab220275, Abcam, Cambridge, UK) at 1:2000 dilution; anti-EZH2 antibody (ab186006, Abcam) at 1:1000 dilution; anti-ATM antibody (ab78, Abcam) at 1:2000 dilution; anti-phospho S1981 ATM antibody (ab36810, Abcam) at 1:1000 dilution, anti-Chk2 antibody (No. 2662, Cell Signaling Technology, Inc., Danvers, MA, USA) at 1:1000 dilution; anti-phospho Chk2 (Thr68) antibody (No. 2661, Cell Signaling Technology, Inc., Danvers, MA, USA) at 1:1000 dilution; anti-Chk1 antibody (ab47574, Abcam) at 1:1000 dilution; anti-phospho Chk1 (S345) antibody (ab58567, Abcam) at 1:1000 dilution; anti-ATR antibody (ab2905, Abcam) at 1:10,000 dilution; anti-phospho ATR (T1989) antibody (ab227851, Abcam) at 1:3000 dilution; anti-Cdc25C antibody (ab226958, Abcam) at 1:1000 dilution; anti-CyclinD1 antibody (ab134175, Abcam) at 1:10,000 dilution; anti-p53 antibody (ab131442, Abcam) at 1:1000 dilution; anti-p21 antibody (ab188224, Abcam) at 1:1000 dilution; antimouse immunoglobulin G horseradish peroxidase (NA931-1ML; GE Healthcare Life Sciences, Pittsburgh, PA, USA); and antirabbit immunoglobulin G horseradish peroxidase (NA934-1ML; GE Healthcare Life Sciences, Pittsburgh, PA, USA). Protein bands were visualized using EzWestLumi plus (WSE-7120L; ATTO Corporation, Taito-ku, Tokyo, Japan) and LuminoGraphI (WSE-6100; ATTO Corporation, Taito-ku, Tokyo, Japan).
2.7. Histological Analysis
Tissues of thymus, spleen, and liver were collected at appropriate time points after the procedures and fixed in 10% formalin before embedding in paraffin for hematoxylin and eosin and immunohistochemical staining. Immunohistochemical staining was conducted with an anti-ATM antibody (ab78, Abcam, Cambridge, UK) at 1:1000 dilution and an anti-phospho S1981 ATM antibody (ab36810, Abcam, Cambridge, UK) at 1:250 dilution using the Vectastain Elite ABC mouse IgG kit (PK-6102, Vector Laboratories, Burlingame, CA, USA); an anti-CHK2 antibody (No. 2662, Cell Signaling Technology, Inc., Danvers, MA, USA) at 1:200 dilution; an anti-phospho Thr68 CHK2 antibody (No. 2661, Cell Signaling Technology, Inc., Danvers, MA, USA) at 1:100 dilution; an anti-ATR antibody (ab222820, Abcam, Cambridge, UK) at 1:100 dilution; an anti-phospho T1989 ATR antibody (ab223258, Abcam, Cambridge, UK) at 1:100 dilution; an anti-CHK1 antibody (ab47574, Abcam, Cambridge, UK) at 1:250 dilution; an anti-phospho S345 Chk1 antibody (ab47318, Abcam, Cambridge, UK) at 1:100 dilution; and an anti-KMT6/EZH2 antibody (ab191080, Abcam, Cambridge, UK) at 1:250 dilution using the Vectastain Elite ABC rabbit IgG kit (PK-6101, Vector Laboratories, Burlingame, CA, USA) and 3,3′-diaminobenzidine chromogen tablets (Muto Pure Chemicals, Tokyo, Japan). Thereafter, images from each tissue section were captured randomly, and quantitative analysis was performed with ImageJ software (version 1.6.0_20; National Institutes of Health, Bethesda, MD, USA) with an RGB-based protocol, as reported previously [28].
2.8. Microarray and Bioinformatic Analyses
The SurePrint G3 Human Gene Expression (v2) Microarray Kit (Agilent Technologies, Inc., Santa Clara, CA, USA) and SurePrint G3 Mouse Gene Expression (v2) Microarray Kit (Agilent Technologies, Inc., Santa Clara, CA, USA) GeneSpring GX, version 14.5.1 (Agilent Technologies, Inc., Santa Clara, CA, USA), were used to compare the gene expression levels in mock-transfected cells and in hepatocytes from CCNDBP1-transfected HLE and Ccndbp1 knockout mice and wild mice. There were 6597 of the 26,083 genes in human and 7530 of the 27,122 genes in mice that were clustered hierarchically according to the level of gene expression, with more than two-fold differences in expression. The gene ontology terms were selected on the basis of Fisher’s exact test, followed by the Benjamini–Yekutieli correction method. The expressions in the genes were compared among the groups; genes with more than fivefold differences in expression were shown in the heat map.
2.9. Statistical Analyses
The obtained data were analyzed with either one-way or two-way factor repeated measures analysis of variance, followed by Bonferroni’s multiple comparison test or Student’s t-test using GraphPad Prism7 software (version 8.4.3; GraphPad, San Diego, CA, USA). A p value of ≤ 0.05 was considered to indicate statistical significance.
3. Results
3.1. Effect of CCNDBP1 Expression in HCC Cells on X-ray Irradiation
To examine the molecular function of CCNDBP1 on liver cancer cells, we produced CCNDBP1-overexpressing cell lines by transfecting plasmid DNA-expressing human CCNDBP1 into cancer cell lines of HLE and HepG2. Figure 1a shows the CCNDBP1 gene and CCNDBP1 protein expression in the transfected HLE and HepG2 cell lines. A slight endogenous level of CCNDBP1 expression can be seen in the cells, whereas significant overexpression of CCNDBP1 was achieved by the transfection. Compared with the mock-transfected cells, the CCNDBP1-overexpressing cells showed increased growth ratio in the culture condition containing 10% FCS, as determined by the MTT assay (Figure 1b,c). After irradiation, the CCNDBP1-expressing cell lines showed significantly higher growth rate than did the mock-transfected cells, in which cell growth was inhibited by X-ray (Figure 1d,e); this difference was not seen when treated with 20 µM of CDDP (Figure 1f,g). These results indicated that CCNDBP1 overexpression in HCC stimulated cell growth under 10% FCS and resistance to X-ray.
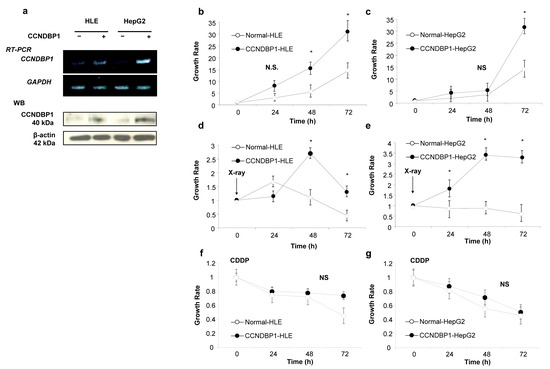
Figure 1.
Effect of CCNDBP1 expression on HCC cell growth. The development of CCNDBP1-overexpressing cell lines and the cell growth of hepatocellular carcinoma (HCC) cell lines and the permanent clones overexpressing CCNDBP1 were determined by 3-(4,5-Dimethylthiazol-2-yl)-2,5-diphenyltetrazolium bromide (MTT) assay. (a) Representative reverse transcription polymerase chain reaction (RT-PCR) of CCNDBP1 and glyceraldehyde 3 phosphate dehydrogenase (GAPDH) and Western blotting (WB) of CCNDBP1 and β-actin are shown. (b,c) Growth of cell lines in normal culture condition with 10% fetal bovine serum. (d,e) Cell growth after irradiation with 0.8 Gy of X-ray. (f,g) Cell growth with 20 µM of CDDP. The values represent mean ± standard deviation (n = 3 for each group at the time points). * p < 0.05 and no statistical significance (NS) on two-way analysis of variance followed by Bonferroni’s multiple comparison test.
3.2. Gene Expression Analyses in CCNDBP1-Overexpressed Cells and Ccndbp1 Knockout Mice
To determine the molecular mechanism of CCNDBP1, the gene expression in mock-transfected and CCNDBP1-transfected HLE (Figure 2) and Ccndbp1 knockout mice and wild type mice (Figure 3) were compared using DNA microarray analyses. The analysis of gene ontology terms after the hierarchical clustering of genes showed gene differences in terms of molecular function, catalytic activity, nucleotide, DNA, binding, and negative regulation if transcribed from RNA polymerase II promoter, RNA polymerase II regulatory region sequence-specific DNA binding, and nuclear chromatin in both cell and mice (Figure 2c,d and Figure 3c,d). Among the genes involved in these terms and those that showed more than two-fold difference in all comparisons of cells and mice with X-ray irradiation, we focused on the enhancer of zeste homolog 2 (EZH2), which showed expression differences both in vitro and in vivo (Figure 2e and Figure 3e). EZH2 is an epigenetic silencer of the polycomb repressor complex 2 [29,30]; a negative regulator of DNA damage-related proteins of ATM [31] involved in the X-ray-induced DNA damage; and has been associated with the prognosis of several cancer entities [29,30,31]. The EZH2 gene expression was lower in the CCNDBP1-overexpressed cell lines than in the mock-transfected cell lines and was lower in the irradiated CCNDBP1-overexpressed cell lines than in the nonirradiated CCNDBP1-overexpressed cells. These results implied that CCNDBP1 expression and irradiation inhibited EZH2 expression. These findings were confirmed in the in vivo gene expression analysis. Figure 3e shows higher Ezh2 in the Ccndbp1 knockout mice under normal housing and after X-ray irradiation than in the wild type mice. Irradiation did not decrease the Ezh2 expression in the Ccndbp1 knockout mice (Figure 3e). Overall, these results indicated that Ccndbp1 controlled the expression of Ezh2 in an inhibitory manner and that irradiation decreased Ezh2 expression in a Ccndbp1-dependent manner.
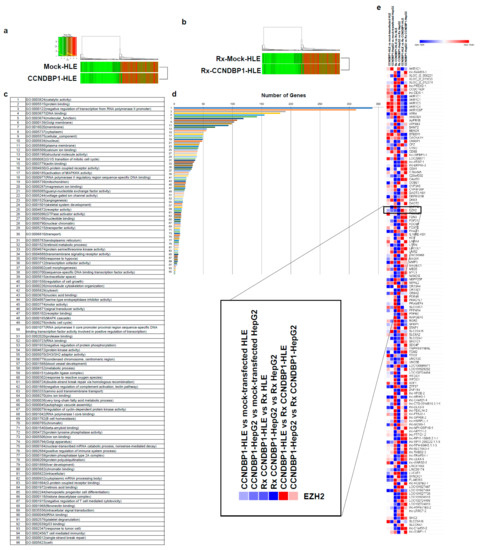
Figure 2.
Microarray analyses in vitro. (a) Microarray analyses were performed to compare the levels of gene expression in mock-transfected HLE and CCNDBP1-transfected HLE. (b) X-ray irradiated mock-transfected HLE and X-ray irradiated CCNDBP1-transfected HLE. A total of 6597 genes with more than two-fold differences in expression were clustered hierarchically according to the level of gene expression. The color represents the expression level of the gene; green represents low degree of change in expression, whereas red represents high degree of change of expression. The color key and histogram are shown. (c) The gene ontology terms related with the genes that have more than two-fold differences between the mock-transfected HLE and CCNDBP1-transfected HLE are shown. (d) The number of genes included in each ontology are shown. (e) The expression level of genes showed more than two-fold changes in all comparisons between CCNDBP1-HLE and mock-transfected HLE, CCNDBP1-HepG2 and mock-transfected HepG2, Rx CCNDBP1-HLE and Rx mock-transfected HLE, Rx CCNDBP1-HepG2 and Rx mock-transfected HepG2, CCNDBP1-HLE and Rx CCNDBP1-HLE, and CCNDBP1-HepG2 and Rx CCNDBP1-HepG2. Rx, X-ray irradiation.
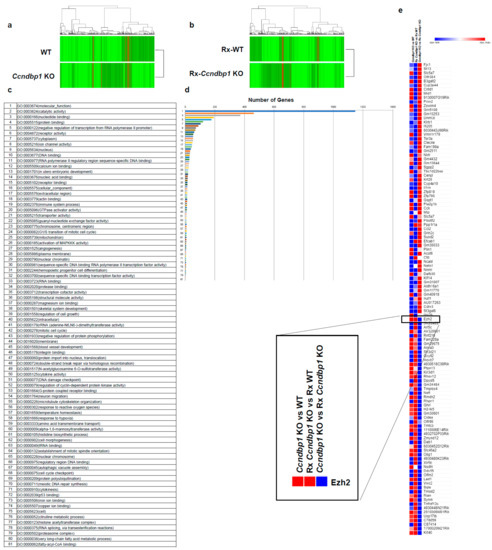
Figure 3.
Microarray analyses in vivo. (a) Microarray analyses were performed to compare the levels of gene expression in WT and Ccndbp1 KO mice. (b) X-ray irradiated WT and Ccndbp1 KO mice. A total of 7530 genes with more than two-fold differences in the expression were clustered hierarchically according to level of gene expression. The color represents the expression level of the gene; green represents low degree of change in expression, whereas red represents high degree of change of expression. The color key and histogram are shown. (c) The gene ontology terms related with the genes that have more than two-fold differences between the WT and Ccndbp1 KO mice are shown. (d) The number of genes included in each ontology is shown. (e) The expression level of genes showed more than two-fold changes in all comparisons between Ccndbp1 KO and WT, Rx Ccndbp1 KO and Rx WT, and Ccndbp1 KO and Rx Ccndbp1 KO. WT, wild type; KO, knockout; Rx, X-ray irradiation.
3.3. CCNDBP1 Expression and DNA Damage-Related Proteins
Based on the results obtained from the cell growth assay and microarray analyses of the cell lines, we examined the DNA damage-related proteins ATM and CHK2, which are involved in X-ray-induced DNA damage. Figure 4a shows the representative results of the Western blotting of the HLE cell lines, and Figure 2b summarizes the results of protein expression in the HLE and HepG2 cell lines. The expression of CCNDBP1 was activated by irradiation in a time-dependent manner, and it inhibited the expression of EZH2 protein, which is a negative regulator of ATM [31]. The X-ray irradiation induced the phosphorylation of ATM protein by inhibiting EZH2 expression after 24 h (Figure 4). In addition, overexpression of CCNDBP1 showed continuous inhibition of EZH2, followed by sustained phosphorylation of ATM for at least for 72 h after irradiation. Following the activation of ATM, CHK2 was continuously activated by its phosphorylation in the CCNDBP1-overexpressed cells. In addition, the higher increase in p53 and p21, inhibition of cdc25C, and gradual increase of cyclin D1 expression in the CCNDBP1-expressed cells than in the mock-transfected cells indicated cell cycle arrest upon irradiation and recovery of the tumor growth (Figure 4). Based on these results obtained in the in vitro assay, we next examined the molecular mechanisms of Ccndbp1 in vivo using Ccndbp1 knockout mice.
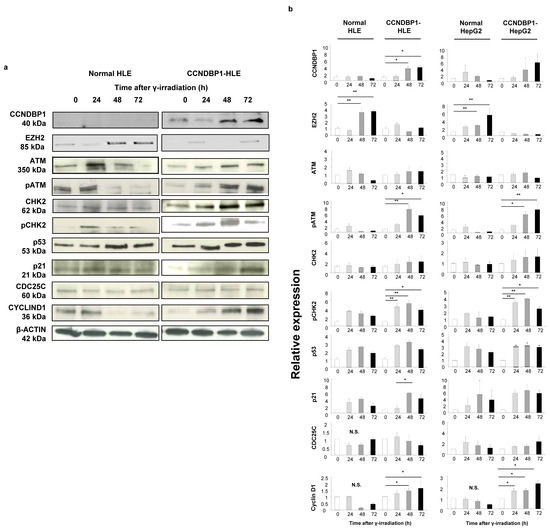
Figure 4.
Effect of CCNDBP1 on the changes in various proteins in HCC cells after X-ray irradiation. (a) Western blotting of proteins related with the ATM–CHK2 pathway in the cells harvested at the indicated times after X-ray irradiation (immediately and at 24, 48, and 72 h). (b) The relative expression ratios of the proteins are shown. The values represent mean ± standard deviations (n = 5), * p < 0.05, ** p < 0.01 on one-way analysis of variance followed by Bonferroni’s multiple comparison test. CCNDBP1, cyclin d1 binding protein 1; EZH2, enhancer of zeste homolog 2; ATM, ataxia telangiectasia mutated; pATM, phosphorylated ataxia telangiectasia mutated; CHK2, checkpoint kinase 2; pCHK2, phosphorylated checkpoint kinase 2; CDC25C, cell division cycle 25 homolog C.
3.4. Effect of Ccndbp1 In Vivo
The effect of Ccndbp1 gene in mice was examined using the tissues collected from wild and Ccndbp1 knockout mice before and after X-ray irradiation. Figure 5a shows the representative results of the Western blotting of thymus tissue. After irradiation, the expression levels of the Atm and Chk2 proteins were not different in both mice, but there was suppressed phosphorylation of the Atm and Chk2 proteins in the thymus cells, which are mostly lymphocytes, in the knockout mice, compared with that in the wild type mice (Figure 5a). In addition, the expression of Ezh2 was higher in the knockout mice than in the wild type mice (Figure 5a).
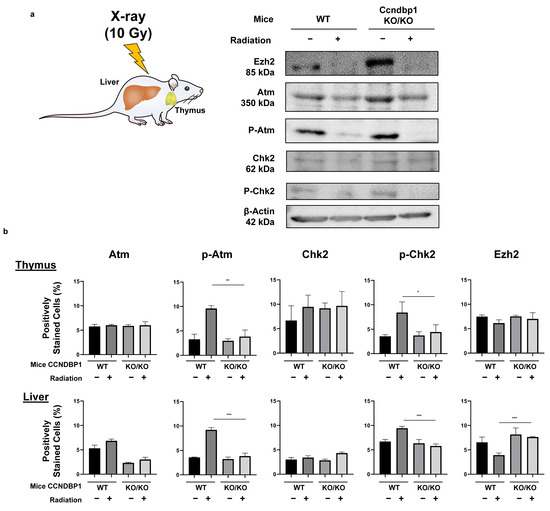
Figure 5.
Effect of Ccndbp1 on the changes in various proteins in X-ray irradiated mice. (a) Western blotting of proteins related with the ATM–CHK2 pathway in mice thymic tissue harvested 12 h after X-ray irradiation. (b) Quantitative analyses of the immunohistochemical analyses of proteins in the thymus and liver of wild (WT) and Ccndbp1 knockout (KO) mice with or without X-ray irradiation. Representative images and a quantitative analysis of positively stained area are shown. The scale bar represents 100 µm. The values represent mean ± standard deviations (n = 5–6), * p < 0.05, ** p < 0.01, *** p < 0.001 on one-way analysis of variance followed by Bonferroni’s multiple comparison test.
These results were confirmed with immunohistochemical staining of thymic and hepatic tissues. Figure 5b summarizes the results of the analysis of the protein expressions in the thymus and liver based on immunohistochemical staining (representative images are shown in Figure S1). The hepatocytes showed similar findings, with more clear differences and maintained expression of Ezh2 when irradiated (Figure 5b). The thymic tissues showed a relatively mild difference in Ezh2 expression. These results suggested that Ccndbp1 activated the Atm–Chk2 pathway through inhibition of Ezh2 expression. Therefore, knockout of Ccndbp1 caused Ezh2 activation, which led to insufficiency of the Atm–Chk2 pathway and suppression of Chk2 phosphorylation upon irradiation in the knockout mice.
4. Discussion
In this study, we aimed to assess the molecular mechanism of CCNDBP1 and focused on the recovery from DNA damage. Indeed, our results demonstrated that CCNDBP1 overexpression in HCC contributed to higher cell growth and resistance to X-ray-induced DNA damage and that this mechanism was dependent on the activation of the ATM–CHK2 pathway in cancer cells. These results were supported by the fact that abnormal activation of the ATM–CHK2 pathway had been associated with resistance to chemoradiotherapy and poor prognosis in nasal extranodal NK/T cell lymphoma [32]. Moreover, our results demonstrated that CCNDBP1-overexpressed cell lines have gained resistance to X-ray irradiation but not to cisplatin. This difference was partly explained by Ziegler et al., who reported that ionizing radiation caused the formation of numerous DSB and triggered a substantial activation of ATM–CHK2 signaling [33]; however, the DNA crosslinking agents of cisplatin triggered a substantial blockage of transcription, which was not reflected by an appreciable number of DSB and did not increase the expression of the ATM–CHK2 pathway [33]. In addition, we demonstrated that the suppressive effect of CCNDBP1 on EZH2, which is a histone H3K27 methyltransferase that was reported to be a negative regulator of ATM [31], contributed to the activation of the ATM–CHK2 pathway. This result was supported by a previous report showing that decreased EZH2 expression increased ATM phosphorylation and induced resistance to anticancer treatment [30]. These results were further supported by our analyses, which showed weaker activation of the ATM–CHK2 pathway after X-ray irradiation on the liver, spleen, and thymus in Ccndbp1 knockout mice. Recently, it has been reported that the expression of CCNDBP1 gene could be regulated by DNA methylation [34]. This mechanism might be related with the modification of CCNDBP1 expression in normal cells to gain malignant potential in the early stage of malignant transformation [10] and in cancer cells to be chemoresistant [25].
The limitations of our study included the lack of molecular-based analysis of the direct link between CCNDBP1 and EZH2 and of human HCC samples to enable application of the results to radiotherapy and chemotherapy resistance. In one report on progressive prostate cancer despite standard treatments, high response to chemotherapy was seen when the DNA repair system was inhibited by Olaparib, which is a poly adenosine diphosphate–ribose polymerase [35]. Similarly, CCNDBP1 can be a therapeutic target in HCC with poor response to conventional therapy. Therefore, further basic research that will focus on the molecular mechanisms of CCNDBP1 and EZH2, carcinogenic assay using Ccndbp1 knockout mice with DNA damaging agents, and analyses of human samples will further bring important information. In addition, while we have utilized the male mice in this study to reduce the possible physiological stress caused by the menstrual cycles, future studies comparing the different functions of Ccndbp1 based on sex may further reveal its mechanism.
5. Conclusions
According to our results, CCNDBP1 contributed to the activation of the ATM–CHK2 pathway by inhibiting EZH2 to ameliorate DNA damage. Therefore, management of CCNDBP1 expression in the tumor may recover the sensitivity to anticancer therapy.
Supplementary Materials
The following are available online at https://www.mdpi.com/article/10.3390/jcm11030851/s1, Figure S1: Representative images of the immunohistochemical staining of the ATM–CHK2 pathway-related proteins in the thymus and liver of wild (WT) and Ccndbp1 knockout (KO) mice with or without irradiation of X-ray.
Author Contributions
Y.N., K.K., K.O., and S.T. conceived and supervised the study. Y.N., K.K., and K.O. designed the experiments. Y.N., K.O., C.O., Y.T., R.H., M.O., H.M., N.Y., T.T., S.O., K.F., M.K., T.O., A.K., O.S., S.M., N.S., H.A., T.Y., A.S., and H.K. collected the samples and performed the experiments. Y.N., K.O., K.K., and S.T. analyzed the data. K.K. and S.T. wrote the first draft of the manuscript. All authors have read and agreed to the published version of the manuscript.
Funding
The research in the authors’ laboratories has been supported in part by a Grant-in-Aid for Scientific Research from the Japanese Society for the Promotion of Sciences 26293175 to Shuji Terai and a grant provided by the Ichiro Kanehara Foundation to Kenya Kamimura.
Institutional Review Board Statement
All animal experiments were approved by and conducted in full compliance with the regulations of the Institutional Animal Care and Use Committee at Niigata University, Niigata, Japan (protocol code SA00293, approved on 30 June 2018).
Informed Consent Statement
Not applicable.
Acknowledgments
The authors would like to thank Takao Tsuchida of the Division of Gastroenterology and Hepatology of Niigata University for his excellent assistance in the histological analyses; Nobuyoshi Fujisawa, Kanako Oda, Shuko Adachi, Toshikuni Sasaoka, and all staff members of the Division of Laboratory Animal Resources of Niigata University; Tomoaki Murata of the Science Research Center, Institute of Life Science and Medicine of Yamaguchi University, Organization for Research Initiatives.
Conflicts of Interest
The authors declare no conflict of interest.
References
- Seto, A.; Ikushima, H.; Suzuki, T.; Sato, Y.; Fukai, S.; Yuki, K.; Miyazawa, K.; Miyazono, K.; Ishitani, R.; Nureki, O. Crystallization and preliminary X-ray diffraction analysis of GCIP/HHM transcriptional regulator. Acta Crystallogr. Sect. F Struct. Biol. Cryst. Commun. 2009, 65, 21–24. [Google Scholar] [CrossRef]
- Ishii, R.; Isogaya, K.; Seto, A.; Koinuma, D.; Watanabe, Y.; Arisaka, F.; Yaguchi, S.; Ikushima, H.; Dohmae, N.; Miyazono, K.; et al. Structure of a dominant-negative helix-loop-helix transcriptional regulator suggests mechanisms of autoinhibition. EMBO J. 2012, 31, 2541–2552. [Google Scholar] [CrossRef] [Green Version]
- Xia, C.; Bao, Z.; Tabassam, F.; Ma, W.; Qiu, M.; Hua, S.; Liu, M. GCIP, a novel human grap2 and cyclin D interacting protein, regulates E2F-mediated transcriptional activity. J. Biol. Chem. 2000, 275, 20942–20948. [Google Scholar] [CrossRef] [PubMed] [Green Version]
- Terai, S.; Aoki, H.; Ashida, K.; Thorgeirsson, S.S. Human homologue of maid: A dominant inhibitory helix-loop-helix protein associated with liver-specific gene expression. Hepatology 2000, 32, 357–366. [Google Scholar] [CrossRef]
- Ma, W.; Stafford, L.J.; Li, D.; Luo, J.; Li, X.; Ning, G.; Liu, M. GCIP/CCNDBP1, a helix-loop-helix protein, suppresses tumorigenesis. J. Cell. Biochem. 2007, 100, 1376–1386. [Google Scholar] [CrossRef] [PubMed]
- Xu, W.; Cao, M.; Zheng, H.; Tan, X.; Li, L.; Cui, G.; Xu, J.; Cao, J.; Ke, K.; Wu, Q. Upregulation of SYF2 is associated with neuronal apoptosis caused by reactive astrogliosis to neuroinflammation. J. Neurosci. Res. 2014, 92, 318–328. [Google Scholar] [CrossRef] [PubMed]
- Zhu, J.; Ji, L.; Zhang, J.; Yang, L.; Guan, C.; Wang, Y.; Zhu, J.; Liang, L.; Ni, R. Upregulation of SYF2 in esophageal squamous cell carcinoma promotes tumor cell proliferation and predicts poor prognosis. Tumour Biol. 2014, 35, 10275–10285. [Google Scholar] [CrossRef] [PubMed]
- Sang, A.; Yang, X.; Chen, H.; Qin, B.; Zhu, M.; Dai, M.; Zhu, R.; Liu, X. Upregulation of SYF2 relates to retinal ganglion cell apoptosis and retinal glia cell proliferation after light-induced retinal damage. J. Mol. Neurosci. 2015, 56, 480–490. [Google Scholar] [CrossRef]
- Chellas-Géry, B.; Linton, C.N.; Fields, K.A. Human GCIP interacts with CT847, a novel Chlamydia trachomatis type III secretion substrate, and is degraded in a tissue-culture infection model. Cell. Microbiol. 2007, 9, 2417–2430. [Google Scholar] [CrossRef]
- Takami, T.; Terai, S.; Yokoyama, Y.; Tanimoto, H.; Tajima, K.; Uchida, K.; Yamasaki, T.; Sakaida, I.; Nishina, H.; Thorgeirsson, S.S.; et al. Human homologue of maid is a useful marker protein in hepatocarcinogenesis. Gastroenterology 2005, 128, 1369–1380. [Google Scholar] [CrossRef] [PubMed]
- Huang, Y.; Chen, B.; Ye, M.; Liang, P.; Zhangfang, Y.; Huang, J.; Liu, M.; Songyang, Z.; Ma, W. Ccndbp1 is a new positive regulator of skeletal myogenesis. J. Cell. Sci. 2016, 129, 2767–2777. [Google Scholar] [CrossRef] [PubMed] [Green Version]
- Ikushima, H.; Komuro, A.; Isogaya, K.; Shinozaki, M.; Hellman, U.; Miyazawa, K.; Miyazono, K. An Id-like molecule, HHM, is a synexpression group-restricted regulator of TGF-beta signalling. EMBO J. 2008, 27, 2955–2965. [Google Scholar] [CrossRef] [Green Version]
- Sonnenberg-Riethmacher, E.; Wustefeld, T.; Miehe, M.; Trautwein, C.; Riethmacher, D. Maid (GCIP) is involved in cell cycle control of hepatocytes. Hepatology 2007, 45, 404–411. [Google Scholar] [CrossRef] [PubMed]
- Ma, W.; Xia, X.; Stafford, L.J.; Yu, C.; Wang, F.; LeSage, G.; Liu, M. Expression of GCIP in transgenic mice decreases susceptibility to chemical hepatocarcinogenesis. Oncogene 2006, 25, 4207–4216. [Google Scholar] [CrossRef] [PubMed] [Green Version]
- Chang, T.W.; Chen, C.C.; Chen, K.Y.; Su, J.H.; Chang, J.H.; Chang, M.C. Ribosomal phosphoprotein P0 interacts with GCIP and overexpression of P0 is associated with cellular proliferation in breast and liver carcinoma cells. Oncogene 2008, 27, 332–338. [Google Scholar] [CrossRef] [PubMed] [Green Version]
- Fujisawa, K.; Terai, S.; Matsumoto, T.; Takami, T.; Yamamoto, N.; Nishina, H.; Furutani-Seiki, M.; Sakaida, I. Evidence for a role of the transcriptional regulator maid in tumorigenesis and aging. PLoS ONE 2015, 10, e0129950. [Google Scholar] [CrossRef] [PubMed]
- Su, T.; Deguchi, A.; Yao, Y.; Luo, J.; Weinstein, I.B. Dip1 inhibits growth and gene transcription in MCF-7 breast cancer cells. J. Exp. Ther. Oncol. 2007, 6, 117–127. [Google Scholar]
- Chen, W.C.; Su, P.F.; Jin, Y.T.; Chang, M.C.; Chang, T.W. Immunohistochemical expression of GCIP in breast carcinoma: Relationship with tumour grade, disease-free survival, mucinous differentiation and response to chemotherapy. Histopathology 2008, 53, 554–560. [Google Scholar] [CrossRef]
- Lee, I.; Yeom, S.Y.; Lee, S.J.; Kang, W.K.; Park, C. A novel senescence-evasion mechanism involving Grap2 and Cyclin D interacting protein inactivation by Ras associated with diabetes in cancer cells under doxorubicin treatment. Cancer Res. 2010, 70, 4357–4365. [Google Scholar] [CrossRef] [Green Version]
- Chen, K.Y.; Chen, C.C.; Tseng, Y.L.; Chang, Y.C.; Chang, M.C. GCIP functions as a tumor suppressor in non-small cell lung cancer by suppressing Id1-mediated tumor promotion. Oncotarget 2014, 5, 5017–5028. [Google Scholar] [CrossRef]
- Hélias-Rodzewicz, Z.; Lourenco, N.; Bakari, M.; Capron, C.; Emile, J.F. CDKN2A depletion causes aneuploidy and enhances cell proliferation in non-immortalized normal human cells. Cancer Investig. 2018, 36, 338–348. [Google Scholar] [CrossRef] [PubMed]
- Gong, H.; Gao, S.; Yu, C.; Li, M.; Liu, P.; Zhang, G.; Song, J.; Zheng, J. Effect and mechanism of YB-1 knockdown on glioma cell growth, migration, and apoptosis. Acta Biochim. Biophys. Sin. 2020, 52, 168–179. [Google Scholar] [CrossRef] [PubMed]
- Kamimura, K.; Ohi, H.; Kubota, T.; Okazuka, K.; Yoshikai, Y.; Wakabayashi, Y.; Aoyagi, Y.; Mishima, Y.; Kominami, R. Haploinsufficiency of Bcl11b for suppression of lymphomagenesis and thymocyte development. Biochem. Biophys. Res. Commun. 2007, 355, 538–542. [Google Scholar] [CrossRef] [PubMed]
- Kamimura, K.; Mishima, Y.; Obata, M.; Endo, T.; Aoyagi, Y.; Kominami, R. Lack of Bcl11b tumor suppressor results in vulnerability to DNA replication stress and damages. Oncogene 2007, 26, 5840–5850. [Google Scholar] [CrossRef] [Green Version]
- Baharudin, R.; Mutalib, N.-S.A.; Othman, S.N.; Sagap, I.; Rose, I.M.; Mokhtar, N.M.; Jamal, R. Identification of predictive DNA methylation biomarkers for chemotherapy response in colorectal cancer. Front. Pharmacol. 2017, 8, 47. [Google Scholar] [CrossRef] [PubMed] [Green Version]
- Motizuki, M.; Saitoh, M.; Miyazawa, K. Maid is a negative regulator of transforming growth factor-beta-induced cell migration. J. Biochem. 2015, 158, 435–444. [Google Scholar] [CrossRef] [PubMed]
- Liang, R.Y.; Liu, B.H.; Huang, C.J.; Lin, K.T.; Ko, C.C.; Huang, L.L.; Hsu, B.; Wu, C.Y.; Chuang, S.M. MEK2 is a critical modulating mechanism to down-regulate GCIP stability and function in cancer cells. FASEB J. 2020, 34, 1958–1969. [Google Scholar] [CrossRef] [PubMed]
- Vrekoussis, T.; Chaniotis, V.; Navrozoglou, I.; Dousias, V.; Pavlakis, K.; Stathopoulos, E.N.; Zoras, O. Image analysis of breast cancer immunohistochemistry-stained sections using ImageJ: An RGB-based model. Anticancer Res. 2009, 29, 4995–4998. [Google Scholar]
- Bremer, S.C.B.; Conradi, L.C.; Mechie, N.C.; Amanzada, A.; Mavropoulou, E.; Kitz, J.; Ghadimi, M.; Ellenrieder, V.; Ströbel, P.; Hessmann, E.; et al. Enhancer of zeste homolog 2 in colorectal cancer development and progression. Digestion 2021, 102, 227–235. [Google Scholar] [CrossRef]
- Naskou, J.; Beiter, Y.; van Rensburg, R.; Honisch, E.; Rudelius, M.; Schlensog, M.; Gottstein, J.; Walter, L.; Braicu, E.I.; Sehouli, J.; et al. EZH2 loss drives resistance to carboplatin and paclitaxel in serious ovarian cancers expressing ATM. Mol. Cancer Res. 2020, 18, 278–286. [Google Scholar] [CrossRef] [PubMed] [Green Version]
- Ahmad, F.; Patrick, S.; Sheikh, T.; Sharma, V.; Pathak, P.; Malgulwar, P.B.; Kumar, A.; Joshi, S.D.; Sarkar, C.; Sen, E. Telomerase reverse transcriptase (TERT)-enhancer of zeste homolog 2 (EZH2) network regulates lipid metabolism and DNA damage responses in glioblastoma. J. Neurochem. 2017, 143, 671–683. [Google Scholar] [CrossRef] [PubMed] [Green Version]
- Ye, Q.; Chen, H.; Wen, Z.; Guo, W.; Huang, Y.; Mo, X. Abnormal expression of p-ATM/CHK2 in nasal extranodal NK/T cell lymphoma, nasal type, is correlated with poor prognosis. J. Clin. Pathol. 2021, 74, 223–227. [Google Scholar] [CrossRef] [PubMed]
- Ziegler, V.; Deußen, M.; Schumacher, L.; Roos, W.P.; Fritz, G. Anticancer drug and ionizing radiation-induced DNA damage differently influences transcription activity and DDR-related stress responses of an endothelial monolayer. Biochim. Biophys. Acta Mol. Cell Res. 2020, 1867, 118678. [Google Scholar] [CrossRef] [PubMed]
- Yang, L.; Wu, Z.; Sun, W.; Luo, P.; Chen, S.; Chen, Y.; Yan, W.; Li, Y.; Wang, C. CCNDBP1, a prognostic marker regulated by DNA methylation, inhibits aggressive behavior in dedifferentiated liposarcoma via repressing epithelial mesenchymal transition. Front. Oncol. 2021, 11, 687012. [Google Scholar] [CrossRef] [PubMed]
- Mateo, J.; Carreira, S.; Sandhu, S.; Miranda, S.; Mossop, H.; Perez-Lopez, R.; Nava Rodrigues, D.; Robinson, D.; Omlin, A.; Tunariu, N.; et al. DNA-repair defects and olaparib in metastatic prostate cancer. N. Engl. J. Med. 2015, 373, 1697–1708. [Google Scholar] [CrossRef] [PubMed]
Publisher’s Note: MDPI stays neutral with regard to jurisdictional claims in published maps and institutional affiliations. |
© 2022 by the authors. Licensee MDPI, Basel, Switzerland. This article is an open access article distributed under the terms and conditions of the Creative Commons Attribution (CC BY) license (https://creativecommons.org/licenses/by/4.0/).