
Inter-Observer Agreement between Low-Dose and Standard-Dose CT with Soft and Sharp Convolution Kernels in COVID-19 Pneumonia

 ,
,  ,
,  , , ,
, , ,
Abstract
:1. Introduction
2. Hypotheses
- The CT0-4 grades assigned by readers for the same patient do not differ between CT and LDCT protocols reconstructed with the sharp or soft kernels;
- The inter-rater reproducibility of CT0-4 grades assigned by radiologists of different levels of experience does not depend on the kernel and protocol selection.
3. Materials and Methods
3.1. Case Selection
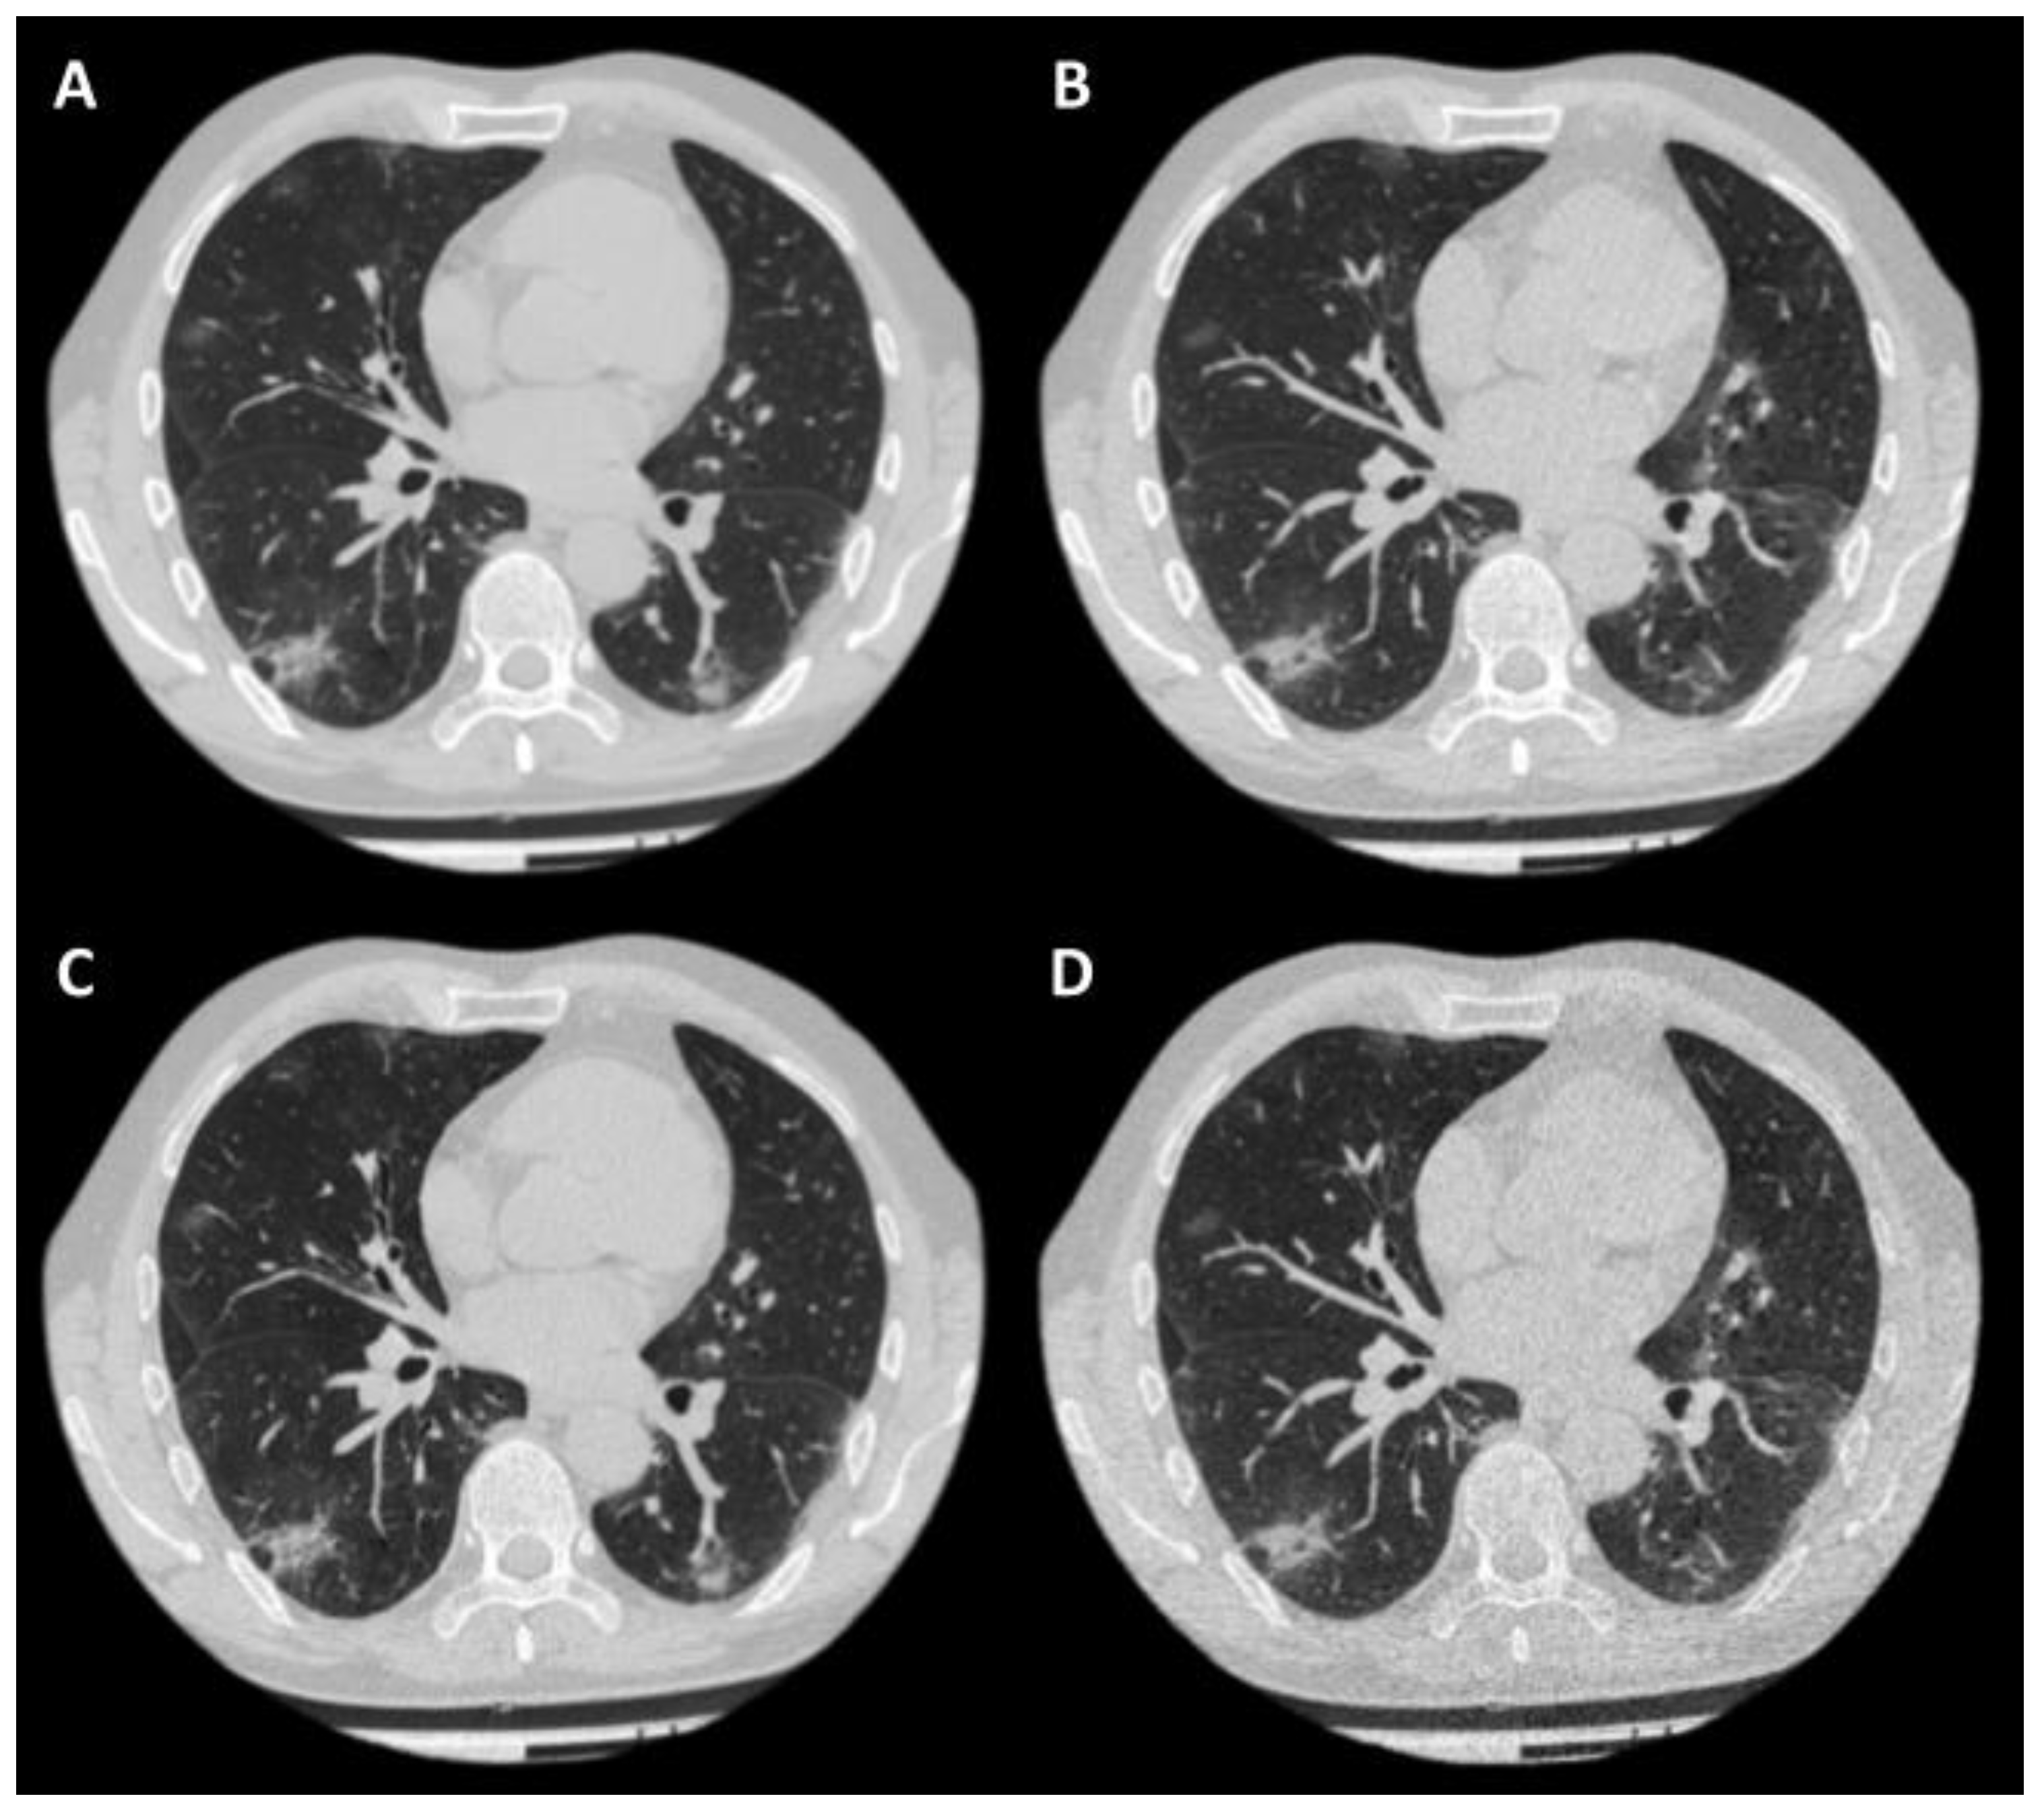
3.2. CT Acquisition
- (1)
- For a standard CT scan, the tube current was automatically adjusted over the entire scan length from 40 to 500 mA, with a noise level of 10 (standard deviation) for 5.0 mm slices.
- (2)
- For a low-dose CT scan, the current was automatically adjusted over the entire scan length from 10 to 500 mA, with a noise level of 36 for 5.0 mm slices.
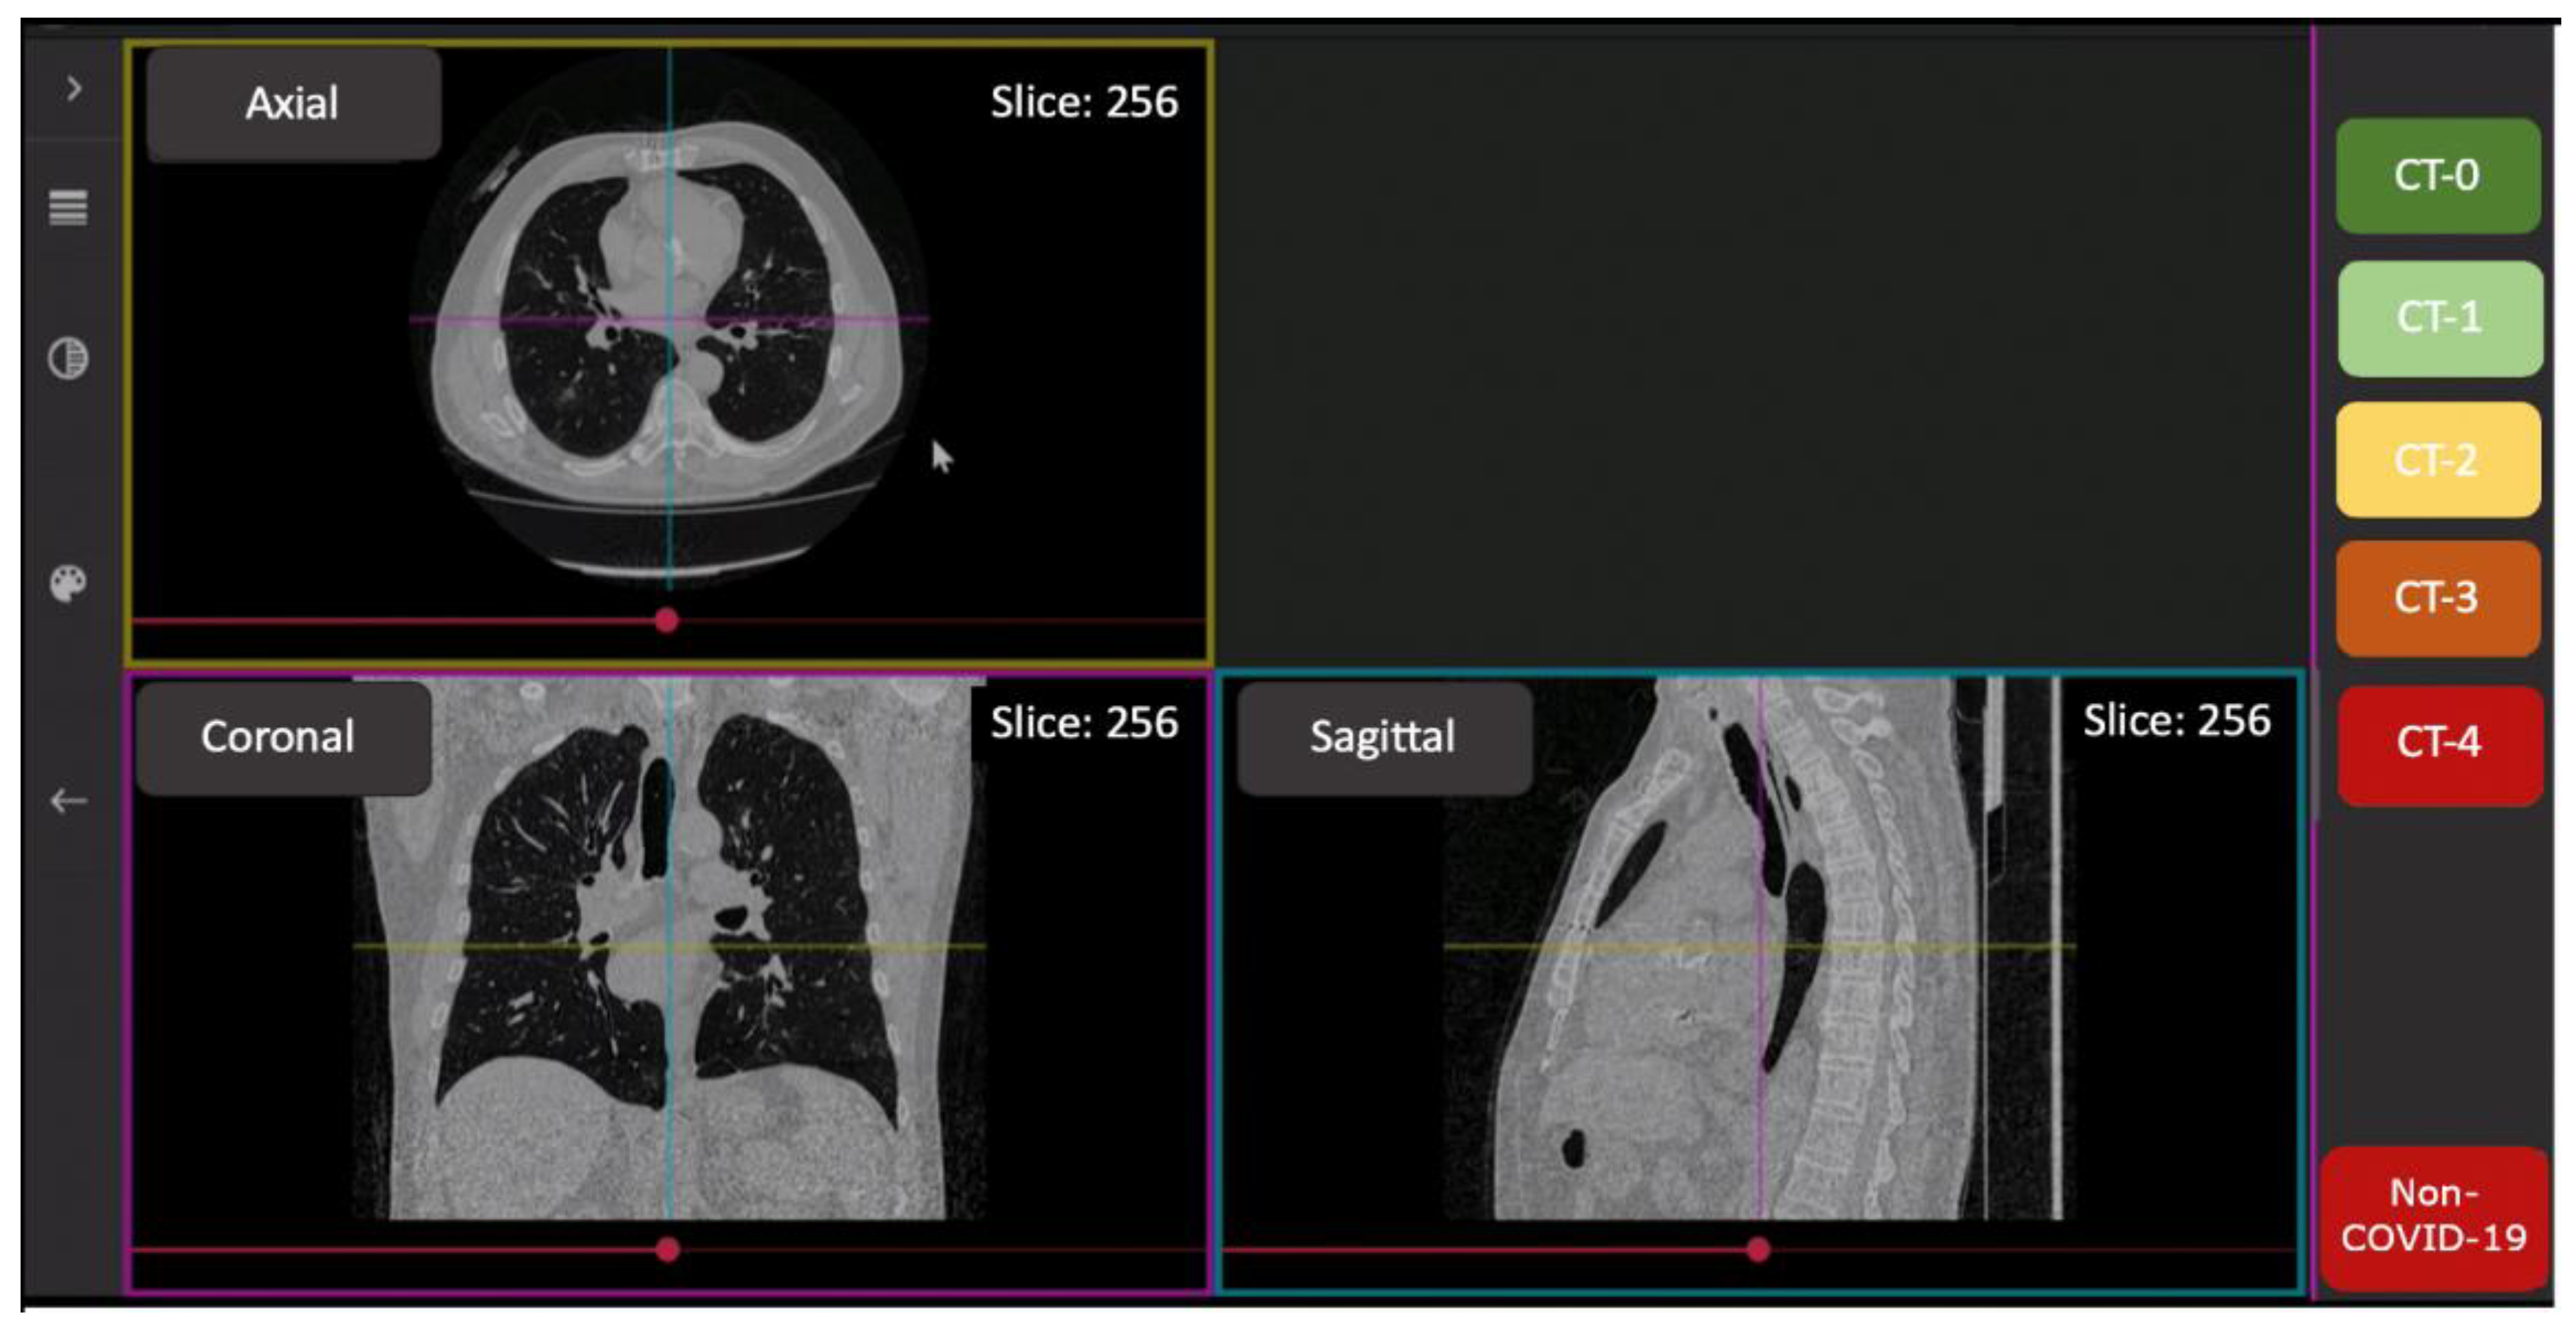
3.3. Image Analysis
3.4. Sample Size Consideration
3.5. Statistical Analysis
4. Results
4.1. Hypotheses Findings
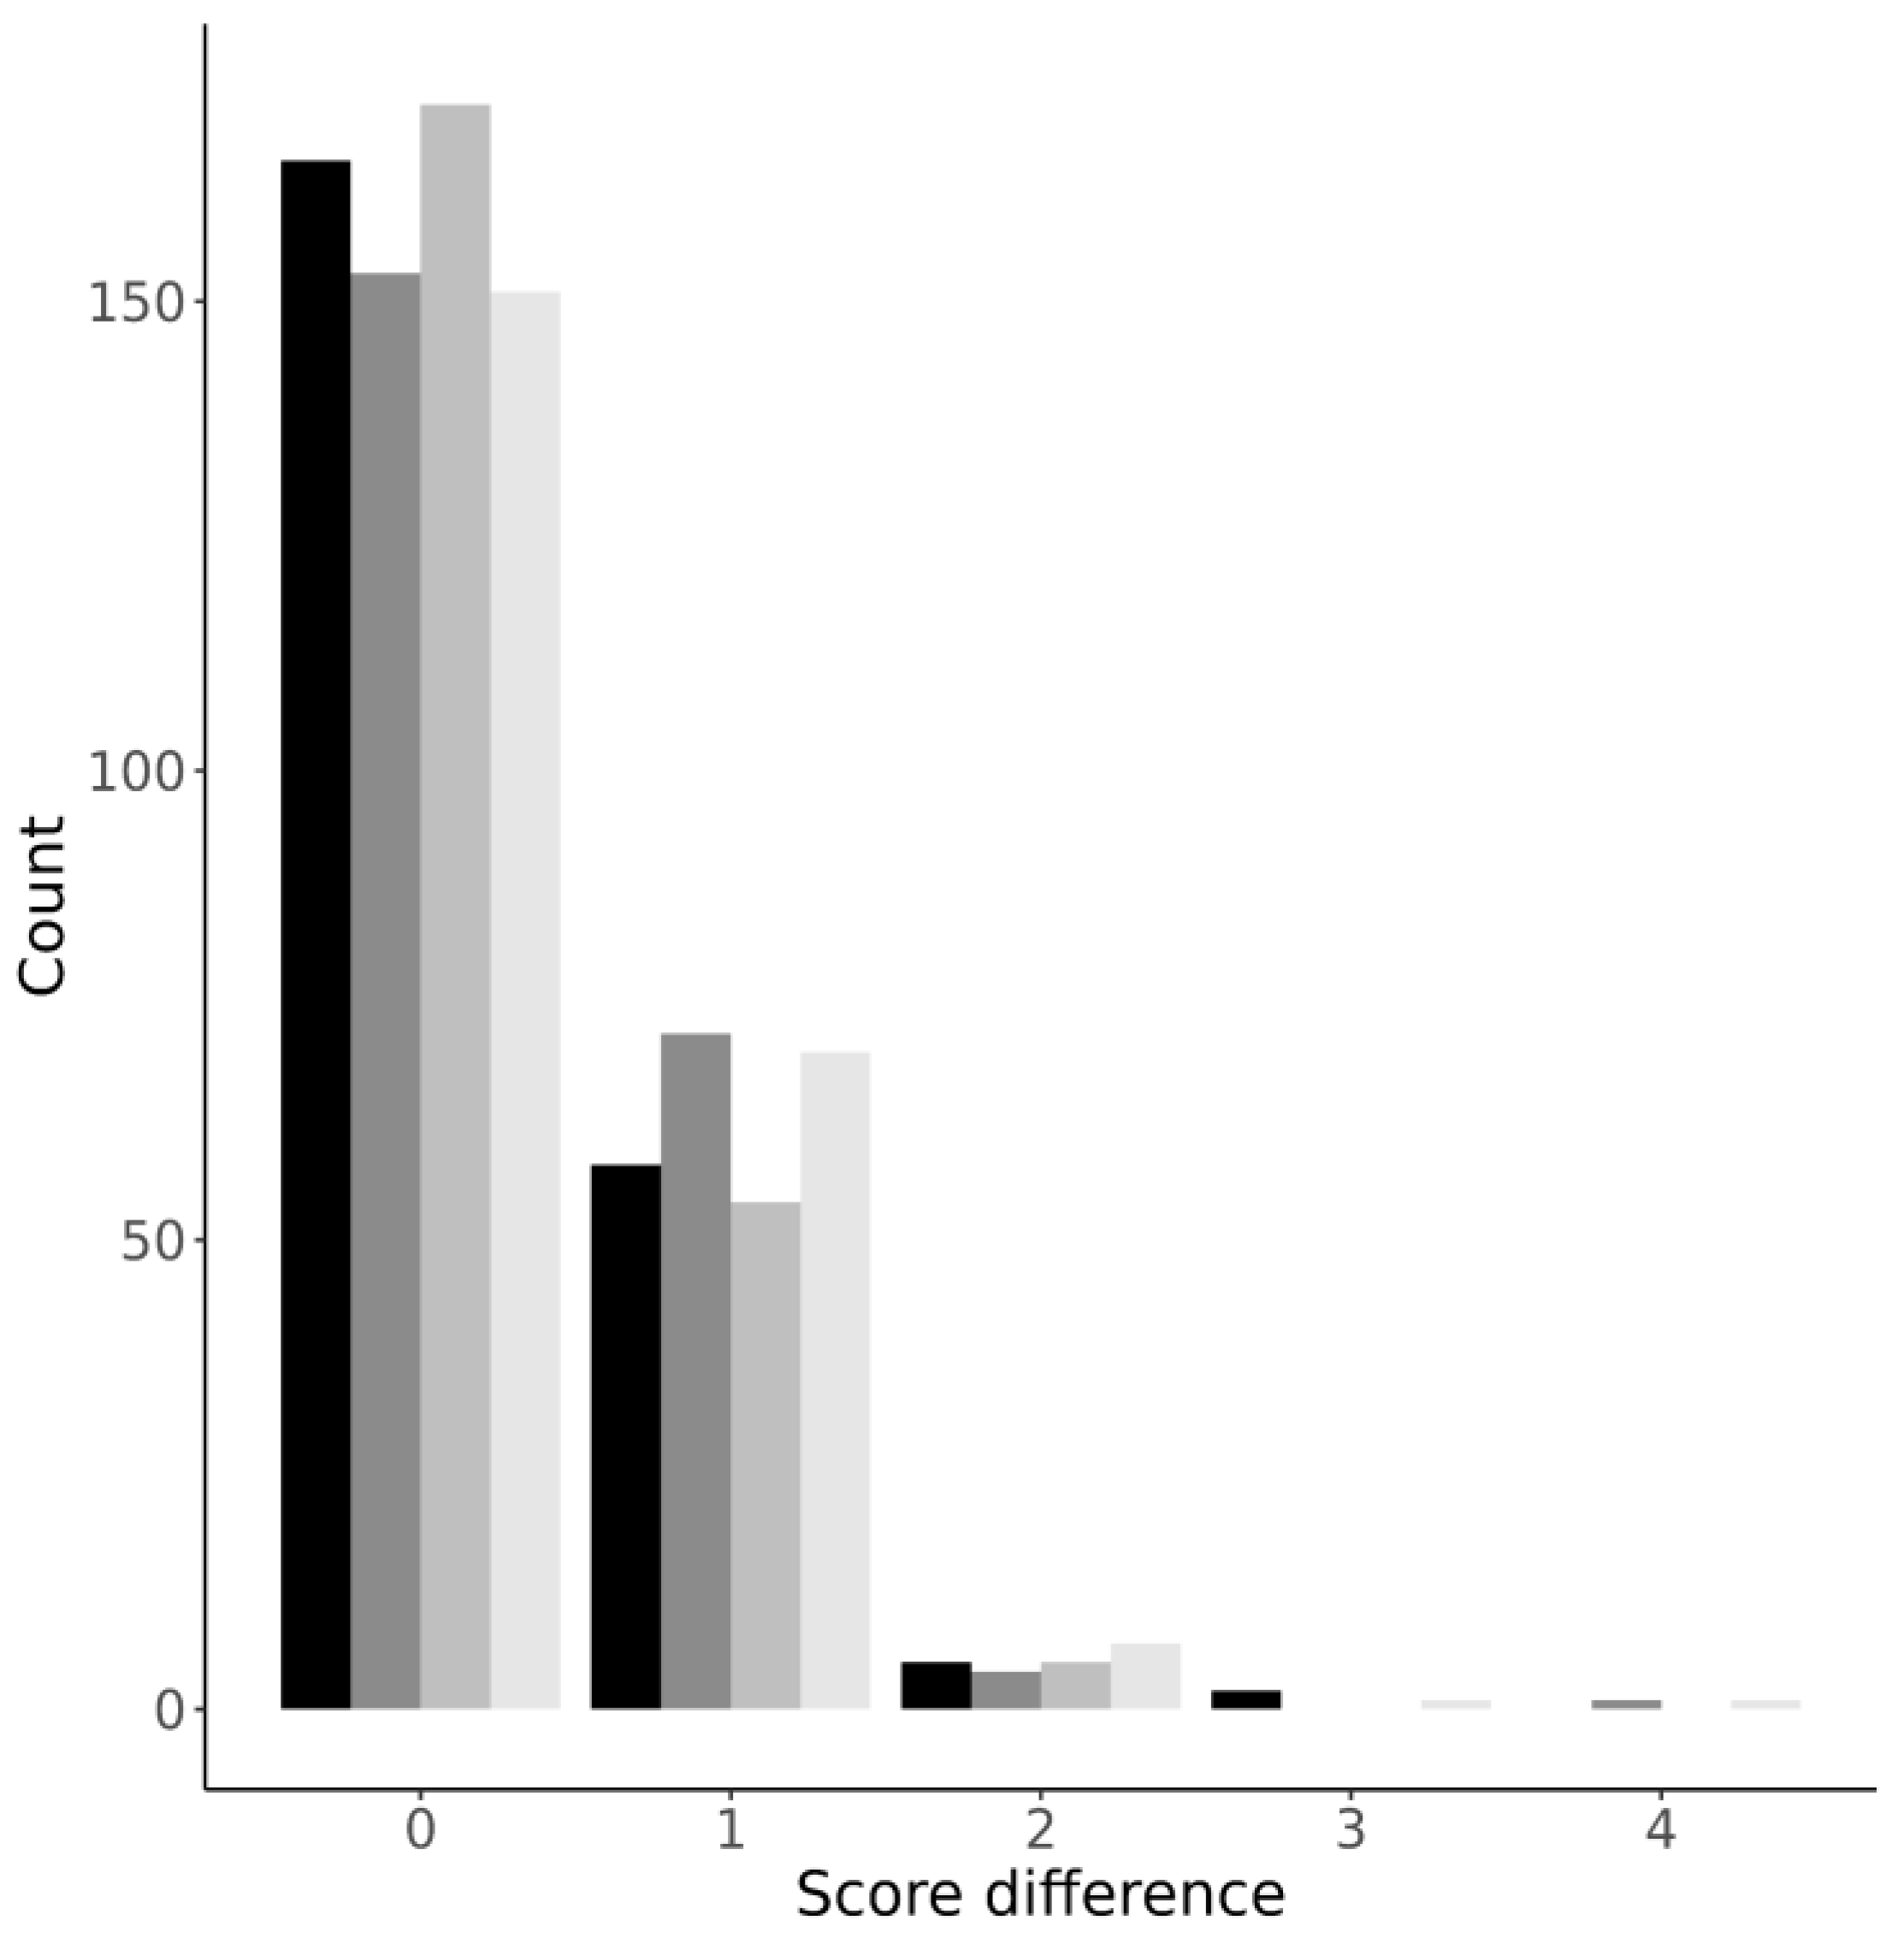
4.2. Differences between the “CT0-4” Scores Assigned by Readers
5. Discussion
6. Conclusions
Author Contributions
Funding
Institutional Review Board Statement
Informed Consent Statement
Data Availability Statement
Acknowledgments
Conflicts of Interest
Appendix A

| Patient Number | CT0-4 Grade, Reader 0 | CT0-4 Grade, Reader 5 | Patient Number | CT0-4 Grade, Reader 0 | CT0-4 Grade, Reader 6 |
|---|---|---|---|---|---|
| 14 | 2 | 2 | 10 | 1 | 2 |
| 34 | 2 | 2 | 11 | 0 | 0 |
| 76 | 1 | 1 | 13 | 0 | 0 |
| 100 | 1 | 2 | 28 | 0 | 0 |
| 107 | 0 | 0 | 59 | 0 | 0 |
| 120 | 1 | 0 | 181 | 1 | 2 |
| 174 | 1 | 0 | 212 | 1 | 0 |
| 182 | 0 | 0 | 220 | 0 | 0 |
| 219 | 0 | 0 | -- | -- | -- |
| PA, % | 66.7 | 62.5 | |||
| Cohen’s kappa | 0.518 | 0.294 | |||
References
- Lai, C.-C.; Shih, T.-P.; Ko, W.-C.; Tang, H.-J.; Hsueh, P.-R. Severe Acute Respiratory Syndrome Coronavirus 2 (SARS-CoV-2) and Coronavirus Disease-2019 (COVID-19): The Epidemic and the Challenges. Int. J. Antimicrob. Agents 2020, 55, 105924. [Google Scholar] [CrossRef] [PubMed]
- Islam, N.; Ebrahimzadeh, S.; Salameh, J.P.; Kazi, S.; Fabiano, N.; Treanor, L.; Absi, M.; Hallgrimson, Z.; Leeflang, M.M.; Hooft, L.; et al. Thoracic Imaging Tests for the Diagnosis of COVID-19. Edited by Cochrane Infectious Diseases Group. Cochrane Database Syst. Rev. 2021. [Google Scholar] [CrossRef]
- Aljondi, R.; Alghamdi, S. Diagnostic Value of Imaging Modalities for COVID-19: Scoping Review. J. Med. Internet Res. 2020, 22, e19673. [Google Scholar] [CrossRef]
- Harahwa, T.A.; Yau, T.H.; Lim-Cooke, M.S.; Al-Haddi, S.; Zeinah, M.; Harky, A. The Optimal Diagnostic Methods for COVID-19. Diagnosis 2020, 7, 349–356. [Google Scholar] [CrossRef] [PubMed]
- Blažić, I.; Brkljačić, B.; Frija, G. The Use of Imaging in COVID-19—Results of a Global Survey by the International Society of Radiology. Eur. Radiol. 2021, 31, 1185–1193. [Google Scholar] [CrossRef] [PubMed]
- Silverstein, W.K.; Stroud, L.; Cleghorn, G.E.; Leis, J.A. First Imported Case of 2019 Novel Coronavirus in Canada, Presenting as Mild Pneumonia. Lancet 2020, 395, 734. [Google Scholar] [CrossRef]
- Yoon, S.H.; Lee, K.H.; Kim, J.Y.; Lee, Y.K.; Ko, H.; Kim, K.H.; Park, C.M.; Kim, Y.H. Chest Radiographic and CT Findings of the 2019 Novel Coronavirus Disease (COVID-19): Analysis of Nine Patients Treated in Korea. Korean J. Radiol. 2020, 21, 494. [Google Scholar] [CrossRef] [PubMed]
- Parekh, M.; Donuru, A.; Balasubramanya, R.; Kapur, S. Review of the Chest CT Differential Diagnosis of Ground-Glass Opacities in the COVID Era. Radiology 2020, 297, E289–E302. [Google Scholar] [CrossRef] [PubMed]
- Pontone, G.; Scafuri, S.; Mancini, M.E.; Agalbato, C.; Guglielmo, M.; Baggiano, A.; Muscogiuri, G.; Fusini, L.; Andreini, D.; Mushtaq, S.; et al. Role of Computed Tomography in COVID-19. J. Cardiovasc. Comput. Tomogr. 2021, 15, 27–36. [Google Scholar] [CrossRef]
- Yang, R.; Li, X.; Liu, H.; Zhen, Y.; Zhang, X.; Xiong, Q.; Luo, Y.; Gao, C.; Zeng, W. Chest CT Severity Score: An Imaging Tool for Assessing Severe COVID-19. Radiol. Cardiothorac. Imaging 2020, 2, e200047. [Google Scholar] [CrossRef] [Green Version]
- Salaffi, F.; Carotti, M.; Tardella, M.; Borgheresi, A.; Agostini, A.; Minorati, D.; Marotto, D.; Di Carlo, M.; Galli, M.; Giovagnoni, A.; et al. The Role of a Chest Computed Tomography Severity Score in Coronavirus Disease 2019 Pneumonia. Medicine 2020, 99, e22433. [Google Scholar] [CrossRef] [PubMed]
- Morozov, S.P.; Kuzmina, E.S.; Ledikhova, N.V.; Vladzymyrskyy, A.V.; Trofimenko, I.A.; Mokienko, O.A.; Panina, E.V.; Andreychenko, A.E.; Omelyanskaya, O.V.; Gombolevskiy, V.A.; et al. Mobilizing the academic and practical potential of diagnostic radiology during the COVID-19 pandemic in Moscow. Digit. Diagn. 2020, 1, 5–12. [Google Scholar] [CrossRef]
- Morozov, S.P.; Reshetnikov, R.V.; Gombolevskiy, V.A.; Ledikhova, N.V.; Blokhin, I.A.; Mokienko, O.A. Diagnostic accuracy of computed tomography for identifying hospitalizations for patients with COVID-19. Digit. Diagn. 2021, 2, 5–16. [Google Scholar] [CrossRef]
- Qiblawey, Y.; Tahir, A.; Chowdhury, M.E.; Khandakar, A.; Kiranyaz, S.; Rahman, T.; Ibtehaz, N.; Mahmud, S.; Maadeed, S.A.; Musharavati, F.; et al. Detection and Severity Classification of COVID-19 in CT Images Using Deep Learning. Diagnostics 2021, 11, 893. [Google Scholar] [CrossRef] [PubMed]
- ICRP Publication 103. The 2007 Recommendations of the International Commission on Radiological Protection. Ann. ICRP 2008, 37, 2–4. Available online: https://www.icrp.org/publication.asp?id=ICRP%20Publication%20103 (accessed on 8 December 2021).
- Use of Chest Imaging in COVID-19. Available online: https://www.who.int/publications-detail-redirect/use-of-chest-imaging-in-covid-19 (accessed on 9 December 2021).
- Tabatabaei, S.M.; Talari, H.; Gholamrezanezhad, A.; Farhood, B.; Rahimi, H.; Razzaghi, R.; Mehri, N.; Rajebi, H. A Low-Dose Chest CT Protocol for the Diagnosis of COVID-19 Pneumonia: A Prospective Study. Emerg. Radiol. 2020, 27, 607–615. [Google Scholar] [CrossRef]
- Samir, A.; El-Husseiny, R.M.; Sweed, R.A.; Abd El, N.A.; Masoud, M. Ultra-Low-Dose Chest CT Protocol during the Second Wave of COVID-19 Pandemic: A Double-Observer Prospective Study on 250 Patients to Evaluate Its Detection Accuracy. Egypt. J. Radiol. Nucl. Med. 2021, 52, 136. [Google Scholar] [CrossRef]
- Cristofaro, M.; Fusco, N.; Petrone, A.; Albarello, F.; Di Stefano, F.; Pianura, E.; Schininà, V.; Ianniello, S.; Campioni, P. Increased Radiation Dose Exposure in Thoracic Computed Tomography in Patients with COVID-19. Radiation 2021, 1, 153–161. [Google Scholar] [CrossRef]
- Bankier, A.A.; MacMahon, H.; Goo, J.M.; Rubin, G.D.; Schaefer-Prokop, C.M.; Naidich, D.P. Recommendations for Measuring Pulmonary Nodules at CT: A Statement from the Fleischner Society. Radiology 2017, 285, 584–600. [Google Scholar] [CrossRef] [Green Version]
- Sui, X.; Meinel, F.G.; Song, W.; Xu, X.; Wang, Z.; Wang, Y.; Jin, Z.; Chen, J.; Vliegenthart, R.; Schoepf, U.J. Detection and Size Measurements of Pulmonary Nodules in Ultra-Low-Dose CT with Iterative Reconstruction Compared to Low Dose CT. Eur. J. Radiol. 2016, 85, 564–570. [Google Scholar] [CrossRef]
- Gierada, D.S.; Bierhals, A.J.; Choong, C.K.; Bartel, S.T.; Ritter, J.H.; Das, N.A.; Hong, C.; Pilgram, T.K.; Bae, K.T.; Whiting, B.R.; et al. Effects of CT Section Thickness and Reconstruction Kernel on Emphysema Quantification: Relationship to the Magnitude of the CT Emphysema Index. Acad. Radiol. 2010, 17, 146–156. [Google Scholar] [CrossRef] [PubMed] [Green Version]
- Bhalla, A.S.; Das, A.; Naranje, P.; Irodi, A.; Raj, V.; Goyal, A. Imaging Protocols for CT Chest: A Recommendation. Indian J. Radiol. Imaging 2019, 29, 236–246. [Google Scholar] [CrossRef] [PubMed]
- Hoang-Thi, T.N.; Vakalopoulou, M.; Christodoulidis, S.; Paragios, N.; Revel, M.P.; Chassagnon, G. Deep Learning for Lung Disease Segmentation on CT: Which Reconstruction Kernel Should Be Used? Diagn. Interv. Imaging 2021, 102, 691–695. [Google Scholar] [CrossRef] [PubMed]
- Denzler, S.; Vuong, D.; Bogowicz, M.; Pavic, M.; Frauenfelder, T.; Thierstein, S.; Eboulet, E.I.; Maurer, B.; Schniering, J.; Gabryś, H.S.; et al. Impact of CT Convolution Kernel on Robustness of Radiomic Features for Different Lung Diseases and Tissue Types. Br. J. Radiol. 2021, 94, 20200947. [Google Scholar] [CrossRef] [PubMed]
- Kwee, T.C.; Kwee, R.M. Chest CT in COVID-19: What the Radiologist Needs to Know. RadioGraphics 2020, 40, 1848–1865. [Google Scholar] [CrossRef]
- Gombolevskiy, V.; Morozov, S.; Chernina, V.; Blokhin, I.; Vassileva, J. A Phantom Study to Optimise the Automatic Tube Current Modulation for Chest CT in COVID-19. Eur. Radiol. Exp. 2021, 5, 21. [Google Scholar] [CrossRef]
- Morozov, S.P.; Gombolevskiy, V.A.; Elizarov, A.B.; Gusev, M.A.; Novik, V.P.; Prokudaylo, S.B.; Bardin, A.S.; Popov, E.V.; Ledikhova, N.V.; Chernina, V.Y.; et al. A Simplified Cluster Model and a Tool Adapted for Collaborative Labeling of Lung Cancer CT Scans. Comput. Methods Programs Biomed. 2021, 206, 106111. [Google Scholar] [CrossRef]
- Kulberg, N.S.; Gusev, M.A.; Reshetnikov, R.V.; Elizarov, A.B.; Novik, V.P.; Prokudaylo, S.B.; Philippovich, Y.N.; Gobmolevskiy, V.A.; Vladzymyrskyy, A.V.; Kamynina, N.N.; et al. Methodology and Tools for Creating Training Samples for Artificial Intelligence Systems for Recognizing Lung Cancer on CT Images. Health Care Russ. Fed. 2020, 64, 343–350. [Google Scholar] [CrossRef]
- Walter, S.D.; Eliasziw, M.; Donner, A. Sample Size and Optimal Designs for Reliability Studies. Stat. Med. 1998, 17, 101–110. [Google Scholar] [CrossRef]
- Wilcoxon, F. Individual comparisons by ranking methods. Biom. Bull. 1945, 1, 80–83. [Google Scholar] [CrossRef]
- Shapiro, S.S.; Wilk, M.B. An analysis of variance test for normality (complete samples). Biometrika 1965, 52, 591–611. [Google Scholar] [CrossRef]
- Wickham, H.; Francois, R.; Henry, L.; Müller, K. dplyr: A Grammar of Data Manipulation. R Package Version 1.0.7. 2021. Available online: https://CRAN.R-project.org/package=dplyr (accessed on 8 December 2021).
- Wickham, H. Elegant graphics for data analysis. Media 2009, 35, 10–1007. [Google Scholar]
- Gamer, M.; Lemon, J.; Singh, I.F.P. irr: Various Coefficients of Interrater Reliability and Agreement. R Package Version 0.84.1. 2019. Available online: https://CRAN.R-project.org/package=irr (accessed on 8 December 2021).
- R Core Team. R: A Language and Environment for Statistical Computing; R Foundation for Statistical Computing: Vienna, Austria, 2020; Available online: https://www.R-project.org/ (accessed on 8 December 2021).
- MacMahon, H.; Naidich, D.P.; Goo, J.M.; Lee, K.S.; Leung, A.N.; Mayo, J.R.; Mehta, A.C.; Ohno, Y.; Powell, C.A.; Prokop, M.; et al. Guidelines for Management of Incidental Pulmonary Nodules Detected on CT Images: From the Fleischner Society 2017. Radiology 2017, 284, 228–243. [Google Scholar] [CrossRef] [PubMed] [Green Version]
- Azadbakht, J.; Khoramian, D.; Lajevardi, Z.S.; Elikaii, F.; Aflatoonian, A.H.; Farhood, B.; Najafi, M.; Bagheri, H. A Review on Chest CT Scanning Parameters Implemented in COVID-19 Patients: Bringing Low-Dose CT Protocols into Play. Egypt. J. Radiol. Nucl. Med. 2021, 52, 13. [Google Scholar] [CrossRef]
- Paul, N.S.; Kashani, H.; Odedra, D.; Ursani, A.; Ray, C.; Rogalla, P. The Influence of Chest Wall Tissue Composition in Determining Image Noise During Cardiac CT. Am. J. Roentgenol. 2011, 197, 1328–1334. [Google Scholar] [CrossRef]
- Ohana, M.; Ludes, C.; Schaal, M.; Meyer, E.; Jeung, M.-Y.; Labani, A.; Roy, C. Quel avenir pour la radiographie thoracique face au scanner ultra-low dose? Rev. Pneumol. Clin. 2017, 73, 3–12. [Google Scholar] [CrossRef]
- Finance, J.; Zieleskewicz, L.; Habert, P.; Jacquier, A.; Parola, P.; Boussuges, A.; Bregeon, F.; Eldin, C. Low Dose Chest CT and Lung Ultrasound for the Diagnosis and Management of COVID-19. J. Clin. Med. 2021, 10, 2196. [Google Scholar] [CrossRef]
- Ghosh, S.; Deshwal, H.; Saeedan, M.B.; Khanna, V.K.; Raoof, S.; Mehta, A.C. Imaging Algorithm for COVID-19: A Practical Approach. Clin. Imaging 2021, 72, 22–30. [Google Scholar] [CrossRef]
- Wang, M.; Luo, X.; Wang, L.; Estill, J.; Lv, M.; Zhu, Y.; Wang, Q.; Xiao, X.; Song, Y.; Lee, M.S.; et al. A Comparison of Lung Ultrasound and Computed Tomography in the Diagnosis of Patients with COVID-19: A Systematic Review and Meta-Analysis. Diagnostics 2021, 11, 1351. [Google Scholar] [CrossRef]
- Quarato, C.M.; Mirijello, A.; Maggi, M.M.; Borelli, C.; Russo, R.; Lacedonia, D.; Barbaro, M.P.; Scioscia, G.; Tondo, P.; Rea, G.; et al. Lung Ultrasound in the Diagnosis of COVID-19 Pneumonia: Not Always and Not Only What Is COVID-19 “Glitters”. Front. Med. 2021, 8, 707602. [Google Scholar] [CrossRef]
- Vetsheva, N.N.; Reshetnikov, R.V.; Leonov, D.V.; Kulberg, N.S.; Mokienko, O.A. Diagnostic Value of Lung Ultrasound in COVID-19: Systematic Review and Meta-Analysis. Digit. Diagn. 2020, 1, 13–26. [Google Scholar] [CrossRef]
- Vasilev, Y.A.; Sergunova, K.A.; Bazhin, A.V.; Masri, A.G.; Vasileva, Y.N.; Semenov, D.S.; Kudryavtsev, N.D.; Panina, O.Y.; Khoruzhaya, A.N.; Zinchenko, V.V.; et al. Chest MRI of Patients with COVID-19. Magn. Reson. Imaging 2021, 79, 13–19. [Google Scholar] [CrossRef] [PubMed]
- Yang, S.; Zhang, Y.; Shen, J.; Dai, Y.; Ling, Y.; Lu, H.; Zhang, R.; Ding, X.; Qi, H.; Shi, Y.; et al. Clinical Potential of UTE-MRI for Assessing COVID -19: Patient- and Lesion-Based Comparative Analysis. J. Magn. Reson. Imaging 2020, 52, 397–406. [Google Scholar] [CrossRef] [PubMed]
- Collins, J.D.; Rowley, H.; Leiner, T.; Reeder, S.; Hood, M.; Dekkers, I.; Tha, K.; Gulani, V.; Kopanoglu, E.; for the ISMRM MR Safety Committee. Magnetic Resonance Imaging during a Pandemic: Recommendations by the ISMRM Safety Committee. J. Magn. Reson. Imaging 2021, jmri.28006. [Google Scholar] [CrossRef]
- Prokop, M.; Van Everdingen, W.; van Rees Vellinga, T.; Quarles van Ufford, H.; Stöger, L.; Beenen, L.; Geurts, B.; Gietema, H.; Krdzalic, J.; Schaefer-Prokop, C.; et al. CO-RADS: A Categorical CT Assessment Scheme for Patients Suspected of Having COVID-19—Definition and Evaluation. Radiology 2020, 296, E97–E104. [Google Scholar] [CrossRef] [PubMed]
- Kang, Z.; Li, X.; Zhou, S. Recommendation of Low-Dose CT in the Detection and Management of COVID-2019. Eur. Radiol. 2020, 30, 4356–4357. [Google Scholar] [CrossRef] [Green Version]
| CT Sharp | CT Soft | LDCT Sharp | LDCT Soft | |||||
|---|---|---|---|---|---|---|---|---|
| PA, % | 71.74 ± 45.12 | 66.52 ± 47.29 | 74.35 ± 43.77 | 65.65 ± 47.59 | ||||
| Spearman’s rho | 0.78, p < 0.001 | 0.77, p < 0.001 | 0.82, p < 0.001 | 0.75, p < 0.001 | ||||
| p-value | 0.23 | 0.07 | 0.04 * | |||||
| 0.53 | ||||||||
| 0.84 | ||||||||
| 0.16 | ||||||||
| Radiologist | Experience, Years | CT Sharp | CT Soft | LDCT Sharp | LDCT Soft | ||||
|---|---|---|---|---|---|---|---|---|---|
| PA, % | Cohen’s Kappa | PA, % | Cohen’s Kappa | PA, % | Cohen’s Kappa | PA, % | Cohen’s Kappa | ||
| 0 | 3 | 75.1 ± 13.7 | 0.59 ± 0.23 | 82.6 ± 10.8 | 0.73 ± 0.15 | 89.3 ± 12.4 | 0.82 ± 0.21 | 86.6 ± 13.9 | 0.79 ± 0.21 |
| 1 | 10 | 54.0 ± 20.0 | 0.31 ± 0.29 | 49.5 ± 14.1 | 0.29 ± 0.15 | 63.9 ± 13.1 | 0.49 ± 0.16 | 43.6 ± 18.4 | 0.19 ± 0.19 |
| 2 | 25+ | 87.8 ± 14.0 | 0.78 ± 0.26 | 66.8 ± 31.3 | 0.55 ± 0.40 | 82.5 ± 11.2 | 0.68 ± 0.18 | 68.2 ± 20.6 | 0.53 ± 0.28 |
| 3 | 6 | 70.5 ± 11.1 | 0.39 ± 0.23 | 55.5 ± 11.1 | 0.29 ± 0.20 | 62.5 ± 21.9 | 0.38 ± 0.32 | 59.7 ± 7.5 | 0.38 ± 0.09 |
| 4 | 2 | 72.0 ± 18.2 | 0.49 ± 0.38 | 74.6 ± 18.7 | 0.62 ± 0.25 | 73.4 ± 17.8 | 0.54 ± 0.3 | 75.8 ± 19.9 | 0.65 ± 0.27 |
| 5 | 4 | 65.6 ± 29.5 | 0.44 ± 0.50 | 77.7 ± 15.8 | 0.55 ± 0.35 | 62.4 ± 16.5 | 0.44 ± 0.19 | 77.1 ± 19.4 | 0.65 ± 0.27 |
| 6 | 1 | 74.1 ± 17.4 | 0.51 ± 0.28 | 72.0 ± 31.3 | 0.62 ± 0.40 | 73.1 ± 16.4 | 0.56 ± 0.31 | 54.4 ± 29.2 | 0.36 ± 0.39 |
| 7 | 7 | 77.5 ± 6.2 | 0.64 ± 0.10 | 64.8 ± 16.2 | 0.44 ± 0.28 | 75.4 ± 27.7 | 0.62 ± 0.42 | 75.0 ± 18.4 | 0.61 ± 0.26 |
| 8 | 2 | 78.4 ± 17.8 | 0.53 ± 0.38 | 58.9 ± 11.9 | 0.44 ± 0.28 | 82.6 ± 14.4 | 0.7 ± 0.21 | 68.5 ± 20.0 | 0.58 ± 0.29 |
| 9 | 6 | 73.6 ± 21.1 | 0.57 ± 0.34 | 60.5 ± 26.9 | 0.34 ± 0.35 | 62.5 ± 17.4 | 0.44 ± 0.16 | 63.4 ± 19.1 | 0.46 ± 0.24 |
| Average | 72.9 ± 8.8 | 0.53 ± 0.13 | 66.3 ± 10.5 | 0.49 ± 0.15 | 72.8 ± 9.8 | 0.57 ± 0.14 | 67.3 ± 12.5 | 0.52 ± 0.17 | |
| p-value, PA/Cohen’s kappa | 0.19/0.58 | 0.25/0.31 | 0.48/0.58 | ||||||
| 0.85/0.68 | |||||||||
| 0.79/0.58 | |||||||||
| 0.25/0.79 | |||||||||
Publisher’s Note: MDPI stays neutral with regard to jurisdictional claims in published maps and institutional affiliations. |
© 2022 by the authors. Licensee MDPI, Basel, Switzerland. This article is an open access article distributed under the terms and conditions of the Creative Commons Attribution (CC BY) license (https://creativecommons.org/licenses/by/4.0/).
Share and Cite
Blokhin, I.; Gombolevskiy, V.; Chernina, V.; Gusev, M.; Gelezhe, P.; Aleshina, O.; Nikolaev, A.; Kulberg, N.; Morozov, S.; Reshetnikov, R. Inter-Observer Agreement between Low-Dose and Standard-Dose CT with Soft and Sharp Convolution Kernels in COVID-19 Pneumonia. J. Clin. Med. 2022, 11, 669. https://doi.org/10.3390/jcm11030669
Blokhin I, Gombolevskiy V, Chernina V, Gusev M, Gelezhe P, Aleshina O, Nikolaev A, Kulberg N, Morozov S, Reshetnikov R. Inter-Observer Agreement between Low-Dose and Standard-Dose CT with Soft and Sharp Convolution Kernels in COVID-19 Pneumonia. Journal of Clinical Medicine. 2022; 11(3):669. https://doi.org/10.3390/jcm11030669
Chicago/Turabian StyleBlokhin, Ivan, Victor Gombolevskiy, Valeria Chernina, Maxim Gusev, Pavel Gelezhe, Olga Aleshina, Alexander Nikolaev, Nicholas Kulberg, Sergey Morozov, and Roman Reshetnikov. 2022. "Inter-Observer Agreement between Low-Dose and Standard-Dose CT with Soft and Sharp Convolution Kernels in COVID-19 Pneumonia" Journal of Clinical Medicine 11, no. 3: 669. https://doi.org/10.3390/jcm11030669
APA StyleBlokhin, I., Gombolevskiy, V., Chernina, V., Gusev, M., Gelezhe, P., Aleshina, O., Nikolaev, A., Kulberg, N., Morozov, S., & Reshetnikov, R. (2022). Inter-Observer Agreement between Low-Dose and Standard-Dose CT with Soft and Sharp Convolution Kernels in COVID-19 Pneumonia. Journal of Clinical Medicine, 11(3), 669. https://doi.org/10.3390/jcm11030669