
Obesity, Inflammation, and Mortality in COVID-19: An Observational Study from the Public Health Care System of New York City

 , , , ,
Abstract
:1. Introduction
2. Materials and Methods
2.1. Study Design, Study Setting, and Patient Population
2.2. Data Sources
2.3. Exposure of Interest and Outcomes
2.4. Statistical Analysis
3. Results
3.1. Descriptive Analyses
3.1.1. Baseline Characteristics
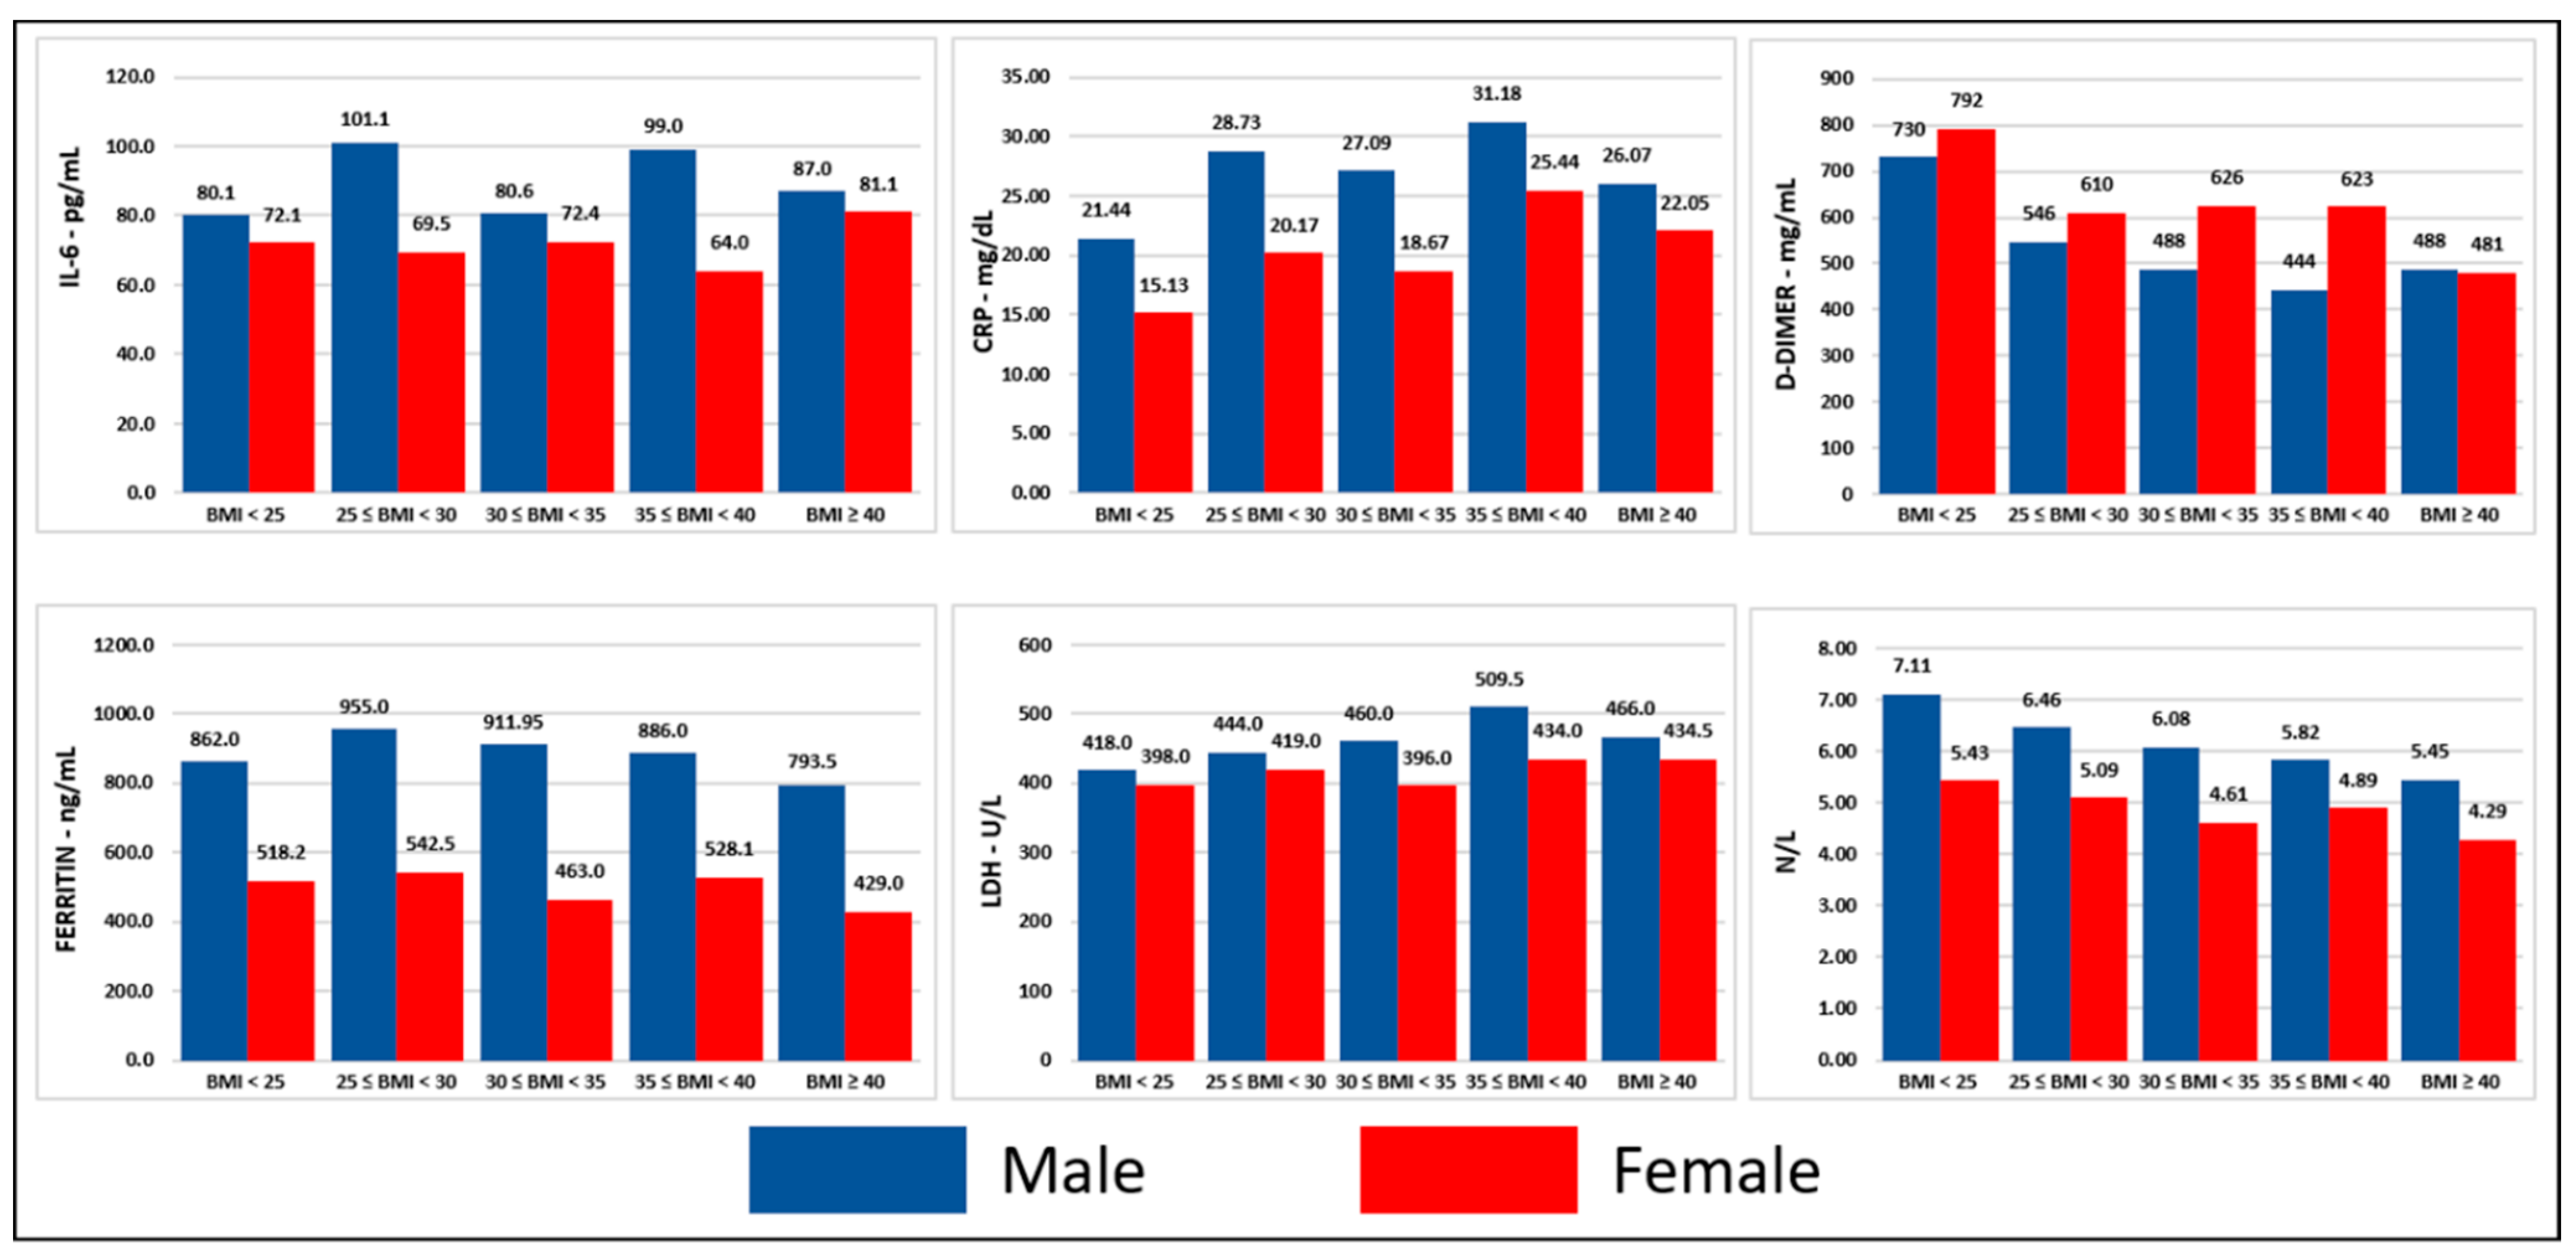
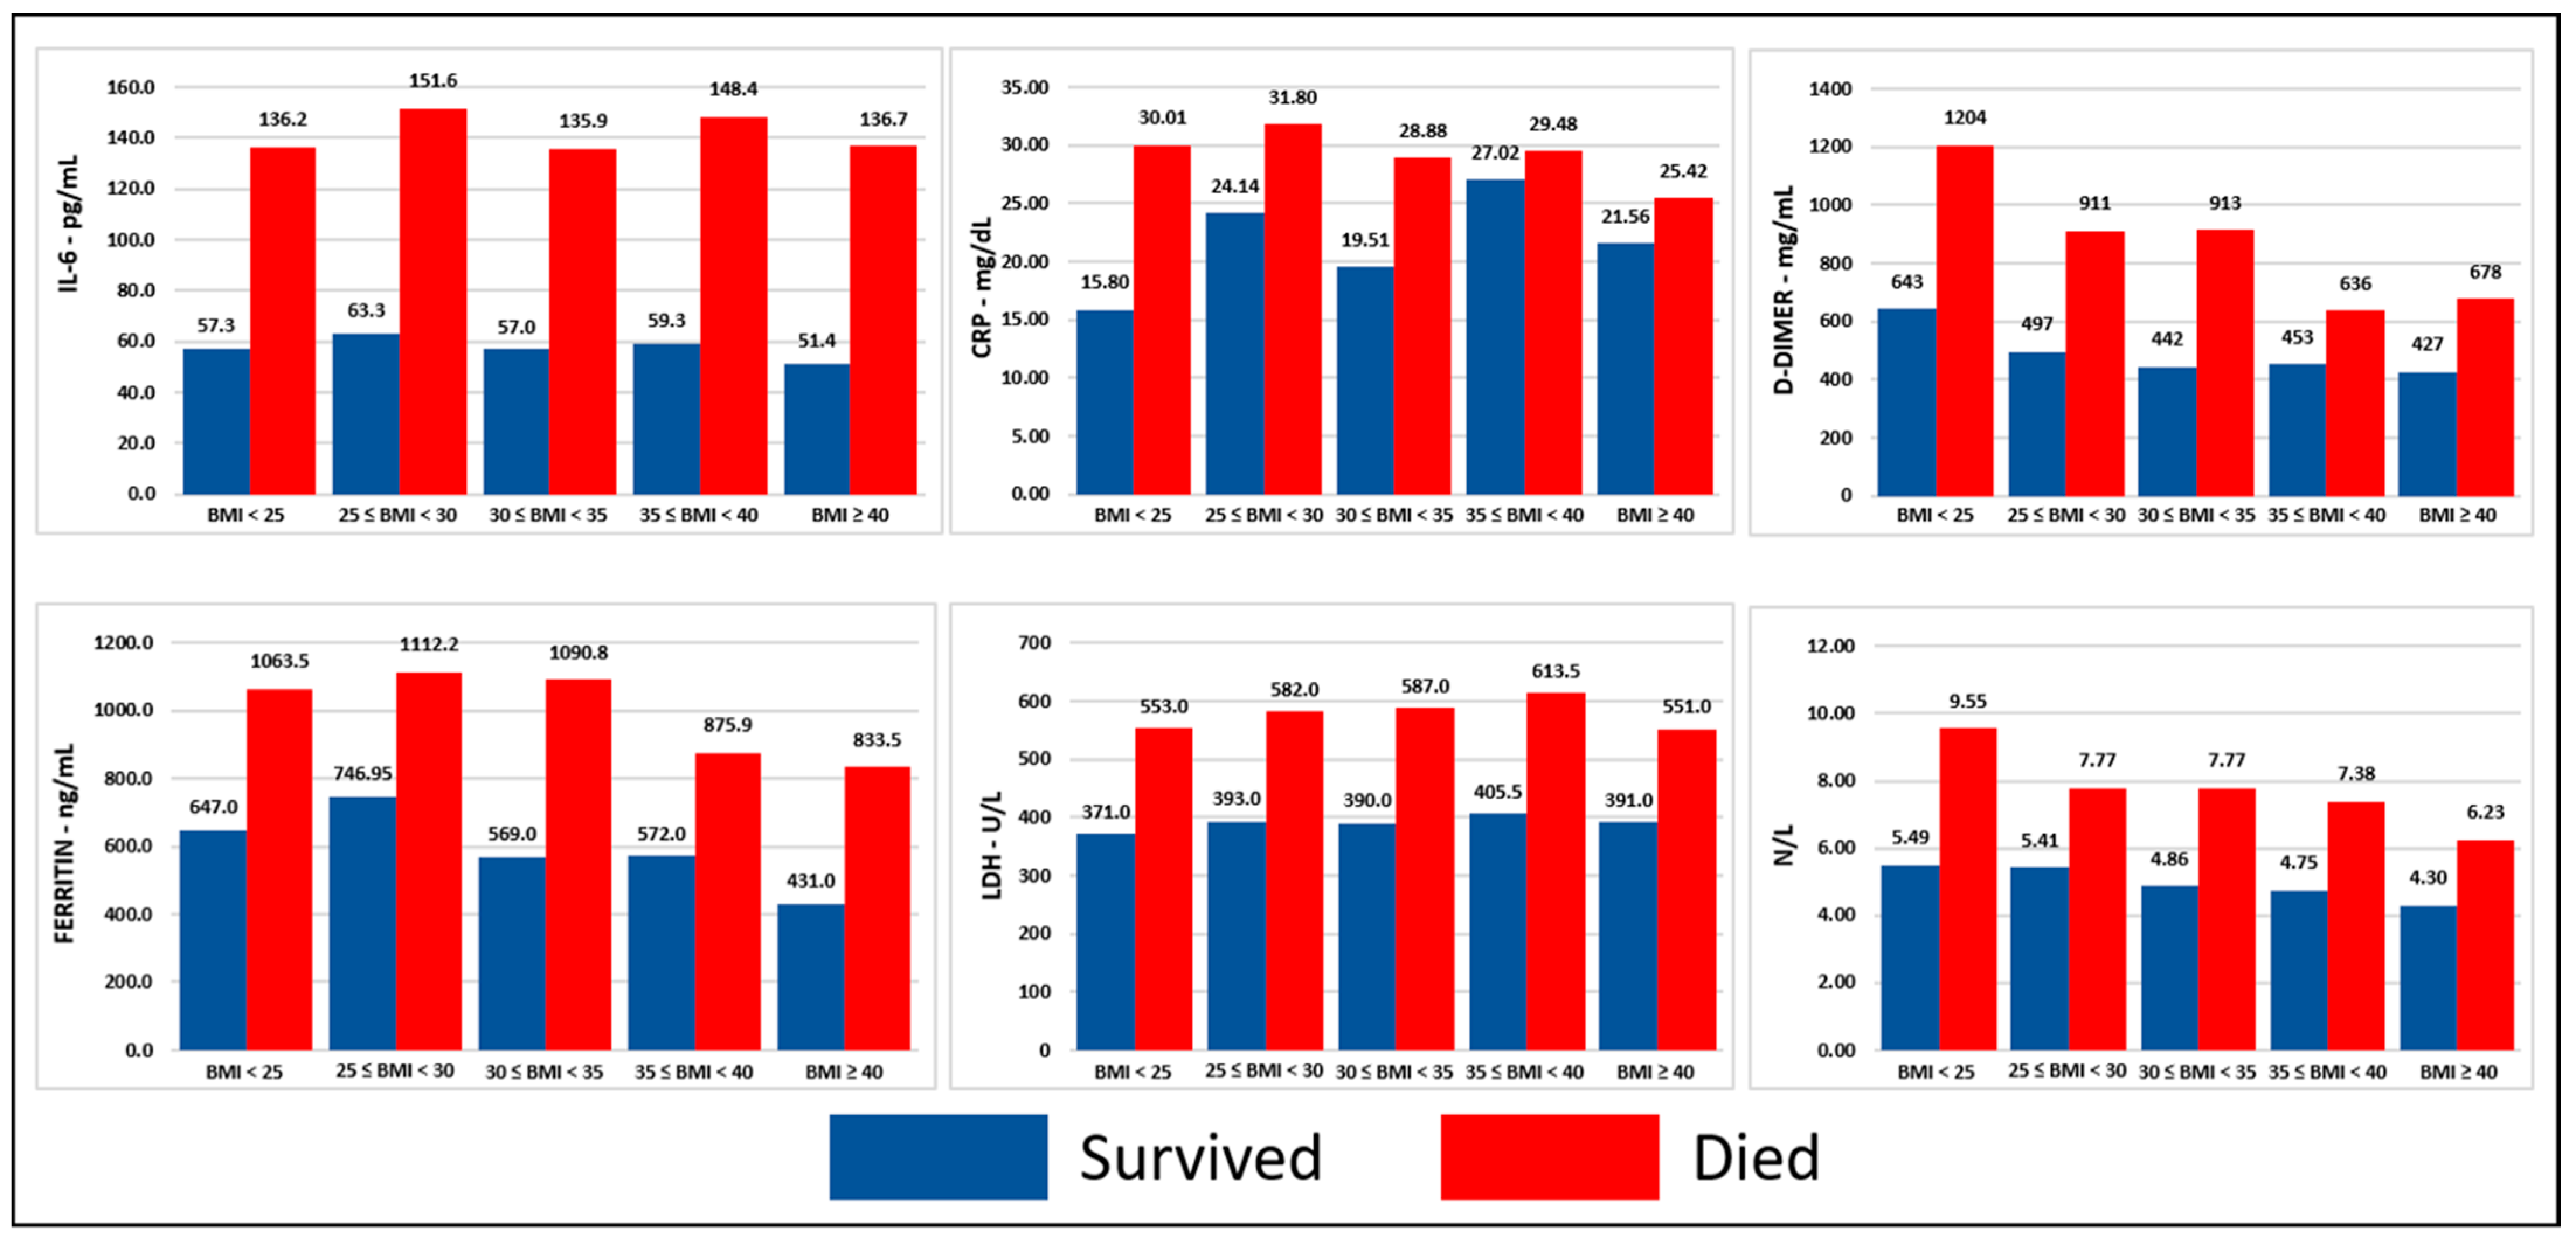
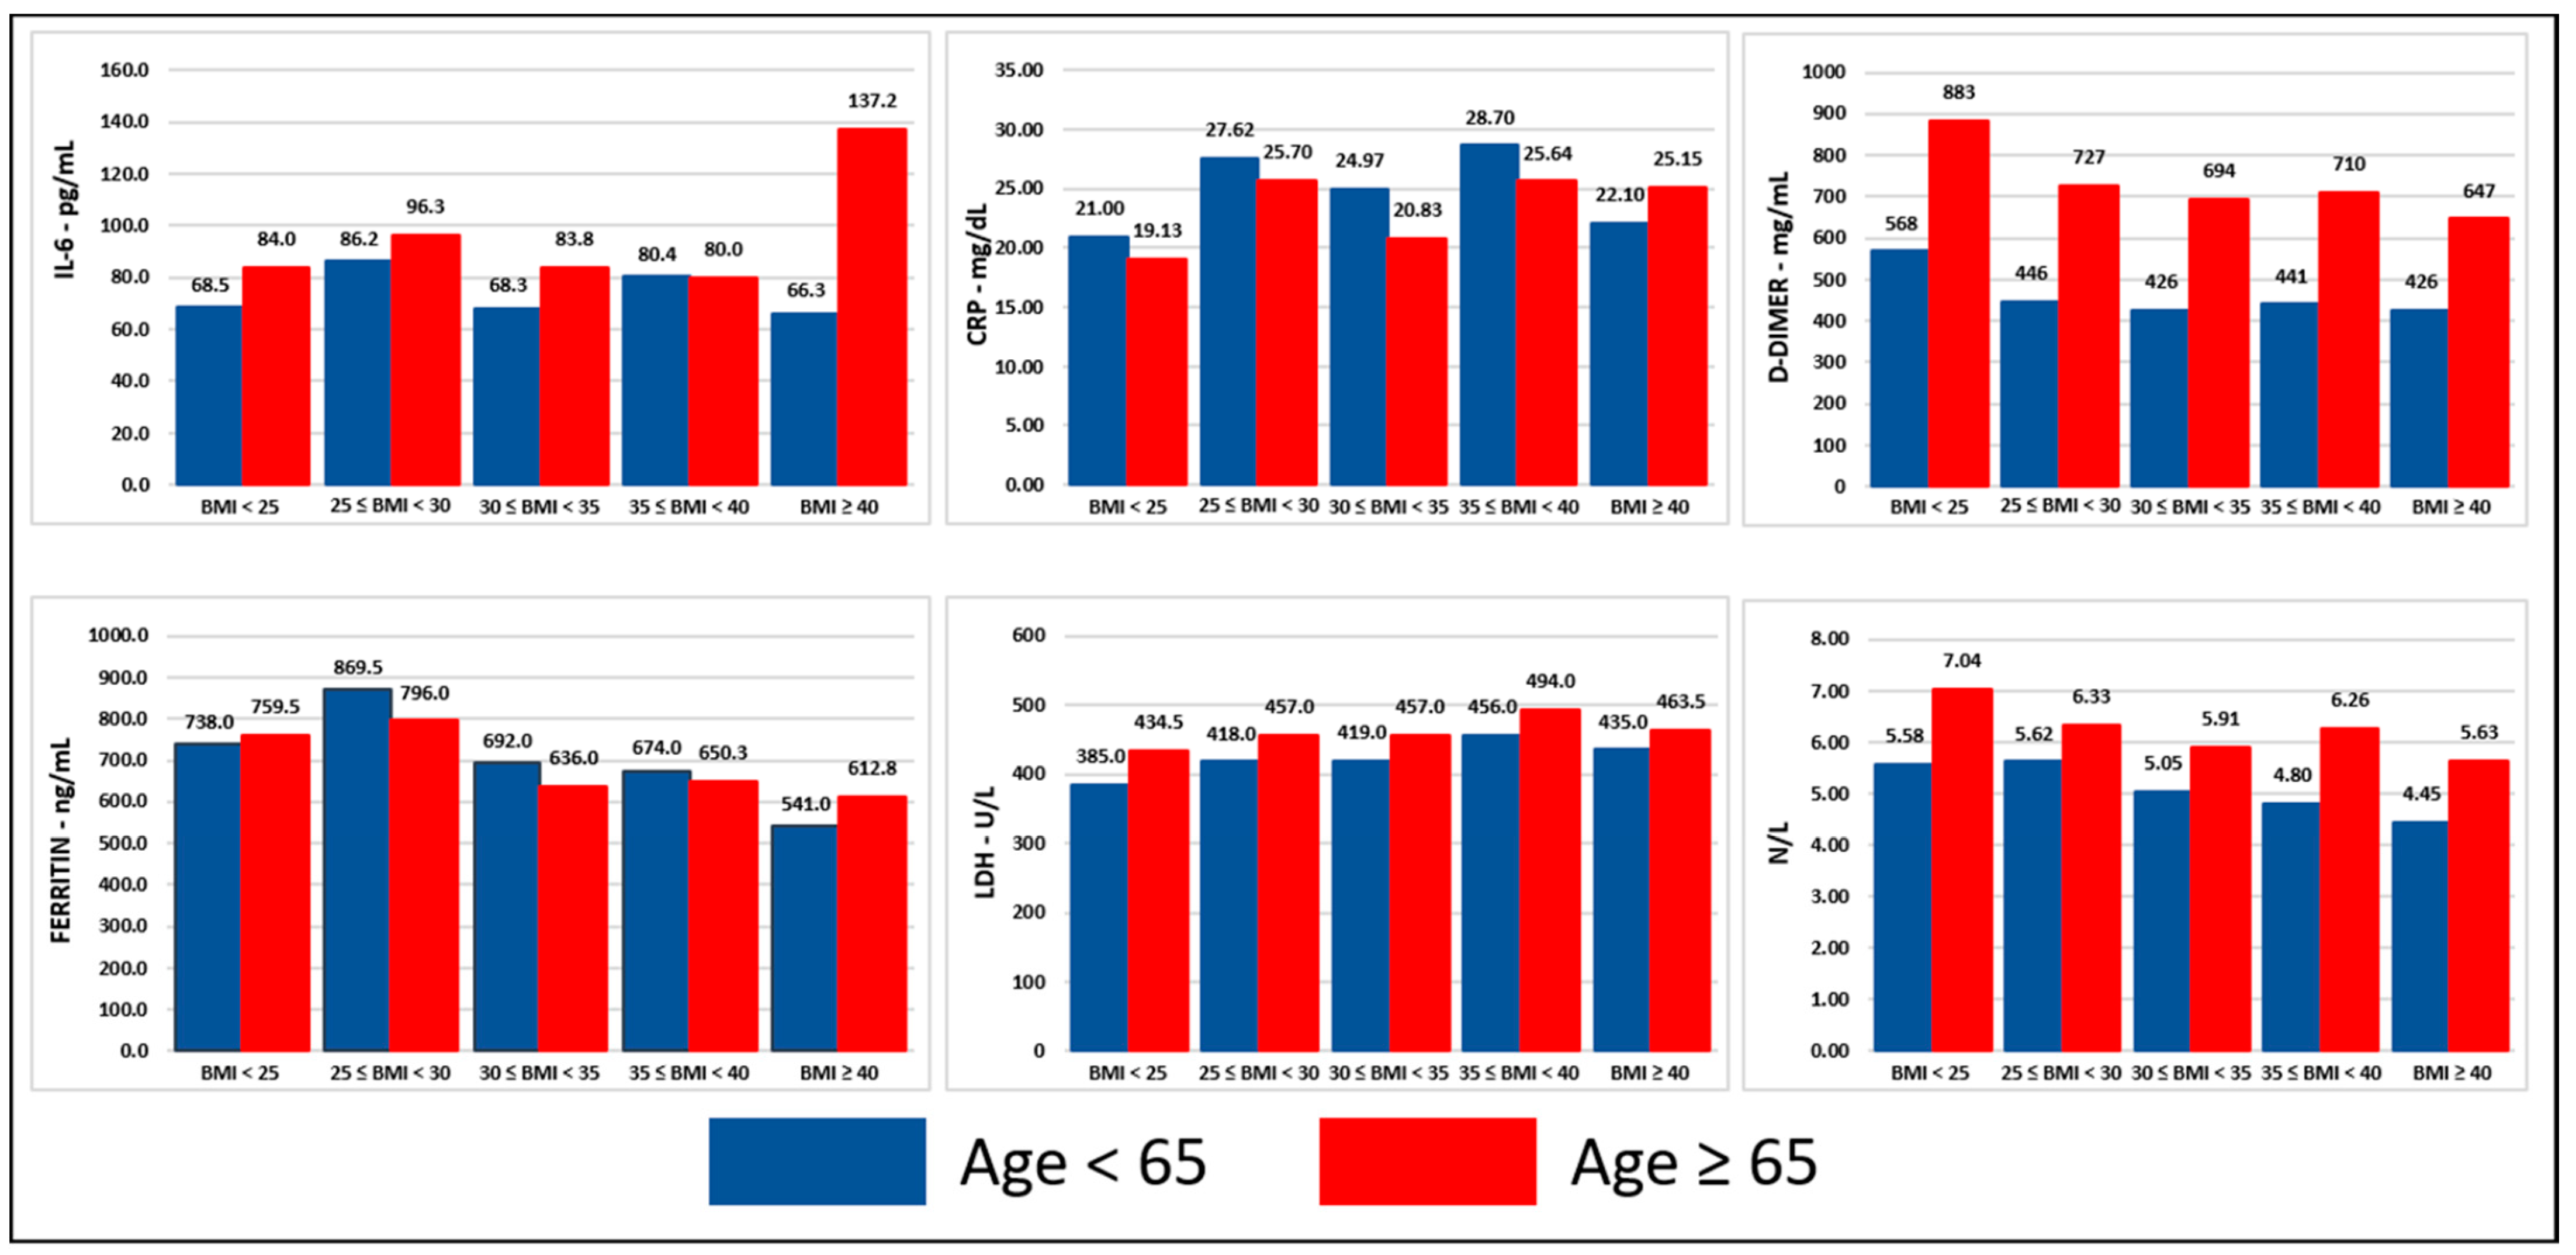
3.1.2. Inflammatory Cells and Markers
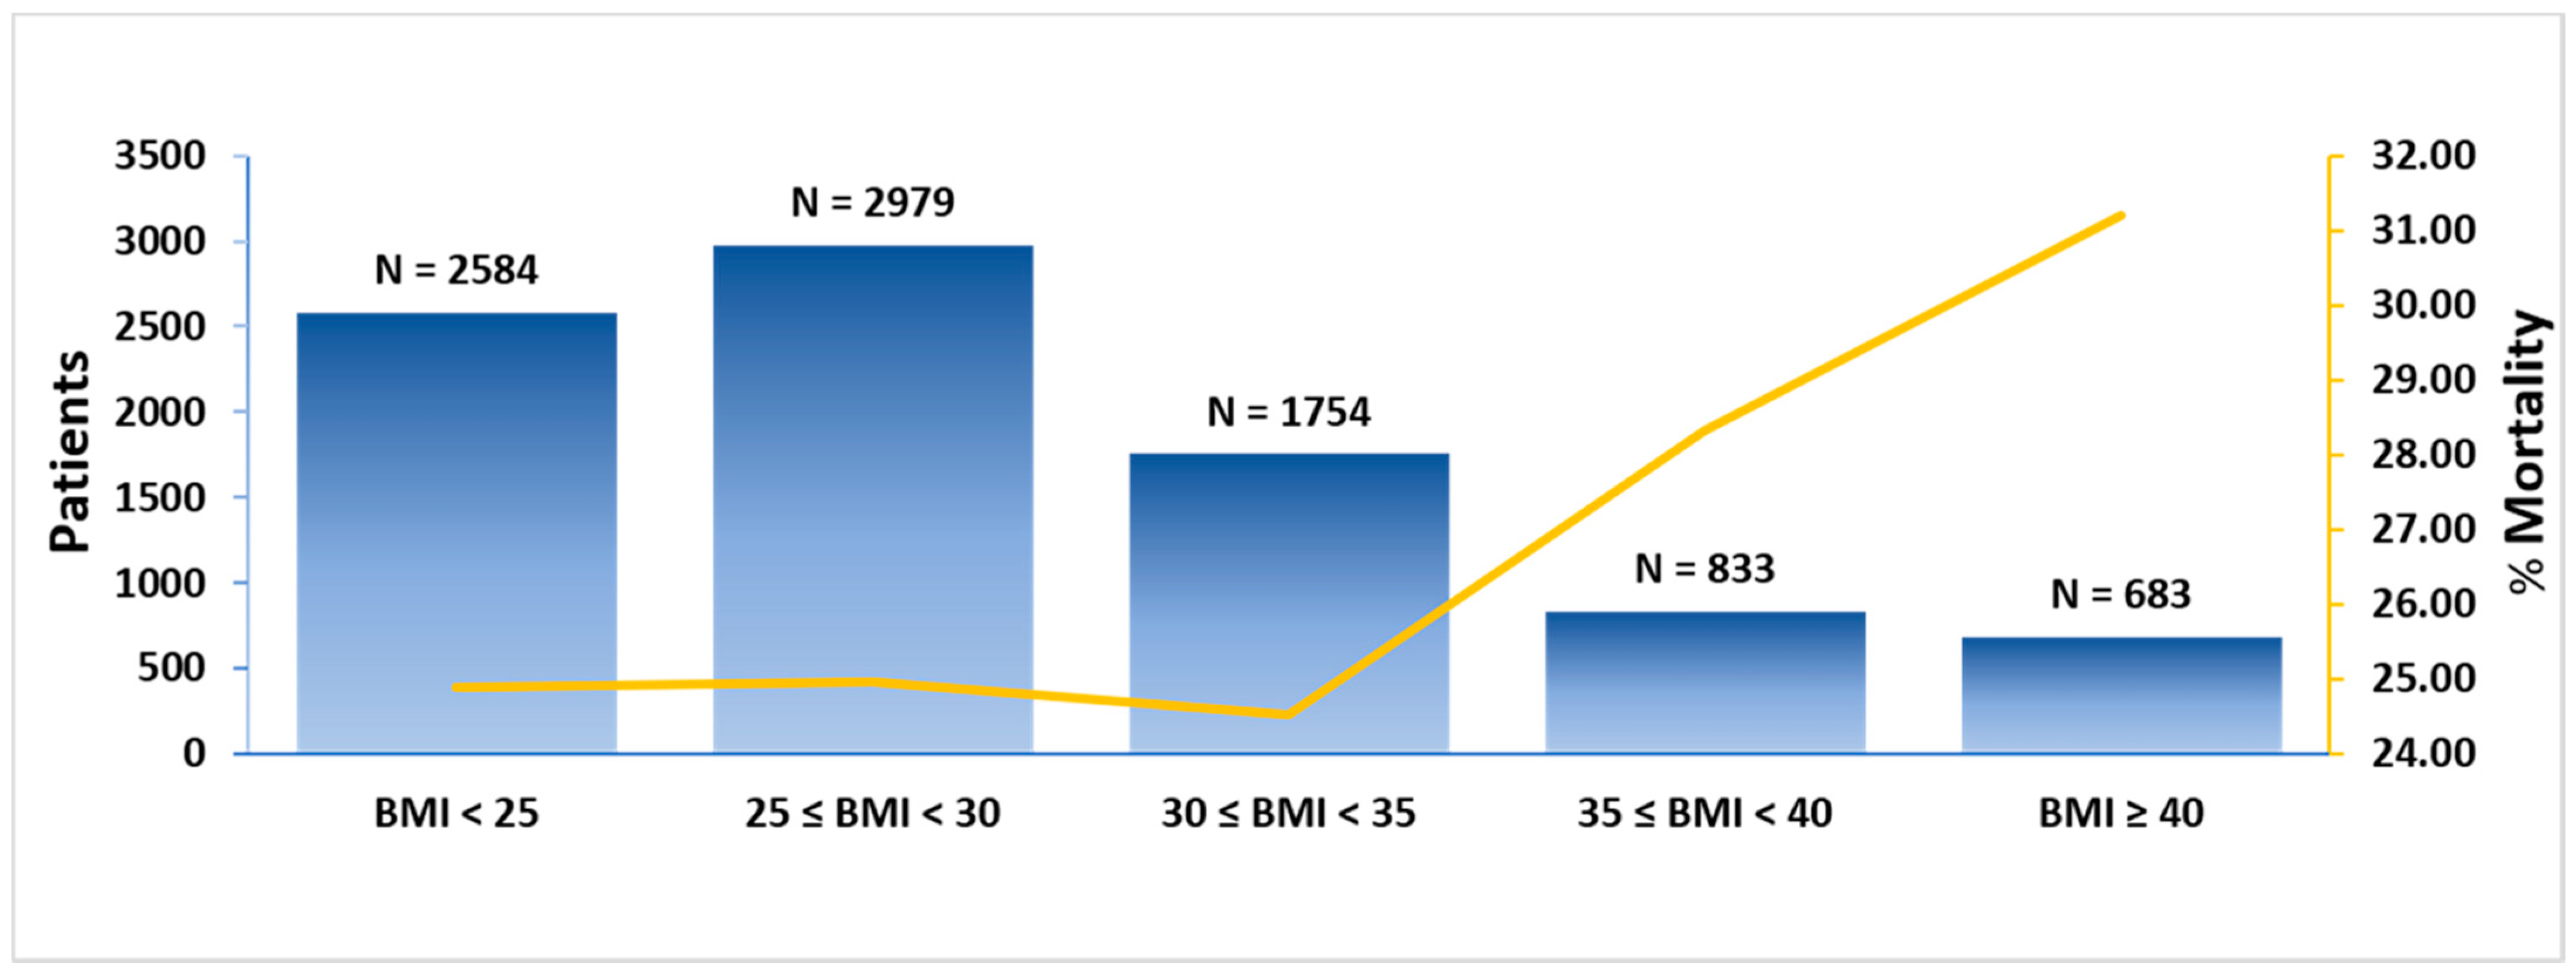
3.1.3. Outcomes
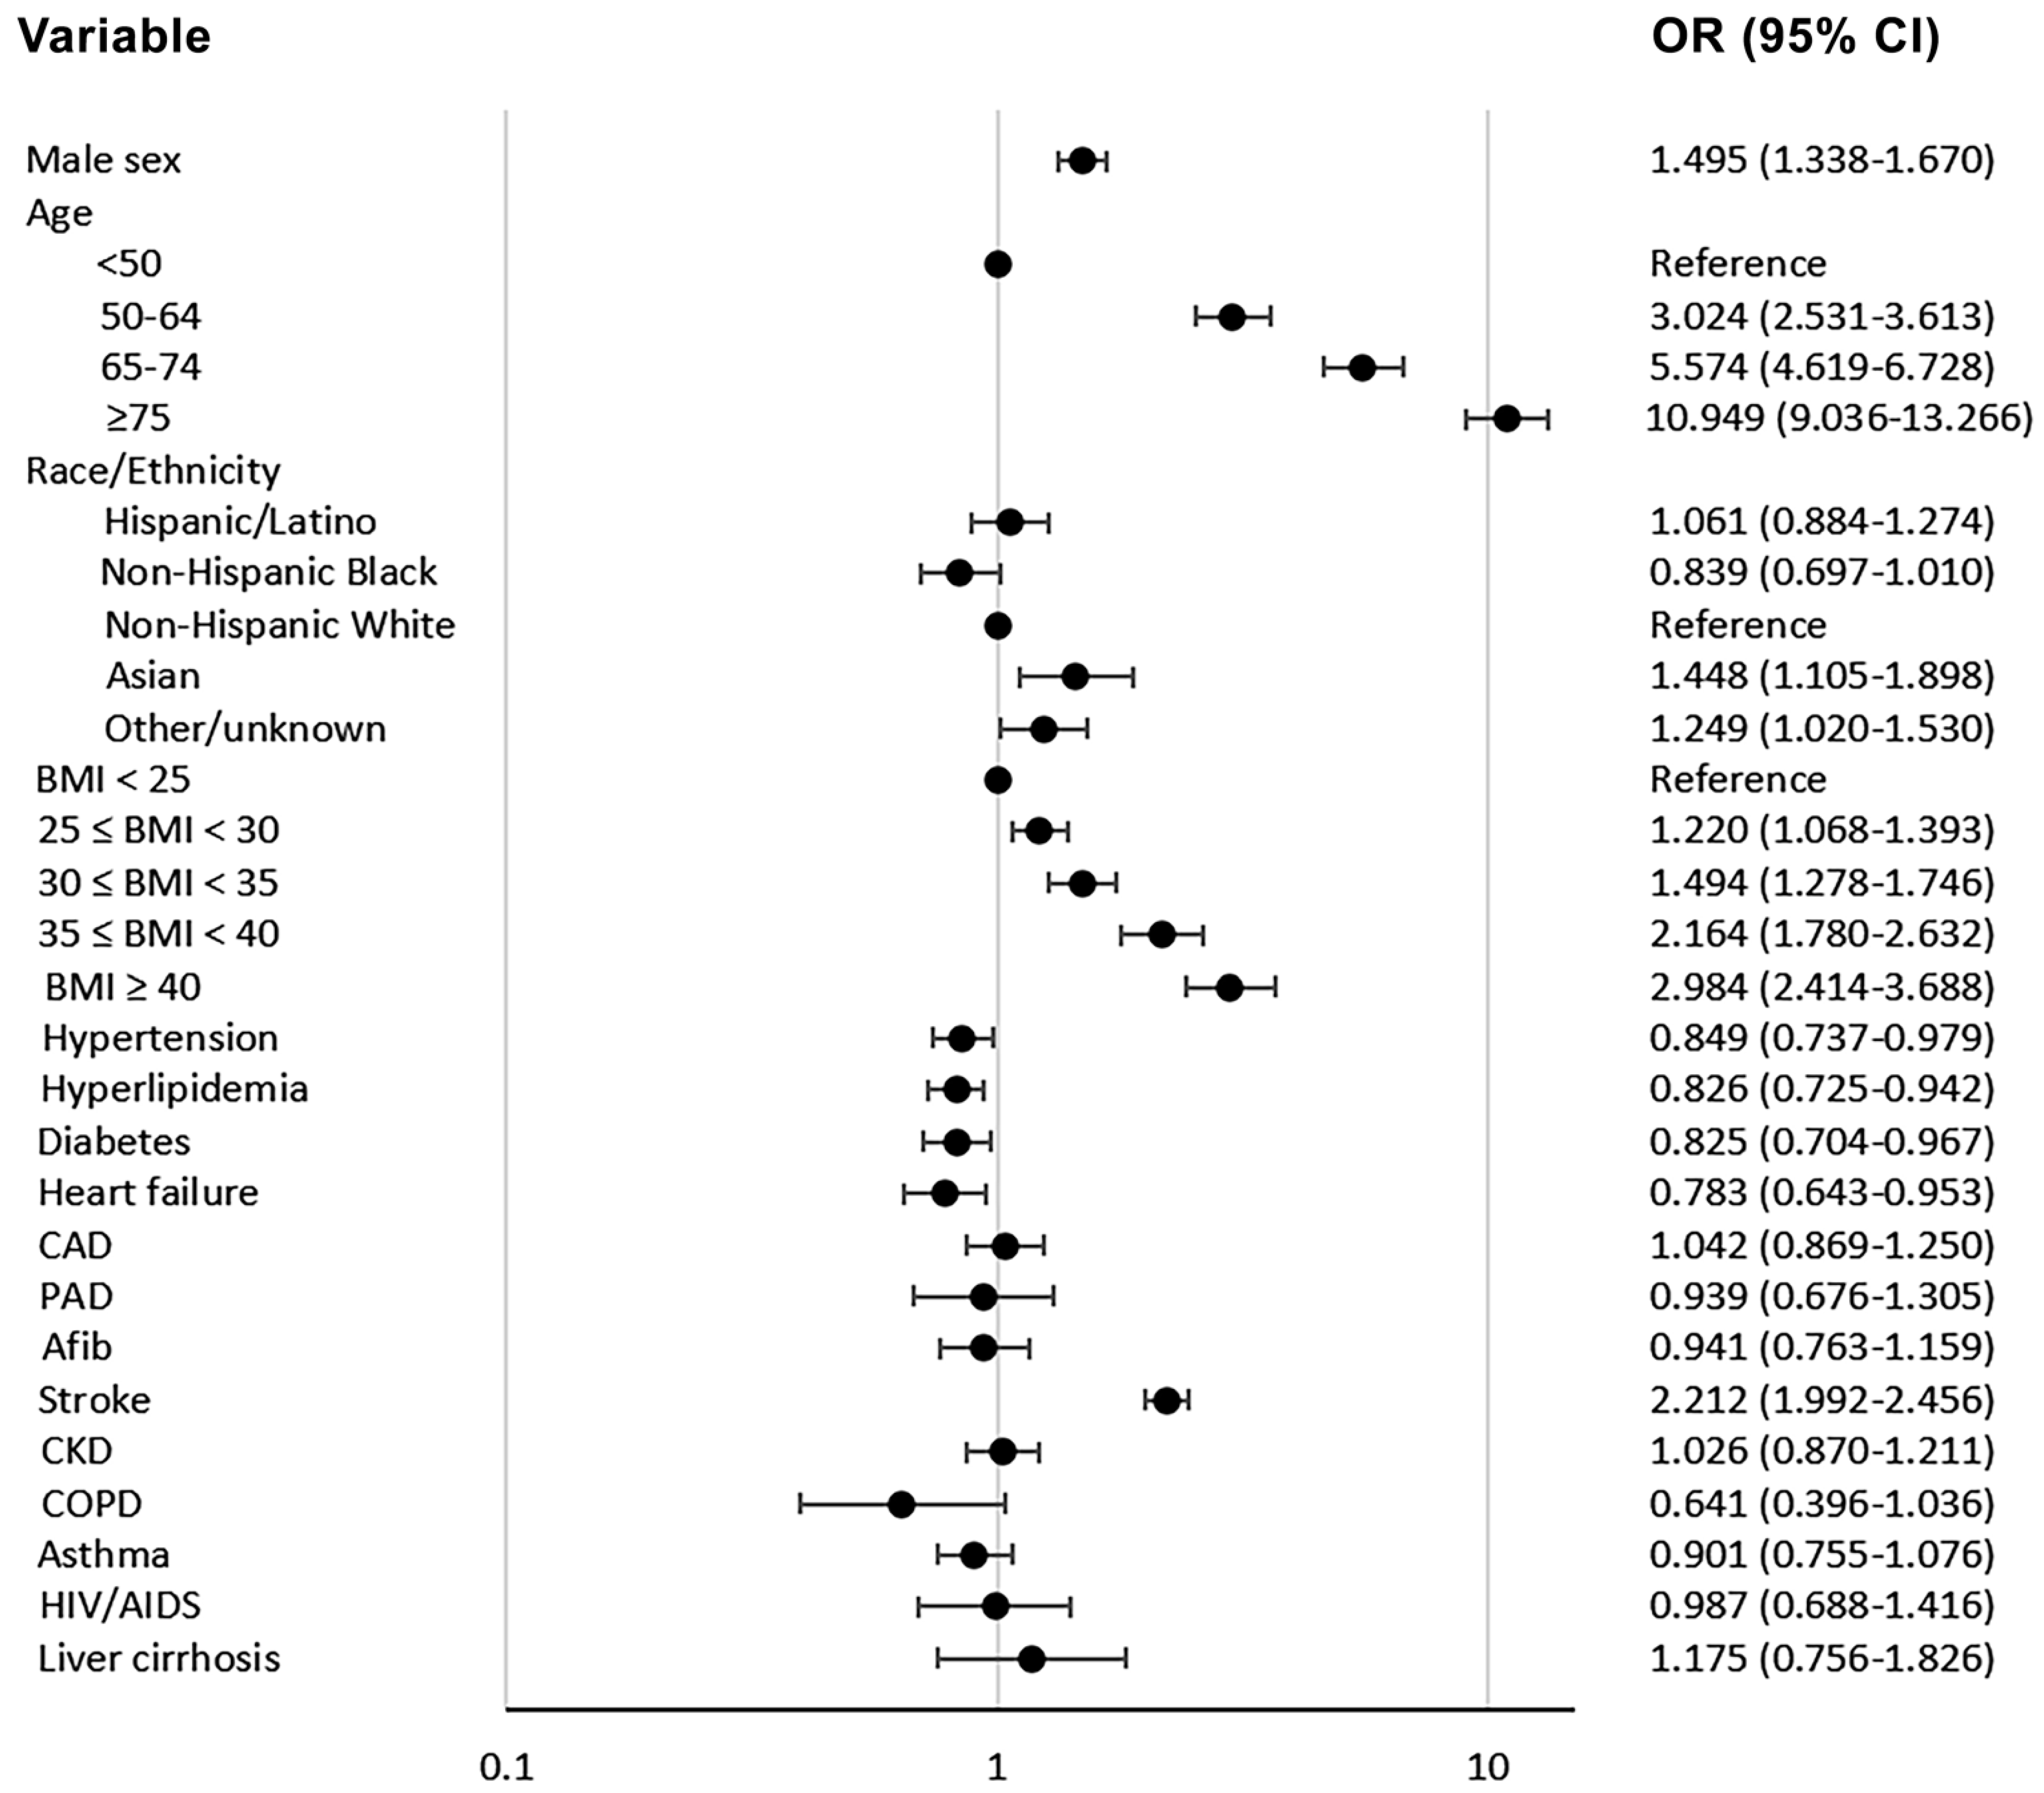
3.2. Logistic Regression Analyses
3.2.1. Baseline Characteristics and in-Hospital Mortality, Invasive Mechanical Ventilation, and Admission to ICU
3.2.2. Subgroup Analyses for in-Hospital Mortality
3.2.3. Inflammatory Cells and Markers and in-Hospital Mortality
4. Discussion
5. Conclusions
Supplementary Materials
Author Contributions
Funding
Institutional Review Board Statement
Informed Consent Statement
Data Availability Statement
Conflicts of Interest
References
- Centers for Disease Control and Prevention. Evidence Used to Update the List of Underlying Medical Conditions that Increase a Person’s Risk of Severe Illness from COVID-19. Last Updated: 2 November 2020. Available online: https://www.cdc.gov/coronavirus/2019-ncov/community/health-equity/race-ethnicity.html (accessed on 15 February 2021).
- Williamson, E.J.; Walker, A.J.; Bhaskaran, K.; Bacon, S.; Bates, C.; Morton, C.E.; Curtis, H.J.; Mehrkar, A.; Evans, D.; Inglesby, P.; et al. Factors associated with COVID-19-related death using OpenSAFELY. Nature 2020, 584, 430–436. [Google Scholar] [CrossRef] [PubMed]
- Cai, Q.; Chen, F.; Wang, T.; Luo, F.; Liu, X.; Wu, Q.; He, Q.; Wang, Z.; Liu, Y.; Liu, L.; et al. Obesity and COVID-19 severity in a designated hospital in Shenzhen, China. Diabetes Care 2020, 43, 1392–1398. [Google Scholar] [CrossRef]
- Lighter, J.; Phillips, M.; Hochman, S.; Sterling, S.; Johnson, D.; Francois, F.; Stachel, A. Obesity in patients younger than 60 years is a risk factor for COVID-19 hospital admission. Clin. Infect. Dis. 2020, 71, 896–897. [Google Scholar] [CrossRef] [Green Version]
- Kalligeros, M.; Shehadeh, F.; Mylona, E.K.; Benitez, G.; Beckwith, C.G.; Chan, P.A.; Mylonakis, E. Association of obesity with disease severity among patients with coronavirus disease 2019. Obesity 2020, 28, 1200–1204. [Google Scholar] [CrossRef] [PubMed]
- Simonnet, A.; Chetboun, M.; Poissy, J.; Raverdy, V.; Noulette, J.; Duhamel, A.; Labreuche, J.; Mathieu, D.; Pattou, F.; Jourdain, M.; et al. High prevalence of obesity in severe acute respiratory syndrome coronavirus-2 (SARS-CoV-2) requiring invasive mechanical ventilation. Obesity 2020, 28, 1195–1199. [Google Scholar] [CrossRef] [PubMed]
- Palaiodimos, L.; Kokkinidis, D.G.; Li, W.; Karamanis, D.; Ognibene, J.; Arora, S.; Southern, W.N.; Mantzoros, C.S. Severe obesity, increasing age and male sex are independently associated with worse in-hospital outcomes, and higher in-hospital mortality, in a cohort of patients with COVID-19 in the Bronx, New York. Metabolism 2020, 108, 154262. [Google Scholar] [CrossRef] [PubMed]
- Tartof, S.Y.; Qian, L.; Hong, V.; Wei, R.; Nadjafi, R.F.; Fischer, H.; Li, Z.; Shaw, S.F.; Caparosa, S.L.; Nau, C.L.; et al. Obesity and mortality among patients diagnosed with COVID-19: Results from an integrated health care organization. Ann. Intern. Med. 2020, 173, 773–781. [Google Scholar] [CrossRef]
- Centers for Disease Control and Prevention. Health Equity Considerations and Racial and Ethnic Minority Groups. Last Updated: 12 February 2021. Available online: https://www.cdc.gov/coronavirus/2019-ncov/need-extra-precautions/evidence-table.html (accessed on 15 February 2021).
- Millett, G.A.; Jones, A.T.; Benkeser, D.; Baral, S.; Mercer, L.; Beyrer, C.; Honermann, B.; Lankiewicz, E.; Mena, L.; Crowley, J.S.; et al. Assessing differential impacts of COVID-19 on black communities. Ann. Epidemiol. 2020, 47, 37–44. [Google Scholar] [CrossRef]
- Price-Haywood, E.G.; Burton, J.; Fort, D.; Seoane, L. Hospitalization and mortality among black patients and white patients with COVID-19. N. Engl. J. Med. 2020, 382, 2534–2543. [Google Scholar] [CrossRef]
- Cordes, J.; Castro, M.C. Spatial analysis of COVID-19 clusters and contextual factors in New York City. Spat. Spatio-Temporal Epidemiol. 2020, 34, 100355. [Google Scholar] [CrossRef]
- Kim, S.J.; Bostwick, W. Social Vulnerability and Racial Inequality in COVID-19 Deaths in Chicago. Health Educ. Behav. 2020, 47, 509–513. [Google Scholar] [CrossRef] [PubMed]
- Wadhera, R.K.; Wadhera, P.; Gaba, P.; Figueroa, J.F.; Maddox, K.E.J.; Yeh, R.W.; Shen, C. Variation in COVID-19 Hospitalizations and Deaths Across New York City Boroughs. JAMA 2020, 323, 2192–2195. [Google Scholar] [CrossRef] [PubMed]
- Yancy, C.W. COVID-19 and African Americans. JAMA 2020, 323, 1891–1892. [Google Scholar] [CrossRef] [PubMed] [Green Version]
- Centers for Disease Control and Prevention. Prevalence of Obesity among Adults, by Household Income and Education—United States, 2011–2014. Last Reviewed: 26 February 2018. Available online: https://www.cdc.gov/mmwr/volumes/66/wr/mm6650a1.htm?s_cid=mm6650a1_w (accessed on 15 February 2021).
- Iwasaki, M.; Saito, J.; Zhao, H.; Sakamoto, A.; Hirota, K.; Ma, D. Inflammation triggered by SARS-CoV-2 and ACE2 augment drives multiple organ failure of severe COVID-19: Molecular mechanisms and implications. Inflammation 2020, 44, 13–34. [Google Scholar] [CrossRef]
- Merad, M.; Martin, J.C. Pathological inflammation in patients with COVID-19: A key role for monocytes and macrophages. Nat. Rev. Immunol. 2020, 20, 355–362. [Google Scholar] [CrossRef]
- Ritter, A.; Kreis, N.N.; Louwen, F.; Yuan, J. Obesity and COVID-19: Molecular mechanisms linking both pandemics. Int. J. Mol. Sci. 2020, 21, 5793. [Google Scholar] [CrossRef]
- Dietz, W.; Santos-Burgoa, C. Obesity and its implications for COVID-19 mortality. Obesity 2020, 28, 1005. [Google Scholar] [CrossRef] [Green Version]
- Popkin, B.M.; Du, S.; Green, W.D.; Beck, M.A.; Algaith, T.; Herbst, C.H.; Alsukait, R.F.; Alluhidan, M.; Alazemi, N.; Shekar, M. Individuals with obesity and COVID-19: A global perspective on the epidemiology and biological relationships. Obes. Rev. 2020, 21, e13128. [Google Scholar] [CrossRef]
- Mostaghim, A.; Sinha, P.; Bielick, C.; Knudsen, S.; Beeram, I.; White, L.F.; Apovian, C.; Sagar, M.; Hochberg, N.S. Clinical outcomes and inflammatory marker levels in patients with COVID-19 and obesity at an inner-city safety net hospital. PLoS ONE 2020, 15, e0243888. [Google Scholar] [CrossRef]
- Kalyanaraman Marcello, R.; Dolle, J.; Grami, S.; Adule, R.; Li, Z.; Tatem, K.; Anyaogu, C.; Apfelroth, S.; Ayinla, R.; Boma, N.; et al. Characteristics and outcomes of COVID-19 patients in New York City’s public hospital system. PLoS ONE 2020, 15, e0243027. [Google Scholar]
- Hajifathalian, K.; Kumar, S.; Newberry, C.; Shah, S.; Fortune, B.; Krisko, T.; Ortiz-Pujols, S.; Zhou, X.K.; Dannenberg, A.J.; Kumar, R.; et al. Obesity is associated with worse outcomes in COVID-19: Analysis of early data from New York City. Obesity 2020, 28, 1606–1612. [Google Scholar] [CrossRef] [PubMed]
- Frank, R.C.; Mendez, S.R.; Stevenson, E.K.; Guseh, J.S.; Chung, M.; Silverman, M.G. Obesity and the Risk of Intubation or Death in Patients with Coronavirus Disease 2019. Crit. Care Med. 2020, 48, e1097–e1101. [Google Scholar] [CrossRef] [PubMed]
- Anderson, M.R.; Geleris, J.; Anderson, D.R.; Zucker, J.; Nobel, Y.R.; Freedberg, D.; Small-Saunders, J.; Rajagopalan, K.N.; Greendyk, R.; Chae, S.R.; et al. Body mass index and risk for intubation or death in SARS-CoV-2 infection: A retrospective cohort study. Ann. Intern. Med. 2020, 173, 782–790. [Google Scholar] [CrossRef] [PubMed]
- Nakeshbandi, M.; Maini, R.; Daniel, P.; Rosengarten, S.; Parmar, P.; Wilson, C.; Kim, J.M.; Oommen, A.; Mecklenburg, M.; Salvani, J.; et al. The impact of obesity on COVID-19 complications: A retrospective cohort study. Int. J. Obes. 2020, 44, 1832–1837. [Google Scholar] [CrossRef] [PubMed]
- Huang, Y.; Yao, L.U.; Huang, Y.M.; Min, W.A.; Wei, L.I.; Yi, S.U.; Hai-Lu, Z.H. Obesity in patients with COVID-19: A systematic review and meta-analysis. Metabolism 2020, 28, 154378. [Google Scholar] [CrossRef]
- Centers for Disease Control and Prevention. COVID-19 Outbreak–New York City, 29 February–1 June 2020. Last Reviewed: 17 December 2020. Available online: https://www.cdc.gov/mmwr/volumes/69/wr/mm6946a2.htm (accessed on 16 April 2021).
- Toth, A.T.; Tatem, K.S.; Hosseinipour, N.; Wong, T.; Newton-Dame, R.; Cohen, G.M.; George, A.; Sessa, T.; Postelnicu, R.; Uppal, A.; et al. Surge and Mortality in ICUs in New York City’s Public Healthcare System. Crit. Care Med. 2021, 49, 1439–1450. [Google Scholar] [CrossRef] [PubMed]
- Beigel, J.H.; Tomashek, K.M.; Dodd, L.E.; Mehta, A.K.; Zingman, B.S.; Kalil, A.C.; Hohmann, E.; Chu, H.Y.; Luetkemeyer, A.; Kline, S.; et al. Remdesivir for the treatment of COVID-19. N. Engl. J. Med. 2020, 383, 1813–1826. [Google Scholar] [CrossRef]
- The RECOVERY Collaborative Group. Dexamethasone in hospitalized patients with COVID-19—Preliminary report. N. Engl. J. Med. 2020, 384, 693–1704. [Google Scholar] [CrossRef]
- Mehta, P.; McAuley, D.F.; Brown, M.; Sanchez, E.; Tattersall, R.S.; Manson, J.J. COVID-19: Consider cytokine storm syndromes and immunosuppression. Lancet 2020, 395, 1033–1034. [Google Scholar] [CrossRef]
- Liu, F.; Li, L.; Xu, M.; Wu, J.; Luo, D.; Zhu, Y.; Li, B.; Song, X.; Zhou, X. Prognostic value of interleukin-6, C-reactive protein, patients with COVID-19 and procalcitonin in. J. Clin. Virol. 2020, 127, 104370. [Google Scholar] [CrossRef]
- Thirumalaisamy, P.V.; Meyer, C.G. Mild versus severe COVID-19: Laborytorma markers. Int. J. Infect. Dis. 2020, 95, 304–307. [Google Scholar]
- Han, H.; Ma, Q.; Li, C.; Liu, R.; Zhao, L.; Wang, W.; Zhang, P.; Liu, X.; Gao, G.; Liu, F.; et al. Profiling serum cytokines in COVID-19 patients reveals IL-6 and IL-10 are disease severity predictors. Emerg. Microbes Infect. 2020, 9, 1123–1130. [Google Scholar] [CrossRef] [PubMed]
- Zeng, F.; Huang, Y.; Guo, Y.; Yin, M.; Chen, X.; Xiao, L.; Deng, G. Association of inflammatory markers with the severity of COVID-19: A meta-analysis. Int. J. Infect. Dis. 2020, 96, 467–474. [Google Scholar] [CrossRef] [PubMed]
- Bhargava, A.; Fukushima, E.A.; Levine, M.; Zhao, W.; Tanveer, F.; Szpunar, S.M.; Saravolatz, L. Predictors for severe COVID-19 infection. Clin. Infect. Dis. 2020, 71, 1962–1968. [Google Scholar] [CrossRef]
- Alzaid, F.; Julla, J.B.; Diedisheim, M.; Potier, C.; Potier, L.; Velho, G.; Gaborit, B.; Manivet, P.; Germain, S.; Vidal-Trecan, T.; et al. Monocytopenia, monocyte morphological anomalies and hyperinflammation characterise severe COVID-19 in type 2 diabetes. EMBO Mol. Med. 2020, 12, e13038. [Google Scholar] [CrossRef]
- Southern, W. Early and Significant Reduction in C-Reactive Protein Levels After Corticosteroid Therapy Is Associated With Reduced Mortality in Patients With COVID-19. J. Hosp. Med. 2021, 16, 142–148. [Google Scholar]
- Mauvais-Jarvis, F. Aging, male sex, obesity, and metabolic inflammation create the perfect storm for COVID-19. Diabetes 2020, 69, 1857–1863. [Google Scholar] [CrossRef]
- Zhang, L.; Yan, X.; Fan, Q.; Liu, H.; Liu, X.; Liu, Z.; Zhang, Z. D-dimer levels on admission to predict in-hospital mortality in patients with COVID-19. J. Thromb. Haemost. 2020, 18, 1324–1329. [Google Scholar] [CrossRef]
- Henry, B.M.; De Oliveira, M.H.; Benoit, S.; Plebani, M.; Lippi, G. Hematologic, biochemical and immune biomarker abnormalities associated with severe illness and mortality in coronavirus disease 2019 (COVID-19): A meta-analysis. Clin. Chem. Lab. Med. (CCLM) 2020, 58, 1021–1028. [Google Scholar] [CrossRef] [Green Version]
- Henry, B.M.; Aggarwal, G.; Wong, J.; Benoit, S.; Vikse, J.; Plebani, M.; Lippi, G. Lactate dehydrogenase levels predict coronavirus disease 2019 (COVID-19) severity and mortality: A pooled analysis. Am. J. Emerg. Med. 2020, 38, 1722–1726. [Google Scholar] [CrossRef]
- Arshad, A.R.; Khan, I.; Shahzad, K.; Arshad, M.; Haider, S.J.; Aslam, M.J. Association of Inflammatory Markers with Mortality in COVID-19 Infection. Age (Years) 2020, 41, 16–74. [Google Scholar]
- Coomes, E.A.; Haghbayan, H. Interleukin-6 in COVID-19: A systematic review and meta-analysis. Rev. Med. Virol. 2020, 30, 1–9. [Google Scholar] [CrossRef] [PubMed]
- Jimeno, S.; Ventura, P.S.; Castellano, J.M.; García-Adasme, S.I.; Miranda, M.; Touza, P.; Lllana, I.; López-Escobar, A. Prognostic implications of neutrophil-lymphocyte ratio in COVID-19. Eur. J. Clin. Investig. 2021, 51, e13404. [Google Scholar] [CrossRef]
- Zhang, Y.; Somers, K.R.; Becari, C.; Polonis, K.; Pfeifer, M.A.; Allen, A.M.; Kellogg, T.A.; Covassin, N.; Singh, P. Comparative expression of renin-angiotensin pathway proteins in visceral versus subcutaneous fat. Front. Physiol. 2018, 9, 1370. [Google Scholar] [CrossRef] [Green Version]
- Iannelli, A.; Favre, G.; Frey, S.; Esnault, V.; Gugenheim, J.; Bouam, S.; Schiavo, L.; Tran, A.; Alifano, M. Obesity and COVID-19: ACE 2, the missing tile. Obes. Surg. 2020, 30, 4615–4617. [Google Scholar] [CrossRef] [PubMed]
- Pereira-Santos, M.; Costa, P.R.; Assis, A.M.; Santos, C.A.; Santos, D.B. Obesity and vitamin D deficiency: A systematic review and meta-analysis. Obes. Rev. 2015, 16, 341–349. [Google Scholar] [CrossRef] [PubMed]
- Angelidi, A.M.; Belanger, M.J.; Lorinsky, M.K.; Karamanis, D.; Chamorro-Pareja, N.; Ognibene, J.; Palaiodimos, L.; Mantzoros, C.S. Vitamin D status is associated with in-hospital mortality and mechanical ventilation: A cohort of COVID-19 hospitalized patients. Mayo Clin. Proc. 2021, 96, 875–886. [Google Scholar] [CrossRef]
- Lindström, S.; Germain, M.; Crous-Bou, M.; Smith, E.N.; Morange, P.E.; van Hylckama Vlieg, A.; de Haan, H.G.; Chasman, D.; Ridker, P.; Brody, J.; et al. Assessing the causal relationship between obesity and venous thromboembolism through a Mendelian Randomization study. Hum. Genet. 2017, 136, 897–902. [Google Scholar] [CrossRef]
- Kyriakoulis, K.G.; Kokkinidis, D.G.; Kyprianou, I.A.; Papanastasiou, C.A.; Archontakis-Barakakis, P.; Doundoulakis, I.; Bakoyiannis, C.; Giannakoulas, G.; Palaiodimos, L. Venous thromboembolism in the era of COVID-19. Phlebology 2020, 36, 91–99. [Google Scholar] [CrossRef]
- Watson, R.A.; Pride, N.B.; Thomas, E.L.; Fitzpatrick, J.; Durighel, G.; McCarthy, J.; Morin, S.X.; Ind, P.W.; Bell, J.D. Reduction of total lung capacity in obese men: Comparison of total intrathoracic and gas volumes. J. Appl. Physiol. 2010, 108, 1605–1612. [Google Scholar] [CrossRef]


| Characteristic | All Patients | BMI Group | ||||
|---|---|---|---|---|---|---|
| n = 8833 | BMI < 25 | 25 ≤ BMI < 30 | 30 ≤ BMI < 35 | 35 ≤ BMI < 40 | BMI ≥ 40 | |
| n = 2584 | n = 2979 | n = 1754 | n = 833 | n = 683 | ||
| Male sex—no. (%) | 5240 (59.32) | 1695 (65.6) | 1917 (64.35) | 950 (54.16) | 385 (46.22) | 293 (42.9) |
| Age—years | ||||||
| Median (IQR) | 62 (49–74) | 68 (55–80) | 62 (49–74) | 59 (47–70) | 59 (46–68) | 55 (43–67) |
| Distribution—no. (%) | ||||||
| <50 | 2270 (25.7) | 490 (18.96) | 762 (25.58) | 518 (29.53) | 243 (29.17) | 257 (37.63) |
| 50–64 | 2601 (29.45) | 606 (23.45) | 881 (29.57) | 580 (33.07) | 309 (37.09) | 225 (32.94) |
| 65–74 | 1863 (21.09) | 569 (22.02) | 630 (21.15) | 361 (20.58) | 168 (20.17) | 135 (19.77) |
| ≥75 | 2099 (23.76) | 919 (35.57) | 706 (23.7) | 295 (16.82) | 113 (13.57) | 66 (9.66) |
| Race/ethnicity—no. (%) | ||||||
| Hispanic/Latino | 3437 (38.91) | 870 (33.67) | 1255 (42.13) | 767 (43.73) | 333 (39.98) | 212 (31.04) |
| Non-Hispanic Black | 2702 (30.59) | 794 (30.73) | 800 (26.85) | 520 (29.65) | 296 (35.53) | 292 (42.75) |
| Non-Hispanic White | 832 (9.42) | 306 (11.84) | 256 (8.59) | 147 (8.38) | 62 (7.44) | 61 (8.93) |
| Asian | 445 (5.04) | 190 (7.35) | 177 (5.94) | 50 (2.85) | 19 (2.28) | 9 (1.32) |
| Other/Unknown | 1417 (16.04) | 424 (16.41) | 491 (16.48) | 270 (15.39) | 123 (14.77) | 109 (15.96) |
| Smoking—no./total no. (%) | ||||||
| Never Smoked | 3063 (34.68) | 769 (29.76) | 1063 (35.68) | 651 (37.12) | 319 (38.3) | 261 (38.21) |
| Active or former smoker | 882 (9.99) | 290 (11.22) | 292 (9.8) | 160 (9.12) | 78 (9.36) | 55 (8.05) |
| Unknown | 4888 (55.34) | 1525 (59.02) | 1624 (54.51) | 943 (53.76) | 436 (52.34) | 367 (53.73) |
| Comorbidities—no. (%) | ||||||
| Hypertension | 4632 (52.44) | 1351 (52.28) | 1538 (51.63) | 884 (50.4) | 467 (56.06) | 392 (57.39) |
| Hyperlipidemia | 2089 (23.65) | 597 (23.1) | 701 (23.53) | 415 (23.66) | 241 (28.93) | 135 (19.77) |
| Diabetes | 6674 (75.56) | 2030 (78.56) | 2175 (73.01) | 1288 (73.43) | 647 (77.67) | 534 (78.18) |
| Heart failure | 754 (8.54) | 268 (10.37) | 211 (7.08) | 127 (7.24) | 74 (8.88) | 74 (10.83) |
| CAD | 788 (8.92) | 262 (10.14) | 279 (9.37) | 140 (7.98) | 63 (7.56) | 44 (6.44) |
| PAD | 215 (2.43) | 83 (3.21) | 72 (2.42) | 33 (1.88) | 18 (2.16) | 9 (1.32) |
| A fib | 537 (6.08) | 167 (6.46) | 180 (6.04) | 101 (5.76) | 51 (6.12) | 38 (5.56) |
| Stroke | 3222 (36.48) | 919 (35.57) | 1136 (38.13) | 616 (35.12) | 298 (35.77) | 253 (37.04) |
| CKD | 1063 (12.03) | 387 (14.98) | 339 (11.38) | 169 (9.64) | 97 (11.64) | 71 (10.4) |
| COPD | 117 (1.32) | 60 (2.32) | 28 (0.94) | 15 (0.86) | 8 (0.96) | 6 (0.88) |
| Asthma | 911 (10.31) | 222 (8.59) | 224 (7.52) | 184 (10.49) | 127 (15.25) | 154 (22.55) |
| HIV/AIDS | 212 (2.4) | 84 (3.25) | 55 (1.85) | 39 (2.22) | 12 (1.44) | 22 (3.22) |
| Liver cirrhosis | 138 (1.56) | 42 (1.63) | 56 (1.88) | 26 (1.48) | 9 (1.08) | 5 (0.73) |
| Marker | All Patients | BMI Group | ||||||||||
|---|---|---|---|---|---|---|---|---|---|---|---|---|
| BMI < 25 | 25 ≤ BMI < 30 | 30 ≤ BMI < 35 | 35 ≤ BMI < 40 | BMI ≥ 40 | ||||||||
| No. | Median (IQR) | No. (%) | Median (IQR) | No. (%) | Median (IQR) | No. (%) | Median (IQR) | No. (%) | Median (IQR) | No. (%) | Median (IQR) | |
| WBC—103/μL | 8795 | 7.90 (5.79–11.01) | 2574 (29.27) | 8.13 (5.73–11.69) | 2963 (33.69) | 7.88 (5.83–10.77) | 1745 (19.84) | 7.78 (5.91–10.77) | 832 (9.46) | 7.89 (5.67–10.85) | 681 (7.74) | 7.53 (5.72–10.25) |
| Neutrophils—103/μL | 8795 | 5.94 (4.03–8.89) | 2574 (29.27) | 6.24 (3.95–9.72) | 2963 (33.69) | 5.96 (4.09–8.79) | 1745 (19.84) | 5.86 (4.13–8.46) | 832 (9.46) | 5.81 (3.99–8.58) | 681 (7.74) | 5.58 (3.86–8.04) |
| Monocytes—103/μL | 8795 | 0.51 (0.35–0.73) | 2574 (29.27) | 0.53 (0.36–0.75) | 2963 (33.69) | 0.50 (0.35–0.72) | 1745 (19.84) | 0.49 (0.34–0.71) | 832 (9.46) | 0.50 (0.33–0.72) | 681 (7.74) | 0.51 (0.34–0.72) |
| Lymphocytes—103/μL | 8795 | 1.03 (0.72–1.45) | 2574 (29.27) | 0.96 (0.66–1.39) | 2963 (33.69) | 1.01 (0.72–1.42) | 1745 (19.84) | 1.08 (0.77–1.53) | 832 (9.46) | 1.12 (0.78–1.49) | 681 (7.74) | 1.12 (0.81–1.57) |
| LDH—U/L | 6476 | 432.0 (310.0–611.0) | 1822 (28.13) | 410.5 (289.0–580.0) | 2176 (33.6) | 434.0 (316.5–612.5) | 1313 (20.27) | 434.0 (317.0–615.0) | 648 (10.01) | 465.0 (331.0–666.0) | 517 (7.98) | 446.0 (334.0–626.0) |
| Ferritin—ng/mL | 6285 | 740.0 (337.0–1447.0) | 1790 (28.48) | 744.8 (337.5–1549.0) | 2085 (33.17) | 835.2 (395.0–1544.0) | 1269 (20.19) | 668.0 (308.0–1366.1) | 638 (10.15) | 659.0 (318.0–1267.6) | 503 (8) | 574.0 (253.0–1157.0) |
| CRP—mg/dL | 3114 | 24.22 (8.40–92.80) | 897 (28.81) | 19.57 (6.56–86.10) | 997 (32.02) | 26.82 (10.09–111.81) | 614 (19.72) | 23.01 (8.61–97.15) | 327 (10.5) | 28.44 (8.50–95.10) | 279 (8.96) | 22.99 (9.51–69.10) |
| Interleukin 6—pg/mL | 2237 | 82.10 (35.50–174.30) | 596 (26.64) | 77.45 (33.55–175.15) | 720 (32.19) | 91.25 (39.60–191.25) | 472 (21.1) | 76.50 (34.55–156.85) | 248 (11.09) | 80.20 (36.30–188.15) | 201 (8.99) | 85.10 (32.30–164.00) |
| Albumin—g/dL | 8357 | 3.70 (3.40–4.10) | 2455 (29.38) | 3.60 (3.20–4.00) | 2809 (33.61) | 3.80 (3.40–4.10) | 1657 (19.83) | 3.80 (3.40–4.10) | 788 (9.43) | 3.70 (3.40–4.00) | 648 (7.75) | 3.70 (3.40–4.00) |
| D-dimer—mg/mL | 6471 | 598.0 (304.0–1715.0) | 1844 (28.5) | 766.0 (365.5–2371.5) | 2197 (33.95) | 565.0 (299.0–1357.0) | 1286 (19.87) | 528.0 (279.0–1333.0) | 624 (9.64) | 523.5 (287.0–1105.5) | 520 (8.04) | 484.0 (261.0–1079.0) |
| N/L | 8795 | 5.74 (3.40–9.93) | 2574 (29.27) | 6.37 (3.53–11.33) | 2963 (33.69) | 5.98 (3.53–9.97) | 1745 (19.84) | 5.35 (3.30–8.99) | 832 (9.46) | 5.26 (3.21–8.86) | 681 (7.74) | 4.77 (3.01–7.81) |
| L/CRP | 3109 | 3.98 (1.07–12.32) | 896 (28.82) | 4.64 (1.05–16.17) | 995 (32) | 3.46 (0.91–10.17) | 613 (19.72) | 4.11 (1.10–12.81) | 327 (10.52) | 3.14 (1.22–13.75) | 278 (8.94) | 4.61 (1.69–11.61) |
| Outcome | All Patients | BMI Group | ||||
|---|---|---|---|---|---|---|
| BMI < 25 | 25 ≤ BMI < 30 | 30 ≤ BMI < 35 | 35 ≤ BMI < 40 | BMI ≥ 40 | ||
| n = 8833 | n = 2584 | n = 2979 | n = 1754 | n = 833 | n = 683 | |
| No. (%) | No. (%) | No. (%) | No. (%) | No. (%) | No. (%) | |
| Intubation | 871 (9.86) | 201 (7.78) | 300 (10.07) | 174 (9.92) | 93 (11.16) | 103 (15.08) |
| ICU | 1796 (20.33) | 442 (17.11) | 580 (19.47) | 387 (22.06) | 203 (24.37) | 184 (26.94) |
| Mortality | 2266 (25.65) | 643 (24.88) | 744 (24.97) | 430 (24.52) | 236 (28.33) | 213 (31.19) |
| with intubation 2 | 586 (25.86) | 128 (19.91) | 200 (26.88) | 113 (26.28) | 71 (30.08) | 74 (34.74) |
| without intubation 2 | 1680 (74.14) | 515 (80.09) | 544 (73.12) | 317 (73.72) | 165 (69.92) | 139 (65.26) |
| with ICU 2 | 938 (41.39) | 179 (27.84) | 302 (40.59) | 222 (51.63) | 120 (50.85) | 115 (53.99) |
| without ICU 2 | 1328 (58.61) | 464 (72.16) | 442 (59.41) | 208 (48.37) | 116 (49.15) | 98 (46.01) |
| 1st quartile (3/3–29/3/2020) | 644/2209 (29.15) | 142/519 (27.36) | 206/775 (26.58) | 141/495 (28.48) | 70/213 (32.86) | 85/207 (41.06) |
| 2nd quartile (29/3–8/4/2020) | 783/2208 (35.46) | 218/592 (36.82) | 272/779 (34.92) | 136/412 (33.01) | 91/254 (35.83) | 66/171 (38.60) |
| 3rd quartile (8/4–23/4/2020) | 640/2208 (28.99) | 203/688 (29.51) | 213/737 (28.90) | 119/416 (28.61) | 55/198 (27.78) | 50/169 (29.59) |
| 4th quartile 23/4–31/10/2020) | 199/2208 (9.01) | 80/785 (10.19) | 53/688 (7.70) | 34/431 (7.89) | 20/168 (11.90) | 12/136 (8.82) |
| Variable | Univariate Analysis | Multivariate Analysis | |||
|---|---|---|---|---|---|
| Model A | Model B | Model C | Model D | ||
| n = 8833 | n = 8833 | n = 8833 | n = 8833 | ||
| OR, 95% CI, p-Value | OR, 95% CI, p-Value | OR, 95% CI, p-Value | OR, 95% CI, p-Value | OR, 95% CI, p-Value | |
| Male sex | 1.192 (1.081–1.315) p < 0.001 | 1.495 (1.338–1.670) p < 0.001 | 1.450 (1.299–1.619) p < 0.001 | 1.451 (1.300–1.620) p < 0.001 | 1.401 (1.257–1.562) p < 0.001 |
| Age (All) | 1.045 (1.042–1.048) p < 0.001 | ||||
| <50 (reference) | * | * | * | * | * |
| 50–64 | 2.676 (2.259–3.170) p < 0.001 | 3.024 (2.531–3.613) p < 0.001 | 2.930 (2.455–3.498) p < 0.001 | 2.976 (2.492–3.554) p < 0.001 | 2.987 (2.501–3.566) p < 0.001 |
| 65–74 | 4.466 (3.761–5.303) p < 0.001 | 5.574 (4.619–6.728) p < 0.001 | 5.288 (4.387–6.373) p < 0.001 | 5.357 (4.443–6.459) p < 0.001 | 5.224 (4.335–6.295) p < 0.001 |
| ≥75 | 7.358 (6.234–8.684) p < 0.001 | 10.949 (9.036–13.266) p < 0.001 | 10.001 (8.281–12.078) p < 0.001 | 10.022 (8.300–12.101) p < 0.001 | 9.488 (7.871–11.438) p < 0.001 |
| Ethnicity/Race | |||||
| Hispanic/Latino | 0.597 (0.507–0.703) p < 0.001 | 1.061 (0.884–1.274) p = 0.522 | 1.048 (0.874–1.257) p = 0.611 | 1.071 (0.893–1.285) p = 0.457 | 1.073 (0.896–1.286) p = 0.443 |
| Non-Hispanic Black | 0.617 (0.521–0.730) p < 0.001 | 0.839 (0.697–1.010) p = 0.063 | 0.845 (0.702–1.016) p = 0.073 | 0.842 (0.700–1.013) p = 0.069 | 0.849 (0.706–1.020) p = 0.080 |
| Non-Hispanic White | * | * | * | * | * |
| Asian | 0.877 (0.685–1.123) p = 0.297 | 1.448 (1.105–1.898) p = 0.007 | 1.408 (1.076–1.843) p = 0.013 | 1.383 (1.057–1.810) p = 0.018 | 1.340 (1.025–1.752) p = 0.032 |
| Other/unknown | 0.792 (0.658–0.952) p = 0.013 | 1.249 (1.020–1.530) p = 0.031 | 1.245 (1.018–1.523) p = 0.033 | 1.247 (1.018–1.526) p = 0.033 | 1.246 (1.019–1.524) p = 0.032 |
| BMI < 25 (reference) | * | * | |||
| 25 ≤ BMI < 30 | 1.005 (0.890–1.135) p = 0.938 | 1.220 (1.068–1.393) p = 0.003 | |||
| 30 ≤ BMI < 35 | 0.980 (0.852–1.128) p = 0.783 | 1.494 (1.278–1.746) p < 0.001 | |||
| 35 ≤ BMI < 40 | 1.193 (1.002–1.422) p = 0.048 | 2.164 (1.780–2.632) p < 0.001 | |||
| BMI ≥ 30 | 1.107 (1.003–1.221) p = 0.043 | 1.672 (1.495–1.870) p < 0.001 | |||
| BMI ≥ 35 | 1.274 (1.127–1.440) p < 0.001 | 2.046 (1.781–2.351) p < 0.001 | |||
| BMI ≥ 40 | 1.346 (1.136–1.594) p < 0.001 | 2.984 (2.414–3.688) p < 0.001 | 2.242 (1.855–2.710) p < 0.001 | ||
| Hypertension | 1.303 (1.184–1.435) p < 0.001 | 0.849 (0.737–0.979) p = 0.024 | 0.871 (0.757–1.003) p = 0.056 | 0.873 (0.758–1.006) p = 0.060 | 0.882 (0.766–1.015) p = 0.080 |
| Hyperlipidemia | 1.044 (0.934–1.167) p = 0.450 | 0.826 (0.725–0.942) p = 0.004 | 0.822 (0.721–0.936) p = 0.003 | 0.827 (0.726–0.941) p = 0.004 | 0.843 (0.741–0.960) p = 0.010 |
| Diabetes | 1.113 (0.994–1.246) p = 0.063 | 0.825 (0.704–0.967) p = 0.017 | 0.821 (0.701–0.962) p = 0.015 | 0.810 (0.691–0.949) p = 0.009 | 0.810 (0.692–0.948) p = 0.009 |
| Heart failure | 1.098 (0.929–1.299) p = 0.273 | 0.783 (0.643–0.953) p = 0.015 | 0.795 (0.654–0.967) p = 0.022 | 0.784 (0.644–0.953) p = 0.015 | 0.787 (0.648–0.957) p = 0.016 |
| CAD | 1.445 (1.235–1.691) p < 0.001 | 1.042 (0.869–1.250) p = 0.657 | 1.031 (0.860–1.236) p = 0.742 | 1.047 (0.873–1.255) p = 0.622 | 1.038 (0.866–1.245) p = 0.683 |
| PAD | 1.099 (0.811–1.488) p = 0.544 | 0.939 (0.676–1.305) p = 0.710 | 0.925 (0.667–1.285) p = 0.643 | 0.921 (0.664–1.279) p = 0.624 | 0.918 (0.661–1.273) p = 0.607 |
| A fib | 1.515 (1.258–1.824) p < 0.001 | 0.941 (0.763–1.159) p = 0.564 | 0.949 (0.771–1.168) p = 0.620 | 0.957 (0.778–1.178) p = 0.680 | 0.969 (0.788–1.193) p = 0.768 |
| Stroke | 2.462 (2.233–2.715) p < 0.001 | 2.212 (1.992–2.456) p < 0.001 | 2.218 (1.998–2.461) p < 0.001 | 2.221 (2.001–2.465) p < 0.001 | 2.210 (1.992–2.452) p < 0.001 |
| CKD | 1.100 (0.952–1.271) p = 0.195 | 1.026 (0.870–1.211) p = 0.757 | 1.023 (0.867–1.206) p = 0.789 | 1.008 (0.855–1.188) p = 0.925 | 1.007 (0.855–1.187) p = 0.931 |
| COPD | 0.745 (0.475–1.170) p = 0.202 | 0.641 (0.396–1.036) p = 0.070 | 0.623 (0.386–1.006) p = 0.053 | 0.616 (0.382–0.993) p = 0.047 | 0.610 (0.378–0.983) p = 0.043 |
| Asthma | 0.866 (0.737–1.019) p = 0.082 | 0.901 (0.755–1.076) p = 0.250 | 0.947 (0.795–1.129) p = 0.545 | 0.916 (0.768–1.093) p = 0.332 | 0.930 (0.780–1.109) p = 0.420 |
| HIV/AIDS | 0.732 (0.522–1.027) p = 0.071 | 0.987 (0.688–1.416) p = 0.942 | 0.968 (0.675–1.389) p = 0.862 | 0.974 (0.680–1.396) p = 0.887 | 0.937 (0.655–1.342) p = 0.724 |
| Liver cirrhosis | 0.802 (0.534–1.206) p = 0.290 | 1.175 (0.756–1.826) p = 0.473 | 1.165 (0.751 1.805) p = 0.496 | 1.161 (0.748–1.802) p = 0.505 | 1.142 (0.736–1.772) p = 0.555 |
| Variable | Univariate Analysis | Multivariate Analysis | |||
|---|---|---|---|---|---|
| Model A | Model B | Model C | Model D | ||
| n = 8833 | n = 8833 | n = 8833 | n = 8833 | ||
| OR, 95% CI, p-Value | OR, 95% CI, p-Value | OR, 95% CI, p-Value | OR, 95% CI, p-Value | OR, 95% CI, p-Value | |
| Male sex | 1.512 (1.303–1.756) p < 0.001 | 1.553 (1.328–1.816) p < 0.001 | 1.509 (1.292–1.764) p < 0.001 | 1.515 (1.297–1.771) p < 0.001 | 1.485 (1.272–1.734) p < 0.001 |
| Age (All) | 1.005 (1.001–1.009) p = 0.009 | ||||
| <50 | * | * | * | * | * |
| 50–64 | 1.673 (1.370–2.043) p < 0.001 | 1.886 (1.530–2.324) p < 0.001 | 1.832 (1.487–2.256) p < 0.001 | 1.850 (1.502–2.280) p < 0.001 | 1.872 (1.519–2.307) p < 0.001 |
| 65–74 | 1.803 (1.459–2.226) p < 0.001 | 2.274 (1.807–2.861) p < 0.001 | 2.165 (1.722–2.722) p < 0.001 | 2.187 (1.740–2.749) p < 0.001 | 2.171 (1.728–2.729) p < 0.001 |
| ≥75 | 1.227 (0.985–1.530) p = 0.068 | 1.884 (1.470–2.414) p < 0.001 | 1.728 (1.352–2.210) p < 0.001 | 1.735 (1.358–2.217) p < 0.001 | 1.702 (1.334–2.172) p < 0.001 |
| Ethnicity/Race | |||||
| Hispanic/Latino | 1.329 (1.017–1.736) p = 0.037 | 1.411 (1.070–1.861) p = 0.015 | 1.402 (1.064–1.846) p = 0.016 | 1.425 (1.082–1.878) p = 0.012 | 1.440 (1.093–1.897) p = 0.010 |
| Non-Hispanic Black | 0.842 (0.633–1.120) p = 0.237 | 0.823 (0.614–1.103) p = 0.191 | 0.833 (0.622–1.116) p = 0.221 | 0.829 (0.619–1.111) p = 0.209 | 0.833 (0.622–1.115) p = 0.220 |
| Non-Hispanic White | * | * | * | * | * |
| Asian | 1.829 (1.275–2.622) p = 0.001 | 2.025 (1.400–2.929) p <0.001 | 1.955 (1.352–2.825) p <0.001 | 1.935 (1.340–2.795) p <0.001 | 1.915 (1.326–2.765) p <0.001 |
| Other/Unknown | 1.474 (1.100–1.976) p = 0.009 | 1.460 (1.082–1.970) p = 0.013 | 1.462 (1.084–1.971) p = 0.013 | 1.464 (1.086–1.975) p = 0.013 | 1.469 (1.089–1.981) p = 0.012 |
| BMI < 25 (reference) | * | * | |||
| 25 ≤ BMI < 30 | 1.328 (1.101–1.601) p = 0.003 | 1.350 (1.115–1.635) p = 0.002 | |||
| 30 ≤ BMI < 35 | 1.306 (1.055–1.615) p = 0.014 | 1.456 (1.168–1.816) p < 0.001 | |||
| 35 ≤ BMI < 40 | 1.490 (1.150–1.931) p = 0.003 | 1.809 (1.381–2.370) p < 0.001 | |||
| BMI ≥ 30 | 1.289 (1.119–1.486) p < 0.001 | 1.480 (1.274–1.719) p < 0.001 | |||
| BMI ≥ 35 | 1.461 (1.233–1.731) p < 0.001 | 1.758 (1.470–2.104) p < 0.001 | |||
| BMI ≥ 40 | 1.707 (1.367–2.132) p < 0.001 | 2.827 (2.157–3.705) p < 0.001 | 2.122 (1.680–2.680) p < 0.001 | ||
| Hypertension | 0.971 (0.844–1.117) p = 0.681 | 1.026 (0.844–1.248) p = 0.793 | 1.060 (0.873–1.289) p = 0.556 | 1.054 (0.868–1.281) p = 0.594 | 1.059 (0.872–1.287) p = 0.561 |
| Hyperlipidemia | 0.884 (0.747–1.047) p = 0.154 | 0.861 (0.713–1.040) p = 0.120 | 0.853 (0.707–1.029) p = 0.097 | 0.857 (0.710–1.034) p = 0.108 | 0.876 (0.726–1.057) p = 0.167 |
| Diabetes | 0.851 (0.727–0.997) p = 0.046 | 0.836 (0.679–1.030) p = 0.093 | 0.827 (0.672–1.017) p = 0.072 | 0.822 (0.668–1.012) p = 0.064 | 0.818 (0.665–1.007) p = 0.058 |
| Heart failure | 0.760 (0.577–1.001) p = 0.051 | 0.867 (0.640–1.173) p = 0.354 | 0.878 (0.649–1.187) p = 0.396 | 0.864 (0.639–1.169) p = 0.342 | 0.860 (0.635–1.163) p = 0.327 |
| CAD | 0.707 (0.536–0.933) p = 0.014 | 0.710 (0.526–0.958) p = 0.025 | 0.708 (0.525–0.955) p = 0.024 | 0.716 (0.531–0.966) p = 0.029 | 0.714 (0.529–0.963) p = 0.027 |
| PAD | 0.681 (0.401–1.156) p = 0.155 | 0.853 (0.494–1.473) p = 0.568 | 0.839 (0.487–1.448) p = 0.530 | 0.838 (0.485–1.446) p = 0.525 | 0.839 (0.486–1.448) p = 0.529 |
| A fib | 0.764 (0.553–1.056) p = 0.103 | 0.826 (0.586–1.163) p = 0.274 | 0.841 (0.598–1.184) p = 0.321 | 0.841 (0.598–1.184) p = 0.321 | 0.850 (0.604–1.197) p = 0.352 |
| Stroke | 1.111 (0.962–1.282) p = 0.153 | 1.121 (0.967–1.300) p = 0.131 | 1.133 (0.978–1.314) p = 0.097 | 1.134 (0.978–1.315) p = 0.095 | 1.132 (0.977–1.313) p = 0.099 |
| CKD | 0.943 (0.757–1.173) p = 0.597 | 1.104 (0.870–1.400) p = 0.416 | 1.089 (0.859–1.381) p = 0.482 | 1.076 (0.848–1.364) p = 0.548 | 1.077 (0.850–1.366) p = 0.539 |
| COPD | 0.853 (0.444–1.636) p = 0.632 | 0.936 (0.479–1.827) p = 0.846 | 0.893 (0.458–1.740) p = 0.739 | 0.885 (0.454–1.726) p = 0.720 | 0.884 (0.453–1.722) p = 0.717 |
| Asthma | 0.934 (0.739–1.182) p = 0.571 | 0.957 (0.749–1.223) p = 0.726 | 1.006 (0.789–1.283) p = 0.963 | 0.980 (0.768–1.251) p = 0.871 | 0.973 (0.762–1.243) p = 0.828 |
| HIV/AIDS | 1.172 (0.762–1.803) p = 0.471 | 1.323 (0.852–2.055) p = 0.212 | 1.288 (0.830–1.998) p = 0.259 | 1.298 (0.837–2.013) p = 0.245 | 1.266 (0.816–1.963) p = 0.292 |
| Liver cirrhosis | 0.789 (0.425–1.467) p = 0.454 | 0.782 (0.416–1.468) p = 0.444 | 0.773 (0.412–1.451) p = 0.423 | 0.776 (0.414–1.456) p = 0.430 | 0.771 (0.411–1.446) p = 0.418 |
| Variable | Univariate Analysis | Multivariate Analysis | |||
|---|---|---|---|---|---|
| Model A | Model B | Model C | Model D | ||
| n = 8833 | n = 8833 | n = 8833 | n = 8833 | ||
| OR, 95% CI, p-Value | OR, 95% CI, p-Value | OR, 95% CI, p-Value | OR, 95% CI, p-Value | OR, 95% CI, p-Value | |
| Male sex | 1.672 (1.497–1.867) p = <0.001 | 1.669 (1.486–1.875) p = <0.001 | 1.641 (1.462–1.843) p = <0.001 | 1.622 (1.445–1.820) p = <0.001 | 1.581 (1.410–1.773) p = <0.001 |
| Age (All) | 0.998 (0.995–1.001) p = 0.248 | ||||
| <50 | * | * | * | * | * |
| 50–64 | 1.598 (1.389–1.837) p = <0.001 | 1.666 (1.437–1.931) p = <0.001 | 1.640 (1.415–1.901) p = <0.001 | 1.648 (1.422–1.910) p = <0.001 | 1.654 (1.427–1.917) p = <0.001 |
| 65–74 | 1.441 (1.238–1.679) p = <0.001 | 1.601 (1.354–1.893) p = <0.001 | 1.558 (1.318–1.842) p = <0.001 | 1.553 (1.314–1.835) p = <0.001 | 1.533 (1.298–1.811) p = <0.001 |
| ≥75 | 0.802 (0.682–0.944) p = 0.008 | 1.011 (0.840–1.216) p = 0.911 | 0.964 (0.802–1.159) p = 0.698 | 0.946 (0.788–1.135) p = 0.549 | 0.917 (0.764–1.100) p = 0.350 |
| Ethnicity/Race | |||||
| Hispanic/Latino | 1.127 (0.929–1.367) p = 0.225 | 1.066 (0.871–1.305) p = 0.537 | 1.061 (0.867–1.298) p = 0.565 | 1.075 (0.879–1.315) p = 0.480 | 1.082 (0.885–1.324) p = 0.441 |
| Non-Hispanic Black | 0.896 (0.733–1.096) p = 0.286 | 0.841 (0.682–1.036) p = 0.104 | 0.847 (0.688–1.044) p = 0.120 | 0.845 (0.686–1.041) p = 0.113 | 0.851 (0.691–1.049) p = 0.130 |
| Non-Hispanic White | * | * | * | * | * |
| Asian | 1.902 (1.456–2.484) p = <0.001 | 1.943 (1.475–2.561) p = <0.001 | 1.910 (1.450–2.516) p = <0.001 | 1.856 (1.410–2.443) p = <0.001 | 1.818 (1.382–2.393) p = <0.001 |
| Other/Unknown | 1.384 (1.119–1.712) p = 0.003 | 1.279 (1.026–1.595) p = 0.029 | 1.280 (1.027–1.595) p = 0.028 | 1.279 (1.026–1.593) p = 0.028 | 1.280 (1.027–1.594) p = 0.028 |
| BMI < 25 (reference) | * | * | |||
| 25 ≤ BMI < 30 | 1.172 (1.022–1.343) p = 0.023 | 1.157 (1.005–1.332) p = 0.043 | |||
| 30 ≤ BMI < 35 | 1.372 (1.178–1.598) p = <0.001 | 1.459 (1.244–1.711) p = <0.001 | |||
| 35 ≤ BMI < 40 | 1.562 (1.293–1.885) p = <0.001 | 1.766 (1.449–2.152) p = <0.001 | |||
| BMI ≥ 30 | 1.378 (1.240–1.531) p = <0.001 | 1.525 (1.363–1.706) p = <0.001 | |||
| BMI ≥ 35 | 1.438 (1.263–1.636) p = <0.001 | 1.639 (1.429–1.880) p = <0.001 | |||
| BMI ≥ 40 | 1.496 (1.253–1.787) p = <0.001 | 2.194 (1.777–2.708) p = <0.001 | 1.742 (1.446–2.099) p = <0.001 | ||
| Hypertension | 0.967 (0.872–1.073) p = 0.531 | 1.002 (0.867–1.157) p = 0.980 | 1.021 (0.884–1.179) p = 0.780 | 1.021 (0.885–1.179) p = 0.773 | 1.031 (0.893–1.190) p = 0.677 |
| Hyperlipidemia | 0.926 (0.818–1.047) p = 0.219 | 0.916 (0.797–1.052) p = 0.215 | 0.912 (0.794–1.048) p = 0.193 | 0.918 (0.799–1.054) p = 0.225 | 0.933 (0.812–1.071) p = 0.324 |
| Diabetes | 0.931 (0.827–1.049) p = 0.242 | 0.976 (0.836–1.139) p = 0.758 | 0.970 (0.832–1.132) p = 0.702 | 0.964 (0.826–1.124) p = 0.640 | 0.960 (0.823–1.120) p = 0.605 |
| Heart failure | 0.802 (0.659–0.976) p = 0.028 | 0.808 (0.647–1.008) p = 0.059 | 0.815 (0.653–1.016) p = 0.069 | 0.806 (0.646–1.006) p = 0.056 | 0.806 (0.647–1.006) p = 0.056 |
| CAD | 0.939 (0.781–1.129) p = 0.503 | 0.979 (0.796–1.204) p = 0.839 | 0.976 (0.794–1.200) p = 0.818 | 0.983 (0.800–1.209) p = 0.874 | 0.978 (0.796–1.202) p = 0.832 |
| PAD | 0.757 (0.525–1.092) p = 0.136 | 0.860 (0.586–1.262) p = 0.439 | 0.851 (0.580–1.247) p = 0.407 | 0.845 (0.576–1.240) p = 0.390 | 0.848 (0.578–1.242) p = 0.397 |
| A fib | 1.271 (1.036–1.560) p = 0.022 | 1.562 (1.246–1.958) p = <0.001 | 1.576 (1.258–1.975) p = <0.001 | 1.584 (1.265–1.985) p = <0.001 | 1.599 (1.276–2.002) p = <0.001 |
| Stroke | 0.804 (0.720–0.897) p = <0.001 | 0.811 (0.724–0.909) p = <0.001 | 0.817 (0.729–0.915) p = <0.001 | 0.817 (0.729–0.915) p = <0.001 | 0.817 (0.729–0.916) p = <0.001 |
| CKD | 0.993 (0.846–1.164) p = 0.926 | 1.098 (0.920–1.309) p = 0.300 | 1.091 (0.915–1.300) p = 0.334 | 1.074 (0.901–1.281) p = 0.424 | 1.072 (0.899–1.278) p = 0.438 |
| COPD | 0.710 (0.428–1.176) p = 0.183 | 0.783 (0.466–1.317) p = 0.357 | 0.764 (0.455–1.284) p = 0.309 | 0.749 (0.446–1.259) p = 0.275 | 0.745 (0.444–1.251) p = 0.266 |
| Asthma | 0.792 (0.661–0.948) p = 0.011 | 0.799 (0.661–0.965) p = 0.020 | 0.822 (0.682–0.992) p = 0.041 | 0.811 (0.672–0.979) p = 0.029 | 0.818 (0.677–0.987) p = 0.036 |
| HIV/AIDS | 1.027 (0.734–1.437) p = 0.876 | 1.082 (0.766–1.527) p = 0.656 | 1.069 (0.758–1.508) p = 0.703 | 1.066 (0.756–1.503) p = 0.714 | 1.039 (0.737–1.464) p = 0.828 |
| Liver cirrhosis | 0.661 (0.410–1.064) p = 0.089 | 0.608 (0.374–0.988) p = 0.045 | 0.605 (0.372–0.982) p = 0.042 | 0.601 (0.370–0.976) p = 0.040 | 0.596 (0.367–0.969) p = 0.037 |
| Variable | Sex | |
|---|---|---|
| Female | Male | |
| n = 3593 (40.67%) | n = 5240 (59.33%) | |
| OR, 95% CI, p-Value | OR, 95% CI, p-Value | |
| Age < 65 | 0.243 (0.199–0.295) p < 0.001 | 0.296 (0.256–0.343) p < 0.001 |
| Age ≥ 65 | 4.121 (3.387–5.014) p < 0.001 | 3.376 (2.919–3.905) p < 0.001 |
| BMI < 25 (reference) | * | * |
| 25 ≤ BMI < 30 | 1.045 (0.837–1.306) p = 0.697 | 1.188 (1.011–1.397) p = 0.036 |
| 30 ≤ BMI < 35 | 1.057 (0.824–1.354) p = 0.664 | 1.188 (1.011–1.397) p < 0.001 |
| 35 ≤ BMI < 40 | 1.731 (1.302–2.301) p < 0.001 | 1.979 (1.522–2.573) p < 0.001 |
| BMI ≥ 40 | 1.954 (1.445–2.643) p < 0.001 | 2.795 (2.098–3.722) p < 0.001 |
| Variable | Age | |
|---|---|---|
| Age < 65 | Age ≥ 65 | |
| n = 4871 (55.15%) | n = 3962 (44.85%) | |
| OR, 95% CI, p-Value | OR, 95% CI, p-Value | |
| Male | 1.818 (1.520–2.175) p < 0.001 | 1.219 (1.062–1.398) p= 0.005 |
| Female | 0.550 (0.460–0.658) p = <0.001 | 0.821 (0.715–0.941) p = 0.005 |
| BMI < 25 (reference) | * | * |
| 25 ≤ BMI < 30 | 1.240 (0.976–1.575) p = 0.078 | 1.144 (0.976–1.341) p = 0.098 |
| 30 ≤ BMI < 35 | 1.670 (1.294–2.154) p < 0.001 | 1.236 (1.014–1.507) p = 0.036 |
| 35 ≤ BMI < 40 | 2.337 (1.750–3.121) p < 0.001 | 1.634 (1.245–2.145) p < 0.001 |
| BMI ≥ 40 | 2.943 (2.188–3.957) p < 0.001 | 1.959 (1.436–2.674) p < 0.001 |
| Variable | Race/Ethnicity | ||||
|---|---|---|---|---|---|
| Non-Hispanic Black | Hispanic/Latino | Non-Hispanic White | Asian | Other/Unknown | |
| n = 2702 (30.59%) | n = 3437 (38.91%) | n = 832 (9.42%) | n = 445 (5.04%) | n = 1417 (16.04%) | |
| OR, 95% CI, p-Value | OR, 95% CI, p-Value | OR, 95% CI, p-Value | OR, 95% CI, p-Value | OR, 95% CI, p-Value | |
| Male | 1.454 (1.196–1.766) p < 0.001 | 1.526 (1.271–1.832) p < 0.001 | 1.099 (0.794–1.522) p = 0.568 | 2.493 (1.522–4.083) p < 0.001 | 1.367 (1.047–1.785) p = 0.022 |
| Female | 0.688 (0.566–0.836) p < 0.001 | 0.655 (0.546–0.787) p = <0.001 | 0.910 (0.657–1.259) p = 0.568 | 0.401 (0.245–0.657) p < 0.001 | 0.732 (0.560–0.955) p = 0.022 |
| Age < 65 | 0.339 (0.275–0.418) p < 0.001 | 0.231 (0.190–0.281) p = <0.001 | 0.233 (0.154–0.352) p < 0.001 | 0.270 (0.163–0.447) p < 0.001 | 0.306 (0.235–0.400) p < 0.001 |
| Age ≥ 65 | 2.950 (2.391–3.640) p < 0.001 | 4.334 (3.563–5.271) p < 0.001 | 4.295 (2.842–6.491) p < 0.001 | 3.701 (2.238–6.119) p < 0.001 | 3.263 (2.499–4.262) p < 0.001 |
| BMI < 25 (reference) | * | * | * | * | * |
| 25 ≤ BMI < 30 | 1.184 (0.927–1.513) p = 0.177 | 1.308 (1.042–1.643) p = 0.021 | 0.875 (0.593–1.290) p = 0.499 | 1.102 (0.652–1.863) p = 0.716 | 1.116 (0.816–1.525) p = 0.492 |
| 30 ≤ BMI < 35 | 1.196 (0.900–1.590) p = 0.218 | 1.623 (1.258–2.093) p < 0.001 | 0.978 (0.609–1.573) p = 0.928 | 1.838 (0.852–3.966) p = 0.121 | 1.377 (0.951–1.994) p = 0.090 |
| 35 ≤ BMI < 40 | 1.765 (1.261–2.469) p < 0.001 | 2.103 (1.522–2.905) p < 0.001 | 1.835 (0.975–3.453) p = 0.060 | 1.349 (0.398–4.567) p = 0.631 | 2.047 (1.297–3.231) p = 0.002 |
| BMI ≥ 40 | 2.068 (1.463–2.923) p < 0.001 | 2.622 (1.815–3.789) p < 0.001 | 2.474 (1.295–4.726) p = 0.006 | 9.535 (2.113–43.033) p = 0.003 | 2.470 (1.519–4.018) p < 0.001 |
| Variable | Quartile | |||
|---|---|---|---|---|
| First Quartile (3/3–29/3/2020) | Second Quartile (29/3–8/4/2020) | Third Quartile (8/4–23/4/2020) | Last Quartile (23/4–31/10/2020) | |
| n = 2209 (25.01%) | n = 2208 (25.00%) | n = 2208 (25.00%) | n = 2208 (25.00%) | |
| OR, 95% CI, p-Value | OR, 95% CI, p-Value | OR, 95% CI, p-Value | OR, 95% CI, p-Value | |
| Male | 1.688 (1.361–2.094) p < 0.001 | 1.287 (1.056–1.568) p = 0.012 | 1.388 (1.131–1.703) p = 0.002 | 1.010 (0.741–1.375) p = 0.951 |
| Female | 0.592 (0.478–0.735) p < 0.001 | 0.777 (0.638–0.947) p = 0.012 | 0.720 (0.587–0.884) p = 0.002 | 0.990 (0.727–1.349) p = 0.951 |
| Age < 65 | 0.268 (0.215–0.335) p < 0.001 | 0.321 (0.261–0.394) p < 0.001 | 0.278 (0.222–0.348) p < 0.001 | 0.237 (0.165–0.339) p < 0.001 |
| Age ≥ 65 | 3.728 (2.987–4.654) p < 0.001 | 3.116 (2.536–3.830) p < 0.001 | 3.603 (2.878–4.510) p < 0.001 | 4.228 (2.953–6.053) p < 0.001 |
| BMI < 25 (reference) | * | * | * | * |
| 25 ≤ BMI < 30 | 1.178 (0.900–1.542) p = 0.234 | 1.031 (0.813–1.307) p = 0.800 | 1.113 (0.873–1.421) p = 0.387 | 0.869 (0.594–1.270) p = 0.468 |
| 30 ≤ BMI < 35 | 1.443 (1.071–1.946) p = 0.016 | 1.115 (0.839–1.481) p = 0.455 | 1.339 (1.001–1.791) p = 0.049 | 1.024 (0.659–1.591) p = 0.916 |
| 35 ≤ BMI < 40 | 2.102 (1.443–3.061) p < 0.001 | 1.460 (1.045–2.039) p = 0.027 | 1.536 (1.049–2.249) p = 0.027 | 1.594 (0.920–2.762) p = 0.096 |
| BMI ≥ 40 | 3.148 (2.160–4.588) p < 0.001 | 1.941 (1.319–2.855) p < 0.001 | 1.598 (1.068–2.392) p = 0.023 | 1.339 (0.683–2.628) p = 0.396 |
| Variable | No. | Univariate Analysis | Multivariate Analysis | ||
|---|---|---|---|---|---|
| Model A | Model B | Model C | |||
| n = 5068 | n = 2461 | n = 665 | |||
| OR, 95% CI, p-Value | OR, 95% CI, p-Value | OR, 95% CI, p-Value | OR, 95% CI, p-Value | ||
| Male sex | 1.192 (1.081–1.315) p < 0.001 | 1.320 (1.142–1.526) p < 0.001 | 1.178 (0.952–1.457) p = 0.132 | 1.085 (0.739–1.595) p = 0.677 | |
| Age (All) | 1.045 (1.042–1.048) p < 0.001 | ||||
| <50 (reference) | 1.067 (1.046–1.088) p < 0.001 | * | * | * | |
| 50–64 | 1.043 (1.020–1.067) p < 0.001 | 1.973 (1.589–2.450) p < 0.001 | 2.132 (1.552–2.929) p < 0.001 | 2.743 (1.615–4.658) p < 0.001 | |
| 65–74 | 1.066 (1.029–1.104) p < 0.001 | 3.146 (2.514–3.937) p < 0.001 | 3.571 (2.567–4.970) p < 0.001 | 3.635 (2.051–6.443) p < 0.001 | |
| ≥75 | 1.034 (1.019–1.049) p < 0.001 | 5.204 (4.119–6.575) p < 0.001 | 5.616 (3.970–7.943) p < 0.001 | 6.109 (3.288–11.349) p < 0.001 | |
| BMI < 25 (reference) | 0.944 (0.850–1.049) p = 0.287 | * | * | * | |
| 25 ≤ BMI < 30 | 0.947 (0.856–1.049) p = 0.297 | 1.386 (1.162–1.653) p < 0.001 | 1.261 (0.972–1.636) p = 0.081 | 1.343 (0.823–2.193) p = 0.238 | |
| 30 ≤ BMI < 35 | 0.927 (0.822–1.047) p = 0.223 | 1.583 (1.290–1.943) p < 0.001 | 1.606 (1.190–2.167) p = 0.002 | 2.382 (1.383–4.104) p = 0.002 | |
| 35 ≤ BMI < 40 | 1.163 (0.992–1.363) p = 0.063 | 2.010 (1.567–2.578) p < 0.001 | 2.098 (1.473–2.990) p < 0.001 | 3.651 (1.928–6.913) p < 0.001 | |
| BMI ≥ 40 | 1.346 (1.136–1.594) p < 0.001 | 3.055 (2.335–3.996) p < 0.001 | 2.754 (1.893–4.008) p < 0.001 | 3.280 (1.722–6.248) p < 0.001 | |
| WBC—103/μL | n = 8795 | 1.045 (1.036–1.055) p < 0.001 | 0.848 (0.677–1.061) p = 0.149 | 0.786 (0.578–1.069) p = 0.125 | 0.853 (0.521–1.396) p = 0.0.527 |
| Neutrophils—103/μL | n = 8795 | 1.074 (1.063–1.086) p < 0.001 | 1.234 (0.977–1.558) p = 0.077 | 1.321 (0.959–1.819) p = 0.088 | 1.206 (0.724–2.008) p = 0.472 |
| Monocytes—103/μL | n = 8795 | 0.748 (0.650–0.861) p < 0.001 | 0.695 (0.498–0.970) p = 0.032 | 0.852 (0.544–1.335) p = 0.486 | 0.918 (0.413–2.041) p = 0.834 |
| Lymphocytes—103/μL | n = 8795 | 0.990 (0.967–1.014) p = 0.419 | 1.208 (0.962–1.516) p = 0.104 | 1.311 (0.958–1.793) p = 0.090 | 1.202 (0.727–1.986) p = 0.474 |
| LDH per 100 U/L | n = 6476 | 1.003 (1.002–1.003) p < 0.001 | 1.209 (1.178–1.241) p < 0.001 | 1.191 (1.148–1.236) p < 0.001 | 1.189 (1.108–1.276) p < 0.001 |
| Ferritin per 200 ng/mL | n = 6285 | 1.000 (1.000–1.000) p < 0.001 | 1.009 (1.002–1.017) p = 0.009 | 1.012 (1.002–1.021) p = 0.015 | 1.037 (1.014–1.062) p = 0.002 |
| Albumin—g/dL | n = 8357 | 0.408 (0.373–0.445) p < 0.001 | 0.591 (0.518–0.673) p < 0.001 | 0.530 (0.438–0.641) p < 0.001 | 0.696 (0.492–0.984) p = 0.040 |
| D-dimer per 200 mg/mL | n = 6471 | 1.008 (1.007–1.009) p < 0.001 | 1.003 (1.002–1.004) p < 0.001 | 1.003 (1.001–1.005) p = 0.004 | 1.002 (0.999–1.006) p = 0.194 |
| CRP per 20 mg/dL | n = 3114 | 1.063 (1.046–1.080) p < 0.001 | 1.034 (1.013–1.055) p = 0.002 | 1.018 (0.978–1.060) p = 0.385 | |
| IL-6 per 20 pg/mL | n = 2237 | 1.020 (1.015–1.025) p < 0.001 | 1.011 (1.003–1.019) p = 0.007 | ||
| N/R | n = 8795 | 1.051 (1.044–1.058) p < 0.001 | * | * | * |
| L/CRP | n = 3109 | 0.639 (0.532–0.783) p < 0.001 | * | * | * |
Publisher’s Note: MDPI stays neutral with regard to jurisdictional claims in published maps and institutional affiliations. |
© 2022 by the authors. Licensee MDPI, Basel, Switzerland. This article is an open access article distributed under the terms and conditions of the Creative Commons Attribution (CC BY) license (https://creativecommons.org/licenses/by/4.0/).
Share and Cite
Palaiodimos, L.; Ali, R.; Teo, H.O.; Parthasarathy, S.; Karamanis, D.; Chamorro-Pareja, N.; Kokkinidis, D.G.; Kaur, S.; Kladas, M.; Sperling, J.; et al. Obesity, Inflammation, and Mortality in COVID-19: An Observational Study from the Public Health Care System of New York City. J. Clin. Med. 2022, 11, 622. https://doi.org/10.3390/jcm11030622
Palaiodimos L, Ali R, Teo HO, Parthasarathy S, Karamanis D, Chamorro-Pareja N, Kokkinidis DG, Kaur S, Kladas M, Sperling J, et al. Obesity, Inflammation, and Mortality in COVID-19: An Observational Study from the Public Health Care System of New York City. Journal of Clinical Medicine. 2022; 11(3):622. https://doi.org/10.3390/jcm11030622
Chicago/Turabian StylePalaiodimos, Leonidas, Ryad Ali, Hugo O. Teo, Sahana Parthasarathy, Dimitrios Karamanis, Natalia Chamorro-Pareja, Damianos G. Kokkinidis, Sharanjit Kaur, Michail Kladas, Jeremy Sperling, and et al. 2022. "Obesity, Inflammation, and Mortality in COVID-19: An Observational Study from the Public Health Care System of New York City" Journal of Clinical Medicine 11, no. 3: 622. https://doi.org/10.3390/jcm11030622
APA StylePalaiodimos, L., Ali, R., Teo, H. O., Parthasarathy, S., Karamanis, D., Chamorro-Pareja, N., Kokkinidis, D. G., Kaur, S., Kladas, M., Sperling, J., Chang, M., Hupart, K., Cha-Fong, C., Srinivasan, S., Kishore, P., Davis, N., & Faillace, R. T. (2022). Obesity, Inflammation, and Mortality in COVID-19: An Observational Study from the Public Health Care System of New York City. Journal of Clinical Medicine, 11(3), 622. https://doi.org/10.3390/jcm11030622