
Reduced Vessel Density in the Mid-Periphery and Peripapillary Area of the Superficial Capillary Plexus in Non-Proliferative Diabetic Retinopathy


Abstract
:1. Introduction
2. Materials and Methods
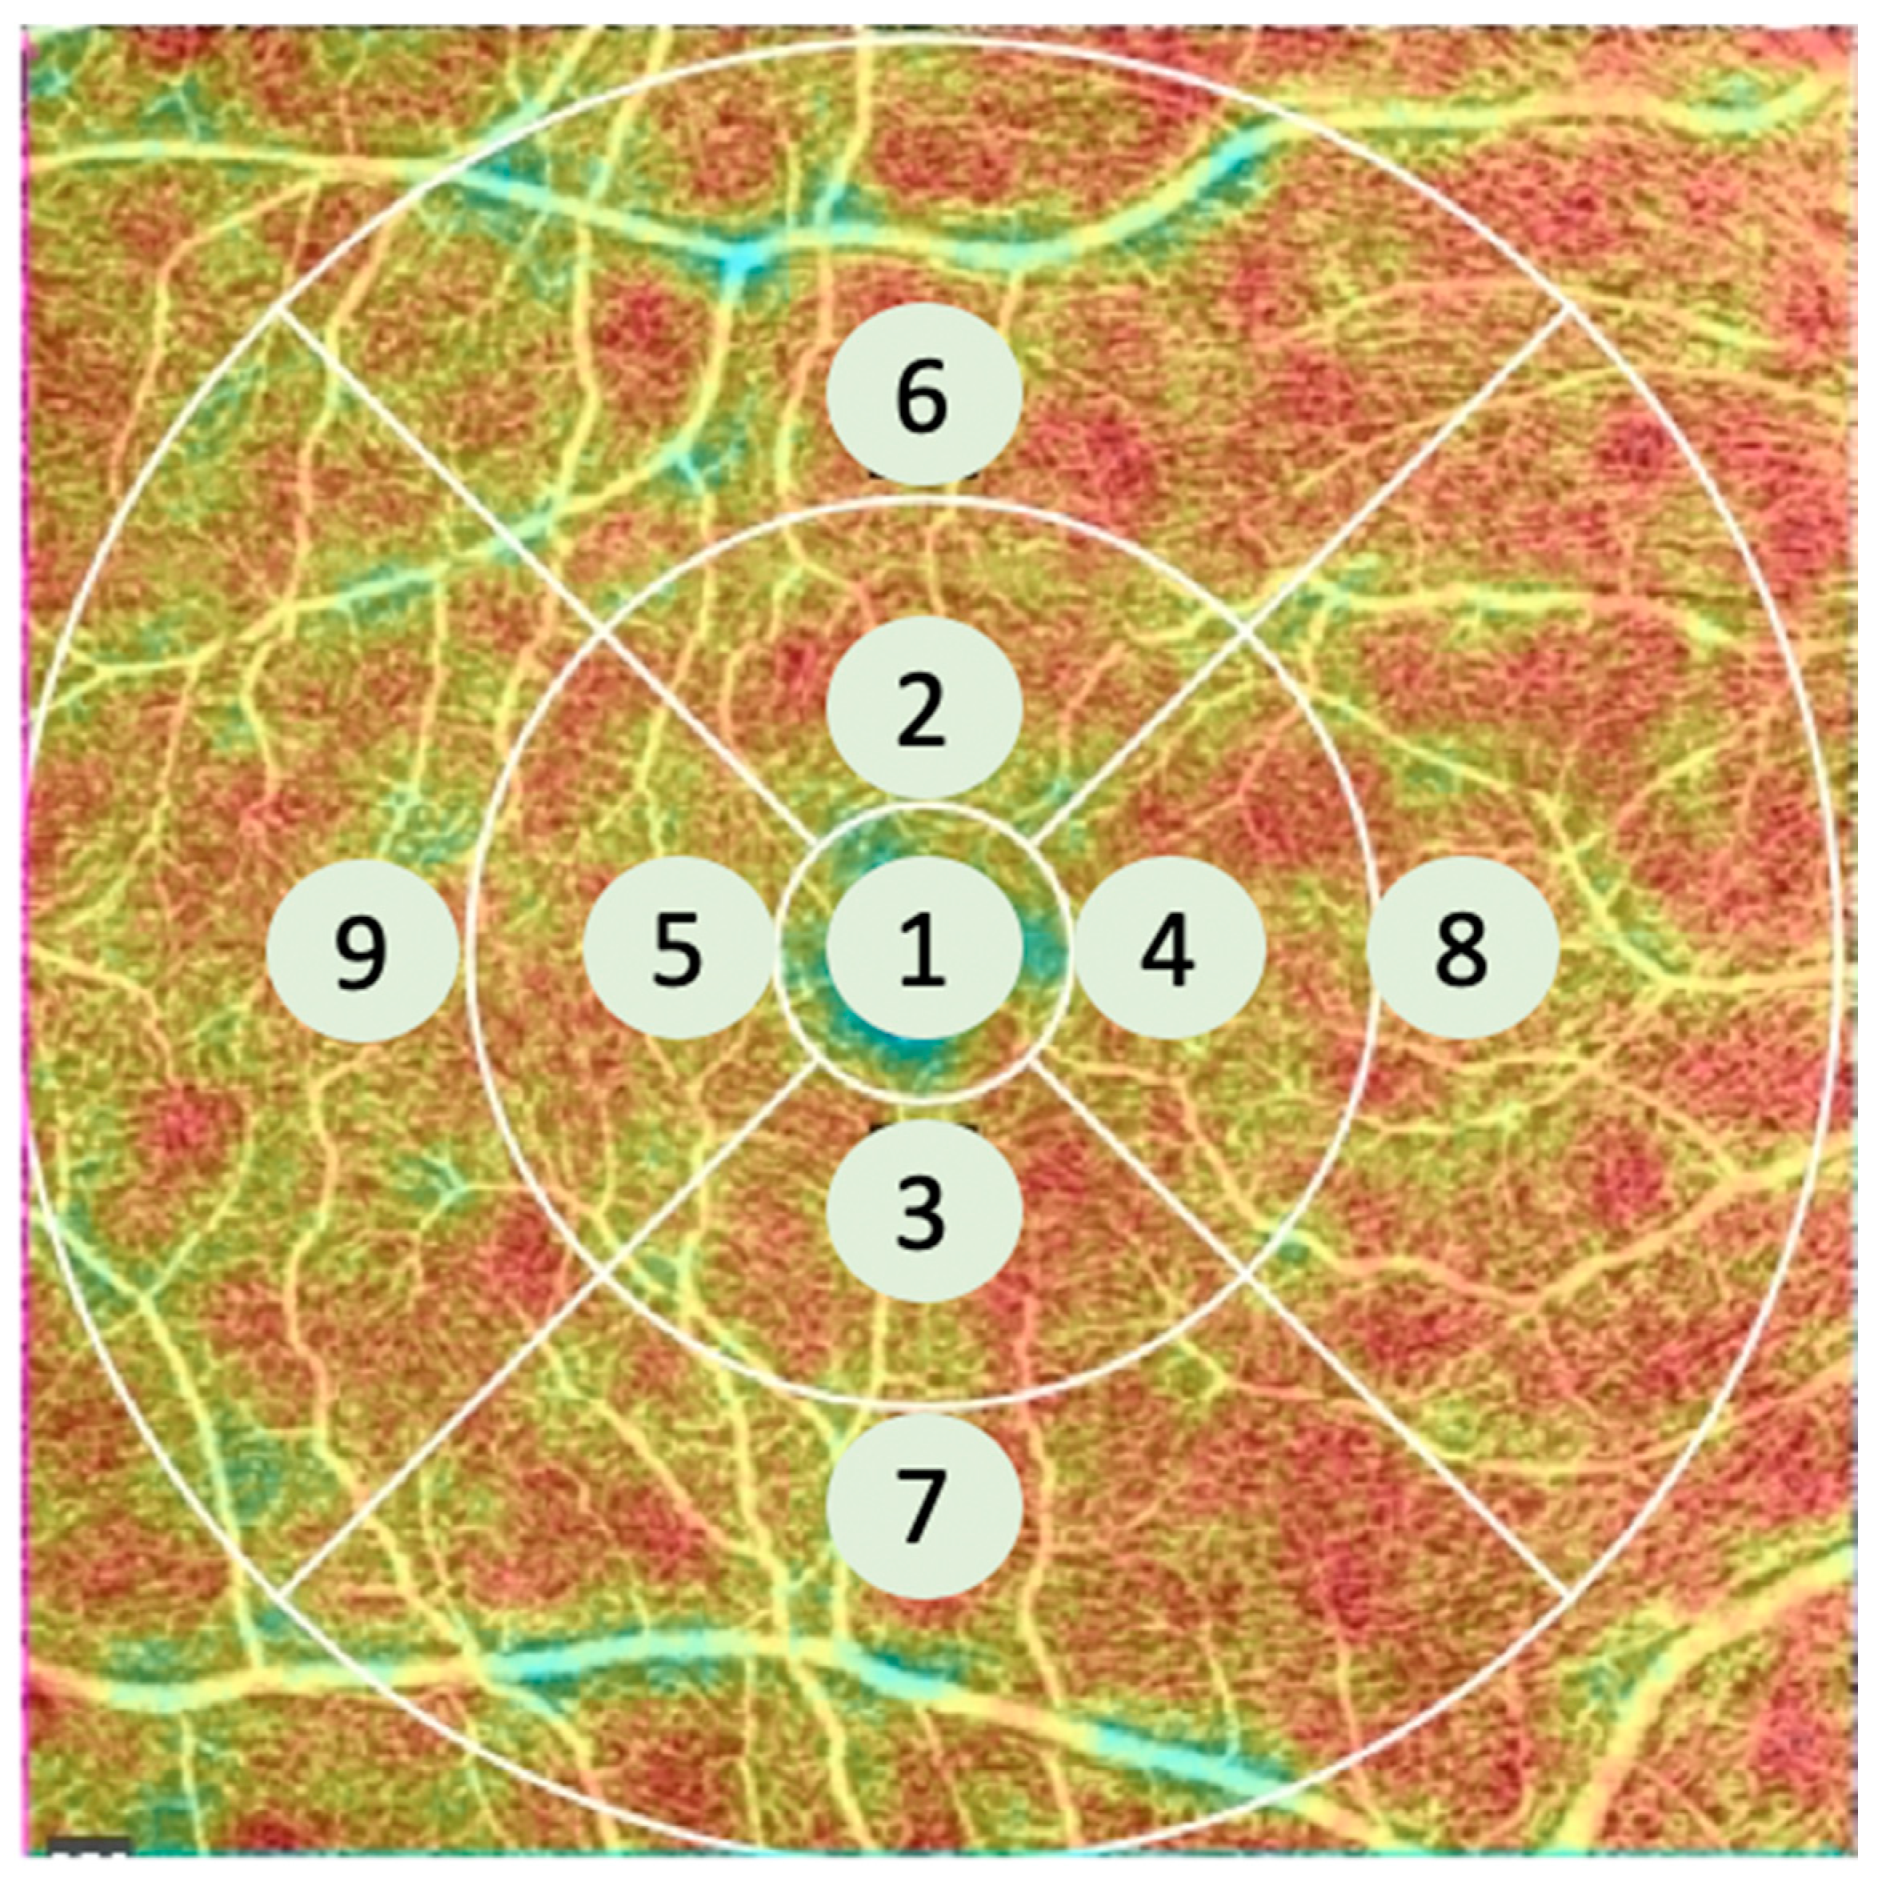
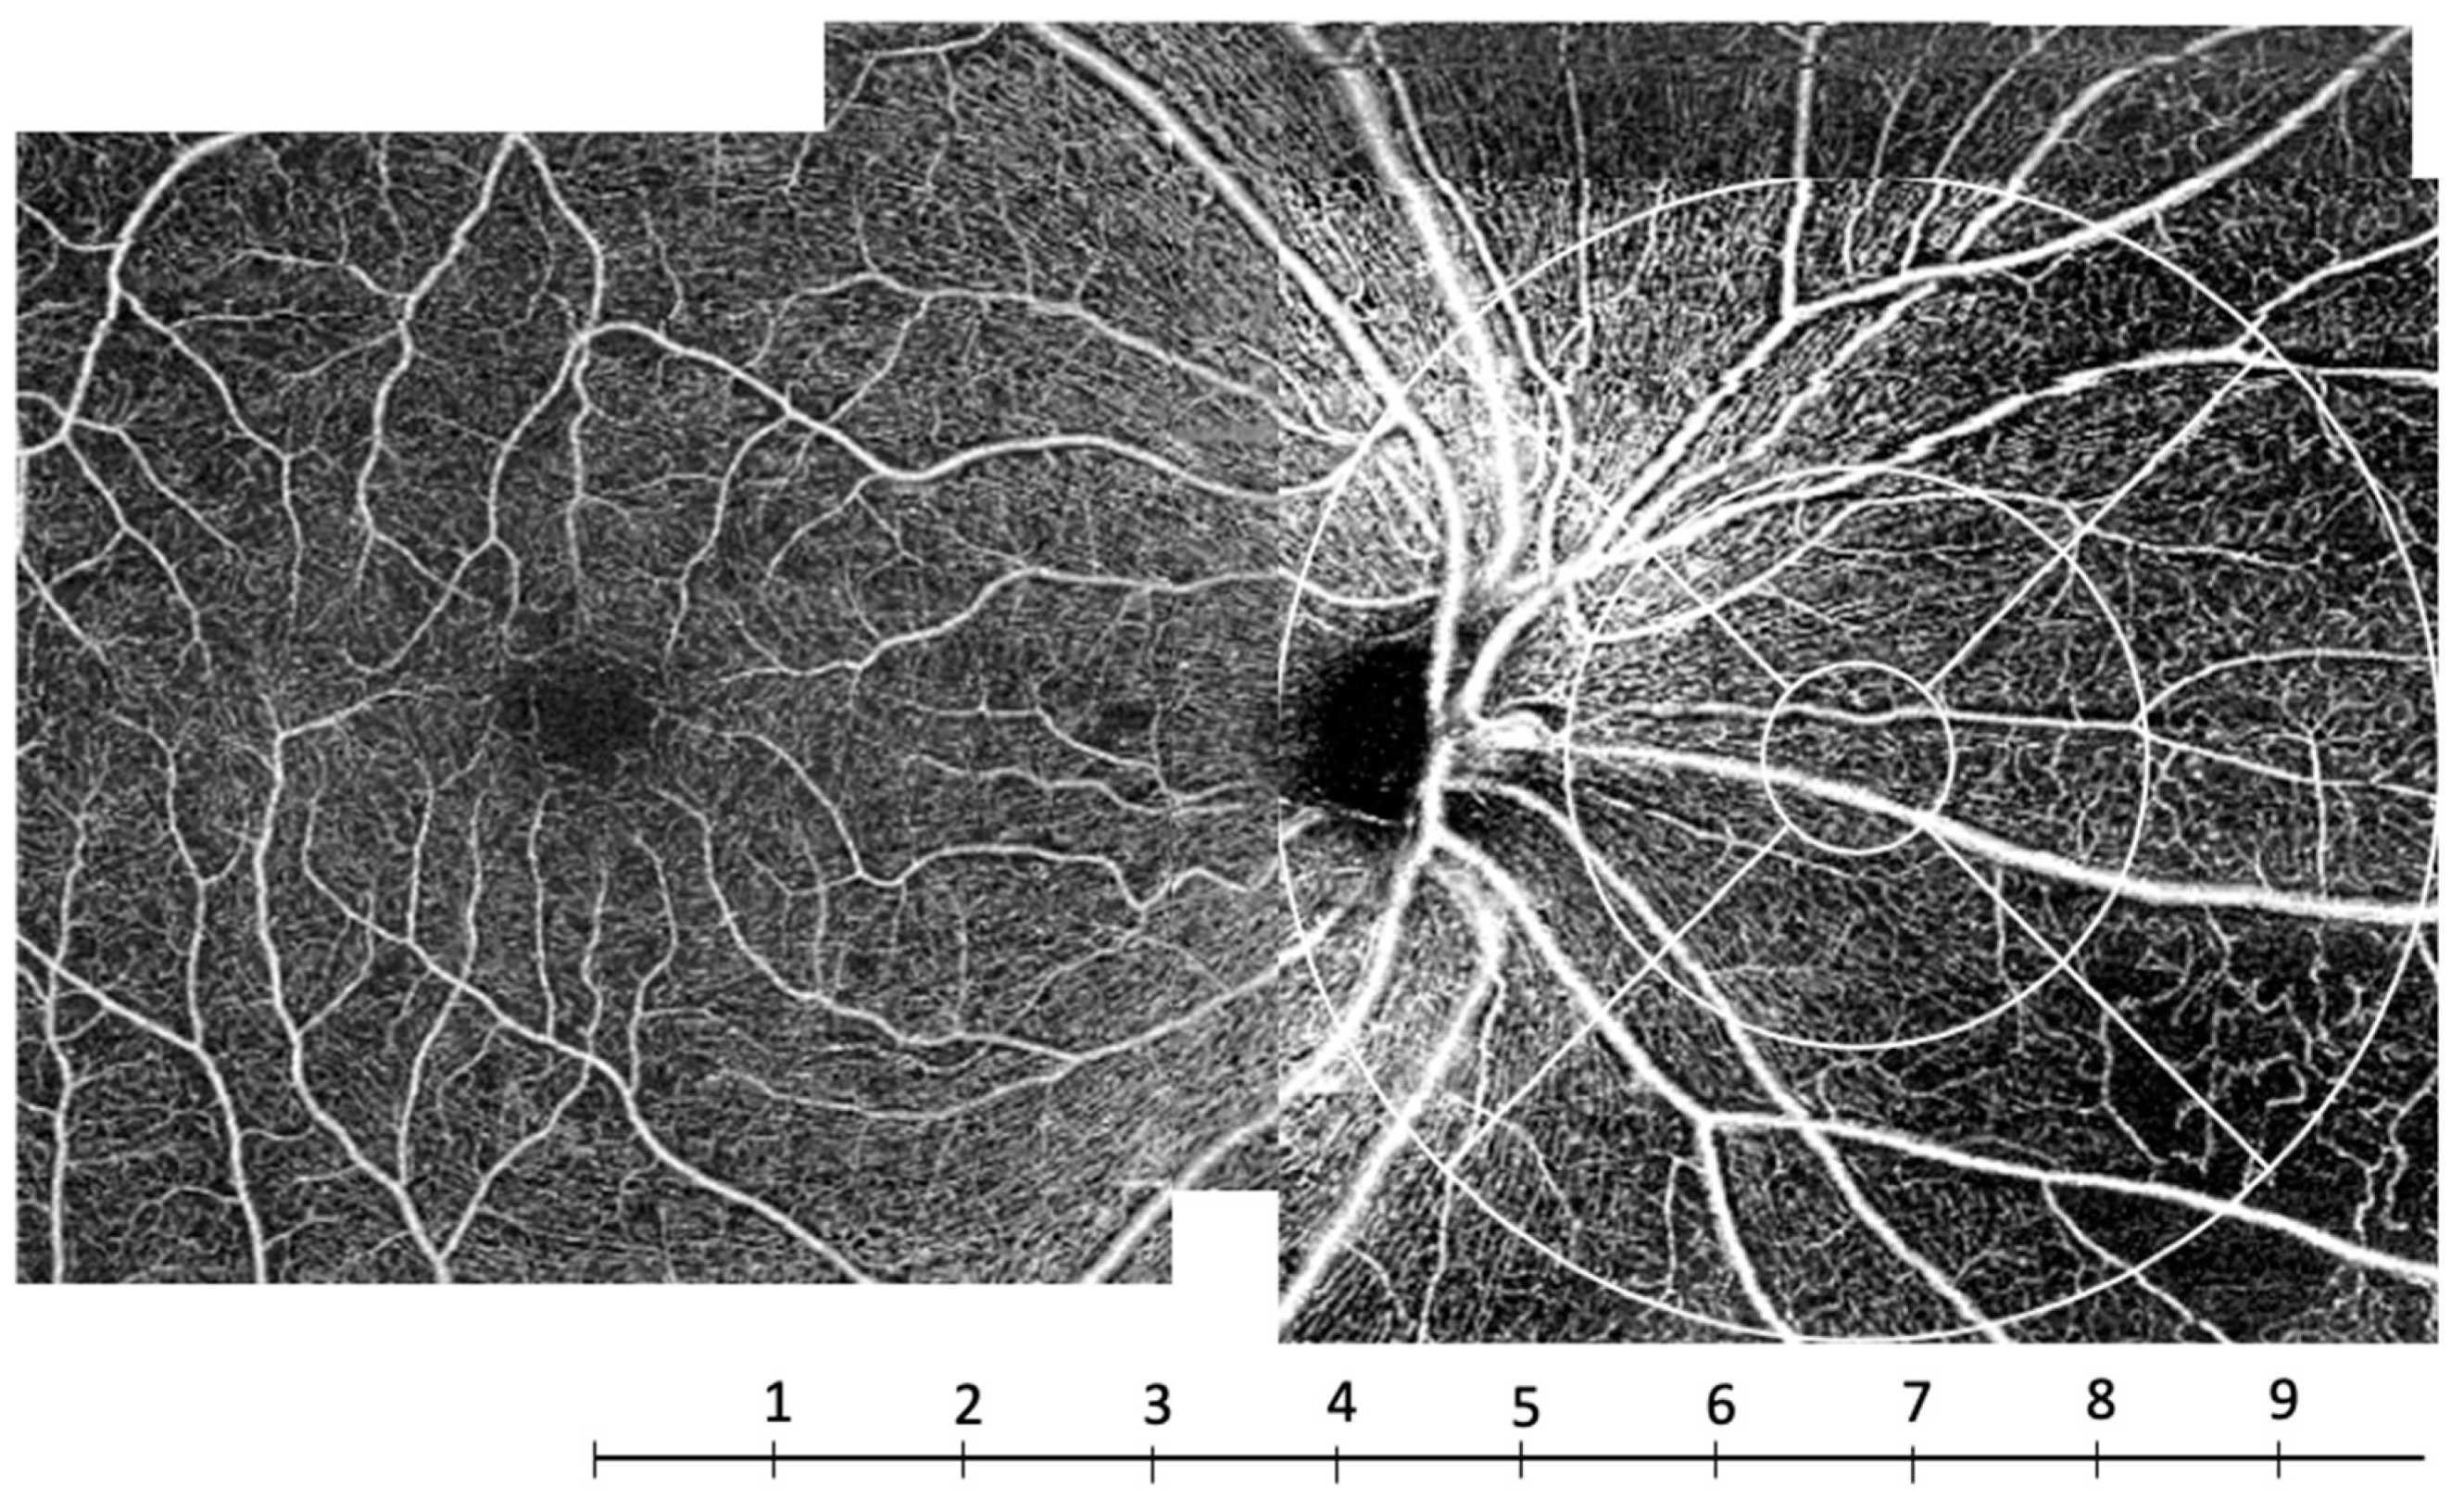
2.1. OCT Angiography (OCT-A) System Setup and Analysis
2.2. Statistical Analysis
3. Results
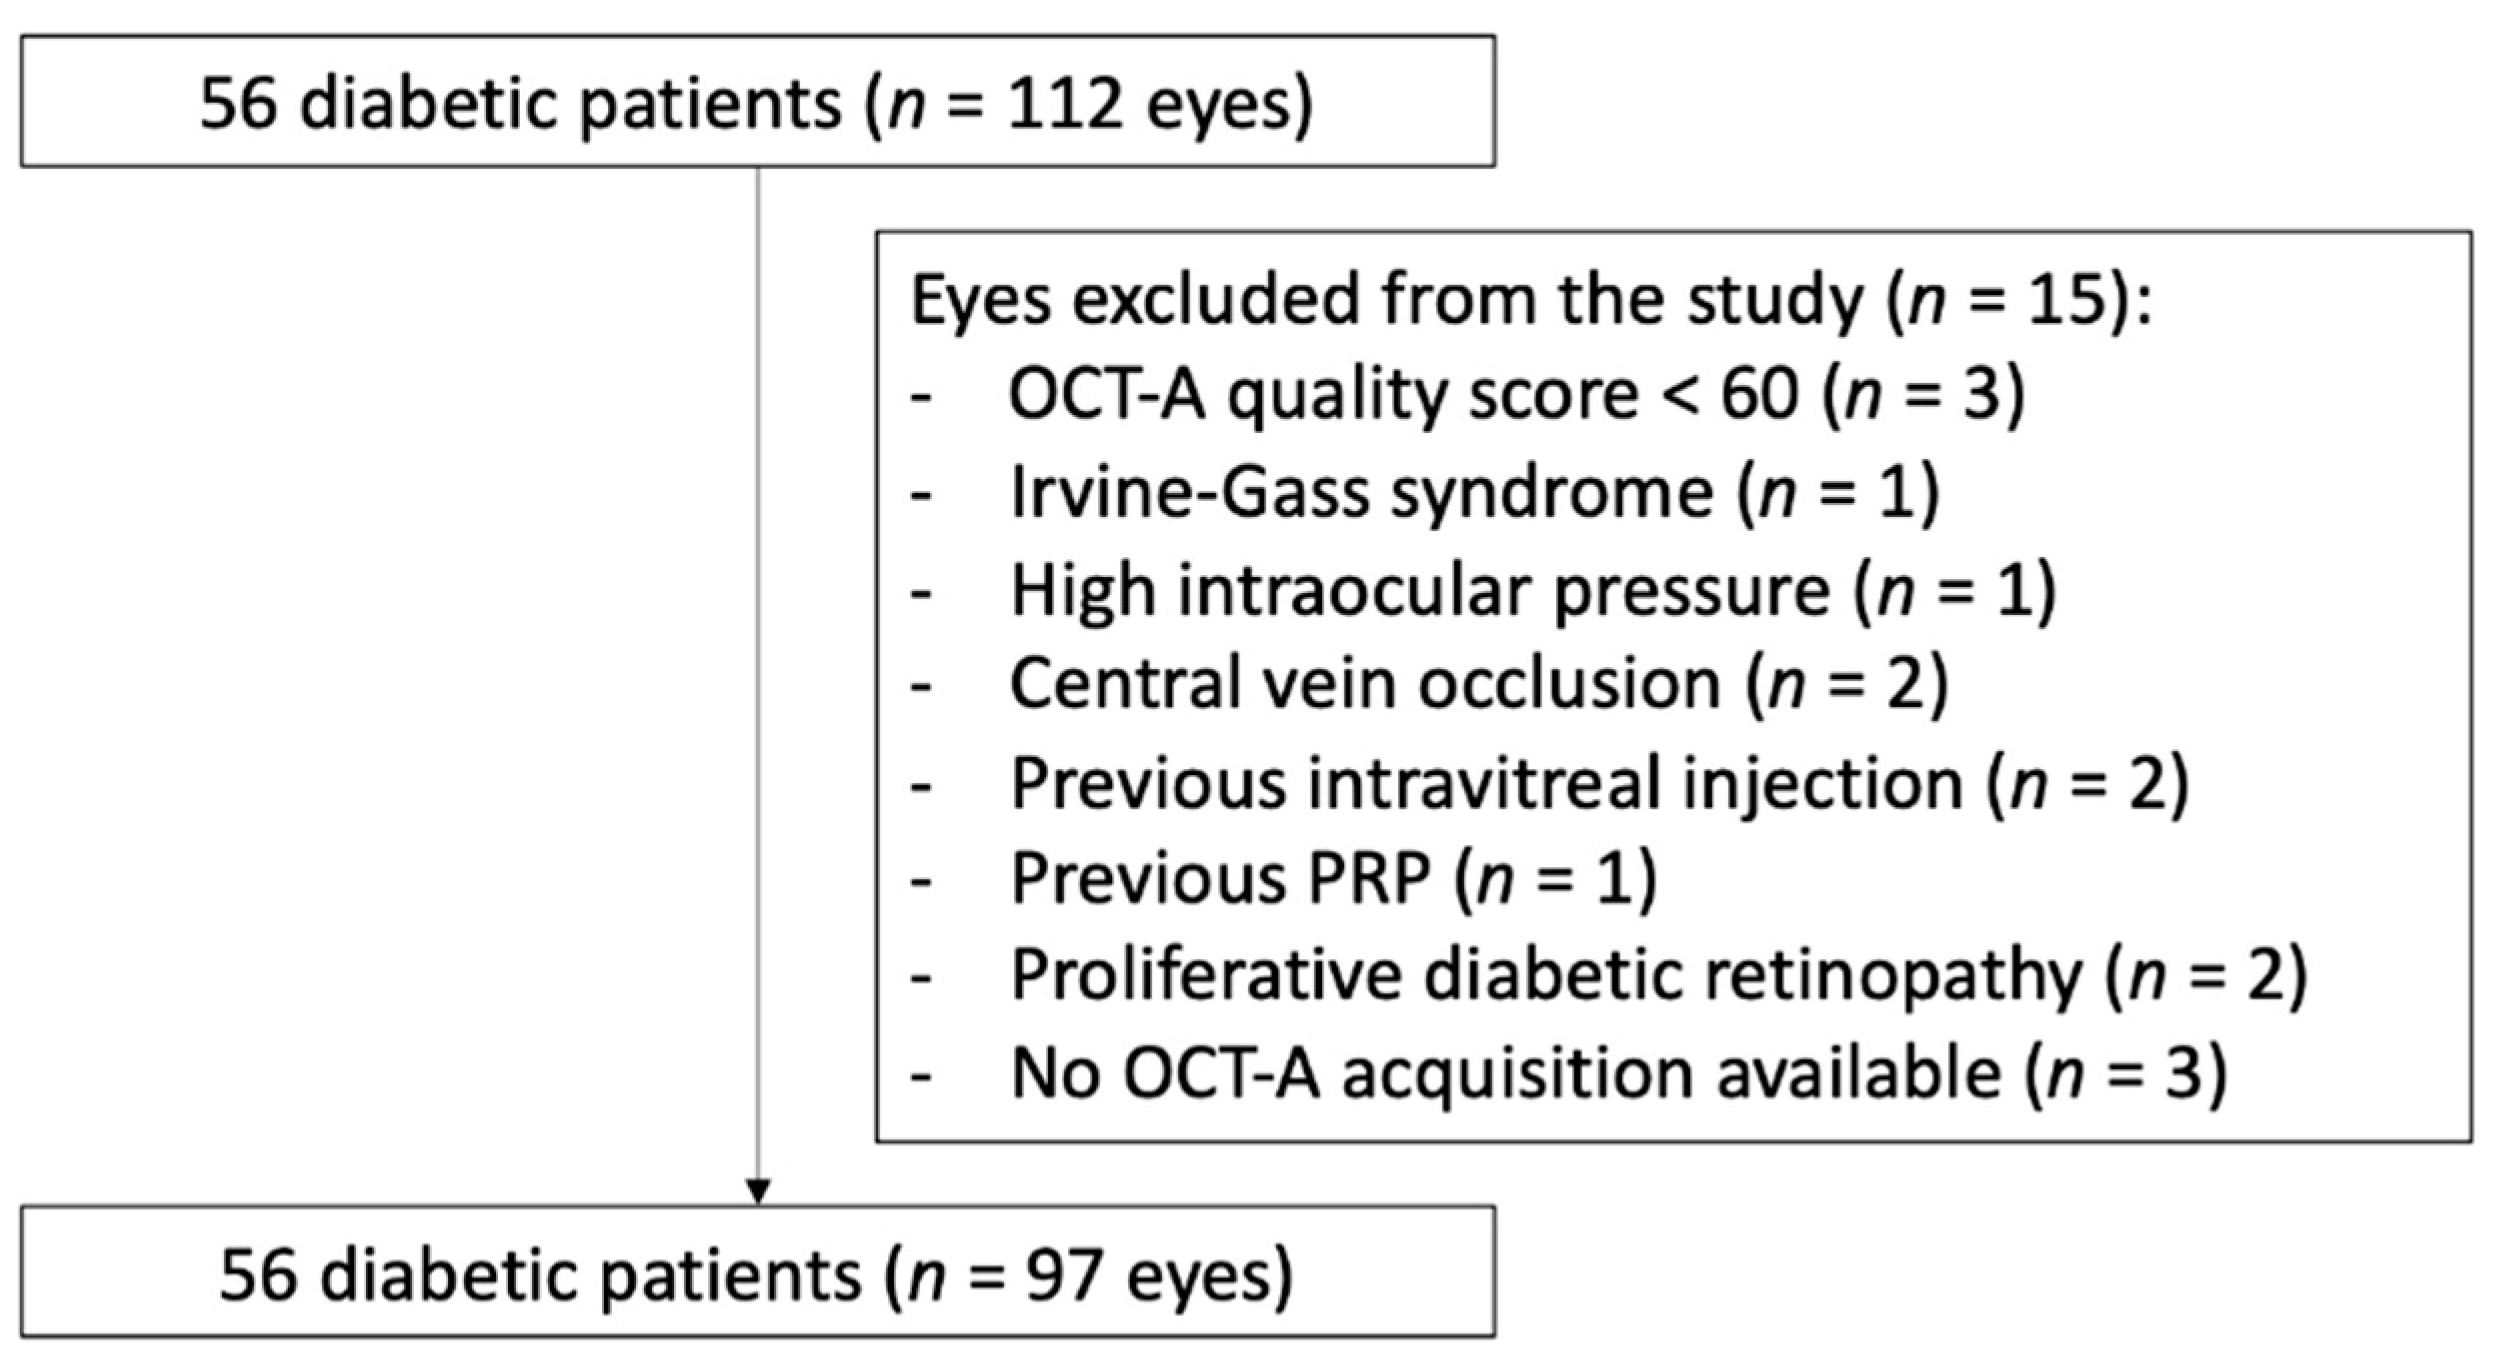
3.1. Study Population
3.2. Quantitative Analysis
3.2.1. Nasal Area
3.2.2. Macular Area
4. Discussion
5. Conclusions
Supplementary Materials
Author Contributions
Funding
Institutional Review Board Statement
Informed Consent Statement
Data Availability Statement
Acknowledgments
Conflicts of Interest
References
- Kim, A.Y.; Chu, Z.; Shahidzadeh, A.; Wang, R.K.; Puliafito, C.A.; Kashani, A.H. Quantifying Microvascular Density and Morphology in Diabetic Retinopathy Using Spectral-Domain Optical Coherence Tomography Angiography. Investig. Opthalmol. Vis. Sci. 2016, 57, 362–370. [Google Scholar] [CrossRef] [PubMed]
- Nesper, P.L.; Roberts, P.K.; Onishi, A.C.; Chai, H.; Liu, L.; Jampol, L.M.; Fawzi, A.A. Quantifying Microvascular Abnormalities With Increasing Severity of Diabetic Retinopathy Using Optical Coherence Tomography Angiography. Investig. Ophthalmol. Vis. Sci. 2017, 58, 307–315. [Google Scholar] [CrossRef]
- Onishi, A.C.; Nesper, P.L.; Roberts, P.K.; Moharram, G.A.; Chai, H.; Liu, L.; Jampol, L.M.; Fawzi, A.A. Importance of Considering the Middle Capillary Plexus on OCT Angiography in Diabetic Retinopathy. Investig. Opthalmol. Vis. Sci. 2018, 59, 2167–2176. [Google Scholar] [CrossRef] [Green Version]
- Hirano, T.; Kitahara, J.; Toriyama, Y.; Kasamatsu, H.; Murata, T.; Sadda, S. Quantifying vascular density and morphology using different swept-source optical coherence tomography angiographic scan patterns in diabetic retinopathy. Br. J. Ophthalmol. 2018, 130, 216–221. [Google Scholar] [CrossRef]
- Lei, J.; Yi, E.; Suo, Y.; Chen, C.; Xu, X.; Ding, W.; Abdelfattah, N.S.; Fan, X.; Lu, H. Distinctive Analysis of Macular Superficial Capillaries and Large Vessels Using Optical Coherence Tomographic Angiography in Healthy and Diabetic Eyes. Investig. Opthalmol. Vis. Sci. 2018, 59, 1937–1943. [Google Scholar] [CrossRef] [Green Version]
- Talisa, E.; Chin, A.T.; Bonini Filho, M.A.; Adhi, M.; Branchini, L.; Salz, D.A.; Baumal, C.R.; Crawford, C.; Reichel, E.; Witkin, A.J.; et al. Detection of microvascular changes in eyes of patients with diabetes but not clinical diabetic retinopathy using optical coherence tomography angiography. Retina 2015, 35, 2364–2370. [Google Scholar]
- Takase, N.; Nozaki, M.; Kato, A.; Ozeki, H.; Yoshida, M.; Ogura, Y. Enlargement of foveal avascular zone in diabetic eyes evaluated by en face optical coherence tomography angiography. Retina 2015, 35, 2377–2383. [Google Scholar] [CrossRef]
- Dimitrova, G.; Chihara, E.; Takahashi, H.; Amano, H.; Okazaki, K. Quantitative Retinal Optical Coherence Tomography Angiography in Patients With Diabetes Without Diabetic Retinopathy. Investig. Opthalmol. Vis. Sci. 2017, 58, 190–196. [Google Scholar] [CrossRef] [PubMed]
- Conti, F.F.; Qin, V.L.; Rodrigues, E.B.; Sharma, S.; Rachitskaya, A.V.; Ehlers, J.P.; Singh, R.P. Choriocapillaris and retinal vascular plexus density of diabetic eyes using split-spectrum amplitude decorrelation spectral-domain optical coherence tomography angiography. Br. J. Ophthalmol. 2019, 103, 452–456. [Google Scholar] [CrossRef] [PubMed]
- Wilkinson, C.; Ferris, F.; Klein, R.; Lee, P.; Agardh, C.D.; Davis, M.; Dills, D.; Kampik, A.; Pararajasegaram, R.; Verdaguer, J.T. Proposed international clinical diabetic retinopathy and diabetic macular edema disease severity scales. Ophthalmology 2003, 110, 1677–1682. [Google Scholar] [CrossRef]
- Liu, D.W.; Haq, Z.; Yang, D.; Stewart, J.M. Association between smoking history and optical coherence tomography angiography findings in diabetic patients without diabetic retinopathy. PLoS ONE 2021, 16, e0253928. [Google Scholar] [CrossRef]
- Early Treatment Diabetic Retinopathy Study Research Group. Classification of diabetic retinopathy from fluorescein angiograms. ETDRS report number 11. Early Treatment Diabetic Retinopathy Study Research Group. Ophthalmology 1991, 98, 807–822. [Google Scholar] [CrossRef]
- Early Treatment Diabetic Retinopathy Study Research Group. Fluorescein angiographic risk factors for progression of diabetic retinopathy. ETDRS report number 13. Early Treatment Diabetic Retinopathy Study Research Group. Ophthalmology 1991, 98, 834–840. [Google Scholar] [CrossRef]
- Zhang, Q.; Huang, Y.; Zhang, T.; Kubach, S.; An, L.; Laron, M.; Sharma, U.; Wang, R. Wide-field imaging of retinal vasculature using optical coherence tomography-based microangiography provided by motion tracking. J. Biomed. Opt. 2015, 20, 066008. [Google Scholar] [CrossRef] [PubMed]
- Shimizu, K.; Kobayashi, Y.; Muraoka, K. Midperipheral fundus involvement in diabetic retinopathy. Ophthalmology 1981, 88, 601–612. [Google Scholar] [CrossRef]
- Alibhai, A.Y.; De Pretto, L.R.; Moult, E.M.; Or, C.; Arya, M.; McGowan, M.; Carrasco-Zevallos, O.; Lee, B.; Chen, S.; Baumal, C.R.; et al. Quantification of retinal capillary nonperfusion in diabetics using wide-field optical coherence tomography angiography. Retina 2020, 40, 412–420. [Google Scholar] [CrossRef]
- Zhang, Q.; Rezaei, K.A.; Saraf, S.S.; Chu, Z.; Wang, F.; Wang, R.K. Ultra-wide optical coherence tomography angiography in diabetic retinopathy. Quant. Imaging Med. Surg. 2018, 8, 743–753. [Google Scholar] [CrossRef] [PubMed]
- Or, C.; Das, R.; Despotovic, I.; Alibhai, A.Y.; Moult, E.; Waheed, N.K.; Chakravarthy, U. Combined Multimodal Analysis of Peripheral Retinal and Macular Circulation in Diabetic Retinopathy (COPRA Study). Ophthalmol. Retin. 2019, 3, 580–588. [Google Scholar] [CrossRef]
- Sim, D.A.; Keane, P.A.; Rajendram, R.; Karampelas, M.; Selvam, S.; Powner, M.B.; Fruttiger, M.; Tufail, A.; Egan, C. Patterns of peripheral retinal and central macula ischemia in diabetic retinopathy as evaluated by ultra-widefield fluorescein angiography. Am. J. Ophthalmol. 2014, 158, 144–153. [Google Scholar] [CrossRef] [PubMed]
- Yasukura, S.; Murakami, T.; Suzuma, K.; Yoshitake, T.; Nakanishi, H.; Fujimoto, M.; Oishi, M.; Tsujikawa, A. Diabetic Nonperfused Areas in Macular and Extramacular Regions on Wide-Field Optical Coherence Tomography Angiography. Investig. Opthalmol. Vis. Sci. 2018, 59, 5893–5903. [Google Scholar] [CrossRef] [Green Version]
- Lavia, C.; Mecê, P.; Nassisi, M.; Bonnin, S.; Marie-Louise, J.; Couturier, A.; Erginay, A.; Tadayoni, R.; Gaudric, A. Retinal Capillary Plexus Pattern and Density from Fovea to Periphery Measured in Healthy Eyes with Swept-Source Optical Coherence Tomography Angiography. Sci. Rep. 2020, 10, 1474. [Google Scholar] [CrossRef] [Green Version]
- Quinn, N.; Csincsik, L.; Flynn, E.; Curcio, C.A.; Kiss, S.; Sadda, S.R.; Hogg, R.; Peto, T.; Lengyel, I. The clinical relevance of visualising the peripheral retina. Prog. Retin. Eye Res. 2019, 68, 83–109. [Google Scholar] [CrossRef] [PubMed]
- Liu, L.; Wang, Y.; Liu, H.X.; Gao, J. Peripapillary Region Perfusion and Retinal Nerve Fiber Layer Thickness Abnormalities in Diabetic Retinopathy Assessed by OCT Angiography. Transl. Vis. Sci. Technol. 2019, 8, 14. [Google Scholar] [CrossRef] [PubMed] [Green Version]
- Vujosevic, S.; Muraca, A.; Gatti, V.; Masoero, L.; Brambilla, M.; Cannillo, B.; Villani, E.; Nucci, P.; De Cillà, S. Peripapillary Microvascular and Neural Changes in Diabetes Mellitus: An OCT-Angiography Study. Investig. Opthalmol. Vis. Sci. 2018, 59, 5074–5081. [Google Scholar] [CrossRef] [PubMed] [Green Version]
- Henkind, P. Symposium on glaucoma: Joint meeting with the National Society for the Prevention of Blindness. New observations on the radial peripapillary capillaries. Investig. Ophthalmol. 1967, 6, 103–108. [Google Scholar]
- Agemy, S.A.; Scripsema, N.K.; Shah, C.M.; Chui, T.; Garcia, P.M.; Lee, J.G.; Gentile, R.C.; Hsiao, Y.S.; Zhou, Q.; Ko, T.; et al. Retinal vascular perfusion density mapping using optical coherence tomography angiography in normals and diabetic retinopathy patients. Retina 2015, 35, 2353–2363. [Google Scholar] [CrossRef]
- Durbin, M.K.; An, L.; Shemonski, N.D.; Soares, M.; Santos, T.; Lopes, M.; Neves, C.; Cunha-Vaz, J. Quantification of Retinal Microvascular Density in Optical Coherence Tomographic Angiography Images in Diabetic Retinopathy. JAMA Ophthalmol. 2017, 135, 370–376. [Google Scholar] [CrossRef]


| No DR | Mild NPDR | Moderate NPDR | Severe NPDR | |
|---|---|---|---|---|
| Patients/Eyes, n | 16/29 | 6/10 | 22/38 | 12/20 |
| Male/Female, n | 13/3 | 4/2 | 15/7 | 10/2 |
| Age, years | ||||
| Mean ± SD | 61.6 ± 19.1 | 70.7 ± 12.4 | 62.2 ± 13.7 | 59.3 ± 13.4 |
| Range | 12–85 | 52–82 | 35–90 | 41–80 |
| HbA1c, % | ||||
| Mean ± SD | 7.5 ± (1.4) | 6.8 ± (0.5) | 7.1 (0.8) | 7.2 (1.0) |
| Range | 6.1–12.0 | 6.3–7.5 | 6–8.5 | 6–9 |
| CMT, µm ± SD | 276.0 ± 33.8 | 264.0 ± 20.8 | 300.1 ± 93.9 | 326 ± 76 |
| Central edema, no. eyes (%) | 3 (10.3) | 0 (0) | 6 (15.8) | 13 (66.7) |
| SS nasal area | 8.6 (1.1) | 8.2 (1.1) | 8.4 (0.9) | 8.0 (1.0) |
| SS macular area | 8.6 (1.1) | 8.3 (1.3) | 8.9 (1.1) | 8.0 (2.0) |
| No DR | MM NPDR | S NPDR | p * | |
|---|---|---|---|---|
| VDN1 | 0.42 ± 0.07 | 0.39 ± 0.08 | 0.39 ± 0.11 | 0.1695 |
| VDN2 | 0.43 ± 0.07 | 0.42 ± 0.06 | 0.39 ± 0.12 | 0.7567 |
| VDN3 | 0.39 ± 0.08 | 0.37 ± 0.09 | 0.36 ± 0.10 | 0.1563 |
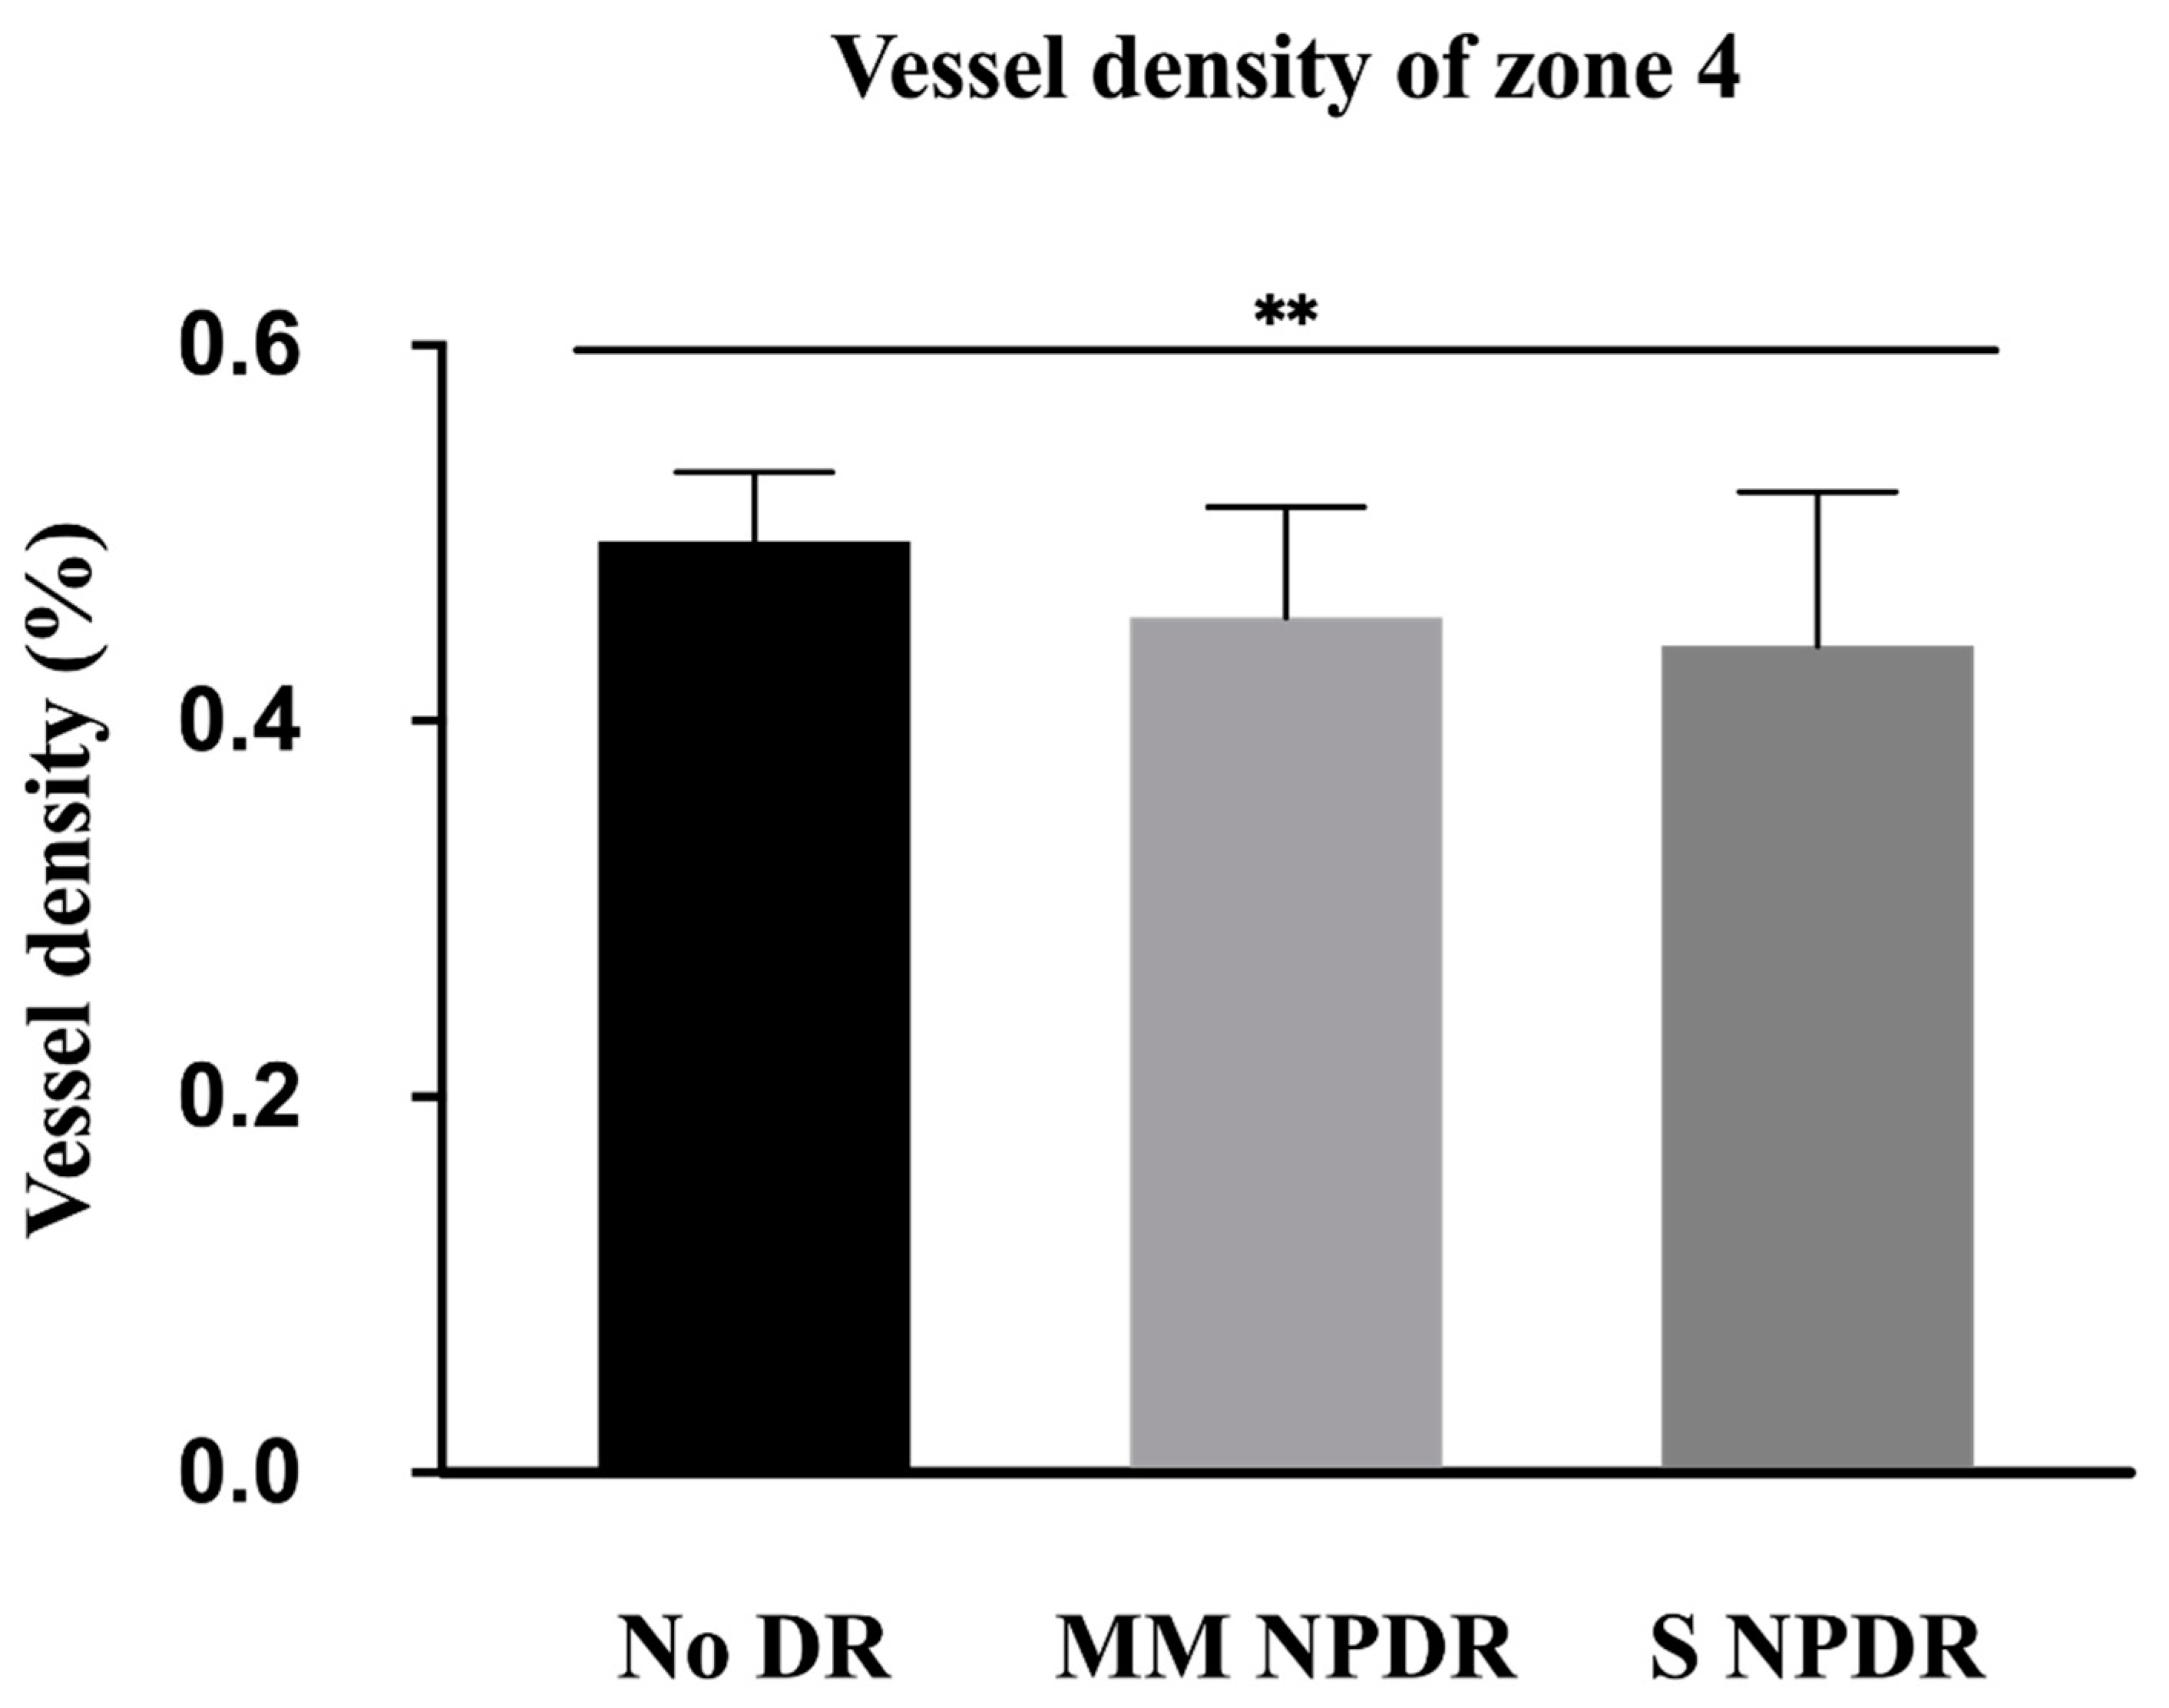
| VDN4 | 0.47 ± 0.08 | 0.46 ± 0.06 | 0.44 ± 0.08 | 0.0028 * |
| VDN5 | 0.39 ± 0.07 | 0.35 ± 0.09 | 0.35 ± 0.11 | 0.7059 |
| VDN6 | 0.40 ± 0.07 | 0.38 ± 0.07 | 0.37 ± 0.09 | 0.0609 |
| VDN7 | 0.36 ± 0.08 | 0.33 ± 0.09 | 0.34 ± 0.10 | 0.4248 |
| VDN8 | 0.34 ± 0.08 | 0.32 ± 0.08 | 0.32 ± 0.10 | 0.8596 |
| VSDN1 | 16.96 ± 2.62 | 16.35 ± 2.53 | 15.51 ± 4.15 | 0.3682 |
| VSDN2 | 16.79 ± 2.39 | 16.37 ± 1.99 | 14.87 ± 4.29 | 0.3748 |
| VSDN3 | 15.69 ± 2.66 | 14.77 ± 3.50 | 14.33 ± 3.89 | 0.3012 |
| VSDN4 | 18.08 ± 2.85 | 18.18 ± 1.86 | 16.99 ± 2.95 | 0.1023 |
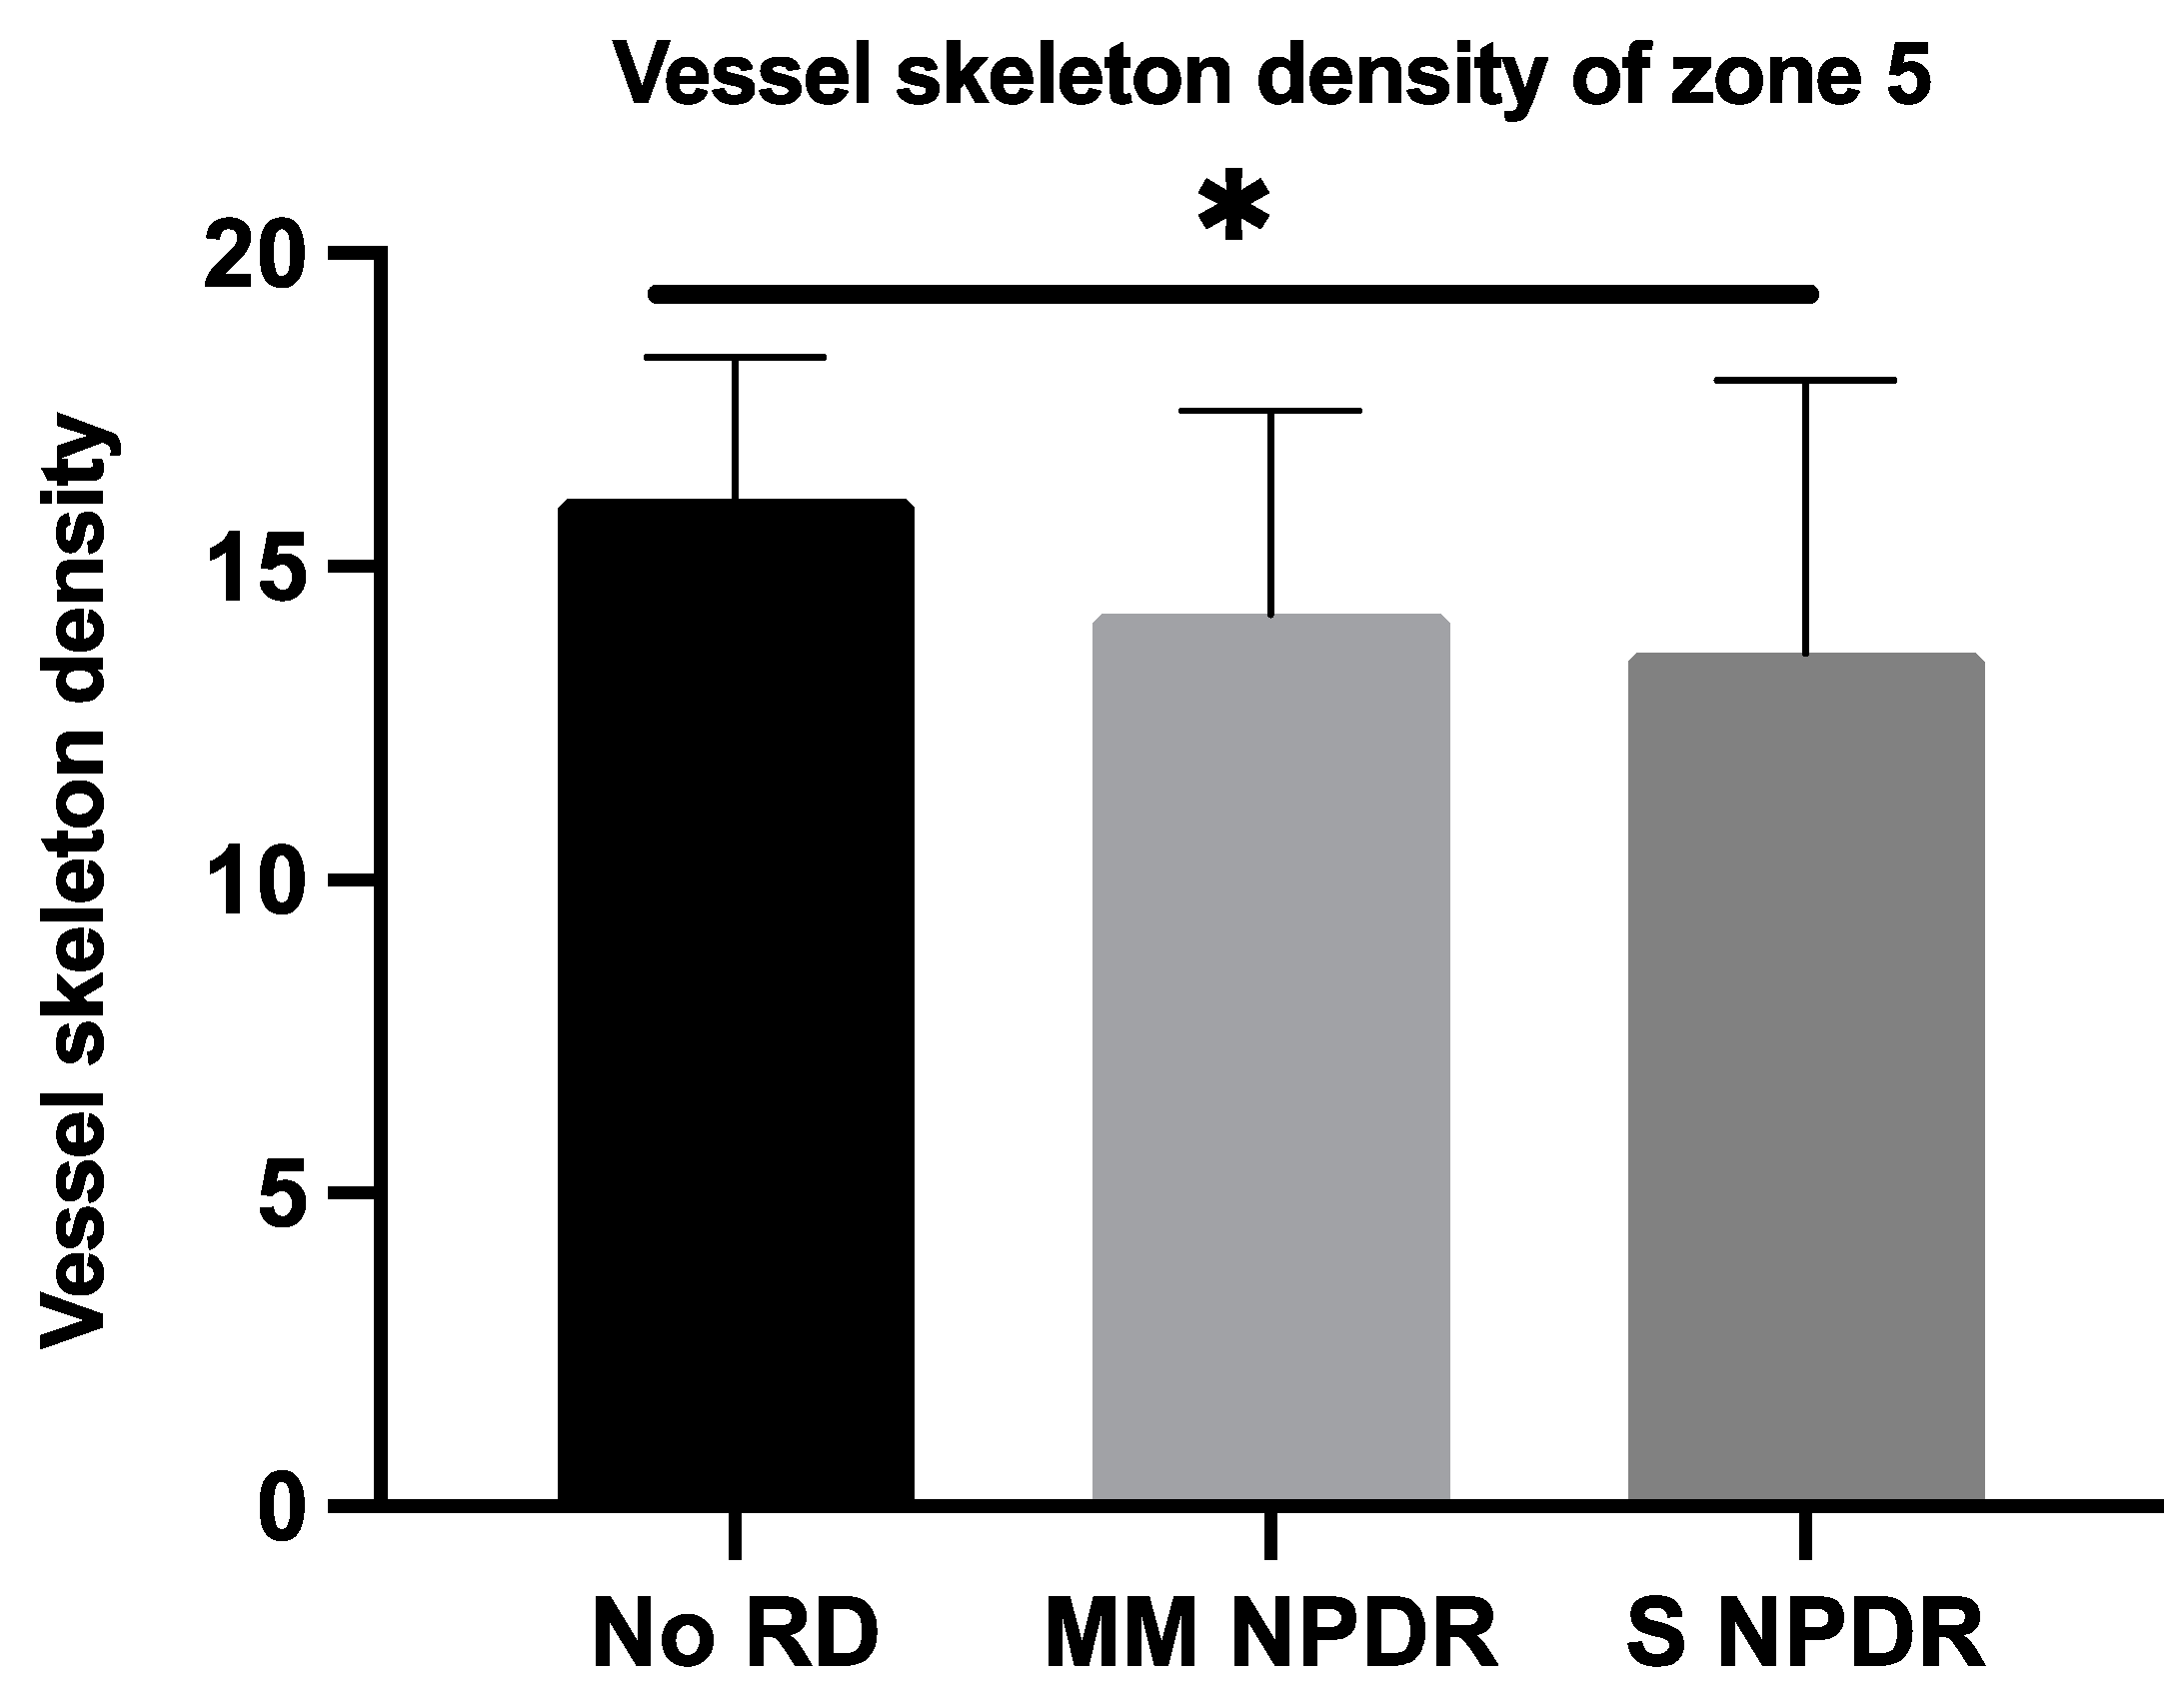
| VSDN5 | 15.84 ± 2.58 | 14.16 ± 3.21 | 13.63 ± 4.35 | 0.0315 * |
| VSDN6 | 15.83 ± 2.60 | 15.14 ± 2.34 | 14.13 ± 3.48 | 0.0324 * |
| VSDN7 | 14.26 ± 3.01 | 13.13 ± 3.23 | 13.02 ± 3.59 | 0.1567 |
| VSDN8 | 13.86 ± 3.07 | 12.90 ± 3.03 | 12.65 ± 4.08 | 0.1860 |
Publisher’s Note: MDPI stays neutral with regard to jurisdictional claims in published maps and institutional affiliations. |
© 2022 by the authors. Licensee MDPI, Basel, Switzerland. This article is an open access article distributed under the terms and conditions of the Creative Commons Attribution (CC BY) license (https://creativecommons.org/licenses/by/4.0/).
Share and Cite
Chaher, A.; Fajnkuchen, F.; Tabary, S.; Giocanti-Aurégan, A. Reduced Vessel Density in the Mid-Periphery and Peripapillary Area of the Superficial Capillary Plexus in Non-Proliferative Diabetic Retinopathy. J. Clin. Med. 2022, 11, 532. https://doi.org/10.3390/jcm11030532
Chaher A, Fajnkuchen F, Tabary S, Giocanti-Aurégan A. Reduced Vessel Density in the Mid-Periphery and Peripapillary Area of the Superficial Capillary Plexus in Non-Proliferative Diabetic Retinopathy. Journal of Clinical Medicine. 2022; 11(3):532. https://doi.org/10.3390/jcm11030532
Chicago/Turabian StyleChaher, Amira, Franck Fajnkuchen, Sandrine Tabary, and Audrey Giocanti-Aurégan. 2022. "Reduced Vessel Density in the Mid-Periphery and Peripapillary Area of the Superficial Capillary Plexus in Non-Proliferative Diabetic Retinopathy" Journal of Clinical Medicine 11, no. 3: 532. https://doi.org/10.3390/jcm11030532
APA StyleChaher, A., Fajnkuchen, F., Tabary, S., & Giocanti-Aurégan, A. (2022). Reduced Vessel Density in the Mid-Periphery and Peripapillary Area of the Superficial Capillary Plexus in Non-Proliferative Diabetic Retinopathy. Journal of Clinical Medicine, 11(3), 532. https://doi.org/10.3390/jcm11030532