
Comparison of Tacrolimus Intra-Patient Variability during 6–12 Months after Kidney Transplantation between CYP3A5 Expressers and Nonexpressers

 , , , ,
Abstract
1. Introduction
2. Materials and Methods
2.1. Study Design and Participants
2.2. Outcome Measurements
2.3. Data Collection
2.4. Tacrolimus Concentration Analysis
2.5. DNA Extraction and Genotyping
2.6. Statistical Analysis
3. Results
4. Discussion
5. Conclusions
Author Contributions
Funding
Institutional Review Board Statement
Informed Consent Statement
Data Availability Statement
Conflicts of Interest
References
- Hart, A.; Lentine, K.L.; Smith, J.M.; Miller, J.M.; Skeans, M.A.; Prentice, M.; Robinson, A.; Foutz, J.; Booker, S.E.; Israni, A.K.; et al. OPTN/SRTR 2019 Annual Data Report: Kidney. Am. J. Transplant. 2021, 21, 21–137. [Google Scholar] [CrossRef] [PubMed]
- Ekberg, H.; Tedesco-Silva, H.; Demirbas, A.; Vítko, S.; Nashan, B.; Gürkan, A.; Margreiter, R.; Hugo, C.; Grinyó, J.M.; Frei, U.; et al. Reduced exposure to calcineurin inhibitors in renal transplantation. N. Engl. J. Med. 2007, 357, 2562–2575. [Google Scholar] [CrossRef] [PubMed]
- Hricik, D.E.; Formica, R.N.; Nickerson, P.; Rush, D.; Fairchild, R.L.; Poggio, E.D.; Gibson, I.W.; Wiebe, C.; Tinckam, K.; Bunnapradist, S.; et al. Adverse outcomes of tacrolimus withdrawal in immune-quiescent kidney transplant recipients. J. Am. Soc. Nephrol. 2015, 26, 3114–3122. [Google Scholar] [CrossRef] [PubMed]
- Dugast, E.; Soulillou, J.P.; Foucher, Y.; Papuchon, E.; Guerif, P.; Paul, C.; Riochet, D.; Chesneau, M.; Cesbron, A.; Renaudin, K.; et al. Failure of calcineurin inhibitor (tacrolimus) weaning randomized trial in long-term stable kidney transplant recipients. Am. J. Transplant. 2016, 16, 3255–3261. [Google Scholar] [CrossRef]
- Staatz, C.E.; Tett, S.E. Clinical pharmacokinetics and pharmacodynamics of tacrolimus in solid organ transplantation. Clin. Pharmacokinet. 2004, 43, 623–653. [Google Scholar] [CrossRef]
- Zwart, T.C.; Guchelaar, H.J.; van der Boog, P.J.M.; Swen, J.J.; van Gelder, T.; de Fijter, J.W.; Moes, D. Model-informed precision dosing to optimise immunosuppressive therapy in renal transplantation. Drug Discov. Today 2021, 26, 2527–2546. [Google Scholar] [CrossRef]
- Shuker, N.; van Gelder, T.; Hesselink, D.A. Intra-patient variability in tacrolimus exposure: Causes, consequences for clinical management. Transplant. Rev. 2015, 29, 78–84. [Google Scholar] [CrossRef]
- Borra, L.C.; Roodnat, J.I.; Kal, J.A.; Mathot, R.A.; Weimar, W.; van Gelder, T. High within-patient variability in the clearance of tacrolimus is a risk factor for poor long-term outcome after kidney transplantation. Nephrol. Dial. Transplant. 2010, 25, 2757–2763. [Google Scholar] [CrossRef]
- Hsiau, M.; Fernandez, H.E.; Gjertson, D.; Ettenger, R.B.; Tsai, E.W. Monitoring nonadherence and acute rejection with variation in blood immunosuppressant levels in pediatric renal transplantation. Transplantation 2011, 92, 918–922. [Google Scholar] [CrossRef]
- Ro, H.; Min, S.I.; Yang, J.; Moon, K.C.; Kim, Y.S.; Kim, S.J.; Ahn, C.; Ha, J. Impact of tacrolimus intraindividual variability and CYP3A5 genetic polymorphism on acute rejection in kidney transplantation. Ther. Drug Monit. 2012, 34, 680–685. [Google Scholar] [CrossRef]
- O’Regan, J.A.; Canney, M.; Connaughton, D.M.; O’Kelly, P.; Williams, Y.; Collier, G.; deFreitas, D.G.; O’Seaghdha, C.M.; Conlon, P.J. Tacrolimus trough-level variability predicts long-term allograft survival following kidney transplantation. J. Nephrol. 2016, 29, 269–276. [Google Scholar] [CrossRef] [PubMed]
- Rodrigo, E.; Segundo, D.S.; Fernandez-Fresnedo, G.; Lopez-Hoyos, M.; Benito, A.; Ruiz, J.C.; de Cos, M.A.; Arias, M. Within-patient variability in tacrolimus blood levels predicts kidney graft loss and donor-specific antibody development. Transplantation 2016, 100, 2479–2485. [Google Scholar] [CrossRef] [PubMed]
- Whalen, H.R.; Glen, J.A.; Harkins, V.; Stevens, K.K.; Jardine, A.G.; Geddes, C.C.; Clancy, M.J. High intrapatient tacrolimus variability is associated with worse outcomes in renal transplantation using a low-dose tacrolimus immunosuppressive regime. Transplantation 2017, 101, 430–436. [Google Scholar] [CrossRef] [PubMed]
- Shuker, N.; Shuker, L.; van Rosmalen, J.; Roodnat, J.I.; Borra, L.C.; Weimar, W.; Hesselink, D.A.; van Gelder, T. A high intrapatient variability in tacrolimus exposure is associated with poor long-term outcome of kidney transplantation. Transpl. Int. 2016, 29, 1158–1167. [Google Scholar] [CrossRef] [PubMed]
- Vanhove, T.; Vermeulen, T.; Annaert, P.; Lerut, E.; Kuypers, D.R.J. High intrapatient variability of tacrolimus concentrations predicts accelerated progression of chronic histologic lesions in renal recipients. Am. J. Transplant. 2016, 16, 2954–2963. [Google Scholar] [CrossRef]
- Seibert, S.R.; Schladt, D.P.; Wu, B.; Guan, W.; Dorr, C.; Remmel, R.P.; Matas, A.J.; Mannon, R.B.; Israni, A.K.; Oetting, W.S.; et al. Tacrolimus trough and dose intra-patient variability and CYP3A5 genotype: Effects on acute rejection and graft failure in European American and African American kidney transplant recipients. Clin. Transplant. 2018, 32, e13424. [Google Scholar] [CrossRef]
- Sapir-Pichhadze, R.; Wang, Y.; Famure, O.; Li, Y.; Kim, S.J. Time-dependent variability in tacrolimus trough blood levels is a risk factor for late kidney transplant failure. Kidney Int. 2014, 85, 1404–1411. [Google Scholar] [CrossRef]
- Goodall, D.L.; Willicombe, M.; McLean, A.G.; Taube, D. High intrapatient variability of tacrolimus levels and outpatient clinic nonattendance are associated with inferior outcomes in renal transplant patients. Transplant. Direct 2017, 3, e192. [Google Scholar] [CrossRef]
- Taber, D.J.; Su, Z.; Fleming, J.N.; McGillicuddy, J.W.; Posadas-Salas, M.A.; Treiber, F.A.; Dubay, D.; Srinivas, T.R.; Mauldin, P.D.; Moran, W.P.; et al. Tacrolimus trough concentration variability and disparities in African American kidney transplantation. Transplantation 2017, 101, 2931–2938. [Google Scholar] [CrossRef]
- Süsal, C.; Döhler, B. Late intra-patient tacrolimus trough level variability as a major problem in kidney transplantation: A collaborative transplant study report. Am. J. Transplant. 2019, 19, 2805–2813. [Google Scholar] [CrossRef]
- Larpparisuth, N.; Pongnatcha, T.; Panprom, P.; Promraj, R.; Premasathian, N.; Vongwiwatana, A. High intrapatient variability in tacrolimus exposure calculated over a long period is associated with de novo donor-specific antibody development and/or late rejection in Thai kidney transplant patients receiving concomitant CYP3A4/5 inhibitors. Ther. Drug Monit. 2021, 43, 624–629. [Google Scholar] [CrossRef] [PubMed]
- Brunet, M.; van Gelder, T.; Åsberg, A.; Haufroid, V.; Hesselink, D.A.; Langman, L.; Lemaitre, F.; Marquet, P.; Seger, C.; Shipkova, M.; et al. Therapeutic drug monitoring of tacrolimus-personalized therapy: Second consensus report. Ther. Drug Monit. 2019, 41, 261–307. [Google Scholar] [CrossRef] [PubMed]
- Staatz, C.E.; Goodman, L.K.; Tett, S.E. Effect of CYP3A and ABCB1 single nucleotide polymorphisms on the pharmacokinetics and pharmacodynamics of calcineurin inhibitors: Part I. Clin. Pharmacokinet. 2010, 49, 141–175. [Google Scholar] [CrossRef] [PubMed]
- Hesselink, D.A.; Bouamar, R.; Elens, L.; van Schaik, R.H.; van Gelder, T. The role of pharmacogenetics in the disposition of and response to tacrolimus in solid organ transplantation. Clin. Pharmacokinet. 2014, 53, 123–139. [Google Scholar] [CrossRef]
- Pashaee, N.; Bouamar, R.; Hesselink, D.A.; Roodnat, J.I.; van Schaik, R.H.; Weimar, W.; van Gelder, T. CYP3A5 genotype is not related to the intrapatient variability of tacrolimus clearance. Ther. Drug Monit. 2011, 33, 369–371. [Google Scholar] [CrossRef]
- Spierings, N.; Holt, D.W.; MacPhee, I.A. CYP3A5 genotype had no impact on intrapatient variability of tacrolimus clearance in renal transplant recipients. Ther. Drug Monit. 2013, 35, 328–331. [Google Scholar] [CrossRef]
- Cheung, C.Y.; Chan, K.M.; Wong, Y.T.; Chak, W.L.; Bekers, O.; van Hooff, J.P. Impact of CYP3A5 genetic polymorphism on intrapatient variability of tacrolimus exposure in Chinese kidney transplant recipients. Transplant. Proc. 2019, 51, 1754–1757. [Google Scholar] [CrossRef]
- Muller, W.K.; Dandara, C.; Manning, K.; Mhandire, D.; Ensor, J.; Barday, Z.; Freercks, R. CYP3A5 polymorphisms and their effects on tacrolimus exposure in an ethnically diverse South African renal transplant population. S. Afr. Med. J. 2020, 110, 159–166. [Google Scholar] [CrossRef]
- Davit, B.M.; Chen, M.L.; Conner, D.P.; Haidar, S.H.; Kim, S.; Lee, C.H.; Lionberger, R.A.; Makhlouf, F.T.; Nwakama, P.E.; Patel, D.T.; et al. Implementation of a reference-scaled average bioequivalence approach for highly variable generic drug products by the US Food and Drug Administration. AAPS J. 2012, 14, 915–924. [Google Scholar] [CrossRef]
- Abbott Laboratories. ARCHITECT iSystem: Tacrolimus [Manufacture’s Information]; Abbott Laboratories: Chicago, IL, USA, 2015. [Google Scholar]
- Faul, F.; Erdfelder, E.; Lang, A.G.; Buchner, A. G*Power 3: A flexible statistical power analysis program for the social, behavioral, and biomedical sciences. Behav. Res. Methods 2007, 39, 175–191. [Google Scholar] [CrossRef]
- Kuypers, D.R.J. Intrapatient variability of tacrolimus exposure in solid organ transplantation: A novel marker for clinical outcome. Clin. Pharmacol. Ther. 2020, 107, 347–358. [Google Scholar] [CrossRef] [PubMed]
- Floyd, M.D.; Gervasini, G.; Masica, A.L.; Mayo, G.; George, A.L., Jr.; Bhat, K.; Kim, R.B.; Wilkinson, G.R. Genotype-phenotype associations for common CYP3A4 and CYP3A5 variants in the basal and induced metabolism of midazolam in European- and African-American men and women. Pharmacogenetics 2003, 13, 595–606. [Google Scholar] [CrossRef] [PubMed]
- Chen, L.; Prasad, G.V.R. CYP3A5 polymorphisms in renal transplant recipients: Influence on tacrolimus treatment. Pharmgenomics Pers. Med. 2018, 11, 23–33. [Google Scholar] [CrossRef] [PubMed]
- Jacobson, P.A.; Oetting, W.S.; Brearley, A.M.; Leduc, R.; Guan, W.; Schladt, D.; Matas, A.J.; Lamba, V.; Julian, B.A.; Mannon, R.B.; et al. Novel polymorphisms associated with tacrolimus trough concentrations: Results from a multicenter kidney transplant consortium. Transplantation 2011, 91, 300–308. [Google Scholar] [CrossRef]
- Phupradit, A.; Vadcharavivad, S.; Ingsathit, A.; Kantachuvesiri, S.; Areepium, N.; Sra-Ium, S.; Auamnoy, T.; Sukasem, C.; Sumethkul, V.; Kitiyakara, C. Impact of POR and CYP3A5 polymorphisms on trough concentration to dose ratio of tacrolimus in the early post-operative period following kidney transplantation. Ther. Drug Monit. 2018, 40, 549–557. [Google Scholar] [CrossRef]
- Terrazzino, S.; Quaglia, M.; Stratta, P.; Canonico, P.L.; Genazzani, A.A. The effect of CYP3A5 6986A>G and ABCB1 3435C>T on tacrolimus dose-adjusted trough levels and acute rejection rates in renal transplant patients: A systematic review and meta-analysis. Pharmacogenet. Genom. 2012, 22, 642–645. [Google Scholar] [CrossRef]
- Vadcharavivad, S.; Praisuwan, S.; Techawathanawanna, N.; Treyaprasert, W.; Avihingsanon, Y. Population pharmacokinetics of tacrolimus in Thai kidney transplant patients: Comparison with similar data from other populations. J. Clin. Pharm. Ther. 2016, 41, 310–328. [Google Scholar] [CrossRef]
- de Jonge, H.; Vanhove, T.; de Loor, H.; Verbeke, K.; Kuypers, D.R. Progressive decline in tacrolimus clearance after renal transplantation is partially explained by decreasing CYP3A4 activity and increasing haematocrit. Br. J. Clin. Pharmacol. 2015, 80, 548–559. [Google Scholar] [CrossRef]
- Elens, L.; Capron, A.; van Schaik, R.H.; De Meyer, M.; De Pauw, L.; Eddour, D.C.; Latinne, D.; Wallemacq, P.; Mourad, M.; Haufroid, V. Impact of CYP3A4*22 allele on tacrolimus pharmacokinetics in early period after renal transplantation: Toward updated genotype-based dosage guidelines. Ther. Drug Monit. 2013, 35, 608–616. [Google Scholar] [CrossRef]
- Oetting, W.S.; Schladt, D.P.; Guan, W.; Miller, M.B.; Remmel, R.P.; Dorr, C.; Sanghavi, K.; Mannon, R.B.; Herrera, B.; Matas, A.J.; et al. Genomewide association study of tacrolimus concentrations in African American kidney transplant recipients identifies multiple CYP3A5 alleles. Am. J. Transplant. 2016, 16, 574–582. [Google Scholar] [CrossRef]


| Characteristics | CYP3A5 Expressers (n = 110) | CYP3A5 Nonexpressers (n = 78) | p-Value |
|---|---|---|---|
| On the day of transplantation | |||
| Recipient age, years | 45.8 ± 11.7 | 44.7 ± 11.6 | 0.538 b |
| Body weight, kg | 58.2 ± 11.2 | 58.0 ± 11.7 | 0.889 b |
| Female, n (%) | 49 (44.5) | 35 (44.9) | 0.965 a |
| Previous KT, n (%) | 7 (6.4) | 3 (3.8) | 0.527 c |
| Panel reactive antibody > 20%, n (%) | 19 (17.3) | 12 (15.4) | 0.731 a |
| Human leukocyte antigen mismatches, no. | 3.0 [2.0, 4.0] | 3.0 [2.0, 4.0] | 0.973 d |
| Deceased donor, n (%) | 56 (50.9) | 36 (46.2) | 0.520 a |
| Donor age, years | 36.5 [28.8, 46.2] | 38.0 [28.2, 46.2] | 0.723 d |
| Cold ischemic time, minutes | 253.5 [20.8, 1078.5] | 68.0 [21.5, 1047.0] | 0.907 d |
| Renal replacement therapy before KT, n (%) | - | - | 0.234 c |
| Preemptive transplantation | 2 (1.8) | 4 (5.1) | - |
| Hemodialysis | 97 (88.2) | 70 (89.7) | - |
| Peritoneal dialysis | 11 (10.0) | 4 (5.1) | - |
| At month 6 post-kidney transplantation | |||
| Serum creatinine, mg/dL | 1.3 [1.0, 1.6] | 1.2 [1.0, 1.5] | 0.377 d |
| Hemoglobin, g/dL | 12.9 ± 1.8 | 13.2 ± 1.8 | 0.353 b |
| Serum albumin, g/dL e | 4.3 [4.1, 4.6] | 4.3 [4.2, 4.6] | 0.495 d |
| At month 9 post- kidney transplantation | |||
| Serum creatinine, mg/dL | 1.3 [1.0, 1.5] | 1.2 [1.0, 1.5] | 0.475 d |
| Hemoglobin, g/dL | 13.2 ± 1.8 | 13.5 ± 1.8 | 0.272 b |
| Serum albumin, g/dL f | 4.4 [4.2, 4.6] | 4.4 [4.2, 4.6] | 0.742 d |
| At month 12 post- kidney transplantation | |||
| Serum creatinine, mg/dL | 1.3 [1.0, 1.5] | 1.2 [1.0, 1.5] | 0.327 d |
| Hemoglobin, g/dL | 13.4 ± 1.7 | 13. 6 ± 1. 7 | 0.421 b |
| Serum albumin, g/dL g | 4.4 [4.2, 4.6] | 4.4 [4.3, 4.7] | 0.527 d |
| Tacrolimus Exposure a | CYP3A5 Expressers (n = 110) | CYP3A5 Nonexpressers (n = 78) | p-Value |
|---|---|---|---|
| Month 6 post-kidney transplantation | |||
| C0, ng/mL | 6.6 [5.8, 7.8] | 6.7 [5.3, 8.2] | 0.747 b |
| Dose, mg/day | 6.0 [5.0, 8.1] | 3.0 [2.5, 4.5] | <0.001 b |
| C0/D, ng/mL per mg/day | 1.02 [0.80, 1.40] | 2.16 [1.55, 2.82] | <0.001 b |
| Month 9 post-kidney transplantation | |||
| C0, ng/mL | 6.2 [5.5, 7.6] | 6.4 [5.4, 7.8] | 0.708 b |
| Dose, mg/day | 6.0 [4.5, 8.0] | 3.0 [2.0, 4.0] | <0.001 b |
| C0/D, ng/mL per mg/day | 1.09 [0.82, 1.38] | 2.07 [1.65, 2.80] | <0.001 b |
| Month 12 post-kidney transplantation | |||
| C0, ng/mL | 6.2 [5.3, 7.1] | 6.6 [5.6, 7.8] | 0.161 b |
| Dose, mg/day | 5.5 [4.5, 7.0] | 3.0 [2.0, 4.0] | <0.001 b |
| C0/D, ng/mL per mg/day | 1.06 [0.88, 1.40] | 2.36 [1.72, 2.90] | <0.001 b |
| Intra-patient variability | |||
| IPVmad C0, % | 12.6 [7.6, 19.2] | 14.4 [9.6, 20.0] | 0.193 b |
| IPVcv C0, % | 17.7 [10.0, 25.9] | 19.7 [12.8, 26.5] | 0.176 b |
| IPVmad, % | 11.6 [7.9, 17.8] | 10.8 [7.5, 17.9] | 0.686 b |
| Number of patients with IPVmad ≥ 30%, n (%) | 6 (5.5) | 4 (5.1) | 1.000 c |
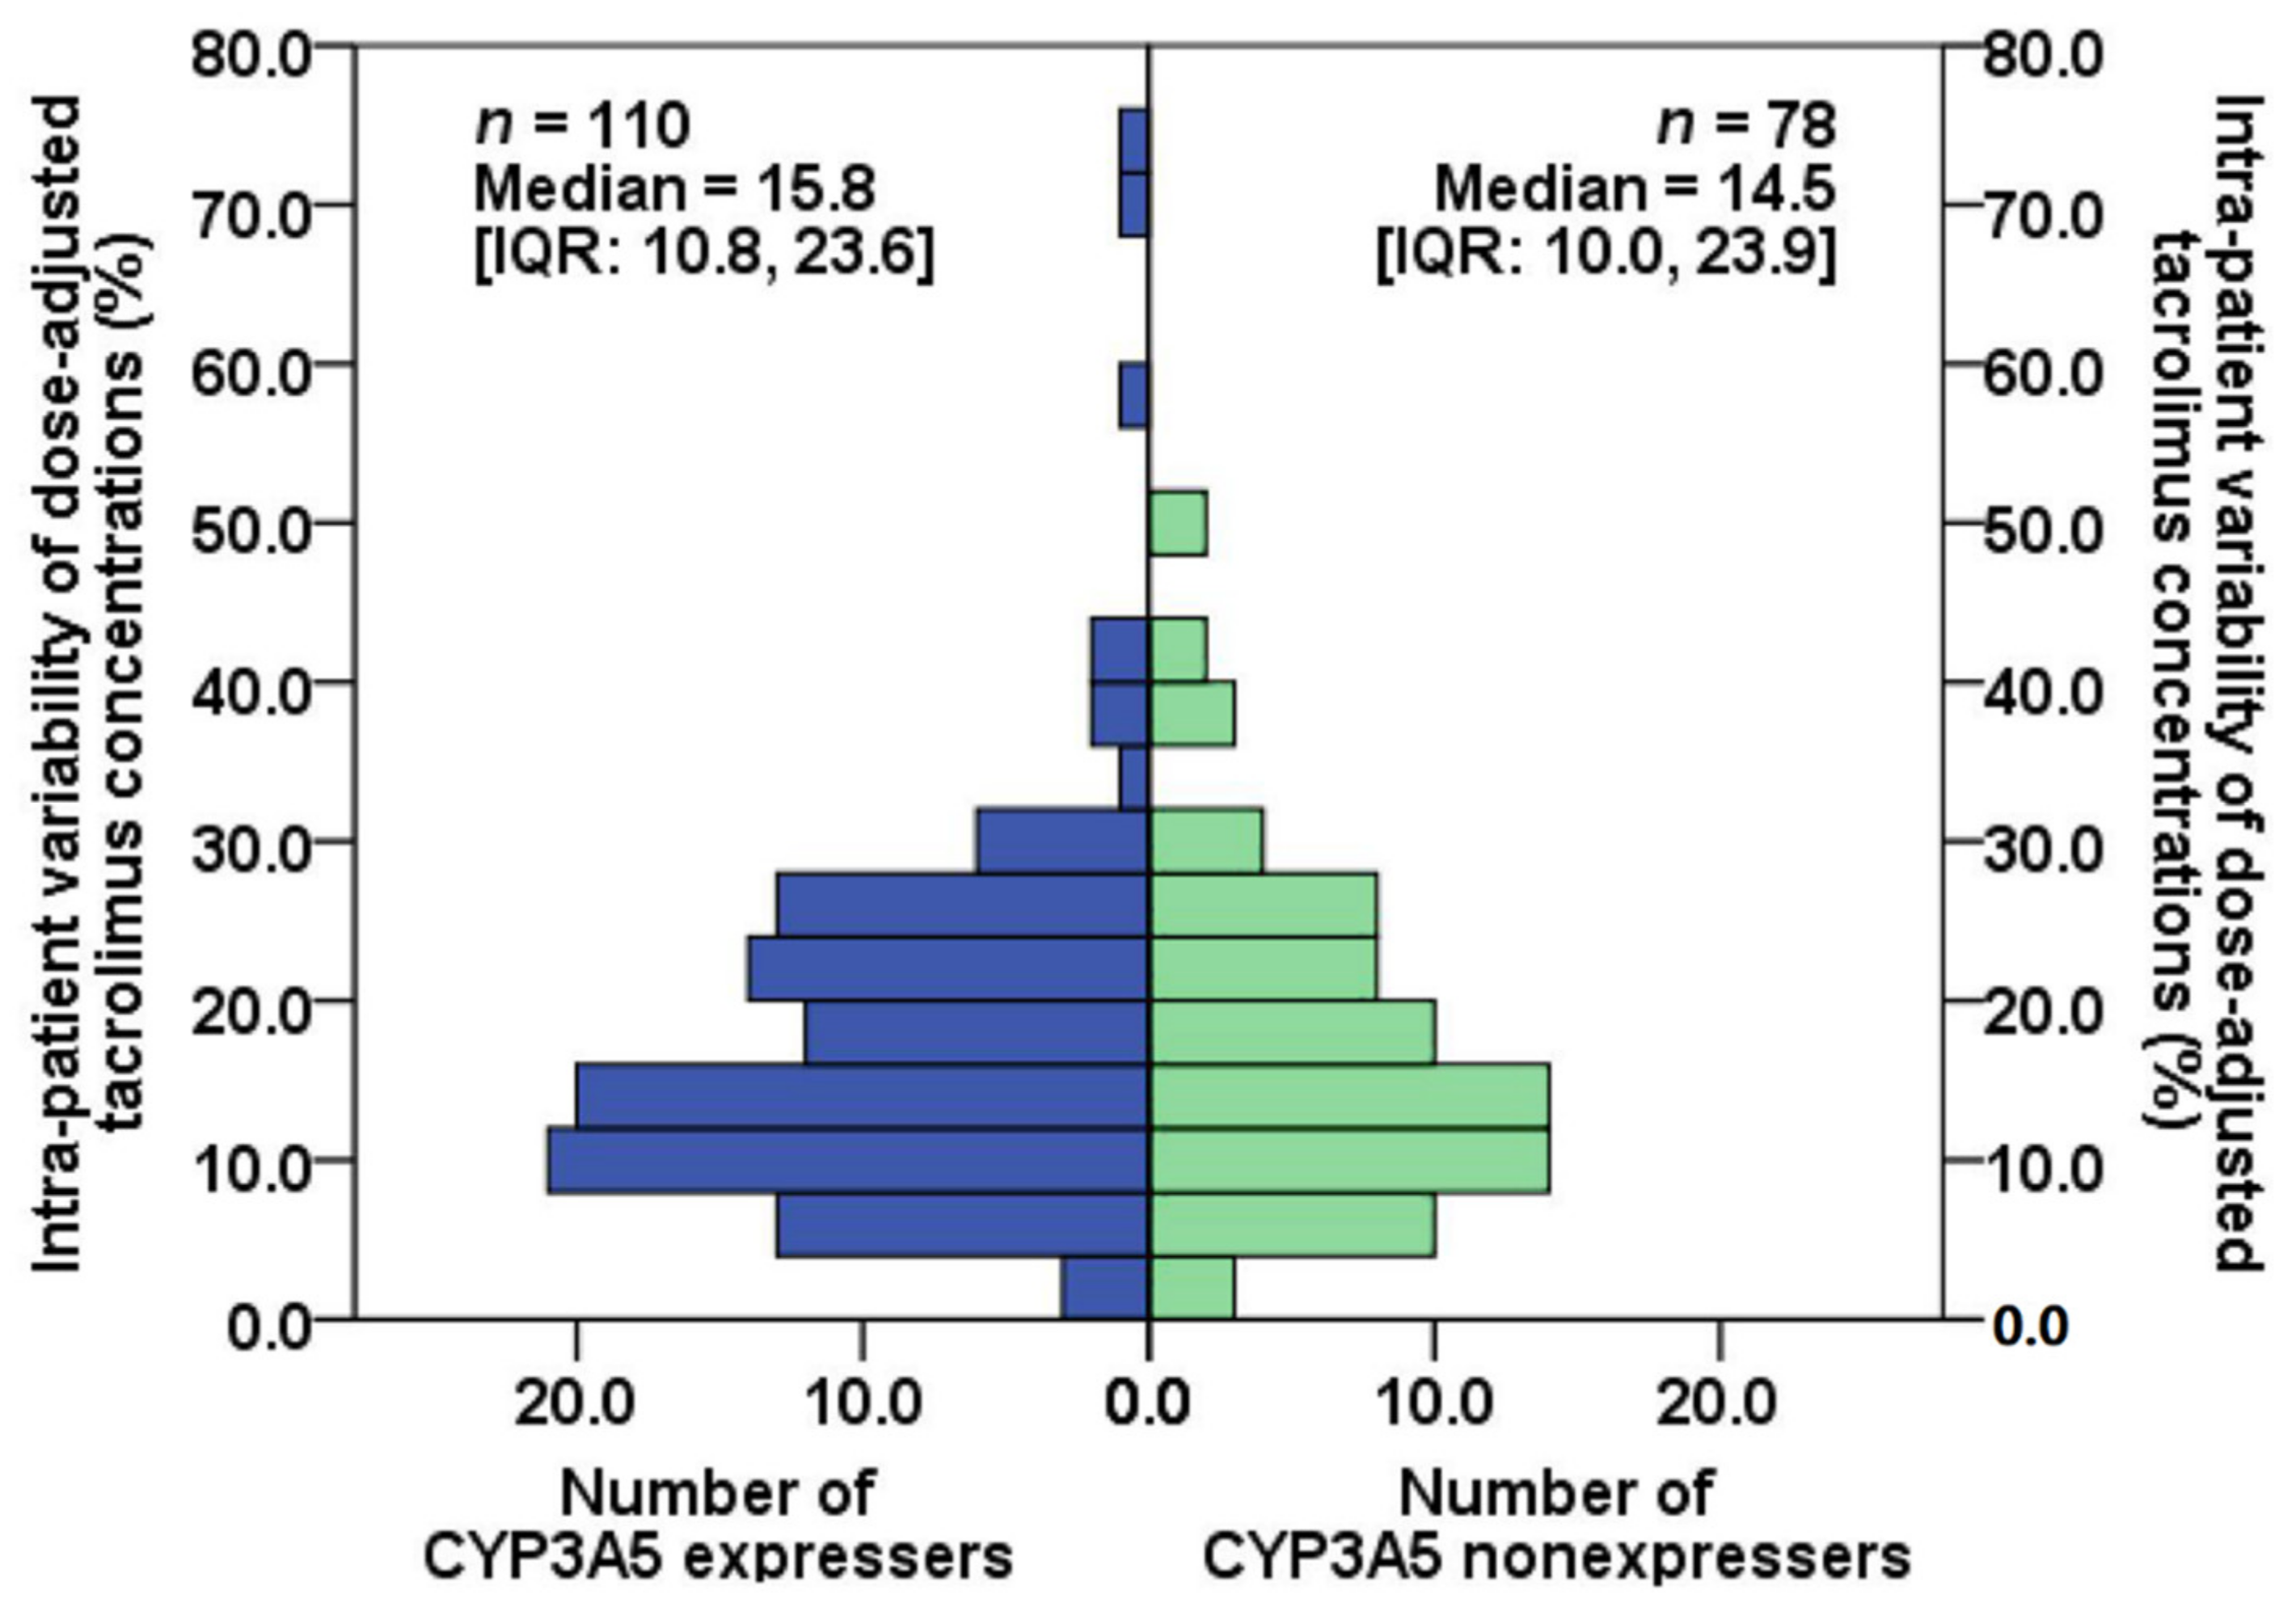
| IPVcv, % | 15.8 [10.8, 23.6] | 14.5 [10.0, 23.9] | 0.613 b |
| Number of patients with IPVcv ≥ 30%, n (%) | 11 (10.0) | 8 (10.3) | 0.954 d |
| LogC0/D | n | Month 6 | Month 9 | Month 12 | Total Means | 95% CI a |
|---|---|---|---|---|---|---|
| CYP3A5 expressers | 110 | 0.03 ± 0.18 | 0.04 ± 0.17 | 0.05 ± 0.17 | 0.04 b | 0.01, 0.07 |
| CYP3A5 nonexpressers | 78 | 0.32 ± 0.18 | 0.34 ± 0.17 | 0.36 ± 0.19 | 0.34 b | 0.30, 0.38 |
| Total means | - | 0.18 c | 0.19 | 0.20 c | - | - |
| 95% CI a | - | 0.15, 0.20 | 0.17, 0.22 | 0.18, 0.23 | - | - |
| Source | Sum of Squares | Mean square | df | F | p-Value | Partial eta-squared |
| CYP3A5*3 polymorphisms | 12.2 | 12.2 | 1, 186 | 158 | <0.001 | 0.459 |
| Time | 0.072 | 0.039 | 1.85, 345 | 4.02 | 0.021 | 0.021 |
| Polymorphisms × Time | 0.005 | 0.003 | 1.85, 345 | 0.279 | 0.740 | 0.001 |
| During Months 12–24 Post-Kidney Transplantation | CYP3A5 Expressers (n = 110) | CYP3A5 Nonexpressers (n = 78) | p-Value |
|---|---|---|---|
| Overall BPAR occurrence, n (%) | 5 (4.5) | 2 (2.6) | 0.701 a |
| Acute cellular rejection, n (%) | 2 (1.8) | 0 (0.0) | 0.512 a |
| Antibody-mediated rejection, n (%) | 3 (2.7) | 2 (2.6) | 1.000 a |
| BK viremia detection, n (%) | 6 (5.5) | 3 (3.8) | 0.738 a |
| Plasma BK viral load of ≥10,000 copies/mL, n (%) | 2 (1.8) | 0 (0.0) | 0.512 a |
| BKVAN development, n (%) | 2 (1.8) | 0 (0.0) | 0.512 a |
| Serum creatinine at month 24, mg/dLc | 1.3 [1.0, 1.5] | 1.2 [1.0, 1.5] | 0.525 b |
Publisher’s Note: MDPI stays neutral with regard to jurisdictional claims in published maps and institutional affiliations. |
© 2022 by the authors. Licensee MDPI, Basel, Switzerland. This article is an open access article distributed under the terms and conditions of the Creative Commons Attribution (CC BY) license (https://creativecommons.org/licenses/by/4.0/).
Share and Cite
Nuchjumroon, A.; Vadcharavivad, S.; Singhan, W.; Poosoonthornsri, M.; Chancharoenthana, W.; Udomkarnjananun, S.; Townamchai, N.; Avihingsanon, Y.; Praditpornsilpa, K.; Eiam-Ong, S. Comparison of Tacrolimus Intra-Patient Variability during 6–12 Months after Kidney Transplantation between CYP3A5 Expressers and Nonexpressers. J. Clin. Med. 2022, 11, 6320. https://doi.org/10.3390/jcm11216320
Nuchjumroon A, Vadcharavivad S, Singhan W, Poosoonthornsri M, Chancharoenthana W, Udomkarnjananun S, Townamchai N, Avihingsanon Y, Praditpornsilpa K, Eiam-Ong S. Comparison of Tacrolimus Intra-Patient Variability during 6–12 Months after Kidney Transplantation between CYP3A5 Expressers and Nonexpressers. Journal of Clinical Medicine. 2022; 11(21):6320. https://doi.org/10.3390/jcm11216320
Chicago/Turabian StyleNuchjumroon, Almas, Somratai Vadcharavivad, Wanchana Singhan, Manorom Poosoonthornsri, Wiwat Chancharoenthana, Suwasin Udomkarnjananun, Natavudh Townamchai, Yingyos Avihingsanon, Kearkiat Praditpornsilpa, and Somchai Eiam-Ong. 2022. "Comparison of Tacrolimus Intra-Patient Variability during 6–12 Months after Kidney Transplantation between CYP3A5 Expressers and Nonexpressers" Journal of Clinical Medicine 11, no. 21: 6320. https://doi.org/10.3390/jcm11216320
APA StyleNuchjumroon, A., Vadcharavivad, S., Singhan, W., Poosoonthornsri, M., Chancharoenthana, W., Udomkarnjananun, S., Townamchai, N., Avihingsanon, Y., Praditpornsilpa, K., & Eiam-Ong, S. (2022). Comparison of Tacrolimus Intra-Patient Variability during 6–12 Months after Kidney Transplantation between CYP3A5 Expressers and Nonexpressers. Journal of Clinical Medicine, 11(21), 6320. https://doi.org/10.3390/jcm11216320