
DEXA Scan Body Fat Mass Distribution in Obese and Non-Obese Individuals and Risk of NAFLD—Analysis of 10,865 Individuals

 , , and
Abstract
1. Introduction
2. Materials and Methods
3. Results
3.1. Baseline Characteristics of Non-Obese NAFLD vs. Non-NAFLD
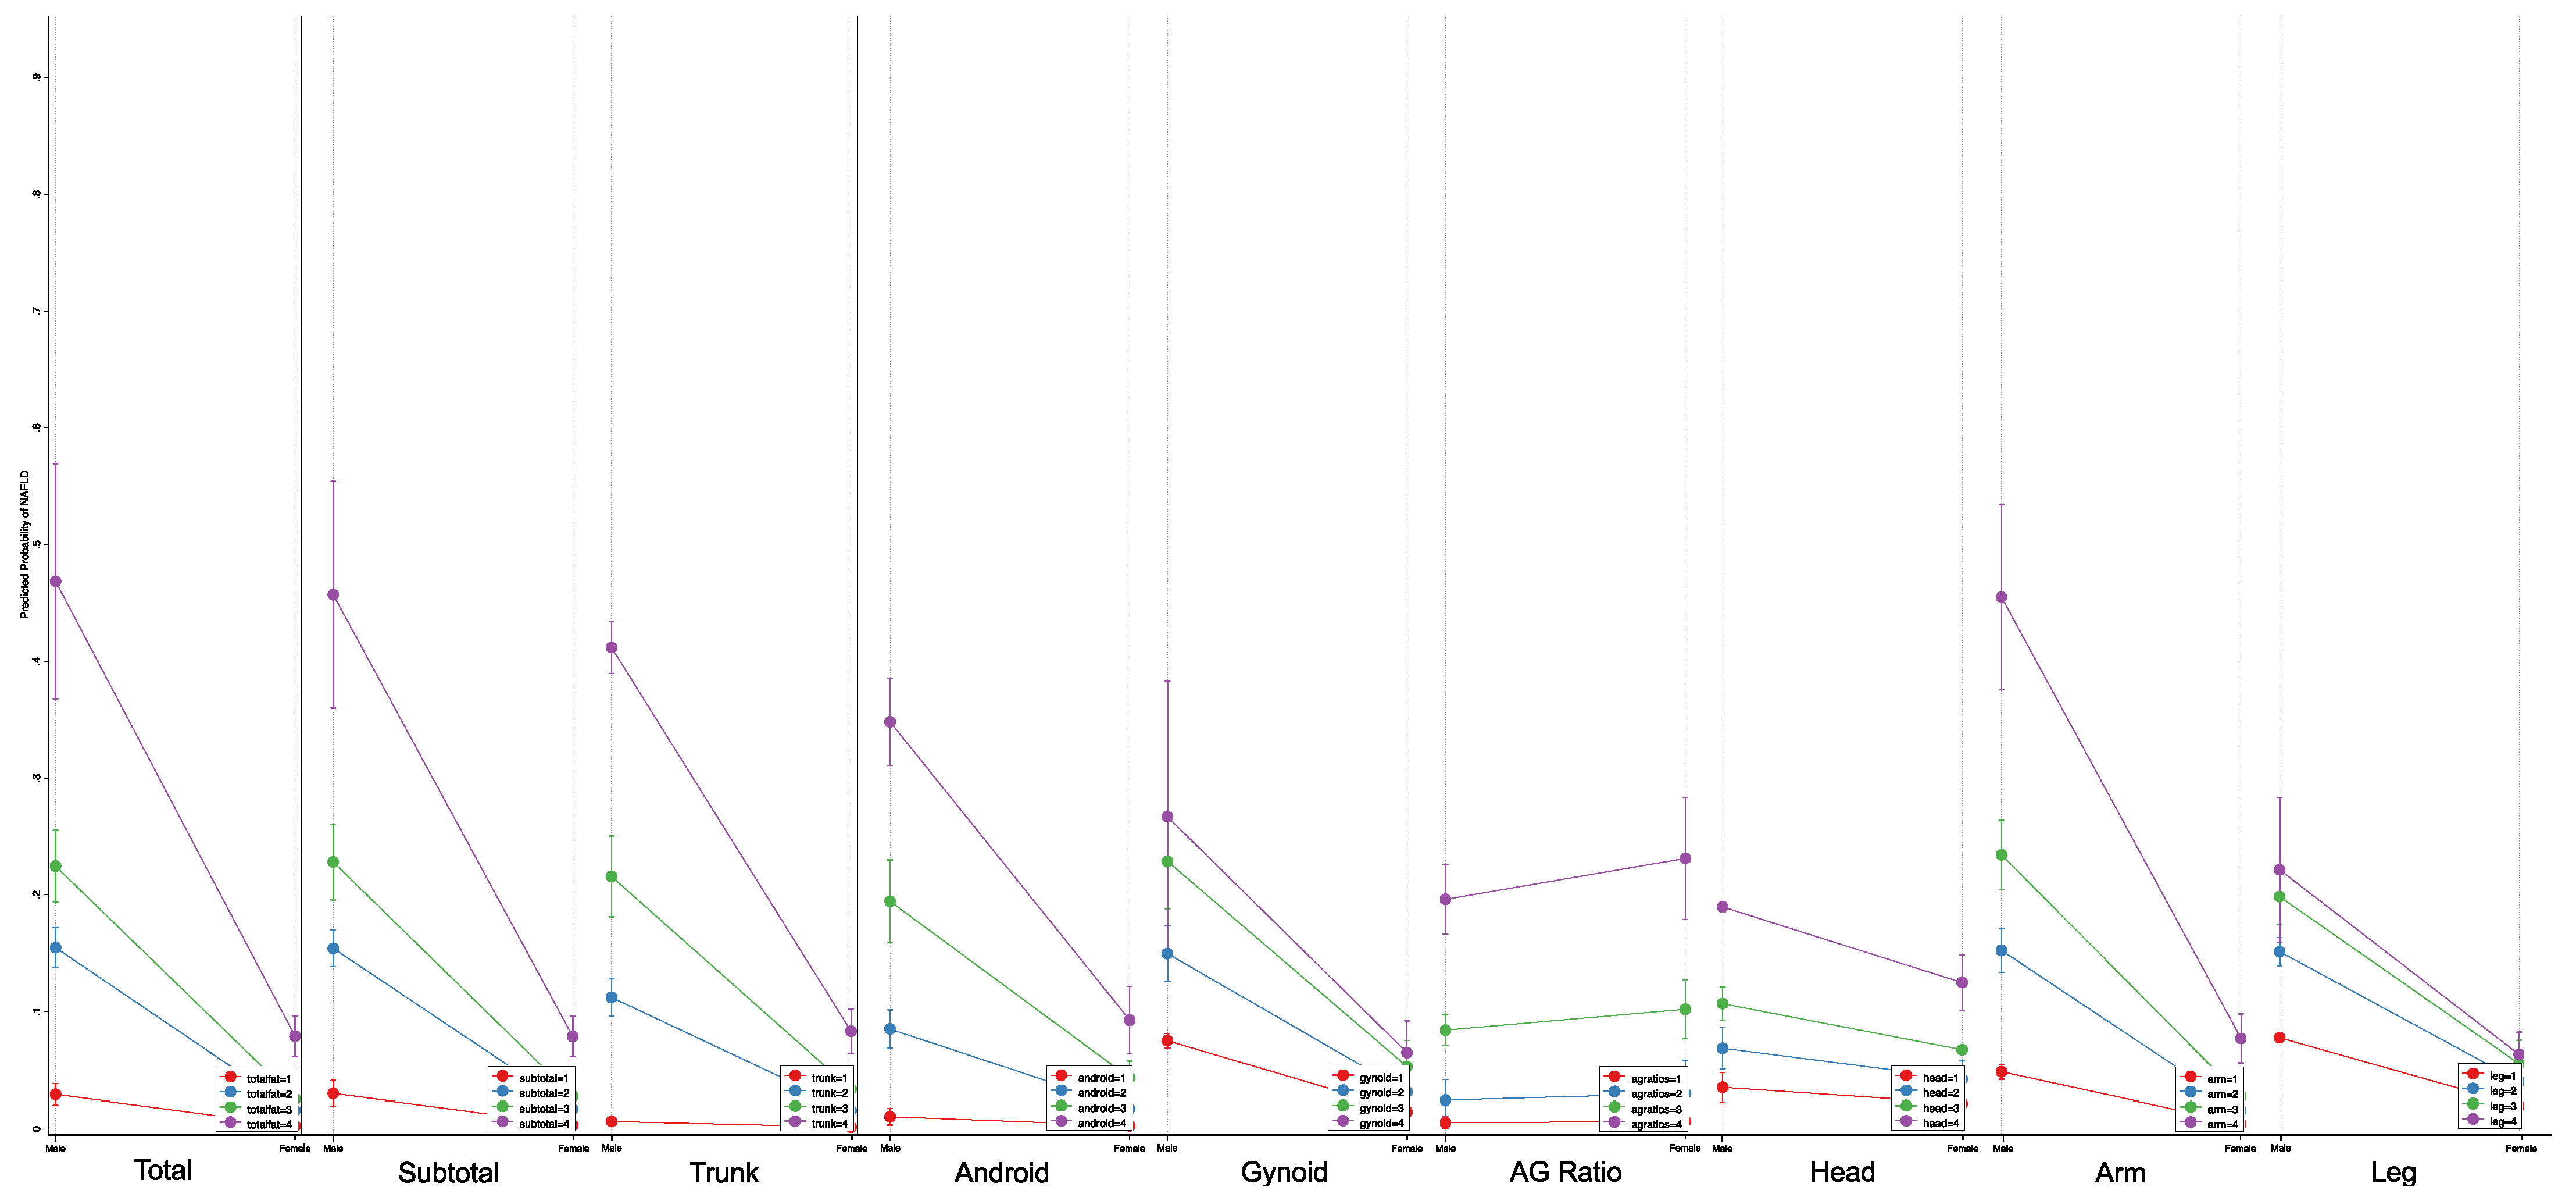
3.2. Risk of NAFLD in Non-Obese Individuals
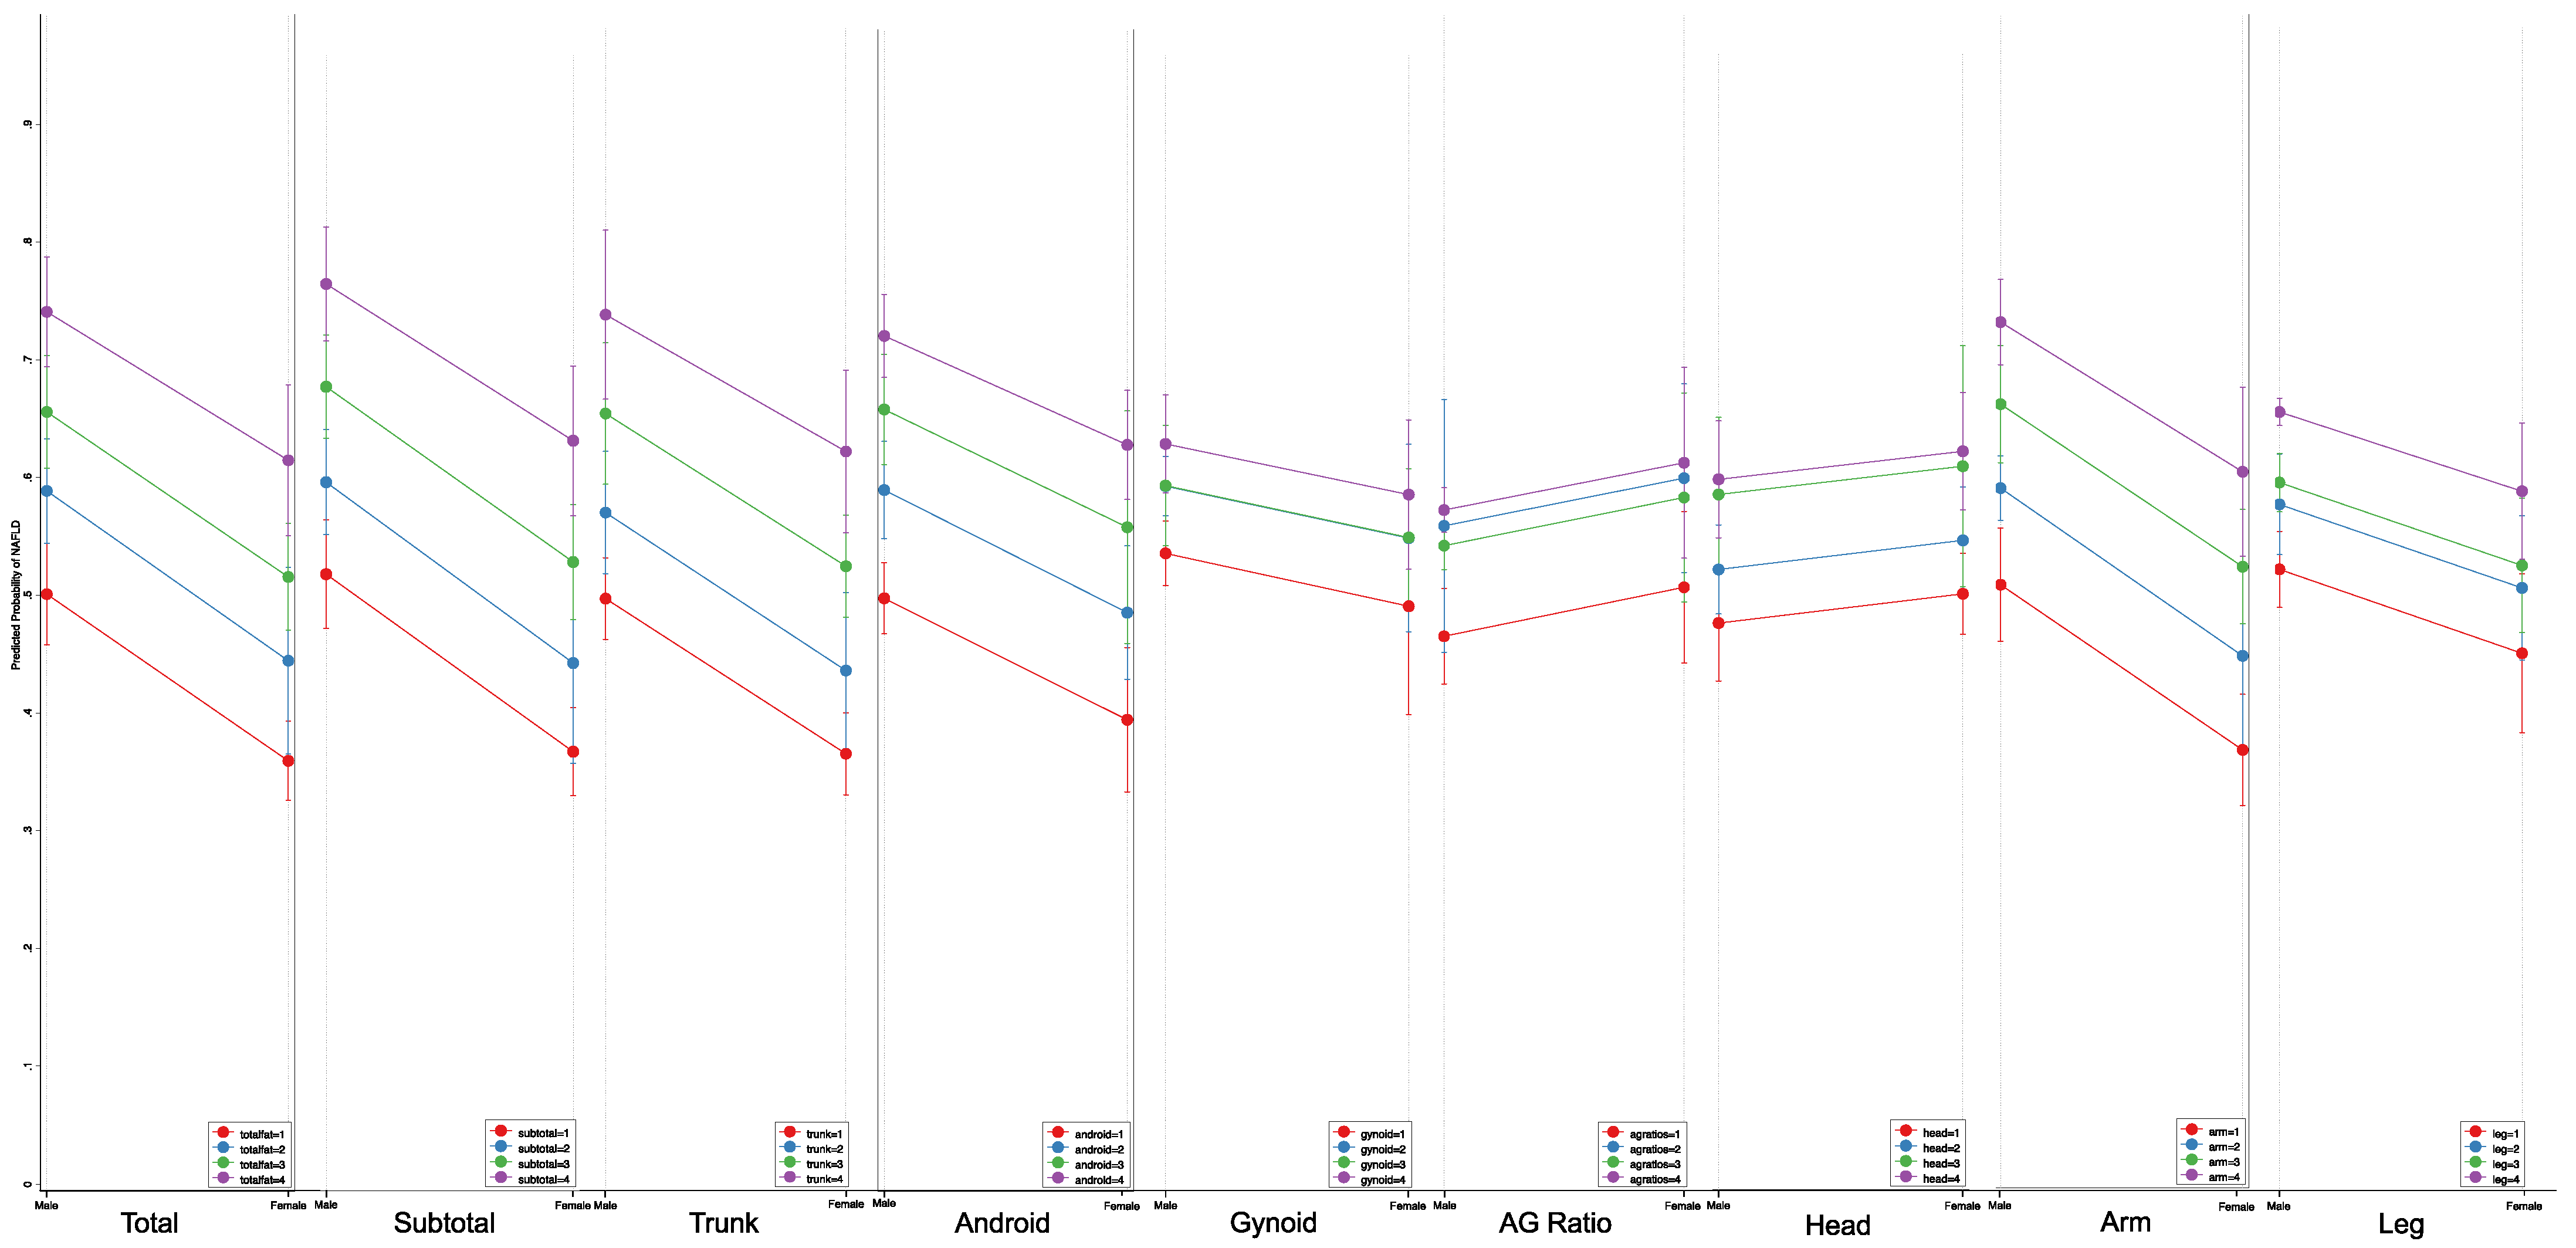
3.3. Risk of NALFD in Obese Individuals
4. Discussion
5. Limitations
6. Conclusions
Author Contributions
Funding
Institutional Review Board Statement
Informed Consent Statement
Data Availability Statement
Conflicts of Interest
References
- Sanyal, A.J. Past, present and future perspectives in nonalcoholic fatty liver disease. Nat. Rev. Gastroenterol. Hepatol. 2019, 16, 377–386. [Google Scholar] [CrossRef] [PubMed]
- Lim, G.E.H.; Tang, A.; Ng, C.H.; Chin, Y.H.; Lim, W.H.; Tan, D.J.H.; Yong, J.N.; Xiao, J.; Lee, C.W.-M.; Chan, M. An observational data meta-analysis on the differences in prevalence and risk factors between MAFLD vs NAFLD. Clin. Gastroenterol. Hepatol. 2021. [Google Scholar] [CrossRef] [PubMed]
- Le, M.H.; Yeo, Y.H.; Li, X.; Li, J.; Zou, B.; Wu, Y.; Ye, Q.; Huang, D.Q.; Zhao, C.; Zhang, J. 2019 global NAFLD prevalence-A systematic review and meta-analysis. Clin. Gastroenterol. Hepatol. 2021. [Google Scholar] [CrossRef] [PubMed]
- Ng, C.H.; Muthiah, M.D.; Xiao, J.; Chin, Y.H.; Lim, G.; Lim, W.H.; Tay, P.; Tan, D.J.H.; Yong, J.N.; Pan, X.H. Meta-analysis: Analysis of mechanistic pathways in the treatment of non-alcoholic steatohepatitis. Evidence from a Bayesian network meta-analysis. Aliment. Pharmacol. Ther. 2022, 55, 1076–1087. [Google Scholar] [CrossRef] [PubMed]
- Muthiah, M.D.; Cheng Han, N.; Sanyal, A.J. A clinical overview of non-alcoholic fatty liver disease: A guide to diagnosis, the clinical features, and complications—What the non-specialist needs to know. Diabetes Obes. Metab. 2022, 24, 3–14. [Google Scholar] [CrossRef]
- Toh, J.Z.K.; Pan, X.-H.; Tay, P.W.L.; Ng, C.H.; Yong, J.N.; Xiao, J.; Koh, J.H.; Tan, E.Y.; Tan, E.X.X.; Dan, Y.Y. A meta-analysis on the global prevalence, risk factors and screening of coronary heart disease in nonalcoholic fatty liver disease. Clin. Gastroenterol. Hepatol. 2021. [Google Scholar] [CrossRef]
- Shah, N.R.; Braverman, E.R. Measuring adiposity in patients: The utility of body mass index (BMI), percent body fat, and leptin. PLoS ONE 2012, 7, e33308. [Google Scholar] [CrossRef]
- Mulhall, B.P.; Ong, J.P.; Younossi, Z.M. Non-alcoholic fatty liver disease: An overview. J. Gastroenterol. Hepatol. 2002, 17, 1136–1143. [Google Scholar] [CrossRef]
- Consultation, W.E. Appropriate body-mass index for Asian populations and its implications for policy and intervention strategies. Lancet 2004, 363, 157–163. [Google Scholar]
- Younossi, Z.M.; Koenig, A.B.; Abdelatif, D.; Fazel, Y.; Henry, L.; Wymer, M. Global epidemiology of nonalcoholic fatty liver disease—Meta-analytic assessment of prevalence, incidence, and outcomes. Hepatology 2016, 64, 73–84. [Google Scholar] [CrossRef]
- Sookoian, S.; Pirola, C.J. Systematic review with meta-analysis: Risk factors for non-alcoholic fatty liver disease suggest a shared altered metabolic and cardiovascular profile between lean and obese patients. Aliment. Pharmacol. Ther. 2017, 46, 85–95. [Google Scholar] [CrossRef] [PubMed]
- Young, S.; Tariq, R.; Provenza, J.; Satapathy, S.K.; Faisal, K.; Choudhry, A.; Friedman, S.L.; Singal, A.K. Prevalence and profile of nonalcoholic fatty liver disease in lean adults: Systematic review and Meta-Analysis. Hepatol. Commun. 2020, 4, 953–972. [Google Scholar] [CrossRef] [PubMed]
- Ye, Q.; Zou, B.; Yeo, Y.H.; Li, J.; Huang, D.Q.; Wu, Y.; Yang, H.; Liu, C.; Kam, L.Y.; Tan, X.X.E. Global prevalence, incidence, and outcomes of non-obese or lean non-alcoholic fatty liver disease: A systematic review and meta-analysis. Lancet Gastroenterol. Hepatol. 2020, 5, 739–752. [Google Scholar] [CrossRef]
- Younossi, Z.M.; Stepanova, M.; Negro, F.; Hallaji, S.; Younossi, Y.; Lam, B.; Srishord, M. Nonalcoholic fatty liver disease in lean individuals in the United States. Medicine 2012, 91, 319–327. [Google Scholar] [CrossRef]
- Abenavoli, L.; Di Renzo, L.; De Lorenzo, A. Body composition and non-alcoholic fatty liver disease. J. Lifestyle Med. 2016, 6, 47. [Google Scholar] [CrossRef] [PubMed][Green Version]
- Milić, S.; Lulić, D.; Štimac, D. Non-alcoholic fatty liver disease and obesity: Biochemical, metabolic and clinical presentations. World J. Gastroenterol. 2014, 20, 9330. [Google Scholar]
- Curtin, L.R.; Mohadjer, L.K.; Dohrmann, S.M.; Montaquila, J.M.; Kruszan-Moran, D.; Mirel, L.B.; Carroll, M.D.; Hirsch, R.; Schober, S.; Johnson, C.L. The National Health and Nutrition Examination Survey: Sample Design, 1999–2006. Vital Health Stat. Ser. 2 Data Eval. Methods Res. 2012, 155, 1–39. [Google Scholar]
- National Center for Farmworker Health. National Health and Nutrition Examination Survey (NHANES) MEC Laboratory Procedures Manual. 2017. Available online: https://wwwn.cdc.gov/nchs/data/nhanes/2017-2018/manuals/2017_MEC_Laboratory_Procedures_Manual.pdf (accessed on 10 June 2022).
- Ando, Y.; Jou, J.H. Nonalcoholic Fatty Liver Disease and Recent Guideline Updates. Clin. Liver Dis. 2021, 17, 23–28. [Google Scholar] [CrossRef]
- Ruhl, C.; Everhart, J. Fatty liver indices in the multiethnic united states national health and nutrition examination survey. Aliment. Pharmacol. Ther. 2015, 41, 65–76. [Google Scholar] [CrossRef]
- Bedogni, G.; Bellentani, S.; Miglioli, L.; Masutti, F.; Passalacqua, M.; Castiglione, A.; Tiribelli, C. The Fatty Liver Index: A simple and accurate predictor of hepatic steatosis in the general population. BMC Gastroenterol. 2006, 6, 33. [Google Scholar] [CrossRef]
- Punthakee, Z.; Goldenberg, R.; Katz, P. Definition, Classification and Diagnosis of Diabetes, Prediabetes and Metabolic Syndrome. Can. J. Diabetes 2018, 42 (Suppl. S1), S10–S15. [Google Scholar] [CrossRef] [PubMed]
- Whelton, P.K.; Carey, R.M.; Aronow, W.S.; Casey, D.E.; Collins, K.J.; Himmelfarb, C.D.; DePalma, S.M.; Gidding, S.; Jamerson, K.A.; Jones, D.W.; et al. 2017 ACC/AHA/AAPA/ABC/ACPM/AGS/APhA/ASH/ASPC/NMA/PCNA Guideline for the Prevention, Detection, Evaluation, and Management of High Blood Pressure in Adults: A Report of the American College of Cardiology/American Heart Association Task Force on Clinical Practice Guidelines. Hypertension 2018, 71, e13–e115. [Google Scholar] [CrossRef] [PubMed]
- Centers for Disease Control and Prevention. National Health and Nutrition Examination Survey. 2011–2012 Data Documentation, Codebook, and Frequencies. 2011. Available online: https://wwwn.cdc.gov/nchs/data/nhanes/2011-2012/manuals/Body_Composition_Procedures_Manual.pdf (accessed on 15 May 2022).
- Ariya, M.; Koohpayeh, F.; Ghaemi, A.; Osati, S.; Davoodi, S.H.; Razzaz, J.M.; Javedan, G.; Ehrampoush, E.; Homayounfar, R. Assessment of the association between body composition and risk of non-alcoholic fatty liver. PLoS ONE 2021, 16, e0249223. [Google Scholar] [CrossRef]
- Sari, C.I.; Eikelis, N.; Head, G.A.; Schlaich, M.; Meikle, P.; Lambert, G.; Lambert, E. Android fat deposition and its association with cardiovascular risk factors in overweight young males. Front. Physiol. 2019, 10, 1162. [Google Scholar] [CrossRef]
- Bouchi, R.; Fukuda, T.; Takeuchi, T.; Nakano, Y.; Murakami, M.; Minami, I.; Izumiyama, H.; Hashimoto, K.; Yoshimoto, T.; Ogawa, Y. Gender difference in the impact of gynoid and android fat masses on the progression of hepatic steatosis in Japanese patients with type 2 diabetes. BMC Obes. 2017, 4, 27. [Google Scholar] [CrossRef]
- Ciardullo, S.; Oltolini, A.; Cannistraci, R.; Muraca, E.; Perseghin, G. Sex-related association of nonalcoholic fatty liver disease and liver fibrosis with body fat distribution in the general US population. Am. J. Clin. Nutr. 2022, 115, 1528–1534. [Google Scholar] [CrossRef] [PubMed]
- Sierra-Johnson, J.; Johnson, B.D.; Bailey, K.R.; Turner, S.T. Relationships between insulin sensitivity and measures of body fat in asymptomatic men and women. Obes. Res. 2004, 12, 2070–2077. [Google Scholar] [CrossRef]
- Wang, X.-c.; Liu, H.; Huang, Y.-y.; Sun, H.; Bu, L.; Qu, S. Head fat is a novel method of measuring metabolic disorder in Chinese obese patients. Lipids Health Dis. 2014, 13, 113. [Google Scholar] [CrossRef]
- Nah, B.K.Y.; Ng, C.H.; Chan, K.E.; Tan, C.; Aggarwal, M.; Zeng, R.W.; Xiao, J.; Chin, Y.H.; Tan, E.X.; Ren, Y.P. Historical Changes in Weight Classes and the Influence of NAFLD Prevalence: A Population Analysis of 34,486 Individuals. Int. J. Environ. Res. Public Health 2022, 19, 9935. [Google Scholar] [CrossRef]
- Tang, A.; Ng, C.H.; Phang, P.H.; Chan, K.E.; Chin, Y.H.; Fu, C.E.; Zeng, R.W.; Xiao, J.; Tan, D.J.H.; Quek, J. Comparative Burden of Metabolic Dysfunction in Lean NAFLD vs. Non-Lean NAFLD-A Systematic Review and Meta-Analysis. Clin. Gastroenterol. Hepatol. 2022. [Google Scholar] [CrossRef]
- Linge, J.; Borga, M.; West, J.; Tuthill, T.; Miller, M.R.; Dumitriu, A.; Thomas, E.L.; Romu, T.; Tunón, P.; Bell, J.D. Body composition profiling in the UK Biobank Imaging Study. Obesity 2018, 26, 1785–1795. [Google Scholar] [CrossRef] [PubMed]


| NAFLD | Non-NAFLD | p-Value | |
|---|---|---|---|
| Sample Size | 1347 | 10,474 | <0.01 * |
| Age (years) | 58.00 (IQR: 44.00 to 68.00) | 44.00 (IQR: 29.00 to 62.00) | <0.01 * |
| Gender (male) | 65.40 (95%CI: 62.82 to 67.90) | 49.23 (95%CI: 48.28 to 50.19) | <0.01 * |
| Platelet (1000 cells/μL) | 230.00 (IQR: 195.00 to 264.00) | 228.00 (IQR: 195.00 to 265.00) | 0.81 |
| Glycohemoglobin (%) | 5.70 (IQR: 5.40 to 6.10) | 5.40 (IQR: 5.20 to 5.70) | <0.01 * |
| Fasting Glucose (mmol/L) | 5.94 (IQR: 5.50 to 6.72) | 5.44 (IQR: 5.05 to 5.88) | <0.01 * |
| Total Bilirubin (μmol/L) | 10.26 (IQR: 6.84 to 13.68) | 10.26 (IQR: 6.84 to 13.68) | 0.92 |
| AST (IU/L) | 25.00 (IQR: 21.00 to 30.00) | 21.00 (IQR: 18.00 to 25.00) | <0.01 * |
| ALT (IU/L) | 28.00 (IQR: 21.00 to 38.00) | 18.00 (IQR: 14.00 to 24.00) | <0.01 * |
| LDL (mg/dL) | 120.00 (IQR: 94.50 to 146.00) | 105.00 (IQR: 84.00 to 129.00) | <0.01 * |
| HDL (mg/dL) | 45.00 (IQR: 38.00 to 53.00) | 55.00 (IQR: 46.00 to 66.00) | <0.01 * |
| Total Cholesterol (mg/dL) | 202.00 (IQR: 178.00 to 232.00) | 182.00 (IQR: 157.00 to 210.00) | <0.01 * |
| Triglyceride (mg/dL) | 208.00 (IQR: 143.00 to 294.00) | 97.00 (IQR: 67.00 to 143.00) | <0.01 * |
| Diabetes | 23.40 (95%CI: 21.18 to 25.78) | 9.91 (95%CI: 9.34 to 10.50) | <0.01 * |
| Hypertension | 60.06 (95%CI: 57.36 to 62.71) | 37.20 (95%CI: 36.25 to 38.16) | <0.01 * |
| Total Fat (%) | 29.90 (IQR: 26.80 to 36.55) | 29.10 (IQR: 23.60 to 35.80) | <0.01 * |
| Subtotal Fat (%) | 30.20 (IQR: 27.00 to 37.50) | 29.60 (IQR: 23.60 to 36.80) | <0.01 * |
| Android Fat (%) | 36.30 (IQR: 32.50 to 40.40) | 30.90 (IQR: 24.40 to 36.70) | <0.01 * |
| Head Fat (%) | 24.20 (IQR: 23.90 to 24.50) | 23.80 (IQR: 23.50 to 24.10) | <0.01 * |
| Trunk Fat (%) | 31.10 (IQR: 27.90 to 36.60) | 27.40 (IQR: 21.70 to 33.50) | <0.01 * |
| Average Arm Fat (%) | 27.55 (IQR: 24.05 to 38.25) | 28.30 (IQR: 21.20 to 38.60) | <0.01 * |
| Average Leg Fat (%) | 29.45 (IQR: 25.85 to 37.20) | 32.55 (IQR: 24.60 to 40.75) | <0.01 * |
| Gynoid Fat (%) | 30.90 (IQR: 27.70 to 37.60) | 33.30 (IQR: 26.30 to 40.60) | 0.13 |
| Ethnicity | <0.01 * | ||
| Mexican American | 20.71 (95%CI: 18.63 to 22.96) | 11.86 (95%CI: 11.25 to 12.49) | |
| Hispanic | 12.18 (95%CI: 10.53 to 14.03) | 10.61 (95%CI: 10.03 to 11.21) | |
| White | 42.61 (95%CI: 40.00 to 45.27) | 37.77 (95%CI: 36.85 to 38.70) | |
| Black | 13.07 (95%CI: 11.37 to 14.97) | 19.58 (95%CI: 18.83 to 20.35) | |
| Other Race | 11.43 (95%CI: 9.84 to 13.25) | 20.18 (95%CI: 19.43 to 20.96) |
| % Total Fat | % Subtotal Fat | % Trunk Fat | % Android Fat | % Gynoid Fat | % Head Fat | % Average Arm Fat | % Average Leg Fat | |
|---|---|---|---|---|---|---|---|---|
| Females | Both Genders | Males | ||||||
| % Total Fat | 1.00 | 0.97 | 0.77 | - | 0.69 | 0.22 | 0.72 | 0.68 |
| % Subtotal Fat | 0.98 | 1.00 | 0.76 | - | 0.71 | 0.22 | 0.72 | 0.69 |
| % Trunk Fat | 0.73 | 0.73 | 1.00 | - | 0.48 | 0.26 | 0.55 | 0.41 |
| % Android Fat | 0.58 | 0.58 | 0.72 | 1.00 | - | - | - | - |
| % Gynoid Fat | 0.67 | 0.67 | 0.41 | 0.37 | 1.00 | 0.09 | 0.59 | 0.59 |
| % Head Fat | −0.06 | −0.06 | −0.04 | −0.06 | −0.13 | 1.00 | 0.22 | 0.11 |
| % Average Arm Fat | 0.64 | 0.64 | 0.50 | 0.37 | 0.40 | −0.05 | 1.00 | 0.58 |
| % Average Leg Fat | 0.69 | 0.68 | 0.37 | 0.33 | 0.78 | −0.09 | 0.44 | 1.00 |
| Quartile for Body Fat | ||||||
|---|---|---|---|---|---|---|
| Q1 | Q2 | Q3 | Q4 | p for Trend | Each SD Increment | |
| % Total Fat | <0.001 * | |||||
| OR (95% CI) | Reference | 3.89 (3.18 to 4.75) | 6.83 (5.89 to 7.93) | 19.03 (13.78 to 26.27) | 4.03 (3.51 to 4.60) | |
| Male [Margin (95%CI)] | 6.32 (5.67 to 6.97) | 19.60 (16.87 to 22.33) | 29.04 (26.45 to 31.63) | 50.80 (45.38 to 56.21) | ||
| Female [Margin (95%CI)] | 0.65 (0.42 to 0.88) | 2.46 (1.47 to 3.44) | 4.20 (3.09 to 5.31) | 10.54 (8.05 to 13.02) | ||
| % Subtotal Fat | <0.001 * | |||||
| OR (95% CI) | Reference | 3.84 (3.20 to 4.60) | 6.14 (4.85 to 7.77) | 16.99 (10.99 to 26.28) | 4.03 (3.52 to 4.61) | |
| Male [Margin (95%CI)] | 6.41 (5.63 to 7.00) | 19.65 (17.03 to 22.26) | 27.37 (24.03 to 30.72) | 48.62 (41.14 to 56.11) | ||
| Female [Margin (95%CI)] | 0.72 (0.43 to 0.99) | 2.66 (1.54 to 3.77) | 4.16 (2.93 to 5.38) | 10.38 (7.88 to 12.87) | ||
| % Trunk Fat | <0.001 * | |||||
| OR (95% CI) | Reference | 7.47 (5.66 to 9.86) | 13.72 (10.37 to 18.15) | 46.61 (33.55 to 64.76) | 4.89 (4.54 to 5.27) | |
| Male [Margin (95%CI)] | 3.10 (2.18 to 4.02) | 18.63 (15.97 to 21.28) | 29.05 (24.14 to 33.96) | 56.57 (53.37 to 59.75) | ||
| Female [Margin (95%CI)] | 0.34 (0.17 to 0.50) | 2.45 (1.74 to 3.16) | 4.39 (2.53 to 6.25) | 13.21 (10.11 to 16.30) | ||
| % Android Fat | <0.001 * | |||||
| OR (95% CI) | Reference | 7.16 (4.64 to 11.05) | 15.96 (11.09 to 22.98) | 31.12 (23.80 to 40.68) | 3.96 (3.66 to 4.28) | |
| Male [Margin (95%CI)] | 2.80 (1.60 to 4.00) | 16.51 (14.38 to 18.63) | 29.81 (28.59 to 31.03) | 44.35 (41.20 to 47.49) | ||
| Female [Margin (95%CI)] | 0.47 (0.17 to 0.76) | 3.22 (2.50 to 3.93) | 6.83 (4.95 to 8.70) | 12.31 (8.34 to 16.28) | ||
| Android-to-Gynoid Fat Ratio | <0.001 * | |||||
| OR (95% CI) | Reference | 2.28 (2.06 to 2.53) | 3.30 (2.75 to 3.95) | 3.85 (2.59 to 5.73) | - | |
| Male [Margin (95%CI)] | 7.50 (7.35 to 7.65) | 14.87 (13.67 to 16.07) | 19.58 (17.22 to 21.95) | 19.58 (15.69 to 28.09) | ||
| Female [Margin (95%CI)] | 1.71 (1.24 to 2.18) | 3.76 (2.43 to 5.08) | 5.26 (3.26 to 7.27) | 6.06 (4.15 to 7.97) | ||
| % Gynoid Fat | <0.001 * | |||||
| OR (95% CI) | Reference | 2.41 (2.10 to 2.76) | 3.27 (2.08 to 5.14) | 3.83 (1.90 to 7.73) | 2.16 (1.86 to 2.51) | |
| Male [Margin (95%CI)] | 8.81 (7.52 to 10.09) | 17.93 (16.95 to 18.90) | 22.33 (15.90 to 28.75) | 24.89 (15.74 to 34.03) | ||
| Female [Margin (95%CI)] | 1.80 (1.13 to 2.46) | 4.16 (3.08 to 5.23) | 5.49 (2.89 to 8.09) | 6.34 (3.75 to 8.91) | ||
| % Head Fat | <0.001 * | |||||
| OR (95% CI) | Reference | 2.37 (1.99 to 2.82) | 4.09 (3.46 to 4.84) | 6.26 (6.02 to 6.51) | 1.93 (1.86 to 2.00) | |
| Male [Margin (95%CI)] | 4.64 (4.31 to 4.97) | 10.07 (9.00 to 11.13) | 15.86 (14.49 to 17.20) | 21.89 (20.12 to 23.60) | ||
| Female [Margin (95%CI)] | 2.63 (2.03 to 3.24) | 5.92 (4.39 to 7.44) | 9.66 (8.50 to 10.80) | 13.81 (10.82 to 16.79) | ||
| % Average Arm Fat | <0.001 * | |||||
| OR (95% CI) | Reference | 3.17 (2.56 to 3.93) | 4.65 (3.20 to 6.75) | 11.72 (6.12 to 22.45) | 3.82 (3.51 to 4.16) | |
| Male [Margin (95%CI)] | 7.47 (7.03 to 7.90) | 19.31 (16.73 to 21.88) | 25.36 (19.09 to 31.62) | 43.90 (30.14 to 57.65) | ||
| Female [Margin (95%CI)] | 0.92 (0.53 to 1.30) | 2.82 (1.27 to 4.36) | 4.05 (3.43 to 4.66) | 9.34 (6.12 to 12.55) | ||
| % Average Leg Fat | <0.001 * | |||||
| OR (95% CI) | Reference | 2.19 (1.75 to 2.74) | 2.58 (1.62 to 4.12) | 3.19 (1.85 to 5.49) | 1.86 (1.58 to 2.17) | |
| Male [Margin (95%CI)] | 9.00 (8.07 to 9.92) | 16.93 (14.65 to 19.20) | 19.15 (14.07 to 24.22) | 22.25 (15.75 to 28.74) | ||
| Female [Margin (95%CI)] | 2.19 (1.30 to 3.07) | 4.57 (2.63 to 6.51) | 5.32 (3.91 to 6.73) | 6.43 (4.30 to 8.55) | ||
| % Total Fat | % Subtotal Fat | % Trunk Fat | % Android Fat | % Gynoid Fat | % Head Fat | % Average Arm Fat | % Average Leg Fat | |
|---|---|---|---|---|---|---|---|---|
| Females | Both Genders | Males | ||||||
| % Total Fat | 1.00 | 0.97 | 0.83 | 0.77 | 0.73 | 0.37 | 0.77 | 0.72 |
| % Subtotal Fat | 0.98 | 1.00 | 0.83 | 0.77 | 0.73 | 0.36 | 0.77 | 0.72 |
| % Trunk Fat | 0.73 | 0.72 | 1.00 | 0.82 | 0.56 | 0.42 | 0.68 | 0.52 |
| % Android Fat | 0.60 | 0.60 | 0.73 | 1.00 | 0.56 | 0.38 | 0.63 | 0.53 |
| % Gynoid Fat | 0.65 | 0.66 | 0.41 | 0.37 | 1.00 | 0.21 | 0.59 | 0.82 |
| % Head Fat | 0.17 | 0.16 | 0.24 | 0.19 | 0.00 | 1.00 | 0.36 | 0.21 |
| % Average Arm Fat | 0.63 | 0.63 | 0.52 | 0.41 | 0.37 | 0.19 | 1.00 | 0.58 |
| % Average Leg Fat | 0.65 | 0.66 | 0.35 | 0.32 | 0.79 | 0.01 | 0.39 | 1.00 |
| Quartile for Body Fat | ||||||
|---|---|---|---|---|---|---|
| Q1 | Q2 | Q3 | Q4 | p for Trend | Each SD Increment | |
| % Total Fat | <0.001 * | |||||
| OR (95% CI) | Reference | 1.43 (1.20 to 1.72) | 1.92 (1.72 to 2.14) | 2.90 (2.50 to 3.36) | 1.51 (1.49 to 1.54) | |
| Male [Margin (95%CI)] | 50.10 (54.53 to 63.31) | 58.87 (54.43 to 63.31) | 65.57 (60.80 to 70.35) | 74.08 (69.40 to 78.76) | ||
| Female [Margin (95%CI)] | 35.93 (36.49 to 52.38) | 44.44 (36.49 to 52.38) | 51.55 (47.02 to 56.09) | 61.47 (55.04 to 67.89) | ||
| % Subtotal Fat | <0.001 * | |||||
| OR (95% CI) | Reference | 1.37 (1.14 to 1.65) | 1.93 (1.75 to 2.13) | 2.93 (2.59 to 3.33) | 1.51 (1.48 to 1.54) | |
| Male [Margin (95%CI)] | 50.61 (46.10 to 55.12) | 58.25 (53.88 to 62.61) | 66.17 (61.88 to 70.45) | 74.71 (69.97 to 79.44) | ||
| Female [Margin (95%CI)] | 35.86 (32.21 to 39.51) | 43.22 (34.87 to 51.57) | 51.62 (46.84 to 56.39) | 61.69 (55.48 to 67.89) | ||
| % Trunk Fat | <0.001 * | |||||
| OR (95% CI) | Reference | 1.35 (1.06 to 1.72) | 1.94 (1.60 to 2.36) | 2.93 (2.07 to 4.15) | 1.49 (1.39 to 1.59) | |
| Male [Margin (95%CI)] | 49.89 (46.40 to 53.38) | 57.23 (52.01 to 62.45) | 65.69 (59.66 to 71.72) | 74.13 (66.92 to 81.34) | ||
| Female [Margin (95%CI)] | 36.64 (33.15 to 40.14) | 43.74 (37.10 to 50.39) | 52.65 (48.31 to 57.00) | 62.45 (55.51 to 69.39) | ||
| % Android Fat | <0.001 * | |||||
| OR (95% CI) | Reference | 1.45 (1.24 to 1.70) | 1.95 (1.65 to 2.32) | 2.62 (2.46 to 2.78) | 1.41 (1.34 to 1.47) | |
| Male [Margin (95%CI)] | 49.45 (46.44 to 52.46) | 58.58 (54.49 to 62.68) | 65.39 (60.74 to 70.05) | 71.60 (68.09 to 75.11) | ||
| Female [Margin (95%CI)] | 39.19 (33.09 to 45.29) | 48.24 (42.60 to 53.88) | 55.35 (45.62 to 65.28) | 62.40 (57.80 to 67.01) | ||
| % Gynoid Fat | <0.001 * | |||||
| OR (95% CI) | Reference | 1.26 (1.14 to 1.41) | 1.27 (1.11 to 1.45) | 1.47 (1.32 to 1.64) | 1.27 (1.25 to 1.29) | |
| Male [Margin (95%CI)] | 53.18 (50.46 to 55.89) | 58.85 (56.33 to 61.37) | 58.90 (53.83 to 63.96) | 62.41 (58.27 to 66.55) | ||
| Female [Margin (95%CI)] | 48.71 (39.58 to 57.85) | 54.47 (46.56 to 62.32) | 54.51 (48.70 to 60.32) | 58.13 (51.83 to 64.43) | ||
| Android-to-Gynoid Fat Ratio | <0.001 * | |||||
| OR (95% CI) | Reference | 1.25 (1.16 to 1.35) | 1.35 (1.22 to 1.50) | 1.76 (1.61 to 1.92) | - | |
| Male [Margin (95%CI)] | 51.92 (48.70 to 55.13) | 57.41 (53.16 to 61.67) | 59.26 (56.79 to 61.74) | 65.23 (64.08 to 66.39) | ||
| Female [Margin (95%CI)] | 44.82 (38.12 to 51.52) | 50.35 (44.27 to 56.43) | 52.25 (46.56 to 57.94) | 58.52 (52.76 to 64.29) | ||
| % Head Fat | <0.001 * | |||||
| OR (95% CI) | Reference | 1.20 (1.14 to 1.27) | 1.56 (1.14 to 2.12) | 1.64 (1.53 to 1.77) | 1.21 (1.16 to 1.25) | |
| Male [Margin (95%CI)] | 47.00 (32.14 to 51.87) | 51.51 (47.77 to 55.24) | 57.80 (51.32 to 64.29) | 59.08 (54.16 to 63.99) | ||
| Female [Margin (95%CI)] | 49.46 (46.05 to 52.86) | 53.95 (49.48 to 58.42) | 60.18 (50.08 to 70.28) | 61.43 (56.51 to 66.36) | ||
| % Average Arm Fat | <0.001 * | |||||
| OR (95% CI) | Reference | 1.40 (1.17 to 1.68) | 1.91 (1.78 to 2.05) | 2.66 (2.23 to 3.18) | 1.50 (1.41 to 1.59) | |
| Male [Margin (95%CI)] | 50.55 (45.76 to 55.35) | 58.75 (56.02 to 61.47) | 65.86 (60.90 to 70.83) | 72.82 (69.20 to 76.43) | ||
| Female [Margin (95%CI)] | 36.55 (31.84 to 41.26) | 44.52 (36.91 to 52.13) | 52.08 (47.23 to 56.93) | 60.13 (52.97 to 67.29) | ||
| % Average Leg Fat | <0.001 * | |||||
| OR (95% CI) | Reference | 1.25 (1.16 to 1.35) | 1.35 (1.22 to 1.50) | 1.76 (1.61 to 1.92) | 1.30 (1.28 to 1.33) | |
| Male [Margin (95%CI)] | 51.92 (48.70 to 55.13) | 57.41 (53.16 to 61.67) | 59.26 (56.79 to 61.74) | 65.23 (64.08 to 66.39) | ||
| Female [Margin (95%CI)] | 44.82 (38.12 to 51.52) | 50.35 (44.27 to 56.43) | 52.25 (46.56 to 57.94) | 58.52 (52.76 to 64.87) | ||
Publisher’s Note: MDPI stays neutral with regard to jurisdictional claims in published maps and institutional affiliations. |
© 2022 by the authors. Licensee MDPI, Basel, Switzerland. This article is an open access article distributed under the terms and conditions of the Creative Commons Attribution (CC BY) license (https://creativecommons.org/licenses/by/4.0/).
Share and Cite
Tan, C.; Chan, K.E.; Ng, C.H.; Tseng, M.; Syn, N.; Tang, A.S.P.; Chin, Y.H.; Lim, W.H.; Tan, D.J.H.; Chew, N.; et al. DEXA Scan Body Fat Mass Distribution in Obese and Non-Obese Individuals and Risk of NAFLD—Analysis of 10,865 Individuals. J. Clin. Med. 2022, 11, 6205. https://doi.org/10.3390/jcm11206205
Tan C, Chan KE, Ng CH, Tseng M, Syn N, Tang ASP, Chin YH, Lim WH, Tan DJH, Chew N, et al. DEXA Scan Body Fat Mass Distribution in Obese and Non-Obese Individuals and Risk of NAFLD—Analysis of 10,865 Individuals. Journal of Clinical Medicine. 2022; 11(20):6205. https://doi.org/10.3390/jcm11206205
Chicago/Turabian StyleTan, Caitlyn, Kai En Chan, Cheng Han Ng, Michael Tseng, Nicholas Syn, Ansel Shao Pin Tang, Yip Han Chin, Wen Hui Lim, Darren Jun Hao Tan, Nicholas Chew, and et al. 2022. "DEXA Scan Body Fat Mass Distribution in Obese and Non-Obese Individuals and Risk of NAFLD—Analysis of 10,865 Individuals" Journal of Clinical Medicine 11, no. 20: 6205. https://doi.org/10.3390/jcm11206205
APA StyleTan, C., Chan, K. E., Ng, C. H., Tseng, M., Syn, N., Tang, A. S. P., Chin, Y. H., Lim, W. H., Tan, D. J. H., Chew, N., Ong, E. Y. H., Koh, T. K., Xiao, J., Chee, D., Valsan, A., Siddiqui, M. S., Huang, D., Noureddin, M., Wijarnpreecha, K., & Muthiah, M. D. (2022). DEXA Scan Body Fat Mass Distribution in Obese and Non-Obese Individuals and Risk of NAFLD—Analysis of 10,865 Individuals. Journal of Clinical Medicine, 11(20), 6205. https://doi.org/10.3390/jcm11206205