


Increased Macrophage-like Cell Density in Retinal Vein Occlusion as Characterized by en Face Optical Coherence Tomography


Abstract
1. Introduction
2. Materials and Methods
2.1. Subjects
2.2. OCTA Image Acquisition
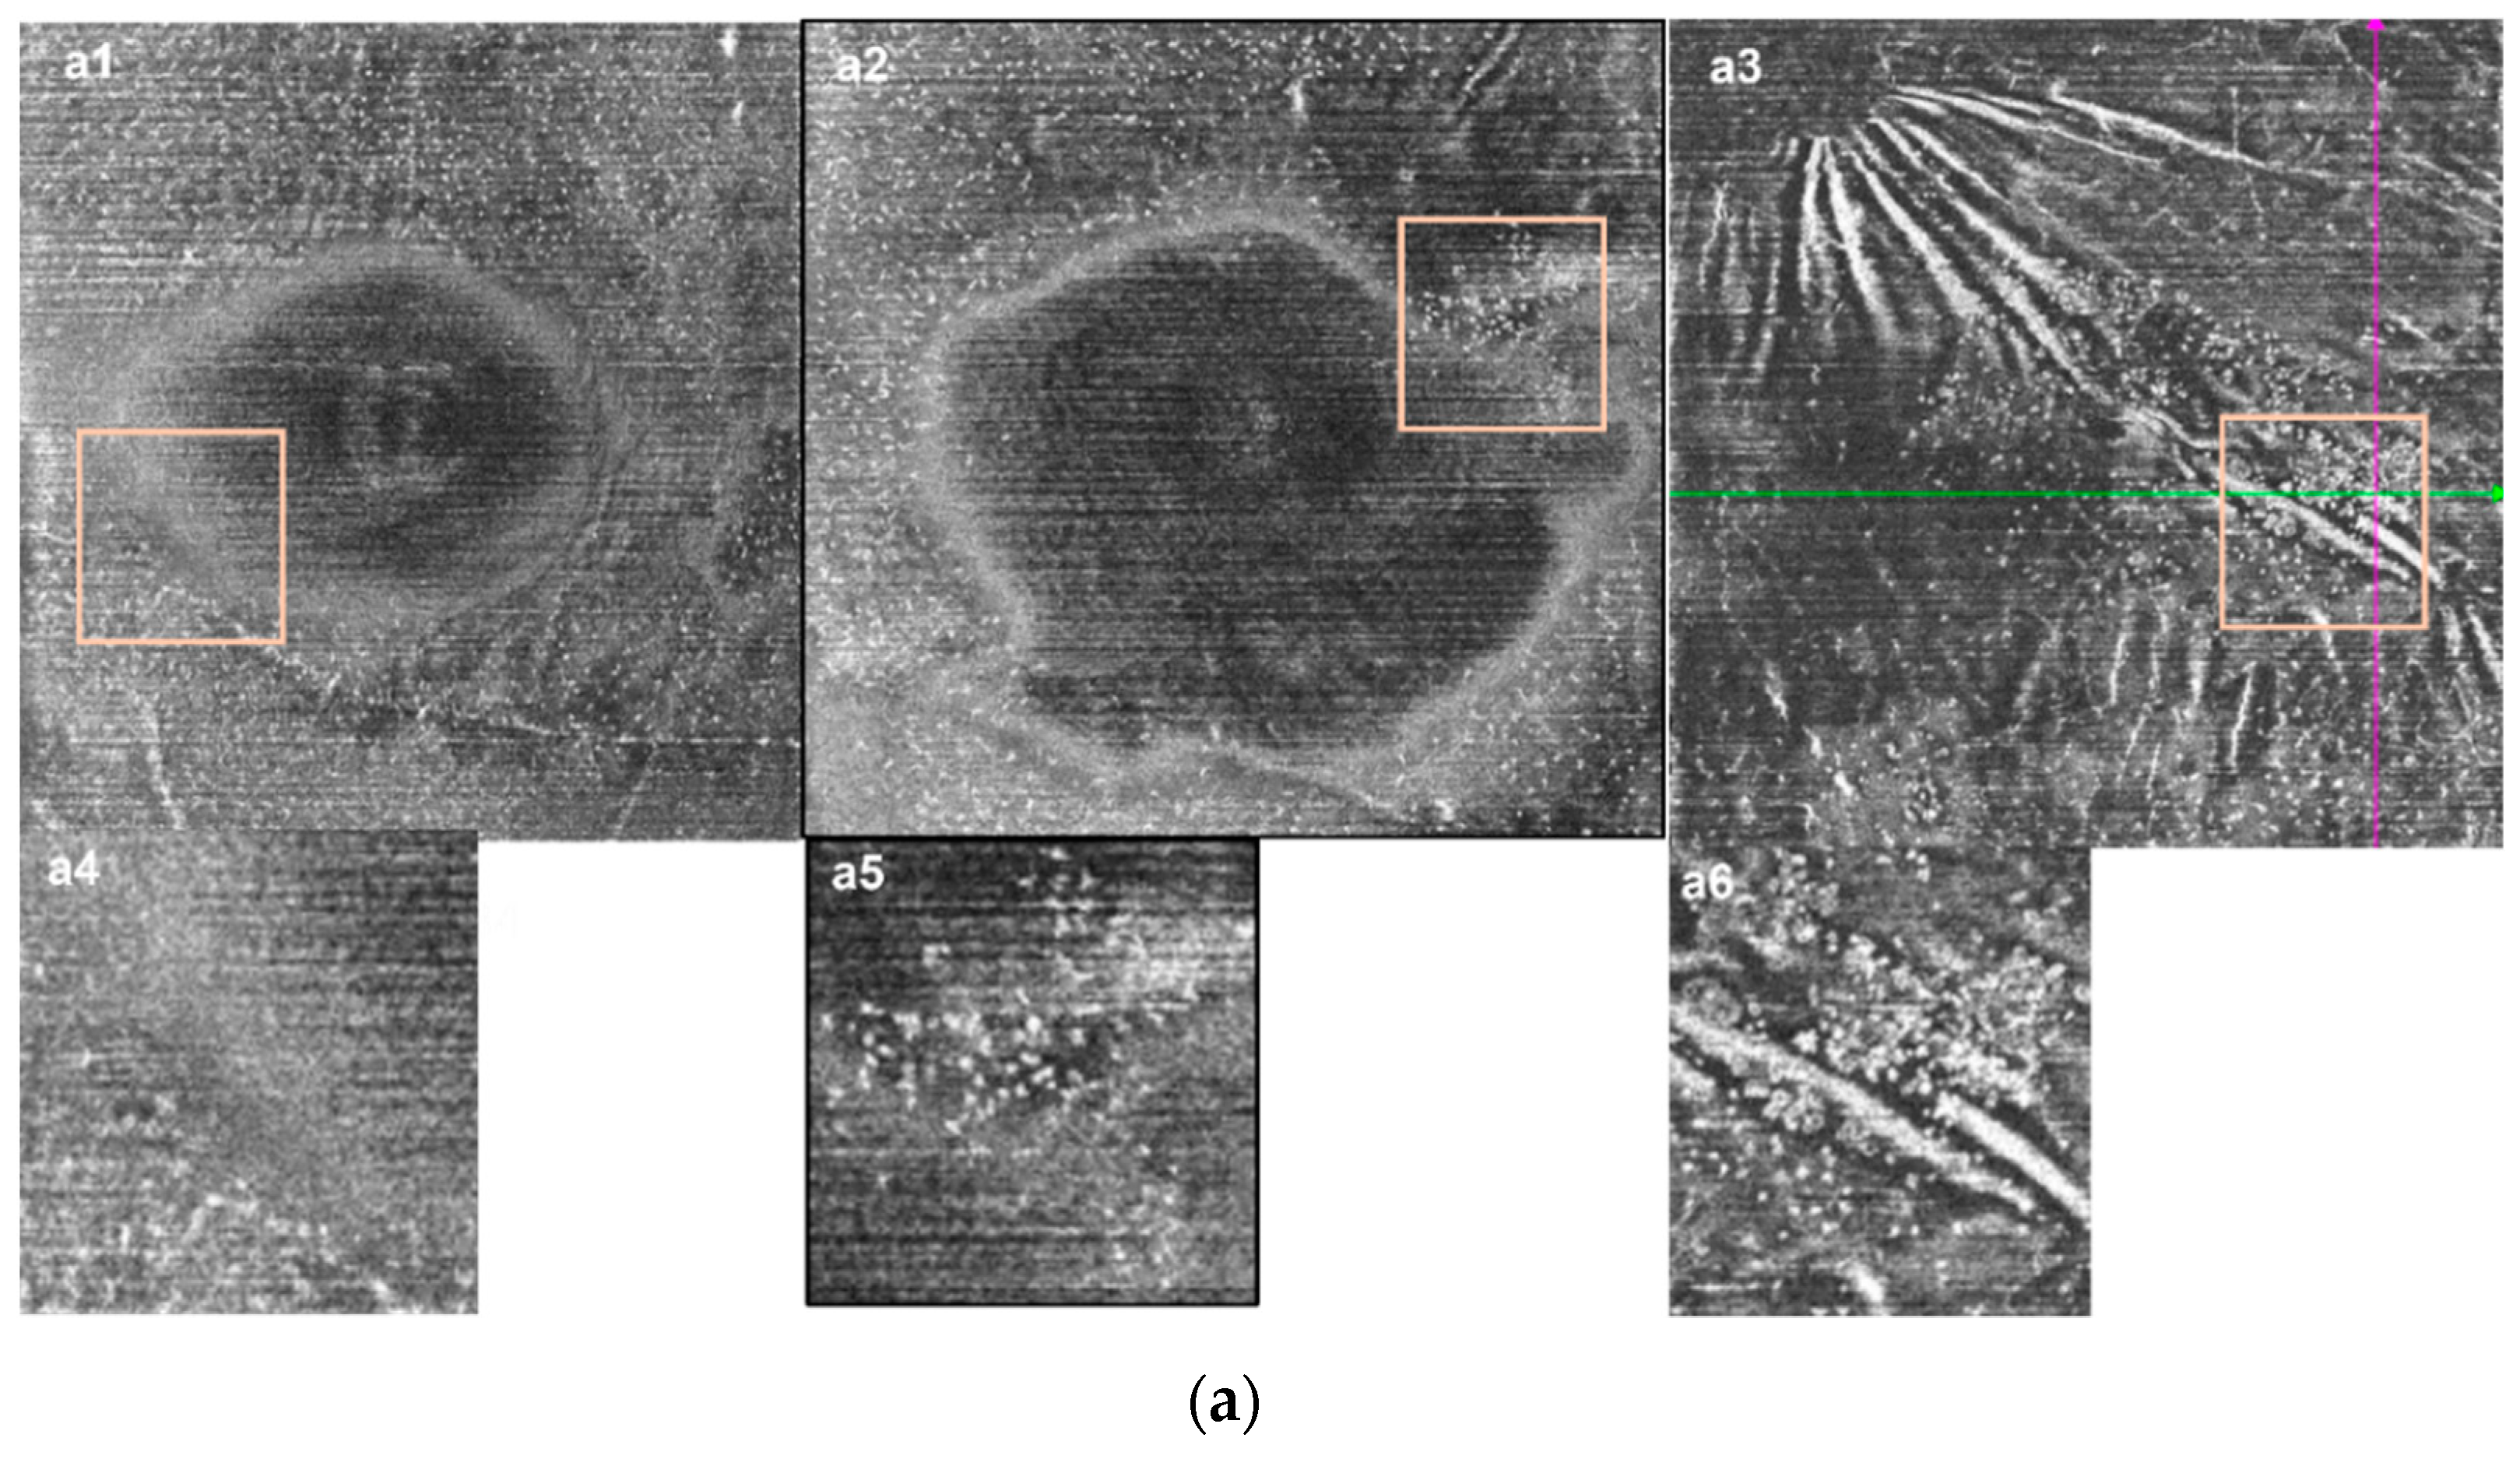
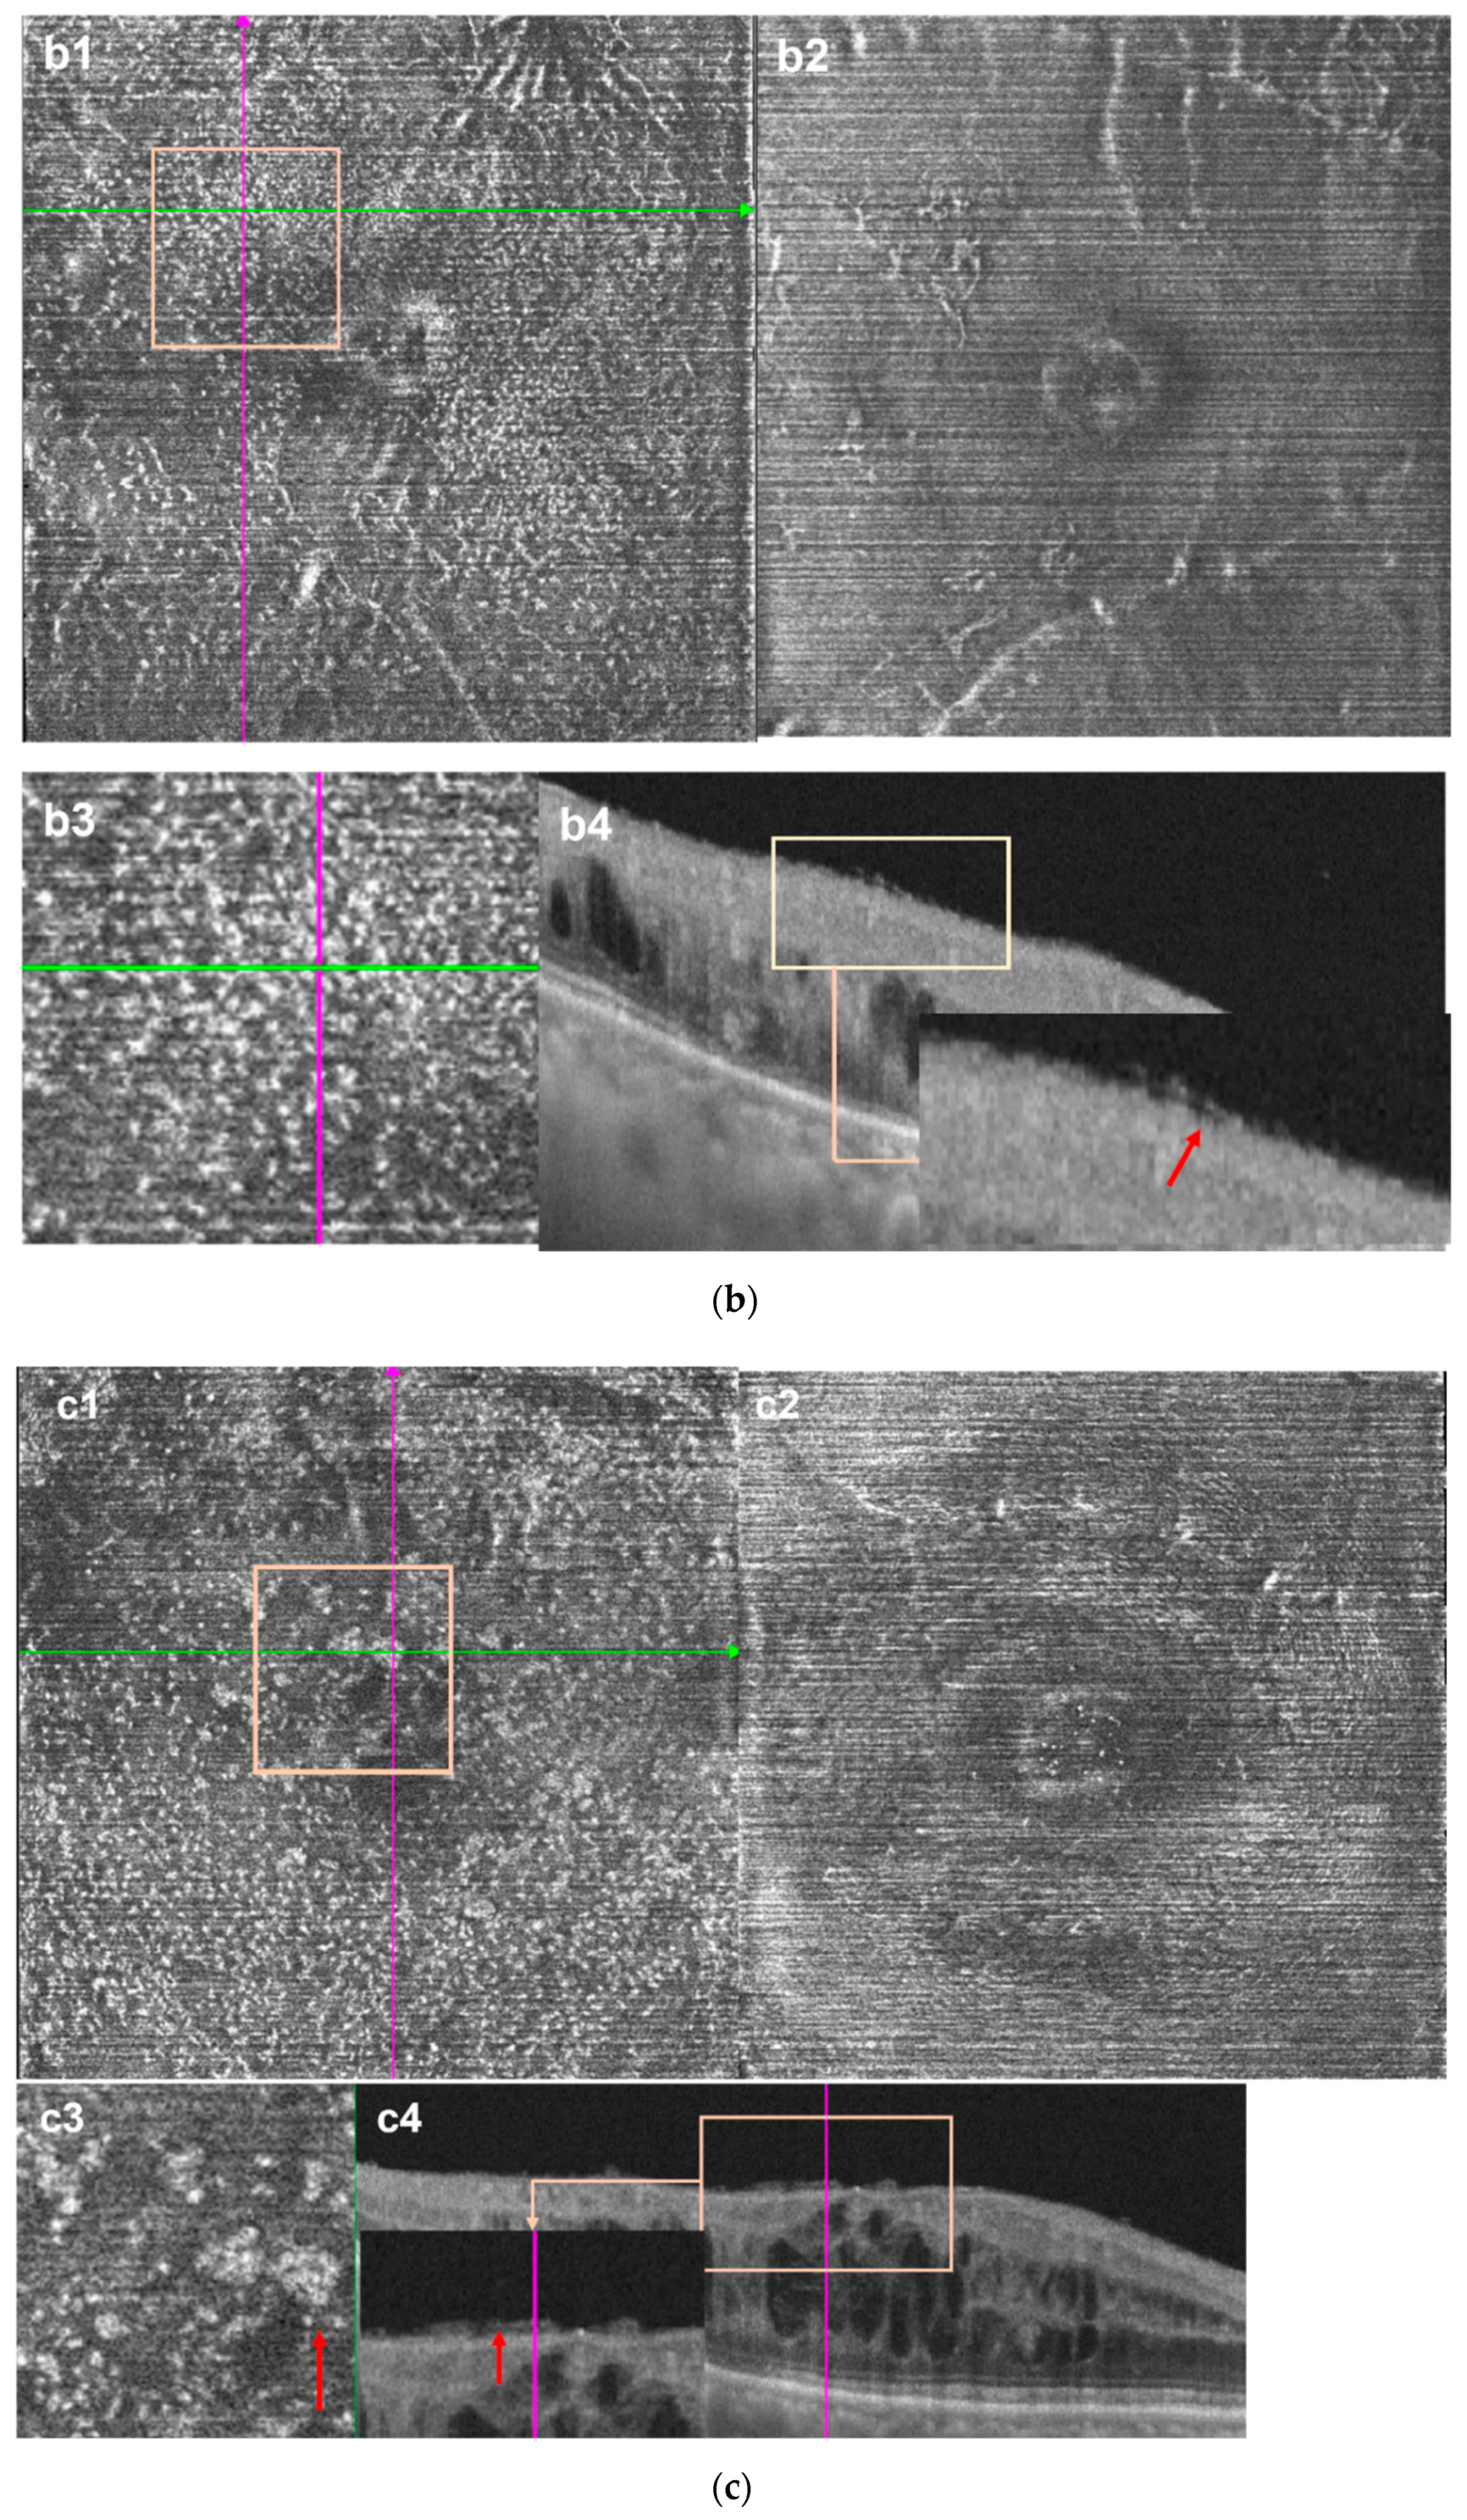
2.3. Image Processing
2.4. Retinal Parameters Acquisition
2.5. Statistics
3. Results
4. Discussion
Author Contributions
Funding
Institutional Review Board Statement
Informed Consent Statement
Data Availability Statement
Acknowledgments
Conflicts of Interest
References
- Klein, R.; Klein, B.E.; Moss, S.E.; Meuer, S.M. The epidemiology of retinal vein occlusion: The Beaver Dam Eye Study. Trans. Am. Ophthalmol. Soc. 2000, 98, 133–143. [Google Scholar] [PubMed]
- Jaulim, A.; Ahmed, B.; Khanam, T.; Chatziralli, I.P. Branch Retinal Vein Occlusion: Epidemiology, Pathogenesis, Risk Factors, Clinical Features, Diagnosis, and Complications. An Update of the Literature. Retina 2013, 33, 901–910. [Google Scholar] [CrossRef] [PubMed]
- Podkowinski, D.; Philip, A.-M.; Vogl, W.-D.; Gamper, J.; Bogunović, H.; Gerendas, B.S.; Najeeb, B.H.; Waldstein, S.M.; Schmidt-Erfurth, U. Neuroretinal atrophy following resolution of macular oedema in retinal vein occlusion. Br. J. Ophthalmol. 2018, 103, 36–42. [Google Scholar] [CrossRef] [PubMed]
- Koss, M.J.; Pfister, M.; Rothweiler, F.; Michaelis, M.; Cinatl, J.; Schubert, R.; Koch, F.H. Comparison of cytokine levels from undiluted vitreous of untreated patients with retinal vein occlusion. Acta Ophthalmol. 2011, 90, e98–e103. [Google Scholar] [CrossRef]
- Zeng, Y.; Cao, D.; Yu, H.; Zhuang, X.; Yang, D.; Hu, Y.; He, M.; Zhang, L. Comprehensive analysis of vitreous chemokines involved in ischemic retinal vein occlusion. Mol. Vis. 2019, 25, 756–765. [Google Scholar] [PubMed]
- Ebneter, A.; Kokona, D.; Schneider, N.; Zinkernagel, M.S. Microglia Activation and Recruitment of Circulating Macro-phages During Ischemic Experimental Branch Retinal Vein Occlusion. Investig. Ophthalmol. Vis. Sci. 2017, 58, 944–953. [Google Scholar] [CrossRef] [PubMed]
- Rezar-Dreindl, S.; Eibenberger, K.; Pollreisz, A.; Bühl, W.; Georgopoulos, M.; Krall, C.; Dunavölgyi, R.; Weigert, G.; Kroh, M.; Schmidt-Erfurth, U.; et al. Effect of intravitreal dexamethasone implant on intra-ocular cytokines and chemokines in eyes with retinal vein occlusion. Acta Ophthalmol. 2016, 95, e119–e127. [Google Scholar] [CrossRef] [PubMed]
- Noma, H.; Mimura, T.; Eguchi, S. Association of Inflammatory Factors with Macular Edema in Branch Retinal Vein Oc-clusion. JAMA Ophthalmol. 2013, 131, 160–165. [Google Scholar] [CrossRef]
- Kaur, C.; Foulds, W.S.; Ling, E.A. Blood-Retinal Barrier in Hypoxic Ischaemic Conditions: Basic Concepts, Clinical Features and Management. Prog. Retin. Eye Res. 2008, 27, 622–647. [Google Scholar] [CrossRef] [PubMed]
- Roubeix, C.; Dominguez, E.; Raoul, W.; Guillonneau, X.; Paques, M.; Sahel, J.-A.; Sennlaub, F. Mo-derived perivascular macrophage recruitment protects against endothelial cell death in retinal vein occlusion. J. Neuroinflamm. 2019, 16, 1–9. [Google Scholar] [CrossRef] [PubMed]
- Wang, X.; Zhao, L.; Zhang, J.; Fariss, R.; Ma, W.; Kretschmer, F.; Wang, M.; Qian, H.H.; Badea, T.C.; Diamond, J.S.; et al. Requirement for Microglia for the Maintenance of Synaptic Function and Integrity in the Mature Retina. J. Neurosci. 2016, 36, 2827–2842. [Google Scholar] [CrossRef] [PubMed]
- Provis, J.M.; Diaz, C.M.; Penfold, P.L. Microglia in Human Retina: A Heterogeneous Population with Distinct On-togenies. Perspect. Dev. Neurobiol. 1996, 3, 213–222. [Google Scholar] [PubMed]
- Lazarus, H.S.; Hageman, G.S. In Situ Characterization of the Human Hyalocyte. Arch. Ophthalmol. 1994, 112, 1356–1362. [Google Scholar] [CrossRef] [PubMed]
- Ogawa, K. Scanning Electron Microscopic Study of Hyalocytes in the Guinea Pig Eye. Arch. Histol. Cytol. 2002, 65, 263–268. [Google Scholar] [CrossRef] [PubMed]
- Bloom, G.D.; Balazs, E.A. An electron microscopic study of hyalocytes. Exp. Eye Res. 1965, 4, 249-IN32. [Google Scholar] [CrossRef]
- Zhu, M.; Penfold, P.L.; Madigan, M.C.; A Billson, F. Effect of human vitreous and hyalocyte-derived factors on vascular endothelial cell growth. Aust. N. Z. J. Ophthalmol. 1997, 25, 57–60. [Google Scholar] [CrossRef] [PubMed]
- Sakamoto, T.; Ishibashi, T. Hyalocytes: Essential Cells of the Vitreous Cavity in Vitreoretinal Pathophysiology? Retina 2011, 31, 222–228. [Google Scholar] [CrossRef] [PubMed]
- Neufeld, A.H. Microglia in the optic nerve head and the region of parapapillary chorioretinal atrophy in glaucoma. Arch. Ophthalmol. 1999, 117, 1050–1056. [Google Scholar] [CrossRef] [PubMed]
- Kinuthia, U.M.; Wolf, A.; Langmann, T. Microglia and Inflammatory Responses in Diabetic Retinopathy. Front. Immunol. 2020, 11, 564077. [Google Scholar] [CrossRef] [PubMed]
- Karlstetter, M.; Scholz, R.; Rutar, M.; Wong, W.T.; Provis, J.M.; Langmann, T. Retinal Microglia: Just Bystander or Target for Therapy? Progress Retin. Eye Res. 2015, 45, 30–57. [Google Scholar] [CrossRef] [PubMed]
- Kohno, R.-I.; Hata, Y.; Kawahara, S.; Kita, T.; Arita, R.; Mochizuki, Y.; Aiello, L.P.; Ishibashi, T. Possible contribution of hyalocytes to idiopathic epiretinal membrane formation and its contraction. Br. J. Ophthalmol. 2009, 93, 1020–1026. [Google Scholar] [CrossRef] [PubMed]
- Edwards, M.M.; McLeod, D.S.; Bhutto, I.A.; Villalonga, M.B.; Seddon, J.M.; Lutty, G.A. Idiopathic preretinal glia in aging and age-related macular degeneration. Exp. Eye Res. 2015, 150, 44–61. [Google Scholar] [CrossRef] [PubMed]
- Castanos, M.V.; Zhou, D.B.; Linderman, R.E.; Allison, R.; Milman, T.; Carroll, J.; Migacz, J.; Rosen, R.B.; Chui, T.Y. Imaging of Macrophage-Like Cells in Living Human Retina Using Clinical OCT. Investig. Opthalmol. Vis. Sci. 2020, 61, 48. [Google Scholar] [CrossRef] [PubMed]
- Hammer, D.X.; Agrawal, A.; Villanueva, R.; Saeedi, O.; Liu, Z. Label-free adaptive optics imaging of human retinal macrophage distribution and dynamics. Proc. Natl. Acad. Sci. USA 2020, 117, 30661–30669. [Google Scholar] [CrossRef] [PubMed]
- Ong, J.X.; Nesper, P.L.; Fawzi, A.A.; Wang, J.M.; Lavine, J.A. Macrophage-Like Cell Density Is Increased in Proliferative Diabetic Retinopathy Characterized by Optical Coherence Tomography Angiography. Investig. Opthalmol. Vis. Sci. 2021, 62, 2. [Google Scholar] [CrossRef]
- Nicholson, L.; Talks, S.J.; Amoaku, W.; Talks, K.; Sivaprasad, S. Retinal vein occlusion (RVO) guideline: Executive summary. Eye 2022, 36, 909–912. [Google Scholar] [CrossRef]
- Lu, M.; Perez, V.L.; Ma, N.; Miyamoto, K.; Peng, H.B.; Liao, J.K.; Adamis, A.P. VEGF increases retinal vascular ICAM-1 expression in vivo. Investig. Ophthalmol. Vis. Sci. 1999, 40, 1808–1812. [Google Scholar]
- Yoshimura, T.; Sonoda, K.-H.; Sugahara, M.; Mochizuki, Y.; Enaida, H.; Oshima, Y.; Ueno, A.; Hata, Y.; Yoshida, H.; Ishibashi, T. Comprehensive Analysis of Inflammatory Immune Mediators in Vitreoretinal Diseases. PLoS ONE 2009, 4, e8158. [Google Scholar] [CrossRef]
- Chehaibou, I.; Pettenkofer, M.; Govetto, A.; Rabina, G.; Sadda, S.R.; Hubschman, J.P. Identification of Epiretinal Prolifer-ation in Various Retinal Diseases and Vitreoretinal Interface Disorders. Int. J. Retin. Vitr. 2020, 6, 31. [Google Scholar] [CrossRef]
- Bu, S.C.; Kuijer, R.; van der Worp, R.J.; Postma, G.; De Lavalette, V.W.R.; Li, X.R.; Hooymans, J.M.M.; Los, L.I. Immunohistochemical Evaluation of Idiopathic Epiretinal Membranes and in Vitro Studies on the Effect of Tgf-Beta on Muller Cells. Investig. Ophthalmol. Vis. Sci. 2015, 56, 6506–6514. [Google Scholar] [CrossRef]
- Fung, A.T.; Galvin, J.; Tran, T. Epiretinal membrane: A review. Clin. Exp. Ophthalmol. 2021, 49, 289–308. [Google Scholar] [CrossRef]
- Stepp, M.A.; Menko, A.S. Immune responses to injury and their links to eye disease. Transl. Res. 2021, 236, 52–71. [Google Scholar] [CrossRef] [PubMed]
- Cugati, S.; Wang, J.J.; Rochtchina, E.; Mitchell, P. Ten-Year Incidence of Retinal Vein Occlusion in an Older Population: The Blue Mountains Eye Study. Arch. Ophthalmol. 2006, 124, 726–732. [Google Scholar] [CrossRef]
- Spaide, R.F. Retinal Vascular Cystoid Macular Edema: Review and New Theory. Retina 2016, 36, 1823–1842. [Google Scholar] [CrossRef]
- Allingham, M.J.; Tserentsoodol, N.; Saloupis, P.; Mettu, P.S.; Cousins, S.W. Aldosterone Exposure Causes Increased Retinal Edema and Severe Retinopathy Following Laser-Induced Retinal Vein Occlusion in Mice. Investig. Opthalmol. Vis. Sci. 2018, 59, 3355–3365. [Google Scholar] [CrossRef] [PubMed]
- Daruich, A.; Matet, A.; Moulin, A.; Kowalczuk, L.; Nicolas, M.; Sellam, A.; Rothschild, P.-R.; Omri, S.; Gélizé, E.; Jonet, L.; et al. Mechanisms of macular edema: Beyond the surface. Prog. Retin. Eye Res. 2018, 63, 20–68. [Google Scholar] [CrossRef] [PubMed]
- Omri, S.; Behar-Cohen, F.; De Kozak, Y.; Sennlaub, F.; Verissimo, L.M.; Jonet, L.; Savoldelli, M.; Orim, B.; Crisanti, P. Micro-glia/Macrophages Migrate through Retinal Epithelium Barrier by a Transcellular Route in Diabetic Retinopathy: Role of Pkczeta in the Goto Kakizaki Rat Model. Am. J. Pathol. 2011, 179, 942–953. [Google Scholar] [CrossRef] [PubMed]
- Lee, H.; Jang, H.; Choi, Y.A.; Kim, H.C.; Chung, H. Association between Soluble Cd14 in the Aqueous Humor and Hy-perreflective Foci on Optical Coherence Tomography in Patients with Diabetic Macular Edema. Investig. Ophthalmol. Vis. Sci. 2018, 59, 715–721. [Google Scholar] [CrossRef] [PubMed]


| RVO Eye | Control Eyes | p * | |||||
|---|---|---|---|---|---|---|---|
| Acute RVO Eyes | Chronic RVO Eyes | All RVO Eyes | |||||
| CRVO Eyes | BRVO Eyes | CRVO Eyes | BRVO Eyes | - | |||
| Subjects, n | 15 | 28 | 13 | 16 | 72 | 64 | - |
| Sex (female), n (%) | 2 (13.33) | 15 (53.57) | 6 (46.15) | 7 (43.75) | 30 (42.86) | 28 (43.8) | p * = 0.33 |
| Age, mean ± SD | 53.73 ± 8.23 | 57.50 ± 11.23 | 51.00 ± 14.58 | 56.06 ± 14.10 | 55.2 ± 12.0 | 54.39 ± 12.01 | p * = 0.69 |
| BCVA (logMAR) | 1.27 ± 0.36 | 0.81 ± 0.41 | 0.50 ± 0.27 | 0.32 ± 0.30 | 0.68 ± 0.45 | 0.22 ± 0.20 | p * < 0.001 |
| Missing, n | 3 | 6 | 1 | 1 | 11 | 11 | - |
| Refractive error (D), mean ± SD | −0.35 ± 1.70 | −1.14 ± 1.17 | 0.17 ± 1.21 | 0.61 ± 0.87 | 0.23 ± 1.39 | 0.19 ± 1.16 | p * = 0.78 |
| Missing, n | 6 | 13 | 5 | 6 | 30 | 30 | - |
| RVO Eyes (n = 72) | Control Eyes (n = 64) | p | |||
|---|---|---|---|---|---|
| Acute RVO Eyes (n = 43) | Chronic RVO Eyes (n = 29) | All RVO Eyes | |||
| Disaese duration (days) | 33.00 (43) | 265.00 (535) | 65.50 (177) | - | p # < 0.001 |
| MRT (μm) | 422.40 (126.69) | 340.82 (112.48) | 388.05 (140.21) | 291.52 (16.56) | p * # < 0.001 |
| CFT (μm) | 555.31 (382.93) | 276.65 (492.09) | 502.16 (469.42) | 207.84 (18.49) | p * < 0.001 p # < 0.01 |
| VD of DCP (%) | 38.82 ± 11.14 | 43.90 ± 9.45 | 40.87 ± 10.73 | 56.60 ± 3.88 | p * < 0.001 p # < 0.05 |
| VD of SCP (%) | 55.76 ± 6.90 | 50.23 ± 8.12 | 53.54 ± 7.85 | 51.48 ± 5.08 | p * # < 0.05 |
| MLC count | 388.00 (353) | 422.00 (393) | 391.00 (352) | 220.50 (220) | p * < 0.001 p # = 0.22 |
| MLC density (cells/mm2) | 11.53 (10.37) | 12.53 (11.66) | 11.61 (10.44) | 6.55 (6.53) | p * < 0.001 p # = 0.22 |
| Edematous Region (n = 63) | Non-Edematous Region (n = 63) | Whole Image | p a | |
|---|---|---|---|---|
| Area (mm2) | 9.14 (13.07) | 24.52 (13.07) | 33.66 | - |
| MLC count (cells) | 62 (165) | 279 (268) | 394 (369) | p * < 0.001 p # = 0.001 |
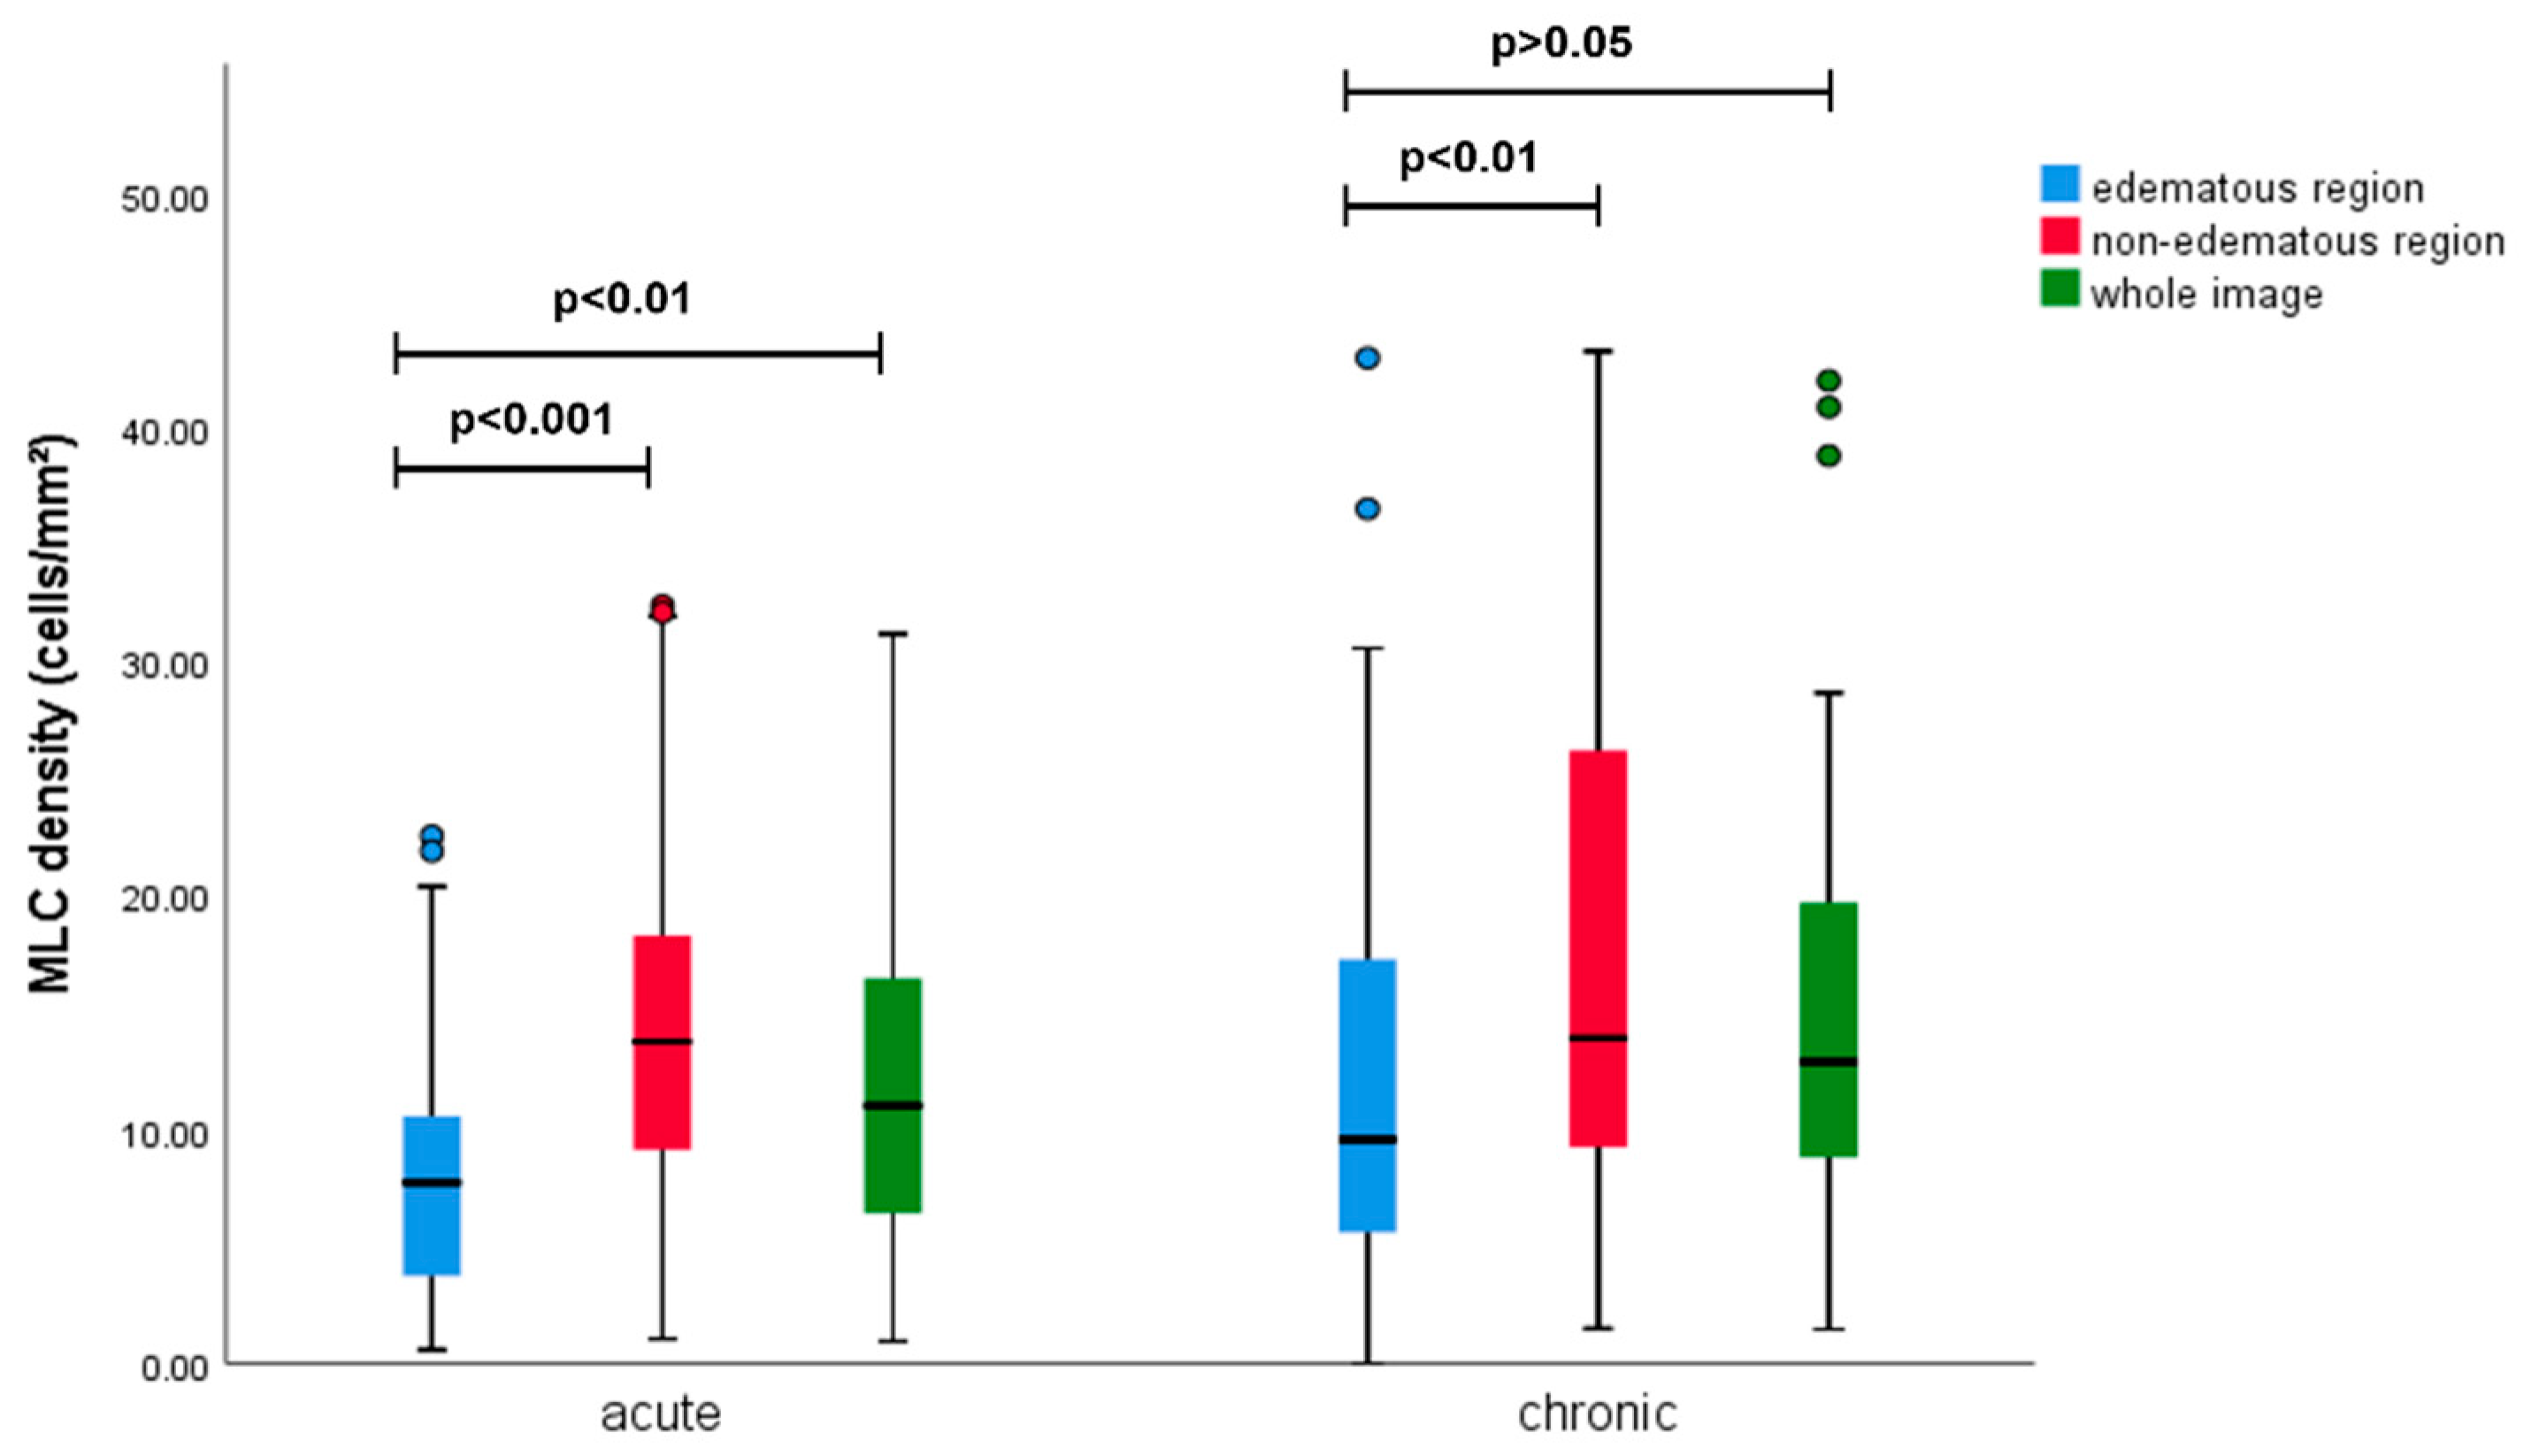
| MLC density (cells/mm2) | 7.91 (10.97) | 13.85 (12.21) | 11.70 (10.96) | p * < 0.001 p # < 0.01 |
Publisher’s Note: MDPI stays neutral with regard to jurisdictional claims in published maps and institutional affiliations. |
© 2022 by the authors. Licensee MDPI, Basel, Switzerland. This article is an open access article distributed under the terms and conditions of the Creative Commons Attribution (CC BY) license (https://creativecommons.org/licenses/by/4.0/).
Share and Cite
Wang, W.; Sun, G.; He, L.; Chen, C. Increased Macrophage-like Cell Density in Retinal Vein Occlusion as Characterized by en Face Optical Coherence Tomography. J. Clin. Med. 2022, 11, 5636. https://doi.org/10.3390/jcm11195636
Wang W, Sun G, He L, Chen C. Increased Macrophage-like Cell Density in Retinal Vein Occlusion as Characterized by en Face Optical Coherence Tomography. Journal of Clinical Medicine. 2022; 11(19):5636. https://doi.org/10.3390/jcm11195636
Chicago/Turabian StyleWang, Wenyu, Gongpeng Sun, Lu He, and Changzheng Chen. 2022. "Increased Macrophage-like Cell Density in Retinal Vein Occlusion as Characterized by en Face Optical Coherence Tomography" Journal of Clinical Medicine 11, no. 19: 5636. https://doi.org/10.3390/jcm11195636
APA StyleWang, W., Sun, G., He, L., & Chen, C. (2022). Increased Macrophage-like Cell Density in Retinal Vein Occlusion as Characterized by en Face Optical Coherence Tomography. Journal of Clinical Medicine, 11(19), 5636. https://doi.org/10.3390/jcm11195636