
Association of the Heart Rate Variability Response to Active Standing with the Severity of Calcific Aortic Valve Disease: Novel Insights of a Neurocardiovascular Pathology

 ,
,  and
and
Abstract
:1. Introduction
2. Materials and Methods
2.1. Subjects and Study Protocol
2.2. Echocardiographic Assessment
2.3. Electrocardiogram Recording and HRV Indices
2.4. Breathing Frequency
2.5. Blood Samples Collection and Analysis
2.6. Study Variables
2.7. Statistical Analysis
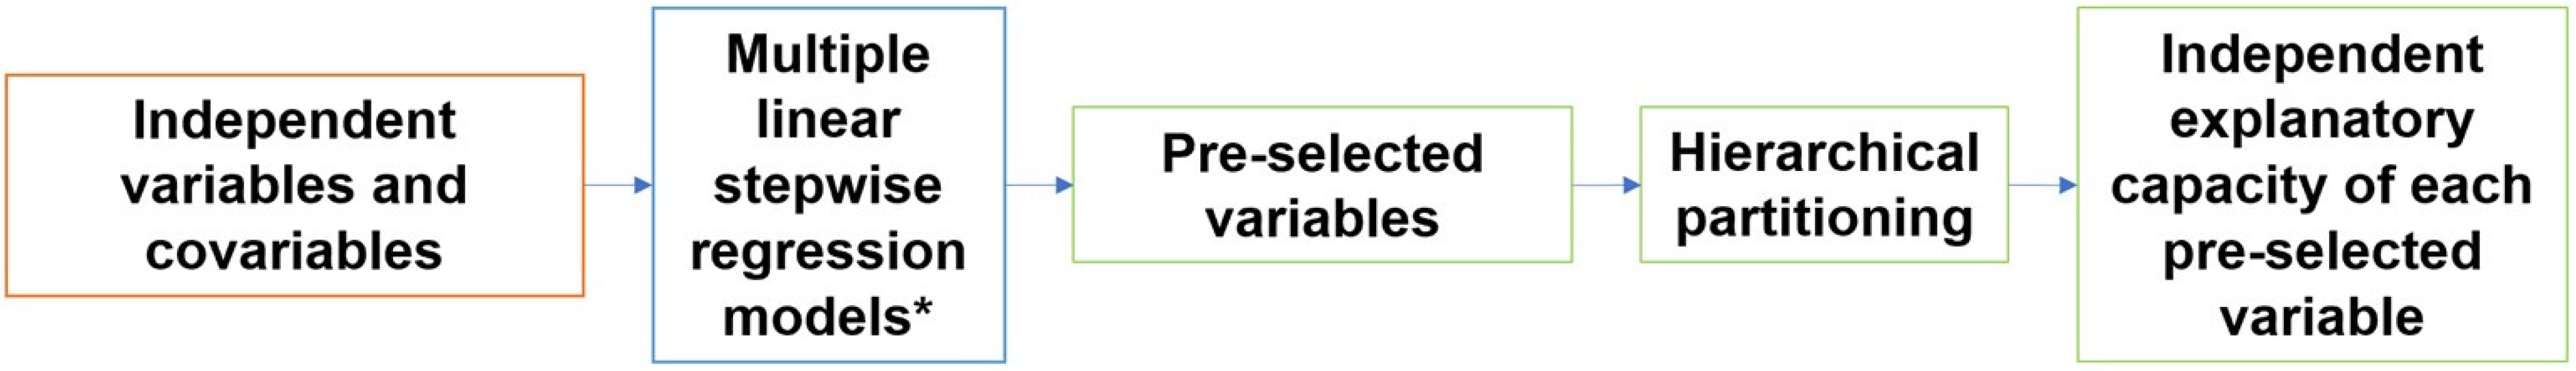
2.8. Hierarchical Partitioning
3. Results
4. Discussion
5. Study Limitations and Further Work
6. Conclusions
Supplementary Materials
Author Contributions
Funding
Institutional Review Board Statement
Informed Consent Statement
Data Availability Statement
Conflicts of Interest
References
- Aikawa, E.; Schoen, F.J. Calcific and Degenerative Heart Valve Disease. In Cellular and Molecular Pathobiology of Cardiovascular Disease; Willis, M.S., Homeister, J.W., Stone, J.R., Eds.; Elsevier: Amsterdam, The Netherlands, 2014; pp. 161–180. [Google Scholar] [CrossRef]
- Joseph, J.; Naqvi, S.Y.; Giri, J.; Goldberg, S. Aortic Stenosis: Pathophysiology, Diagnosis, and Therapy. Am. J. Med. 2017, 130, 253–263. [Google Scholar] [CrossRef]
- Gharacholou, S.M.; Karon, B.L.; Shub, C.; Pellikka, P. Aortic Valve Sclerosis and Clinical Outcomes: Moving Toward a Definition. Am. J. Med. 2011, 124, 103–110. [Google Scholar] [CrossRef]
- Dweck, M.R.; Boon, N.A.; Newby, D.E. Calcific Aortic Stenosis: A Disease of the Valve and the Myocardium. J. Am. Coll. Cardiol. 2012, 60, 1854–1863. [Google Scholar] [CrossRef]
- Lindman, B.R.; Clavel, M.; Mathieu, P.; Iung, B.; Lancellotti, P.; Otto, C.M.; Pibarot, P. Calcific aortic stenosis. Nat. Rev. Dis. Prim. 2016, 2, 16006. [Google Scholar] [CrossRef]
- Otto, C.M.; Prendergast, B. Aortic-Valve Stenosis—From Patients at Risk to Severe Valve Obstruction. N. Engl. J. Med. 2014, 371, 744–756. [Google Scholar] [CrossRef]
- Rosenhek, R.; Klaar, U.; Schemper, M.; Scholten, C.; Heer, M.; Gabriel, H.; Binder, T.; Maurer, G.; Baumgartner, H. Mild and moderate aortic stenosis: Natural history and risk stratification by echocardiography. Eur. Heart J. 2004, 25, 199–205. [Google Scholar] [CrossRef]
- Nishimura, R.A.; Otto, C.M.; Bonow, R.O.; Carabello, B.A.; Erwin, J.P.; Guyton, R.A.; O’Gara, P.T.; Ruiz, C.E.; Skubas, N.J.; Sorajja, P.; et al. 2014 AHA/ACC Guideline for the Management of Patients With Valvular Heart Disease. Circulation 2014, 129, e521–e643. [Google Scholar] [CrossRef]
- Baumgartner, H.; Hung, J.; Bermejo, J.; Chambers, J.B.; Evangelista, A.; Griffin, B.P.; Iung, B.; Otto, C.M.; Pellikka, P.A.; Quinones, M. Echocardiographic assessment of valve stenosis: EAE/ASE recommendations for clinical practice. Eur. J. Echocardiogr. 2009, 10, 1–25. [Google Scholar] [CrossRef]
- Benjamin, E.J.; Blaha, M.J.; Chiuve, S.E.; Cushman, M.; Das, S.R.; Deo, R.; de Ferranti, S.D.; Floyd, J.; Fornage, M.; Gillespie, C.; et al. Heart Disease and Stroke Statistics-2017 Update: A Report From the American Heart Association. Circulation 2017, 135, e146–e603. [Google Scholar] [CrossRef]
- Billman, G.E.; Huikuri, H.V.; Sacha, J.; Trimmel, K. An introduction to heart rate variability: Methodological considerations and clinical applications. Front. Physiol. 2015, 6, 55. [Google Scholar] [CrossRef]
- Arslan, U.; Ozdemir, M.; Kocaman, S.A.; Balcioglu, S.; Cemri, M.; Cengel, A. Heart rate variability and heart rate turbulence in mild-to-moderate aortic stenosis. EP Eur. 2008, 10, 1434–1441. [Google Scholar] [CrossRef]
- Jung, J.; Heisel, A.; Butz, B.; Fries, R.; Schieffer, H.; Tscholl, D.; Schäfers, H. Factors influencing heart rate variability in patients with severe aortic valve disease. Clin. Cardiol. 1997, 20, 341–344. [Google Scholar] [CrossRef]
- Dumonteil, N.; Vaccaro, A.; Despas, F.; Labrunee, M.; Marcheix, B.; Lambert, E.; Esler, M.; Carrie, D.; Senard, J.; Galinier, M.; et al. Transcatheter Aortic Valve Implantation Reduces Sympathetic Activity and Normalizes Arterial Spontaneous Baroreflex in Patients With Aortic Stenosis. JACC Cardiovasc. Interv. 2013, 6, 1195–1202. [Google Scholar] [CrossRef]
- Echeverría, J.C.; Ávila-Vanzzini, N.; Springall, R.; Torres-Arellano, J.M.; Toledo, A.; Infante, O.; Bojalil, R.; Cossío, J.; Fajardo, E.; Lerma, C. Inflammation and Reduced Parasympathetic Cardiac Modulation in Aortic-Valve Sclerosis. Appl. Sci. 2019, 9, 4020. [Google Scholar] [CrossRef]
- Torres-Arellano, J.M.; Echeverría, J.C.; Ávila-Vanzzini, N.; Springall, R.; Toledo, A.; Infante, O.; Bojalil, R.; Cossío-Aranda, J.E.; Fajardo, E.; Lerma, C. Cardiac Autonomic Response to Active Standing in Calcific Aortic Valve Stenosis. J. Clin. Med. 2021, 10, 2004. [Google Scholar] [CrossRef]
- Zephyr Technology, BioHarness 3.0 User Manual. Available online: https://www.zephyranywhere.com/media/download/bioharness3-user-manual.pdf (accessed on 17 September 2020).
- Infante, O.; Valenzuela, F.; Polo, S. Algoritmo que utiliza la segunda derivada para identificar el complejo QRS en tiempo real. Rev. Mex. Ing. Bioméd. 1992, 13, 3–32. [Google Scholar]
- Task Force of the European Society of Cardiology the North American Society of Pacing Electrophysiology. Heart rate variability: Standards of measurement, physiological interpretation, and clinical use. Circulation 1996, 93, 1043–1065. [Google Scholar] [CrossRef]
- Shaffer, F.; Ginsberg, J.P. An Overview of Heart Rate Variability Metrics and Norms. Front. Public Health 2017, 5, 258. [Google Scholar] [CrossRef]
- Peng, C.K.; Havlin, S.; Stanley, H.E.; Goldberger, A.L. Quantification of scaling exponents and crossover phenomena in nonstationary heartbeat time series. Chaos Interdiscip. J. Nonlinear Sci. 1995, 5, 82–87. [Google Scholar] [CrossRef]
- Richman, J.S.; Moorman, J.R. Physiological time-series analysis using approximate entropy and sample entropy. Am. J. Physiol.-Heart Circ. Physiol. 2000, 278, H2039–H2049. [Google Scholar] [CrossRef]
- The MathWorks. MATLAB R2020b (9.9.9.1524771); MathWorks: Natick, MA, USA, 2020; Available online: https://www.mathworks.com/ (accessed on 16 November 2021).
- Goldberger, A.L.; Amaral, L.A.N.; Glass, L.; Hausdorff, J.M.; Ivanov, P.C.; Mark, R.G.; Mietus, J.E.; Moody, G.B.; Peng, C.; Stanley, H.E. PhysioBank, PhysioToolkit, and PhysioNet: Components of a New Research Resource for Complex Physiologic Signals. Circulation 2000, 101, 215–220. [Google Scholar] [CrossRef]
- Gąsior, J.S.; Sacha, J.; Jeleʼn, P.J.; Zieliʼnski, J.; Przybylski, J. Heart Rate and Respiratory Rate Influence on Heart Rate Variability Repeatability: Effects of the Correction for the Prevailing Heart Rate. Front. Physiol. 2016, 7, 356. [Google Scholar] [CrossRef]
- Razali, N.M.; Wah, Y.B. Power comparisons of Shapiro-Wilk, Kolmogorov-Smirnov, Lilliefors, and Anderson-Darling tests. J. Stat. Model. Anal. 2011, 2, 21–33. [Google Scholar]
- Yap, B.W.; Sim, C.H. Comparisons of various types of normality tests. J. Stat. Comput. Simul. 2011, 81, 2141–2155. [Google Scholar] [CrossRef]
- Armstrong, R.A. When to use the Bonferroni correction. Ophthalmic Physiol. Opt. 2014, 34, 502–508. [Google Scholar] [CrossRef]
- Doi, H.; Heeren, A.; Maurage, P. Scientific activity is a better predictor of Nobel award chances than dietary habits and economic factors. PLoS ONE 2014, 9, e92612. [Google Scholar] [CrossRef]
- Walsh, C.; Nally, R.M. Package ‘hier.part’: A Language and Environment for Statistical Computing. 2020. Available online: https://cran.r-project.org/web/packages/hier.part/hier.part.pdf (accessed on 31 October 2021).
- Perkiömäki, J.S. Heart Rate Variability and Non-Linear Dynamics in Risk Stratification. Front. Physiol. 2011, 2, 82. [Google Scholar] [CrossRef]
- Monfredi, O.; Lyashkov, A.E.; Johnsen, A.; Inada, S.; Schneider, H.; Wang, R.; Nirmalan, M.; Wisloff, U.; Maltsev, V.A.; Lakatta, E.G.; et al. Biophysical Characterization of the Underappreciated and Important Relationship Between Heart Rate Variability and Heart Rate. Hypertension 2014, 64, 1334–1343. [Google Scholar] [CrossRef]
- Sacha, J.; Sobon, J.; Sacha, K.; Barabach, S. Heart rate impact on the reproducibility of heart rate variability analysis. Int. J. Cardiol. 2013, 168, 4257–4259. [Google Scholar] [CrossRef]
- Munoz, A.C.; Vohra, S.; Gupta, M. Orthostasis. In StatPearls [Internet]; StatPearls Publishing: Tampa, FL, USA, 2022; Available online: https://www.ncbi.nlm.nih.gov/books/NBK532938/ (accessed on 25 October 2021).
- Goswami, N.; Blaber, A.P.; Hinghofer-Szalkay, H.; Montani, J. Orthostatic Intolerance in Older Persons: Etiology and Countermeasures. Front. Physiol. 2017, 8, 803. [Google Scholar] [CrossRef]
- Schondorf, R.; Low, P.A. Gender related differences in the cardiovascular responses to upright tilt in normal subjects. Clin. Auton. Res. 1992, 2, 183–187. [Google Scholar] [CrossRef]
- Butler, G.C.; Yamamoto, Y.; Hughson, R.L. Heart Rate Variability to Monitor Autonomic Nervous System Activity during Orthostatic Stress. J. Clin. Pharmacol. 1994, 34, 558–562. [Google Scholar] [CrossRef]
- Montano, N.; Ruscone, T.G.; Porta, A.; Lombardi, F.; Pagani, M.; Malliani, A. Power spectrum analysis of heart rate variability to assess the changes in sympathovagal balance during graded orthostatic tilt. Circulation 1994, 90, 1826–1831. [Google Scholar] [CrossRef]
- Guzzetti, S.; Piccaluga, E.; Casati, R.; Cerutti, S.; Lombardi, F.; Pagani, M.; Malliani, A. Sympathetic predominance an essential hypertension: A study employing spectral analysis of heart rate variability. J. Hypertens. 1988, 6, 711–717. [Google Scholar] [CrossRef]
- Carnethon, M.R.; Liao, D.; Evans, G.W.; Cascio, W.E.; Chambless, L.E.; Heiss, G. Correlates of the shift in heart rate variability with an active postural change in a healthy population sample: The Atherosclerosis Risk In Communities study. Am. Heart J. 2002, 143, 808–813. [Google Scholar] [CrossRef]
- Antonini-Canterin, F.; Huang, G.; Cervesato, E.; Faggiano, P.; Pavan, D.; Piazza, R.; Nicolosi, G.L. Symptomatic Aortic Stenosis: Does systemic hypertension play an additional role? Hypertension 2003, 41, 1268–1272. [Google Scholar] [CrossRef]
- Rieck, A.E.; Cramariuc, D.; Boman, K.; Gohlke-Bärwolf, C.; Staal, E.M.; Lønnebakken, M.T.; Rossebø, A.B.; Gerdts, E. Hypertension in aortic stenosis: Implications for left ventricular structure and cardiovascular events. Hypertension 2012, 60, 90–97. [Google Scholar] [CrossRef]
- Rassa, A.; Zahr, F. Hypertension and Aortic Stenosis: A Review. Curr. Hypertens. Rev. 2018, 14, 6–14. [Google Scholar] [CrossRef]
- Peltier, M.; Trojette, F.; Sarano, M.E.; Grigioni, F.; Slama, M.A.; Tribouilloy, C.M. Relation between cardiovascular risk factors and nonrheumatic severe calcific aortic stenosis among patients with a three-cuspid aortic valve. Am. J. Cardiol. 2003, 91, 97–99. [Google Scholar] [CrossRef]
- Haspula, D.; Clark, M.A. Neuroinflammation and sympathetic overactivity: Mechanisms and implications in hypertension. Auton. Neurosci. 2018, 210, 10–17. [Google Scholar] [CrossRef]
- Hogarth, A.J.; Mackintosh, A.F.; Mary, D.A.S.G. The effect of gender on the sympathetic nerve hyperactivity of essential hypertension. J. Hum. Hypertens. 2007, 21, 239–245. [Google Scholar] [CrossRef] [PubMed]
- Goit, R.K.; Ansari, A.H. Reduced parasympathetic tone in newly diagnosed essential hypertension. Indian Heart J. 2016, 68, 153–157. [Google Scholar] [CrossRef]
- Schobel, H.P.; Oren, R.M.; Mark, A.L.; Ferguson, D.W. Influence of resting sympathetic activity on reflex sympathetic responses in normal man. Clin. Auton. Res. 1995, 5, 71–80. [Google Scholar] [CrossRef] [PubMed]
- Tsuji, H.; Venditti, F.J.; Manders, E.S.; Evans, J.C.; Larson, M.G.; Feldman, C.L.; Levy, D. Determinants of heart rate variability. J. Am. Coll. Cardiol. 1996, 28, 1539–1546. [Google Scholar] [CrossRef]
- Huston, J.M.; Tracey, K.J. The pulse of inflammation: Heart rate variability, the cholinergic Anti-Inflammatory pathway and implications for therapy. J. Intern. Med. 2011, 269, 45–53. [Google Scholar] [CrossRef] [PubMed]


| Variable | NAV (n = 22) | AVSc (n = 73) | AVSt (n = 32) | p Value |
|---|---|---|---|---|
| Age (years) | 41.3 ± 7.9 | 45.3 ± 9.3 | 63.3 ± 6.6 ^° | <0.001 |
| Female | 10 (45%) | 40 (55%) | 11 (34%) | 0.150 |
| BMI (kg/m2) | 25.9 (24.9, 29.4) | 27.0 (24.9, 30.3) | 28.2 (26.7, 32.2) | 0.141 |
| DBP (mmHg) & | 78 (70, 80) | 78 (70, 81) | 80 (70, 83) | 0.478 |
| SBP (mmHg) & | 110 (108, 118) | 116 (110, 123) | 136 ± 21.4 ^° | <0.001 |
| MBF (Hz) | 0.27 ± 0.05 | 0.27 (0.22, 0.31) | 0.33 ± 0.08 ^° | 0.002 |
| Medication intake & | 6 (27%) | 18 (25%) | 24 (75%) ^° | <0.001 |
| Hypertension | 2 (9%) | 4 (5%) | 16 (50%) ^° | <0.001 |
| Smoking | 6 (27%) | 26 (36%) | 12 (38%) | 0.714 |
| Diabetes | 0 (0 %) | 2 (3%) | 7 (22%) ° | <0.001 |
| Variable | NAV | AVSc | AVSt | p Value |
|---|---|---|---|---|
| Vmax (m/s) n = 126 | 1.2 ± 0.3 n = 22 | 1.3 ± 0.2 n = 72 | 4.4 ± 1.2 ^° n = 32 | <0.001 |
| PGmean (mmHg) n = 126 | 3 (2, 3) n = 22 | 3 (2, 4) n = 72 | 41 (23, 71) ^° n = 32 | <0.001 |
| PGmax (mmHg) n = 126 | 5.3 ± 2.2 n = 22 | 6 (4, 7) n = 73 | 69 (37.2, 114.7) ^° n = 31 | <0.001 |
| AVA (cm2) n = 125 | 4.1 ± 0.2 n = 21 | 4.1 (4, 4.3) n = 72 | 0.6 (0.4, 1.3) ^° n = 32 | <0.001 |
| AVAi (cm2/m2) n = 122 | 2.2 ± 0.2 n = 21 | 2.3 ± 0.3 n = 72 | 0.4 (0.3, 0.7) ^° n = 29 | <0.001 |
| Variable | NAV | AVSc | AVSt | p Value |
|---|---|---|---|---|
| LVEF (%) n = 127 | 61.9 ± 6.4 n = 22 | 62.3 ± 6.6 n = 73 | 55 (51, 60) ^° n = 32 | <0.001 |
| LVM (g) n = 76 | 98 (86, 105) n = 16 | 117 (96, 155.7) n = 45 | 216.9 ± 67.1 ^° n = 15 | <0.001 |
| LVMi (g/m2) n = 76 | 54.7 ± 12.1 n = 16 | 65 (56.7, 77) ^ n = 45 | 119.8 ± 34.7 ^° n = 15 | <0.001 |
| RWT n = 76 | 0.4 ± 0.1 n = 16 | 0.4 ± 0.1 n = 45 | 0.5 ± 0.2 ^° n = 15 | <0.001 |
| Variable | NAV (n = 22) | AVSc (n = 73) | AVSt (n = 32) | p Value |
|---|---|---|---|---|
| ΔpNN20 (%) | 8.9 ± 7.3 | 9.9 ± 9.0 | 5.4 ± 10.2 | 0.060 |
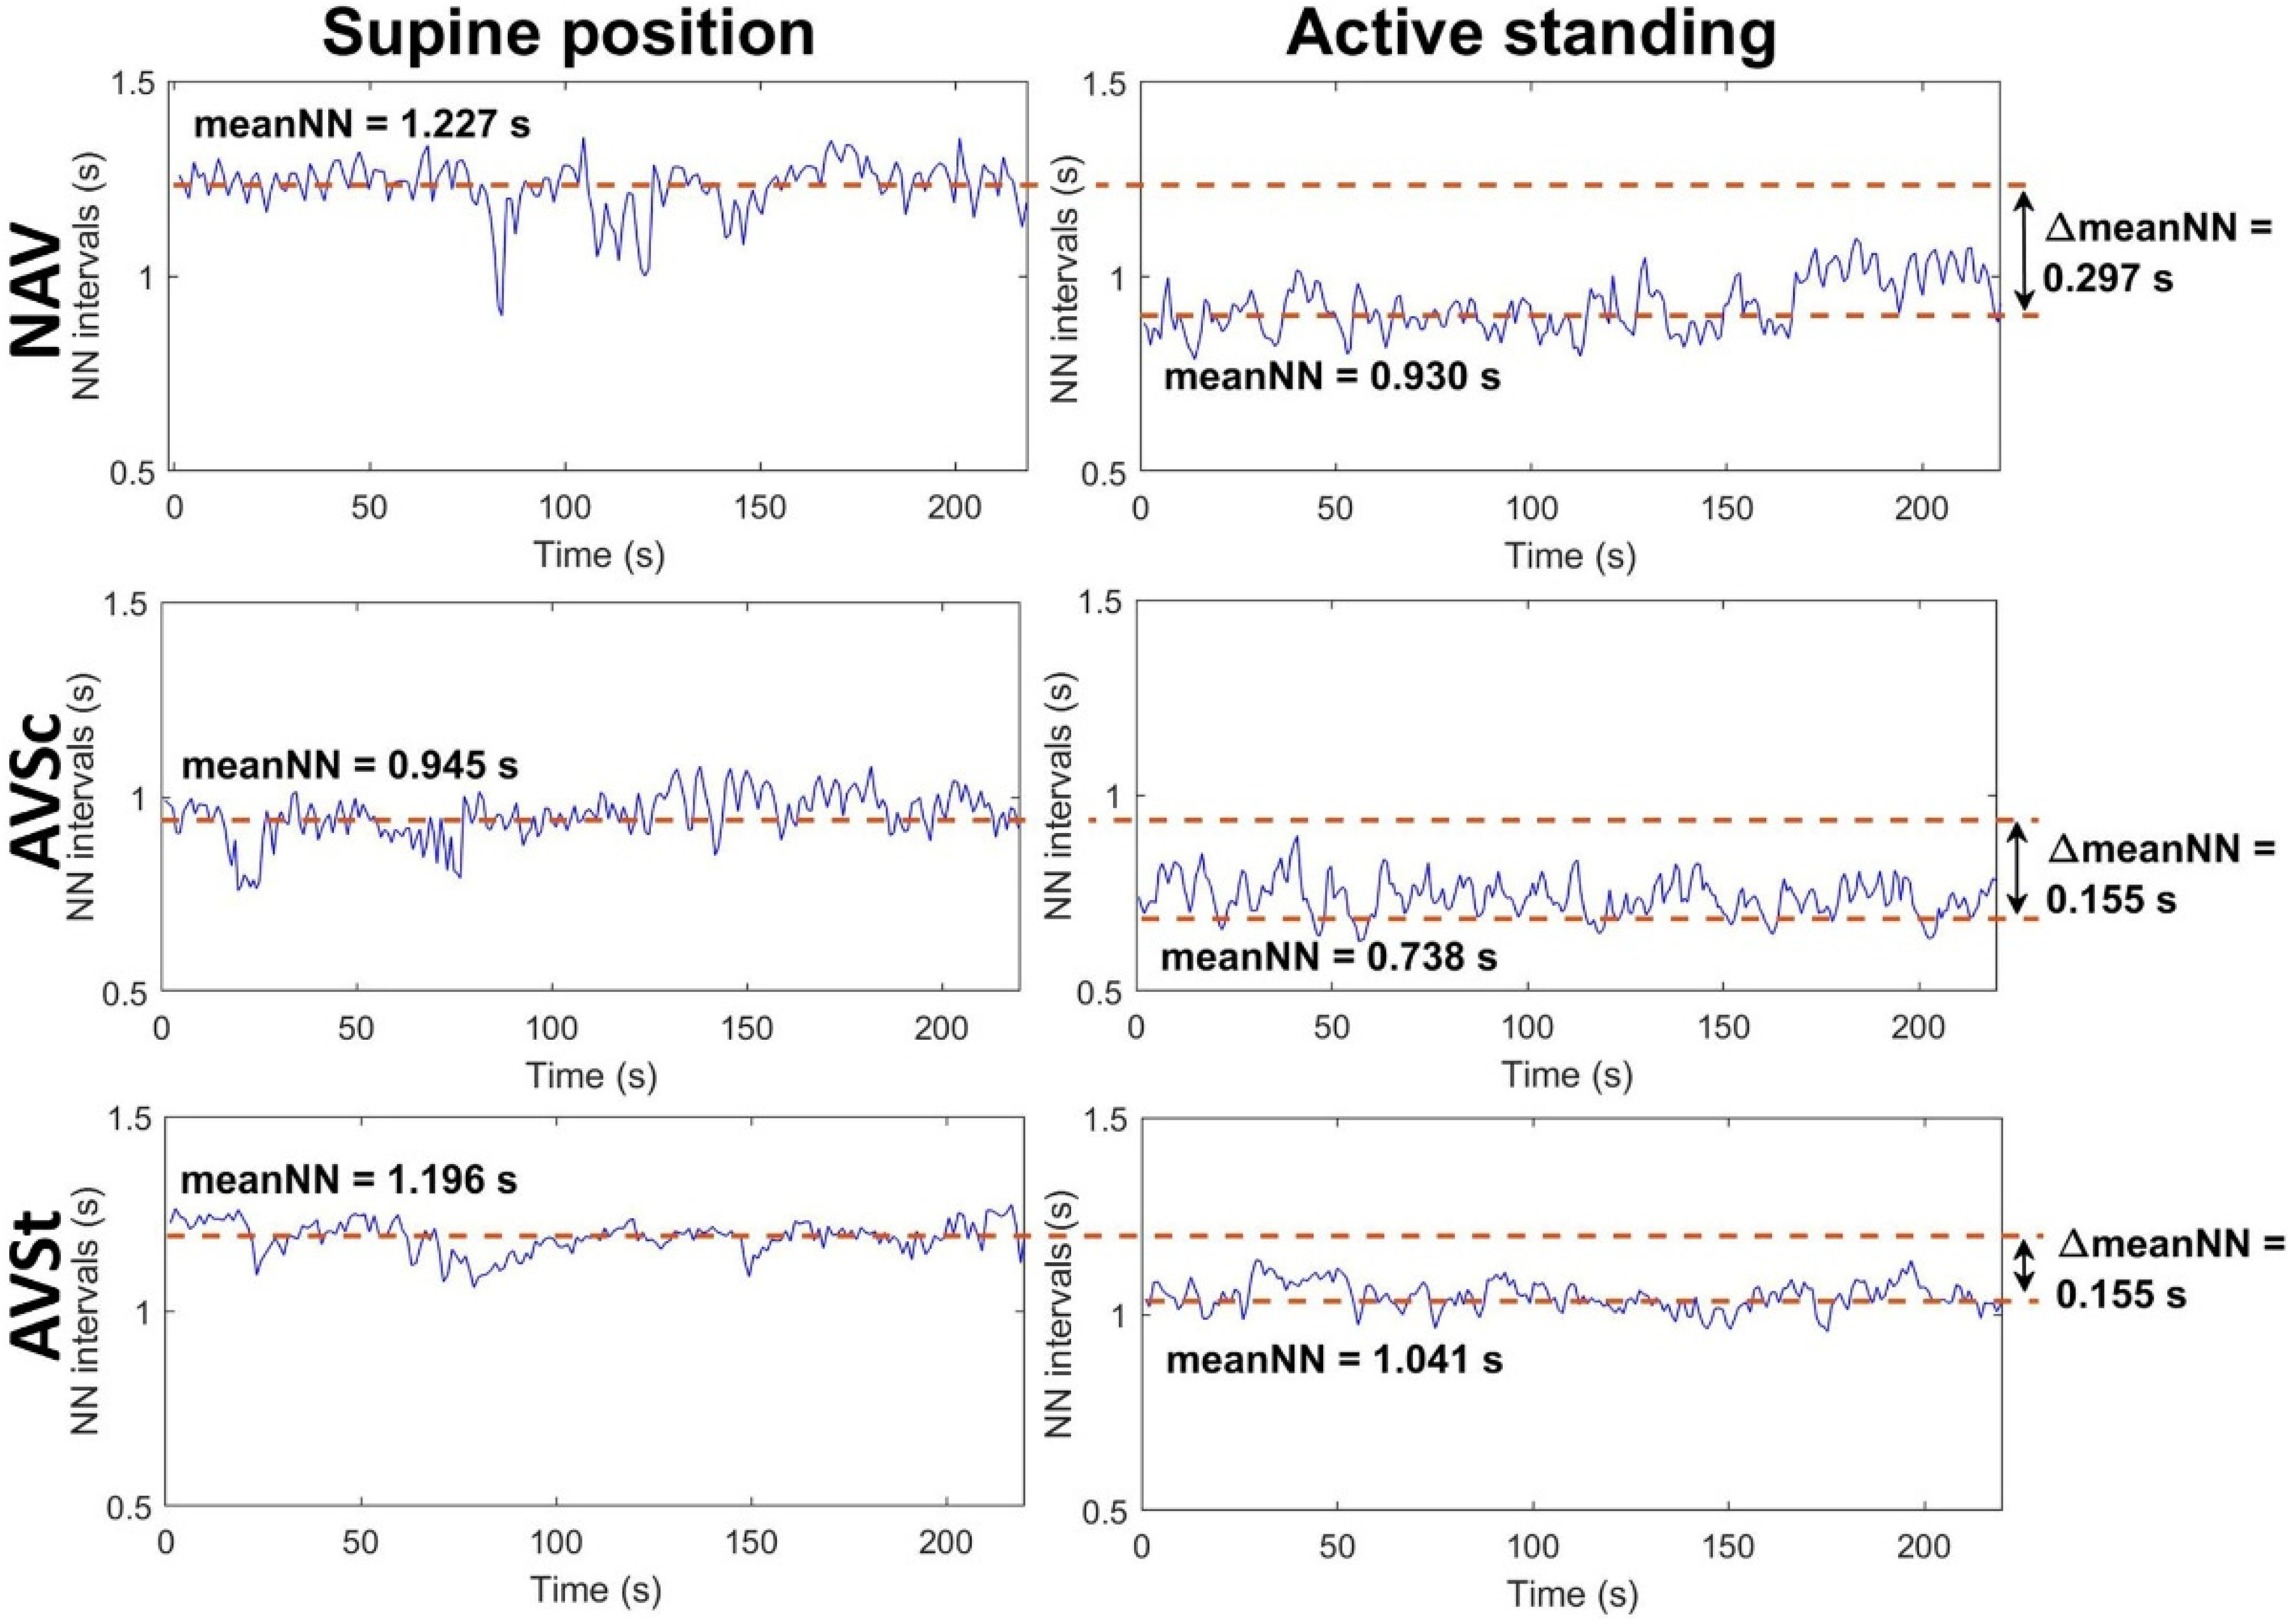
| ΔmeanNN (s) | 0.2 ± 0.1 | 0.2 ± 0.1 | 0.1 (0.0, 0.1) ^° | 0.001 |
| ΔRMSSD (ms) | 10.9 (7.0, 16.8) | 14.4 (4.2, 27.5) | 6.6 (−2.7, 18.6) | 0.049 |
| ΔSDNN (ms) | 1.7 (−5.9, 13.9) | 6.7 (−6.9, 23.7) | 4.7 (−7.1, 18.6) | 0.499 |
| ΔLF (ms2) | −612.5 (−827.2, −93.3) | −26.1 (−433.4, 249.3) ^ | 22.2 (−118.2, 181.9) ^ | 0.001 |
| ΔHF (ms2) | 130.5 (36.7, 311.5) | 152 (58.6, 406.1) | 48.0 (−14.0, 90.0) ^° | 0.003 |
| ΔLF/HF | −5.8 ± 4.9 | −3.0 (−6.6, −1) ^ | −0.7 (−3.7, 0.5) ^° | 0.001 |
| ΔHFn (n.u.) | 30 ± 19.3 | 19.6 ± 17.1 | 5.3 (−2.3, 14) ^° | <0.001 |
| ΔLFn (n.u.) | −30.2 ± 19.3 | −19.5 ± 17.1^ | −5.1 (−14, 2.3) ^° | <0.001 |
| Δα1 | −0.4 ± 0.2 | −0.3 ± 0.3 | −0.1 ± 0.3 ^° | <0.001 |
| ΔSampEn | 0.3 ± 0.5 | 0.3 ± 0.4 | 0.1 ± 0.4 | 0.139 |
| HRV | Valve Function Parameter (Independent Variable) | Pre-Selected Covariables | R2 of Combined Model | |
|---|---|---|---|---|
| Name | % Independent Exploratory Capacity | |||
| ΔpNN20 | PGmean | 3.951 | age, albumin, CRP, medication intake, ΔmeanNN | 0.2890 |
| ΔmeanNN | PGmean | 2.519 | LVMi, glucose, tri glycerides, ET1, age, medication intake, MBF | 0.2525 |
| ΔRMSSD | ---- | ---- | age, medication intake, ΔmeanNN | 0.2966 |
| ΔSDNN | ---- | ---- | CRP, IFN-γ, BMI, medication intake | 0.2102 |
| ΔLF | ---- | ---- | RWT, CRP, TIMP1, BMI | 0.2439 |
| ΔHF | PGmean | 1.698 | SBP, ΔmeanNN | 0.2244 |
| ΔLF/HF | PGmax | 1.109 | PGmax, RWT, SBP, medication intake, MBF, ΔmeanNN | 0.1643 |
| ΔHFn | PGmean | 2.432 | LVM, glucose, triglycerides, ET1, SBP, DBP, MBF, ΔmeanNN | 0.3077 |
| ΔLFn | PGmean | 2.390 | LVM, glucose, triglycerides, ET1, SBP, DBP, MBF, ΔmeanNN | 0.3005 |
| Δα1 | AVA | 4.591 | RWT, LVEF, triglycerides, ET1, IL-4, SBP, age, medication intake, MBF, ΔmeanNN | 0.2960 |
| ΔSampEn | PGmean | 0.985 | MMP2/TIMP1, SBP, ΔmeanNN | 0.1717 |
Publisher’s Note: MDPI stays neutral with regard to jurisdictional claims in published maps and institutional affiliations. |
© 2022 by the authors. Licensee MDPI, Basel, Switzerland. This article is an open access article distributed under the terms and conditions of the Creative Commons Attribution (CC BY) license (https://creativecommons.org/licenses/by/4.0/).
Share and Cite
Rodríguez-Carbó, J.; Torres-Arellano, J.M.; Ávila-Vanzzini, N.; Springall, R.; Bojalil, R.; Infante, O.; Lerma, C.; Echeverría, J.C. Association of the Heart Rate Variability Response to Active Standing with the Severity of Calcific Aortic Valve Disease: Novel Insights of a Neurocardiovascular Pathology. J. Clin. Med. 2022, 11, 4771. https://doi.org/10.3390/jcm11164771
Rodríguez-Carbó J, Torres-Arellano JM, Ávila-Vanzzini N, Springall R, Bojalil R, Infante O, Lerma C, Echeverría JC. Association of the Heart Rate Variability Response to Active Standing with the Severity of Calcific Aortic Valve Disease: Novel Insights of a Neurocardiovascular Pathology. Journal of Clinical Medicine. 2022; 11(16):4771. https://doi.org/10.3390/jcm11164771
Chicago/Turabian StyleRodríguez-Carbó, Jimena, José M. Torres-Arellano, Nydia Ávila-Vanzzini, Rashidi Springall, Rafael Bojalil, Oscar Infante, Claudia Lerma, and Juan Carlos Echeverría. 2022. "Association of the Heart Rate Variability Response to Active Standing with the Severity of Calcific Aortic Valve Disease: Novel Insights of a Neurocardiovascular Pathology" Journal of Clinical Medicine 11, no. 16: 4771. https://doi.org/10.3390/jcm11164771
APA StyleRodríguez-Carbó, J., Torres-Arellano, J. M., Ávila-Vanzzini, N., Springall, R., Bojalil, R., Infante, O., Lerma, C., & Echeverría, J. C. (2022). Association of the Heart Rate Variability Response to Active Standing with the Severity of Calcific Aortic Valve Disease: Novel Insights of a Neurocardiovascular Pathology. Journal of Clinical Medicine, 11(16), 4771. https://doi.org/10.3390/jcm11164771