
Comparing Multiple Linear Regression and Machine Learning in Predicting Diabetic Urine Albumin–Creatinine Ratio in a 4-Year Follow-Up Study

 , , ,
, , , 
Abstract
:1. Introduction
- Compare the prediction accuracy between ML and traditional MLR.
- Rank the importance of risk factors, such as demographic and biochemistry data.
2. Methods
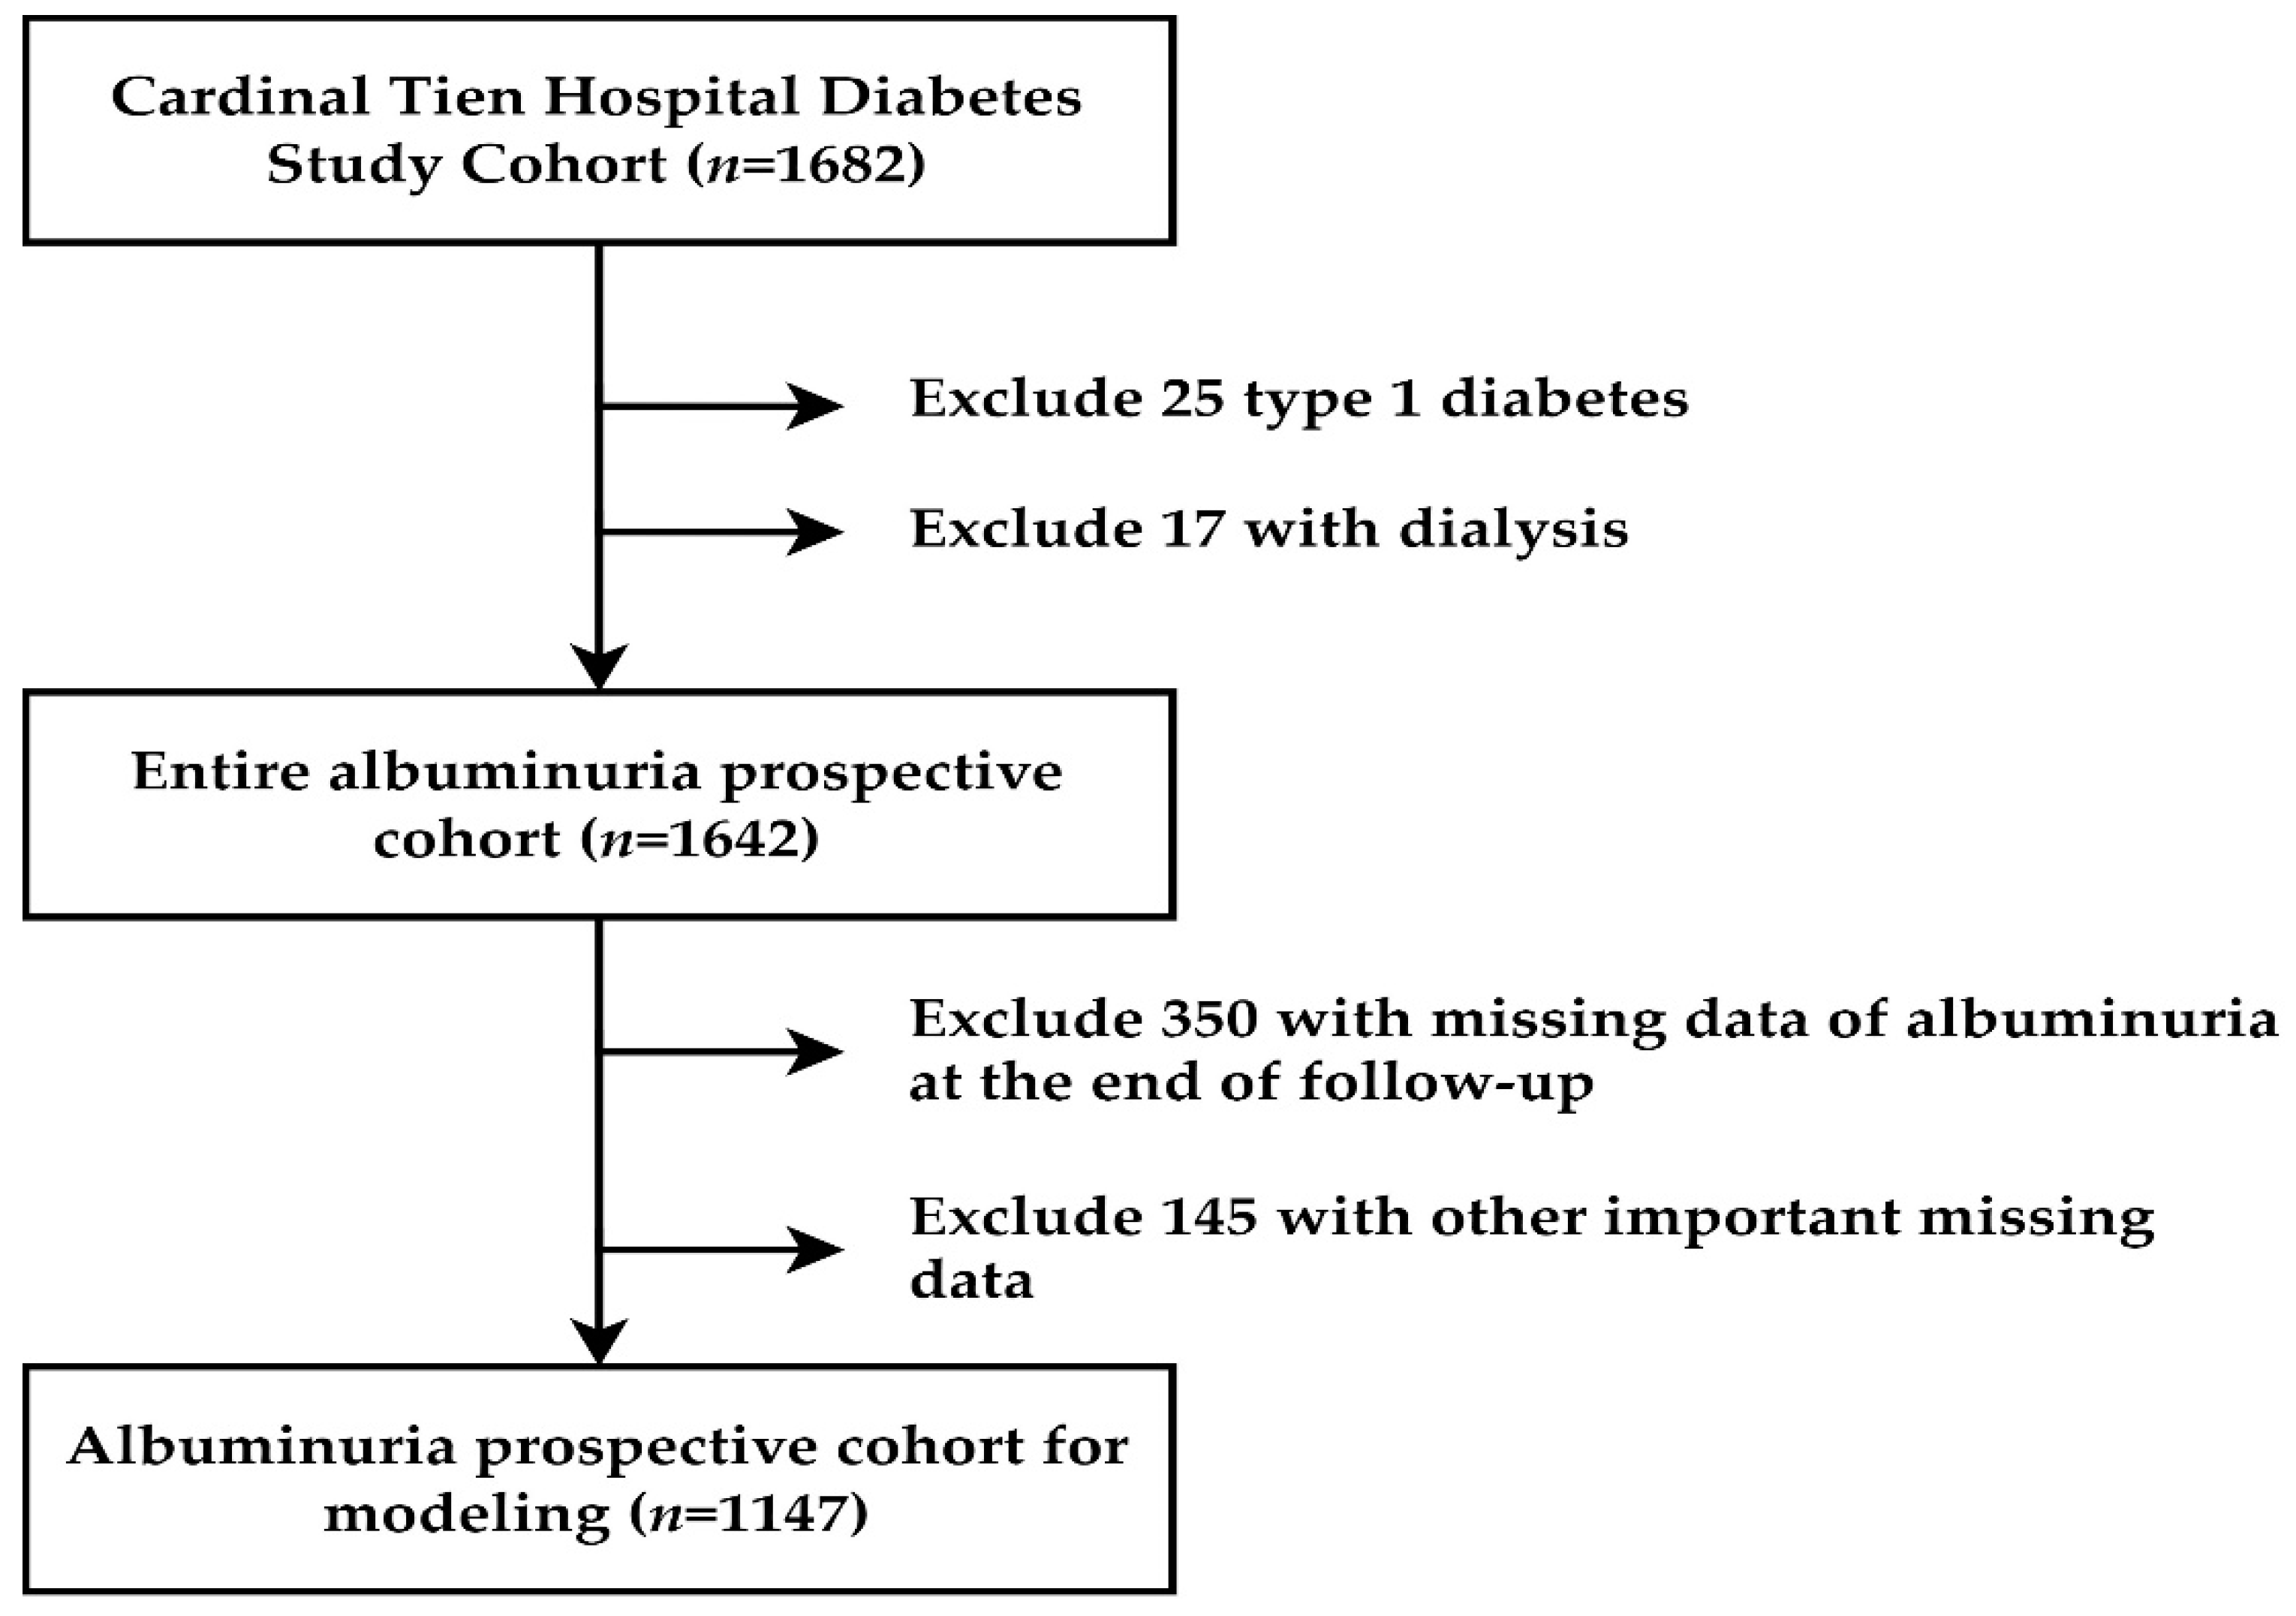
2.1. Participant and Study Design
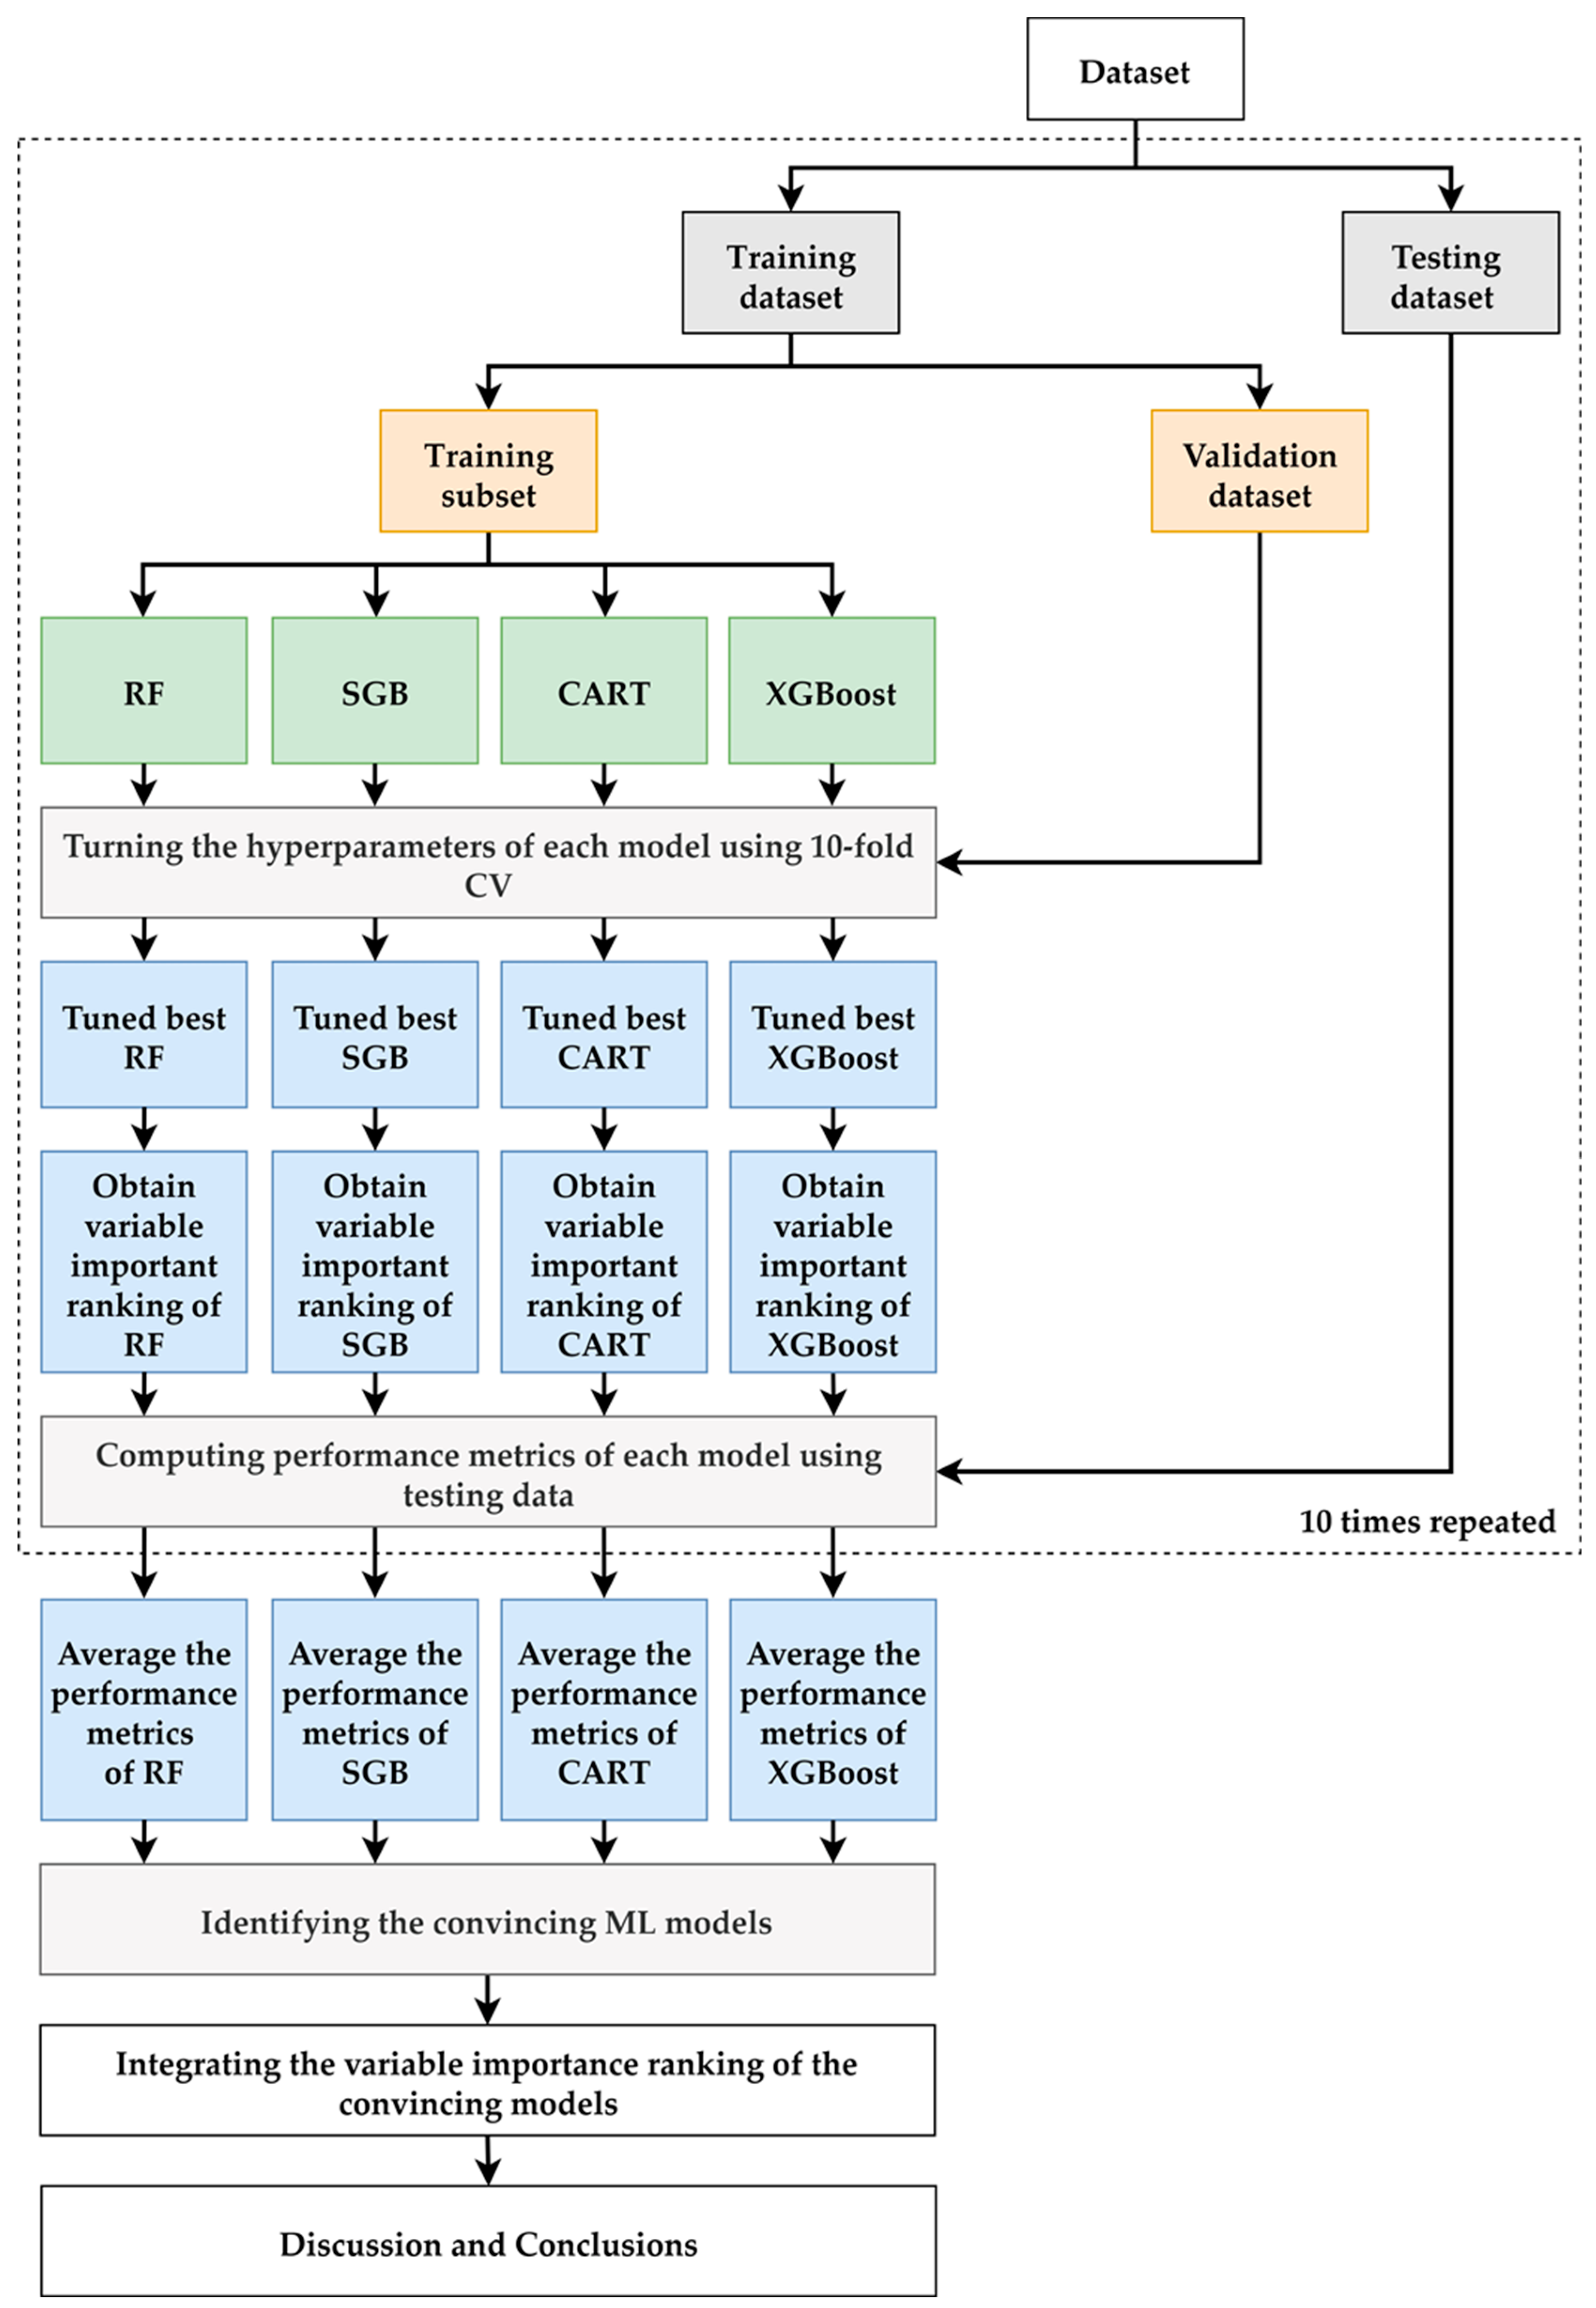
2.2. Proposed Scheme
3. Results
4. Discussion
5. Conclusions
Author Contributions
Funding
Institutional Review Board Statement
Informed Consent Statement
Data Availability Statement
Conflicts of Interest
References
- International Diabetes Federation. IDF Diabetes Atlas, 10th ed.; International Diabetes Federation: Brussels, Belgium, 2021; Available online: http://www.diabetesatlas.org/ (accessed on 22 March 2022).
- Sheen, Y.-J.; Hsu, C.-C.; Jiang, Y.-D.; Huang, C.-N.; Liu, J.-S.; Sheu, W.H.-H. Trends in prevalence and incidence of diabetes mellitus from 2005 to 2014 in Taiwan. J. Formos. Med. Assoc. 2019, 118, S66–S73. [Google Scholar] [CrossRef] [PubMed]
- Tseng, C.H.; Chong, C.K.; Heng, L.T.; Tseng, C.P.; Tai, T.Y. The incidence of type 2 diabetes mellitus in Taiwan. Diabetes Res. Clin. Pract. 2000, 50, S61–S64. [Google Scholar] [CrossRef]
- Chang, C.-J.; Lu, F.-H.; Yang, Y.-C.; Wu, J.-S.; Wu, T.-J.; Chen, M.-S.; Chuang, L.-M.; Tai, T.Y. Epidemiologic study of type 2 diabetes in Taiwan. Diabetes Res. Clin. Pract. 2000, 50, S49–S59. [Google Scholar] [CrossRef]
- Chang, C.H.; Shau, W.Y.; Jiang, Y.D.; Li, H.Y.; Chang, T.J.; Sheu, W.H.; Kwok, C.F.; Ho, L.T.; Chuang, L.M. Type 2 diabetes prevalence and incidence among adults in Taiwan during 1999–2004: A national health insurance data set study. Diabet. Med. 2010, 27, 636–643. [Google Scholar] [CrossRef]
- Alicic, R.Z.; Rooney, M.T.; Tuttle, K.R. Diabetic Kidney Disease: Challenges, Progress, and Possibilities. Clin. J. Am. Soc. Nephrol. 2017, 12, 2032–2045. [Google Scholar] [CrossRef]
- United States Renal Data System. 2020 Usrds Annual Data Report: Epidemiology of Kidney Disease in the United States; National Institutes of Health; National Institute of Diabetes and Digestive and Kidney Diseases: Bethesda, MD, USA, 2020.
- Chiang, J.K.; Chen, J.S.; Kao, Y.H. Comparison of medical outcomes and health care costs at the end of life between dialysis patients with and without cancer: A national population-based study. BMC Nephrol. 2019, 20, 265. [Google Scholar] [CrossRef]
- Taiwan Society of Nephrology. National Health Research Institutes, Taiwan Annual Report on Kidney Disease in Taiwan. 2020. Available online: https://www.tsn.org.tw/UI/L/L002.aspx (accessed on 22 March 2022).
- Nelson, R.G.; Bennett, P.H.; Beck, G.J.; Tan, M.; Knowler, W.C.; Mitch, W.E.; Hirschman, G.H.; Myers, B.D. Development and progression of renal disease in Pima Indians with non-insulin-dependent diabetes mellitus. Diabetic Renal Disease Study Group. N. Engl. J. Med. 1996, 335, 1636–1642. [Google Scholar] [CrossRef]
- Anderson, S.; Meyer, T.W.; Rennke, H.G.; Brenner, B.M. Control of glomerular hypertension limits glomerular injury in rats with reduced renal mass. J. Clin. Investig. 1985, 76, 612–619. [Google Scholar] [CrossRef]
- Anderson, S.; Rennke, H.G.; Brenner, B.M. Therapeutic advantage of converting enzyme inhibitors in arresting progressive renal disease associated with systemic hypertension in the rat. J. Clin. Investig. 1986, 77, 1993–2000. [Google Scholar] [CrossRef] [Green Version]
- Zatz, R.; Dunn, B.R.; Meyer, T.W.; Anderson, S.; Rennke, H.G.; Brenner, B.M. Prevention of diabetic glomerulopathy by pharmacological amelioration of glomerular capillary hypertension. J. Clin. Investig. 1986, 77, 1925–1930. [Google Scholar] [CrossRef] [Green Version]
- Marateb, H.R.; Mansourian, M.; Faghihimani, E.; Amini, M.; Farina, D. A hybrid intelligent system for diagnosing microalbuminuria in type 2 diabetes patients without having to measure urinary albumin. Comput. Biol. Med. 2014, 45, 34–42. [Google Scholar] [CrossRef] [PubMed]
- Ye, Y.; Xiong, Y.; Zhou, Q.; Wu, J.; Li, X.; Xiao, X. Comparison of Machine Learning Methods and Conventional Logistic Regressions for Predicting Gestational Diabetes Using Routine Clinical Data: A Retrospective Cohort Study. J. Diabetes Res. 2020, 2020, 4168340. [Google Scholar] [CrossRef] [PubMed]
- Nusinovici, S.; Tham, Y.C.; Yan, M.Y.C.; Ting, D.S.W.; Li, J.; Sabanayagam, C.; Wong, T.Y.; Cheng, C.Y. Logistic regression was as good as machine learning for predicting major chronic diseases. J. Clin. Epidemiol. 2020, 122, 56–69. [Google Scholar] [CrossRef] [PubMed]
- Miller, D.D.; Brown, E.W. Artificial Intelligence in Medical Practice: The Question to the Answer? Am. J. Med. 2018, 131, 129–133. [Google Scholar] [CrossRef]
- Lu, C.-H.; Pei, D.; Wu, C.-Z.; Kua, H.-C.; Liang, Y.-J.; Chen, Y.-L.; Lin, J.-D. Predictors of abnormality in thallium myocardial perfusion scans for type 2 diabetes. Heart Vessel. 2021, 36, 180–188. [Google Scholar] [CrossRef]
- Tseng, C.-J.; Lu, C.-J.; Chang, C.-C.; Chen, G.-D.; Cheewakriangkrai, C. Integration of data mining classification techniques and ensemble learning to identify risk factors and diagnose ovarian cancer recurrence. Artif. Intell. Med. 2017, 78, 47–54. [Google Scholar] [CrossRef]
- Ting, W.-C.; Chang, H.-R.; Chang, C.-C.; Lu, C.-J. Developing a Novel Machine Learning-Based Classification Scheme for Predicting SPCs in Colorectal Cancer Survivors. Appl. Sci. 2020, 10, 1355. [Google Scholar] [CrossRef] [Green Version]
- Shih, C.-C.; Lu, C.-J.; Chen, G.-D.; Chang, C.-C. Risk Prediction for Early Chronic Kidney Disease: Results from an Adult Health Examination Program of 19,270 Individuals. Int. J. Environ. Res. Public Health 2020, 17, 4973. [Google Scholar] [CrossRef]
- Lee, T.-S.; Chen, I.-F.; Chang, T.-J.; Lu, C.-J. Forecasting Weekly Influenza Outpatient Visits Using a Two-Dimensional Hierarchical Decision Tree Scheme. Int. J. Environ. Res. Public Health 2020, 17, 4743. [Google Scholar] [CrossRef]
- Chang, C.-C.; Yeh, J.-H.; Chen, Y.-M.; Jhou, M.-J.; Lu, C.-J. Clinical Predictors of Prolonged Hospital Stay in Patients with Myasthenia Gravis: A Study Using Machine Learning Algorithms. J. Clin. Med. 2021, 10, 4393. [Google Scholar] [CrossRef]
- Chang, C.-C.; Huang, T.-H.; Shueng, P.-W.; Chen, S.-H.; Chen, C.-C.; Lu, C.-J.; Tseng, Y.-J. Developing a Stacked Ensemble-Based Classification Scheme to Predict Second Primary Cancers in Head and Neck Cancer Survivors. Int. J. Environ. Res. Public Health 2021, 18, 12499. [Google Scholar] [CrossRef] [PubMed]
- Chiu, Y.-L.; Jhou, M.-J.; Lee, T.-S.; Lu, C.-J.; Chen, M.-S. Health Data-Driven Machine Learning Algorithms Applied to Risk Indicators Assessment for Chronic Kidney Disease. Risk Manag. Healthc. Policy 2021, 14, 4401–4412. [Google Scholar] [CrossRef] [PubMed]
- Wu, T.-E.; Chen, H.-A.; Jhou, M.-J.; Chen, Y.-N.; Chang, T.-J.; Lu, C.-J. Evaluating the Effect of Topical Atropine Use for Myopia Control on Intraocular Pressure by Using Machine Learning. J. Clin. Med. 2021, 10, 111. [Google Scholar] [CrossRef]
- Wu, C.-W.; Shen, H.-L.; Lu, C.-J.; Chen, S.-H.; Chen, H.-Y. Comparison of Different Machine Learning Classifiers for Glaucoma Diagnosis Based on Spectralis OCT. Diagnostics 2021, 11, 1718. [Google Scholar] [CrossRef]
- Chang, C.-C.; Yeh, J.-H.; Chiu, H.-C.; Chen, Y.-M.; Jhou, M.-J.; Liu, T.-C.; Lu, C.-J. Utilization of Decision Tree Algorithms for Supporting the Prediction of Intensive Care Unit Admission of Myasthenia Gravis: A Machine Learning-Based Approach. J. Pers. Med. 2022, 12, 32. [Google Scholar] [CrossRef] [PubMed]
- Breiman, L.; Friedman, J.H.; Olshen, R.A.; Stone, C.J. Classification and Regression Trees. Biometrics 1984, 40, 874. [Google Scholar] [CrossRef] [Green Version]
- Patel, N.; Upadhyay, S. Study of various decision tree pruning methods with their empirical comparison in WEKA. Int. J. Comput. Appl. 2012, 60, 20–25. [Google Scholar] [CrossRef]
- Tierney, N.J.; Harden, F.A.; Harden, M.J.; Mengersen, K.L. Using decision trees to understand structure in missing data. BMJ Open 2015, 5, e007450. [Google Scholar] [CrossRef] [Green Version]
- Breiman, L. Random forests. Mach. Learn. 2001, 45, 5–32. [Google Scholar] [CrossRef] [Green Version]
- Calle, M.; Urrea, V. Letter to the editor: Stability of random forest importance measures. Brief. Bioinform. 2011, 12, 86–89. [Google Scholar] [CrossRef] [Green Version]
- Friedman, J. Greedy function approximation: A gradient boosting machine. Ann. Stat. 2001, 29, 1189–1232. [Google Scholar] [CrossRef]
- Friedman, J. Stochastic gradient boosting. Comput. Stat. Data Anal. 2002, 38, 367–378. [Google Scholar] [CrossRef]
- Chen, T.; Guestrin, C. XGBoost: A Scalable Tree Boosting System. In Proceedings of the 22nd ACM SIGKDD International Conference on Knowledge Discovery and Data Mining, San Francisco, CA, USA, 13–17 August 2016; pp. 785–794. [Google Scholar]
- Torlay, L.; Perrone-Bertolotti, M.; Thomas, E.; Baciu, M. Machine learning–XGBoost analysis of language networks to classify patients with epilepsy. Brain Inform. 2017, 4, 159–169. [Google Scholar] [CrossRef]
- Breiman, L.; Cutler, A.; Liaw, A.; Wiener, M. randomForest: Breiman and Cutler’s Random Forests for Classification and Regression. R Package Version, 4.6-14. 2022. Available online: https://CRAN.R-project.org/package=randomForest (accessed on 1 January 2022).
- Greenwell, B.; Boehmke, B.; Cunningham, J. Gbm: Generalized Boosted Regression Models. R Package Version, 2.1.8. 2020. Available online: https://CRAN.R-project.org/package=gbm (accessed on 1 January 2022).
- Therneau, T.; Atkinson, B. Rpart: Recursive Partitioning and Regression Trees. R Package Version, 4.1.15. 2022. Available online: https://CRAN.R-project.org/package=rpart (accessed on 1 January 2022).
- Chen, T.; He, T.; Benesty, M.; Khotilovich, V.; Tang, Y.; Cho, H.; Chen, K.; Mitchell, R.; Cano, I.; Zhou, T.; et al. Xgboost: Extreme Gradient Boosting. R Package Version, 1.5.0.2. 2022. Available online: https://CRAN.R-project.org/package=xgboost (accessed on 1 January 2022).
- Kuhn, M. Caret: Classification and Regression Training. R Package Version, 6.0-90. 2022. Available online: https://CRAN.R-project.org/package=caret (accessed on 1 January 2022).
- Diebold, F.X.; Mariano, R.S. Comparing Predictive Accuracy. J. Bus. Econ. Stat. 1995, 20, 134–144. [Google Scholar] [CrossRef]
- Gross, J.L.; De Azevedo, M.J.; Silveiro, S.P.; Canani, L.H.; Caramori, M.L.; Zelmanovitz, T. Diabetic nephropathy: Diagnosis, prevention, and treatment. Diabetes Care 2005, 28, 164–176. [Google Scholar] [CrossRef] [PubMed] [Green Version]
- Harjutsalo, V.; Groop, P.-H. Epidemiology and risk factors for diabetic kidney disease. Adv. Chronic Kidney Dis. 2014, 21, 260–266. [Google Scholar] [CrossRef]
- Duan, J.; Wang, C. Prevalence and risk factors of chronic kidney disease and diabetic kidney disease in Chinese rural residents: A cross-sectional survey. Sci. Rep. 2019, 9, 10408. [Google Scholar] [CrossRef]
- Hussain, S.; Jamali, M.C.; Habib, A.; Hussain, M.S.; Akhtar, M.; Najmi, A.K. Diabetic kidney disease: An overview of prevalence, risk factors, and biomarkers. Clin. Epidemiol. Glob. Health 2021, 9, 2–6. [Google Scholar] [CrossRef]
- Wu, X.Q.; Zhang, D.D.; Wang, Y.N.; Tan, Y.Q.; Yu, X.Y.; Zhao, Y.Y. AGE/RAGE in diabetic kidney disease and ageing kidney. Free Radic. Biol. Med. 2021, 171, 260–271. [Google Scholar] [CrossRef]
- Newman, D.J.; Mattock, M.B.; Dawnay, A.B.; Kerry, S.; McGuire, A.; Yaqoob, M.; Hitman, G.A.; Hawke, C. Systematic review on urine albumin testing for early detection of diabetic complications. Health Technol. Assess. 2005, 9, 1–122. [Google Scholar] [CrossRef] [Green Version]
- Hong, J.W.; Ku, C.R.; Noh, J.H.; Ko, K.S.; Rhee, B.D.; Kim, D.-J. Association between low-grade albuminuria and cardiovascular risk in Korean adults: The 2011–2012 Korea National Health and Nutrition Examination Survey. PLoS ONE 2015, 10, e0118866. [Google Scholar] [CrossRef] [PubMed] [Green Version]
- Gansevoort, R.T.; Matsushita, K.; Van Der Velde, M.; Astor, B.C.; Woodward, M.; Levey, A.S.; De Jong, P.E.; Coresh, J. Lower estimated GFR and higher albuminuria are associated with adverse kidney outcomes. A collaborative meta-analysis of general and high-risk population cohorts. Kidney Int. 2011, 80, 93–104. [Google Scholar] [CrossRef] [PubMed] [Green Version]
- Hsu, C.C.; Brancati, F.L.; Astor, B.C.; Kao, W.H.; Steffes, M.W.; Folsom, A.R.; Coresh, J. Blood pressure, atherosclerosis, and albuminuria in 10,113 participants in the atherosclerosis risk in communities study. J. Hypertens. 2009, 27, 397–409. [Google Scholar] [CrossRef] [PubMed]
- Fagerudd, J.A.; Tarnow, L.; Jacobsen, P.; Stenman, S.; Nielsen, F.S.; Pettersson-Fernholm, K.J.; Grönhagen-Riska, C.; Parving, H.H.; Groop, P.H. Predisposition to essential hypertension and development of diabetic nephropathy in NIDDM. Diabetes 1998, 47, 439–444. [Google Scholar] [CrossRef]
- Ruggenenti, P.; Fassi, A.; Ilieva, A.P.; Bruno, S.; Iliev, I.P.; Brusegan, V.; Rubis, N.; Gherardi, G.; Arnoldi, F.; Ganeva, M.; et al. Preventing microalbuminuria in type 2 diabetes. N. Engl. J. Med. 2004, 351, 1941–1951. [Google Scholar] [CrossRef] [Green Version]
- Shoji, T.; Emoto, M.; Kawagishi, T.; Kimoto, E.; Yamada, A.; Tabata, T.; Ishimura, E.; Inaba, M.; Okuno, Y.; Nishizawa, Y. Atherogenic lipoprotein changes in diabetic nephropathy. Atherosclerosis 2001, 156, 425–433. [Google Scholar] [CrossRef]
- Jenkins, A.J.; Lyons, T.J.; Zheng, D.; Otvos, J.D.; Lackland, D.T.; Mcgee, D.; Garvey, W.T.; Klein, R.L.; The DCCT/EDIC Research Group. Lipoproteins in the dcct/edic cohort: Associations with diabetic nephropathy. Kidney Int. 2003, 64, 817–828. [Google Scholar] [CrossRef] [Green Version]
- Tolonen, N.; Forsblom, C.; Thorn, L.; Wadén, J.; Rosengård-Bärlund, M.; Saraheimo, M.; Feodoroff, M.; Mäkinen, V.P.; Gordin, D.; Taskinen, M.R.; et al. Lipid abnormalities predict progression of renal disease in patients with type 1 diabetes. Diabetologia 2009, 52, 2522–2530. [Google Scholar] [CrossRef] [Green Version]
- Sacks, F.M.; Hermans, M.P.; Fioretto, P.; Valensi, P.; Davis, T.; Horton, E.; Wanner, C.; Al-Rubeaan, K.; Aronson, R.; Barzon, I.; et al. Association between plasma triglycerides and high-density lipoprotein cholesterol and microvascular kidney disease and retinopathy in type 2 diabetes mellitus: A global case-control study in 13 countries. Circulation 2014, 129, 999–1008. [Google Scholar] [CrossRef]
- Sun, X.; Xiao, Y.; Li, P.M.; Ma, X.Y.; Sun, X.J.; Lv, W.S.; Wu, Y.L.; Liu, P.; Wang, Y.G. Association of serum high-density lipoprotein cholesterol with microalbuminuria in type 2 diabetes patients. Lipids Health Dis. 2018, 17, 229. [Google Scholar] [CrossRef] [Green Version]
- Vaziri, N.D. Lipotoxicity and impaired high density lipoprotein-mediated reverse cholesterol transport in chronic kidney disease. J. Ren. Nutr. 2010, 20, S35–S43. [Google Scholar] [CrossRef] [PubMed]
- Li, C.; Gu, Q. Protective effect of paraoxonase 1 of high-density lipoprotein in type 2 diabetic patients with nephropathy. Nephrology 2009, 14, 514–520. [Google Scholar] [CrossRef] [PubMed]
- Drew, B.G.; Duffy, S.J.; Formosa, M.F.; Natoli, A.K.; Henstridge, D.C.; Penfold, S.A.; Thomas, W.G.; Mukhamedova, N.; de Courten, B.; Forbes, J.M.; et al. High-density lipoprotein modulates glucose metabolism in patients with type 2 diabetes mellitus. Circulation 2009, 119, 2103–2111. [Google Scholar] [CrossRef] [PubMed] [Green Version]
- Brunham, L.R.; Kruit, J.K.; Hayden, M.R.; Verchere, C.B. Cholesterol in β-cell dysfunction: The emerging connection between HDL cholesterol and Type 2 diabetes. Curr. Diabetes Rep. 2010, 10, 55–60. [Google Scholar] [CrossRef]
- Bilous, R. Microvascular disease: What does the UKPDS tell us about diabetic nephropathy? Diabet Med. 2003, 20, 25–29. [Google Scholar] [CrossRef]
- The Diabetes Control and Complications (DCCT) Research Group. Effect of intensive therapy on the development and progression of diabetic nephropathy in the Diabetes Control and Complications Trial. Kidney Int. 1995, 47, 1703–1720. [Google Scholar] [CrossRef] [Green Version]
- Lo, C.; Zoungas, S. Intensive glucose control in patients with diabetes prevents onset and progression of microalbuminuria, but effects on end-stage kidney disease are still uncertain. Evid. Based Med. 2017, 22, 219–220. [Google Scholar] [CrossRef]
- Genuth, S.; Eastman, R.; Kahn, R.; Klein, R.; Lachin, J.; Lebovitz, H.; Nathan, D.; Vinicor, F.; American Diabetes Association. Implications of the United Kingdom prospective diabetes study. Diabetes Care 2003, 26, S28–S32. [Google Scholar] [CrossRef] [Green Version]
- Chen, I.-F.; Lu, C.-J. Sales forecasting by combining clustering and machine-learning techniques for computer retailing. Neural Comput. Appl. 2017, 28, 2633–2647. [Google Scholar] [CrossRef]
- Jiang, F.; Jiang, Y.; Zhi, H.; Dong, Y.; Li, H.; Ma, S.; Wang, Y.; Dong, Q.; Shen, H.; Wang, Y. Artificial intelligence in healthcare: Past, present and future. Stroke Vasc. Neurol. 2017, 2, 230. [Google Scholar] [CrossRef]
- Koteluk, O.; Wartecki, A.; Mazurek, S.; Kołodziejczak, I.; Mackiewicz, A. How Do Machines Learn? Artificial Intelligence as a New Era in Medicine. J. Pers. Med. 2021, 11, 32. [Google Scholar] [CrossRef] [PubMed]


| Variables | Description | Unit |
|---|---|---|
| Sex | Male/Female | - |
| Age | Patient age | year |
| Body mass index | Body mass index | Kg/m2 |
| Duration of diabetes | Duration of diabetes | year |
| Smoking | No/Yes | - |
| Alcohol | No/Yes | - |
| Baseline fasting plasma glucose | Fasting plasma glucose baseline | mg/dL |
| Baseline glycated hemoglobin | HbA1c (Glycated hemoglobin) baseline | % |
| Baseline triglyceride | Triglyceride baseline | mg/dL |
| Baseline high-density lipoprotein cholesterol | High-density lipoprotein cholesterol baseline | mg/dL |
| Baseline low-density lipoprotein cholesterol | Low-density lipoprotein cholesterol baseline | mg/dL |
| Baseline alanine aminotransferase baseline | Alanine aminotransferase baseline | U/L |
| Baseline creatinine | Creatinine baseline | mg/dL |
| Baseline systolic blood pressure | Systolic blood pressure baseline | mmHg |
| Baseline diastolic blood pressure | Diastolic blood pressure baseline | mmHg |
| uACR at the end of follow-up | Urine albumin to creatinine ratio = albumin (mg/dL)/urine creatinine (mg/dL) follow up 4 year | mg/g |
| Metrics | Description | Calculation |
|---|---|---|
| MAPE | Mean Absolute Percentage Error | |
| SMAPE | Symmetric Mean Absolute Percentage Error | |
| RAE | Relative Absolute Error |
| Variables | Mean ± SD | N |
|---|---|---|
| Age | 63.82 ± 11.49 | 1123 |
| BMI | 26.45 ± 3.95 | 1134 |
| Duration of diabetes | 14.13 ± 7.65 | 1137 |
| Baseline fasting plasma glucose | 149.84 ± 42.80 | 1146 |
| Baseline glycated hemoglobin | 7.74 ± 1.49 | 1140 |
| Baseline triglyceride | 142.99 ± 94.55 | 1144 |
| Baseline high-density lipoprotein cholesterol | 44.87 ± 12.00 | 845 |
| Baseline low-density lipoprotein cholesterol | 98.82 ± 27.73 | 1129 |
| Baseline alanine aminotransferase baseline | 29.38 ± 21.48 | 1134 |
| Baseline creatinine | 0.90 ± 0.37 | 1093 |
| Baseline systolic blood pressure | 131.13 ± 14.07 | 969 |
| Baseline diastolic blood pressure | 75.91 ± 11.66 | 969 |
| uACR at the end of follow-up | 195.30 ± 711.98 | 1147 |
| N (%) | N | |
| Sex | 1147 | |
| Male | 608 (53.01%) | |
| Female | 539 (46.99%) | |
| Smoking | 716 | |
| No | 430 (60.06%) | |
| Yes | 286 (39.94%) | |
| Alcohol | 789 | |
| No | 715 (90.62%) | |
| Yes | 74 (9.38%) |
| MAPE | SMAPE | RAE | |
|---|---|---|---|
| MLR | 18.245 (4.79) | 1.545 (0.04) | 1.126 (0.17) |
| RF | 16.174 (4.82) | 1.266 (0.05) | 1.072 (0.19) |
| SGB | 14.850 (3.09) | 1.522 (0.07) | 1.040 (0.16) |
| CART | 9.528 (1.76) | 1.312 (0.06) | 0.841 (0.10) |
| XGBoost | 11.872 (2.80) | 1.274 (0.06) | 0.915 (0.11) |
| RF | SGB | CART | XGBoost | |
|---|---|---|---|---|
| MLR | 41.736 (0.001) ** | 20.814 (0.001) ** | 30.680 (0.001) ** | 44.489 (0.001) ** |
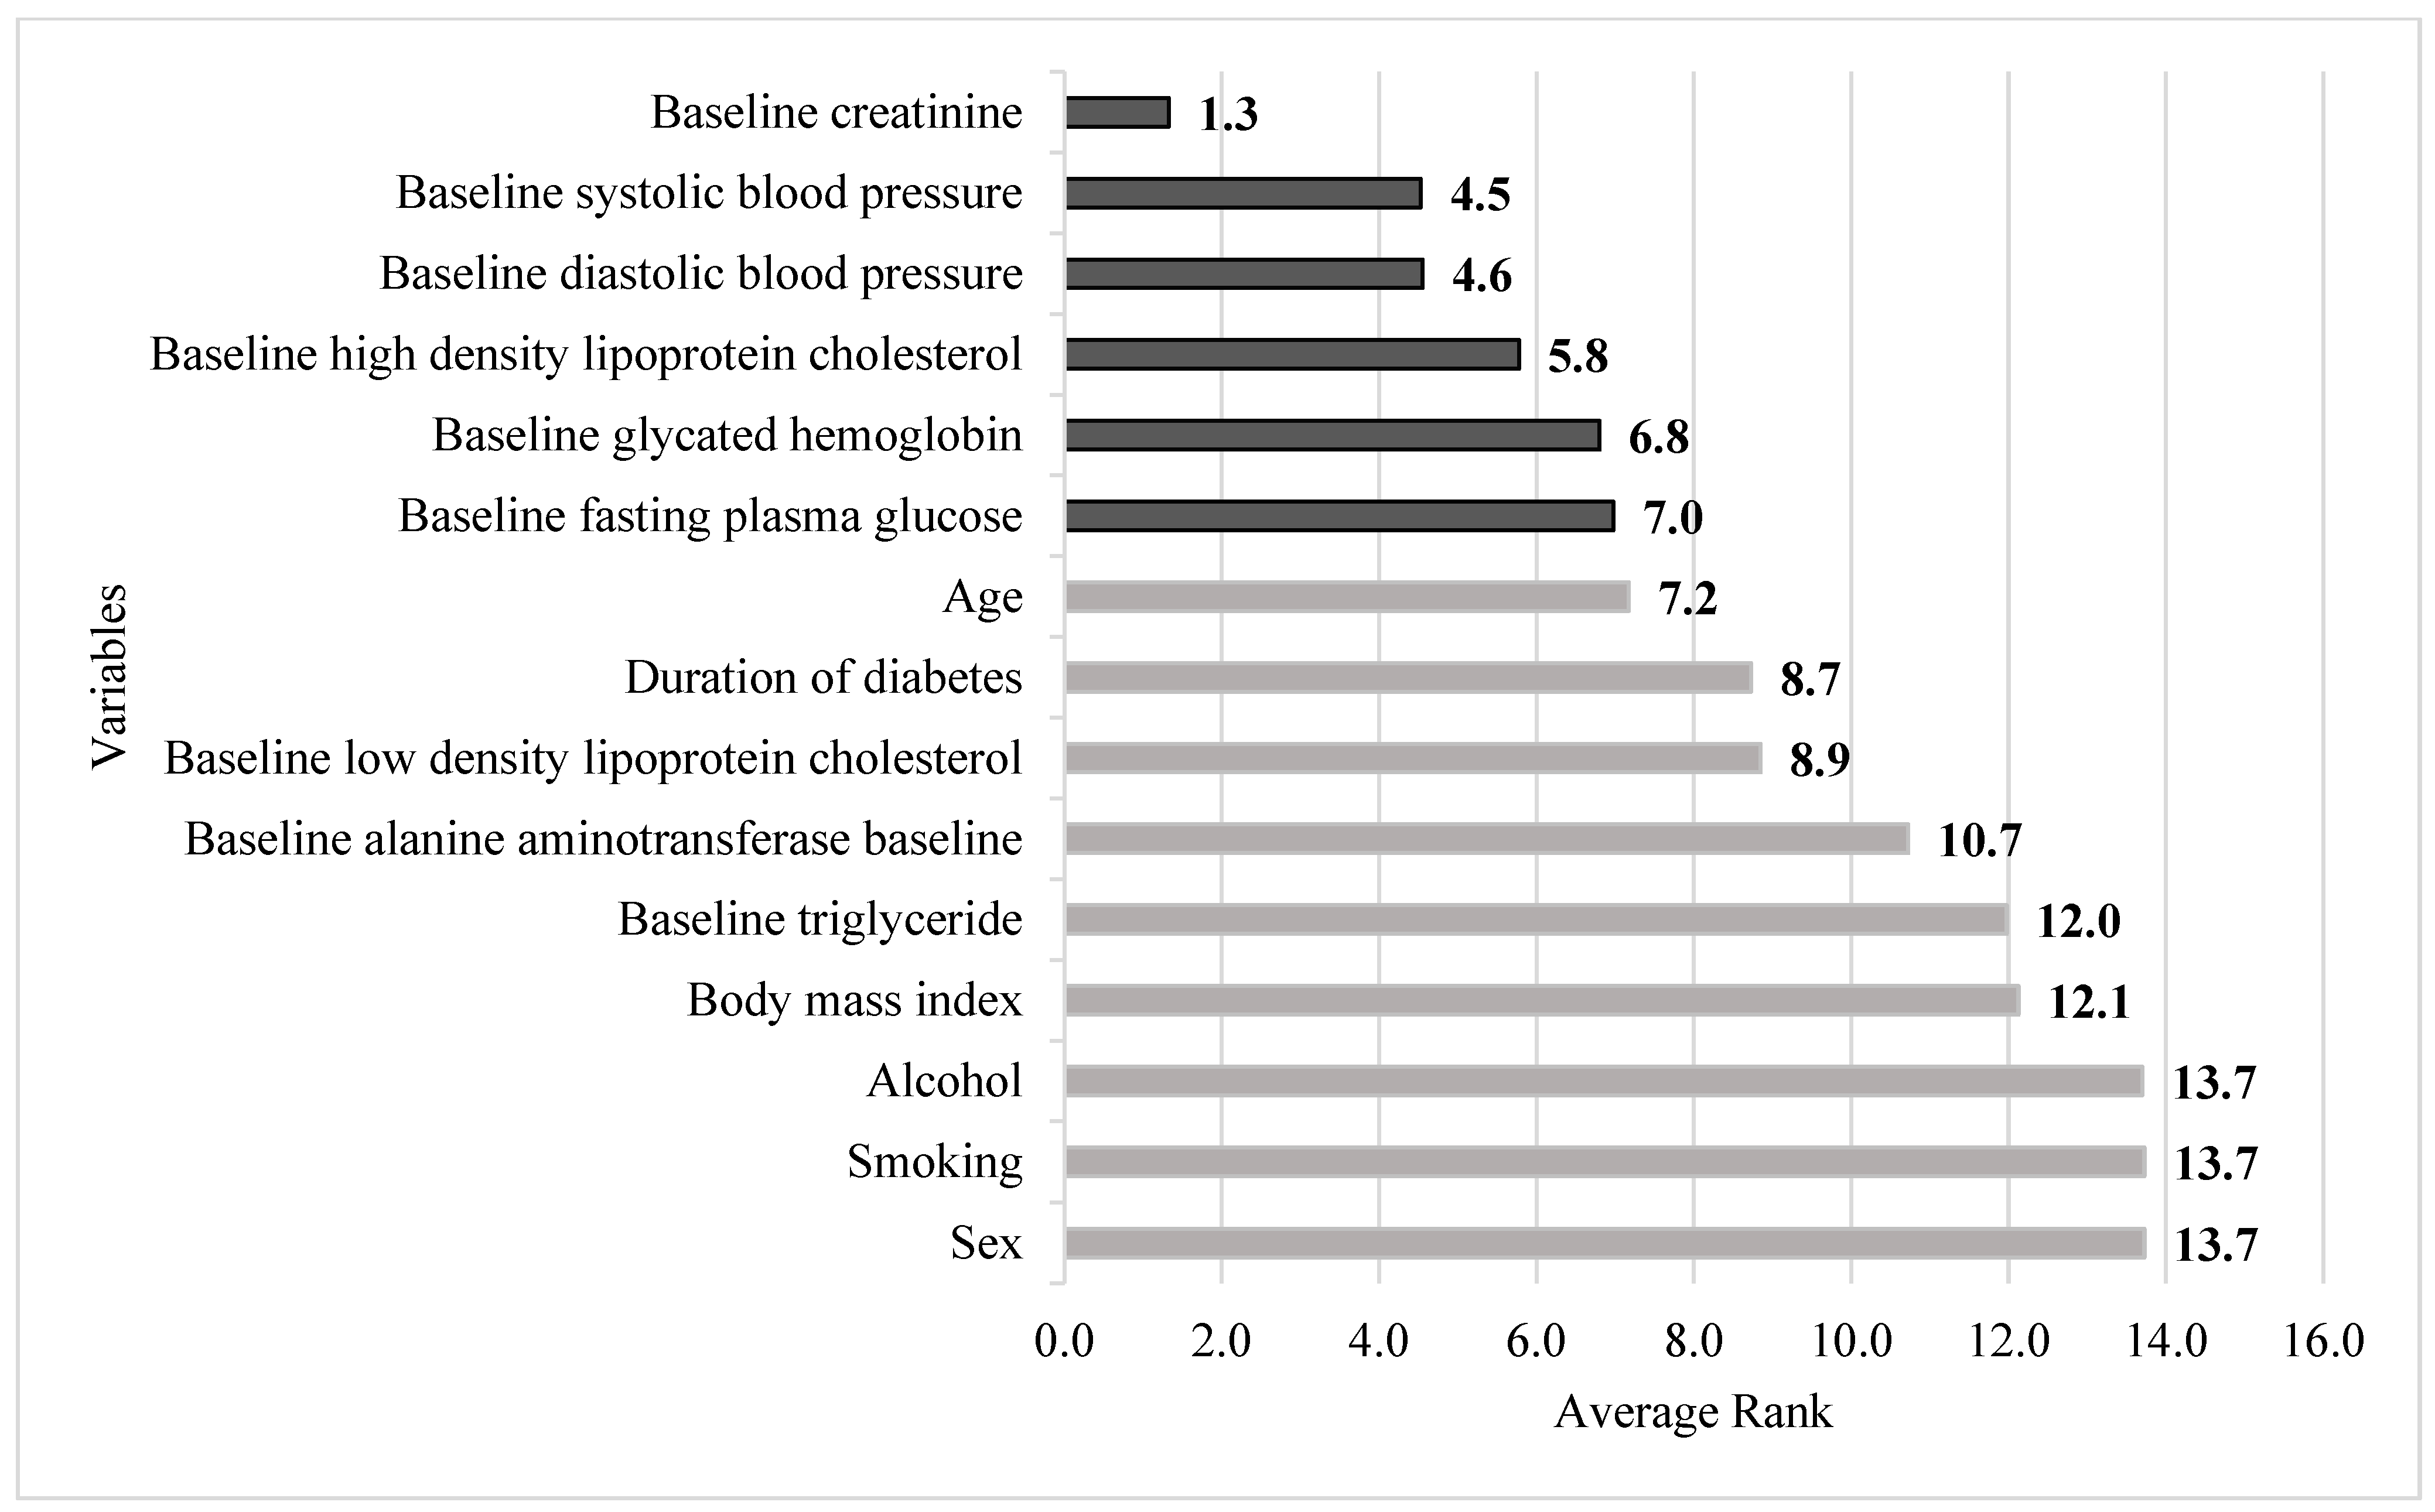
| Variables | RF | SGB | CART | XGBoost | Average | |
|---|---|---|---|---|---|---|
| Sex | 11.3 | 14.9 | 15.0 | 13.7 | 13.7 | |
| Age | 4.8 | 9.0 | 9.5 | 5.4 | 7.2 | |
| Body mass index | 14.9 | 11.8 | 12.0 | 9.8 | 12.1 | |
| Duration of diabetes | 8.8 | 7.0 | 10.7 | 8.4 | 8.7 | Rank value |
| Smoking | 10.8 | 14.4 | 15.0 | 14.7 | 13.7 | 1.0~1.4 |
| Alcohol | 11.6 | 13.6 | 15.0 | 14.6 | 13.7 | 1.5~2.4 |
| Baseline fasting plasma glucose | 5.4 | 6.3 | 10.9 | 5.3 | 7.0 | 2.5~3.4 |
| Baseline glycated hemoglobin | 5.8 | 5.0 | 10.3 | 6.1 | 6.8 | 3.5~4.4 |
| Baseline triglyceride | 11.9 | 10.2 | 12.7 | 13.1 | 12.0 | 4.5~5.4 |
| Baseline high-density lipoprotein cholesterol | 7.7 | 2.8 | 5.8 | 6.8 | 5.8 | 5.5~ |
| Baseline low-density lipoprotein cholesterol | 5.8 | 10.9 | 11.2 | 7.5 | 8.9 | |
| Baseline alanine aminotransferase baseline | 9.6 | 8.3 | 12.4 | 12.6 | 10.7 | |
| Baseline creatinine | 1.3 | 1.1 | 1.8 | 1.1 | 1.3 | |
| Baseline systolic blood pressure | 5.0 | 4.9 | 4.3 | 3.9 | 4.5 | |
| Baseline diastolic blood pressure | 5.3 | 4.1 | 4.1 | 4.7 | 4.6 |
Publisher’s Note: MDPI stays neutral with regard to jurisdictional claims in published maps and institutional affiliations. |
© 2022 by the authors. Licensee MDPI, Basel, Switzerland. This article is an open access article distributed under the terms and conditions of the Creative Commons Attribution (CC BY) license (https://creativecommons.org/licenses/by/4.0/).
Share and Cite
Huang, L.-Y.; Chen, F.-Y.; Jhou, M.-J.; Kuo, C.-H.; Wu, C.-Z.; Lu, C.-H.; Chen, Y.-L.; Pei, D.; Cheng, Y.-F.; Lu, C.-J. Comparing Multiple Linear Regression and Machine Learning in Predicting Diabetic Urine Albumin–Creatinine Ratio in a 4-Year Follow-Up Study. J. Clin. Med. 2022, 11, 3661. https://doi.org/10.3390/jcm11133661
Huang L-Y, Chen F-Y, Jhou M-J, Kuo C-H, Wu C-Z, Lu C-H, Chen Y-L, Pei D, Cheng Y-F, Lu C-J. Comparing Multiple Linear Regression and Machine Learning in Predicting Diabetic Urine Albumin–Creatinine Ratio in a 4-Year Follow-Up Study. Journal of Clinical Medicine. 2022; 11(13):3661. https://doi.org/10.3390/jcm11133661
Chicago/Turabian StyleHuang, Li-Ying, Fang-Yu Chen, Mao-Jhen Jhou, Chun-Heng Kuo, Chung-Ze Wu, Chieh-Hua Lu, Yen-Lin Chen, Dee Pei, Yu-Fang Cheng, and Chi-Jie Lu. 2022. "Comparing Multiple Linear Regression and Machine Learning in Predicting Diabetic Urine Albumin–Creatinine Ratio in a 4-Year Follow-Up Study" Journal of Clinical Medicine 11, no. 13: 3661. https://doi.org/10.3390/jcm11133661
APA StyleHuang, L.-Y., Chen, F.-Y., Jhou, M.-J., Kuo, C.-H., Wu, C.-Z., Lu, C.-H., Chen, Y.-L., Pei, D., Cheng, Y.-F., & Lu, C.-J. (2022). Comparing Multiple Linear Regression and Machine Learning in Predicting Diabetic Urine Albumin–Creatinine Ratio in a 4-Year Follow-Up Study. Journal of Clinical Medicine, 11(13), 3661. https://doi.org/10.3390/jcm11133661