
Upregulation of Endothelin-1 May Predict Chemotherapy-Induced Cardiotoxicity in Women with Breast Cancer

 , ,
, ,
Abstract
1. Introduction
2. Materials and Methods
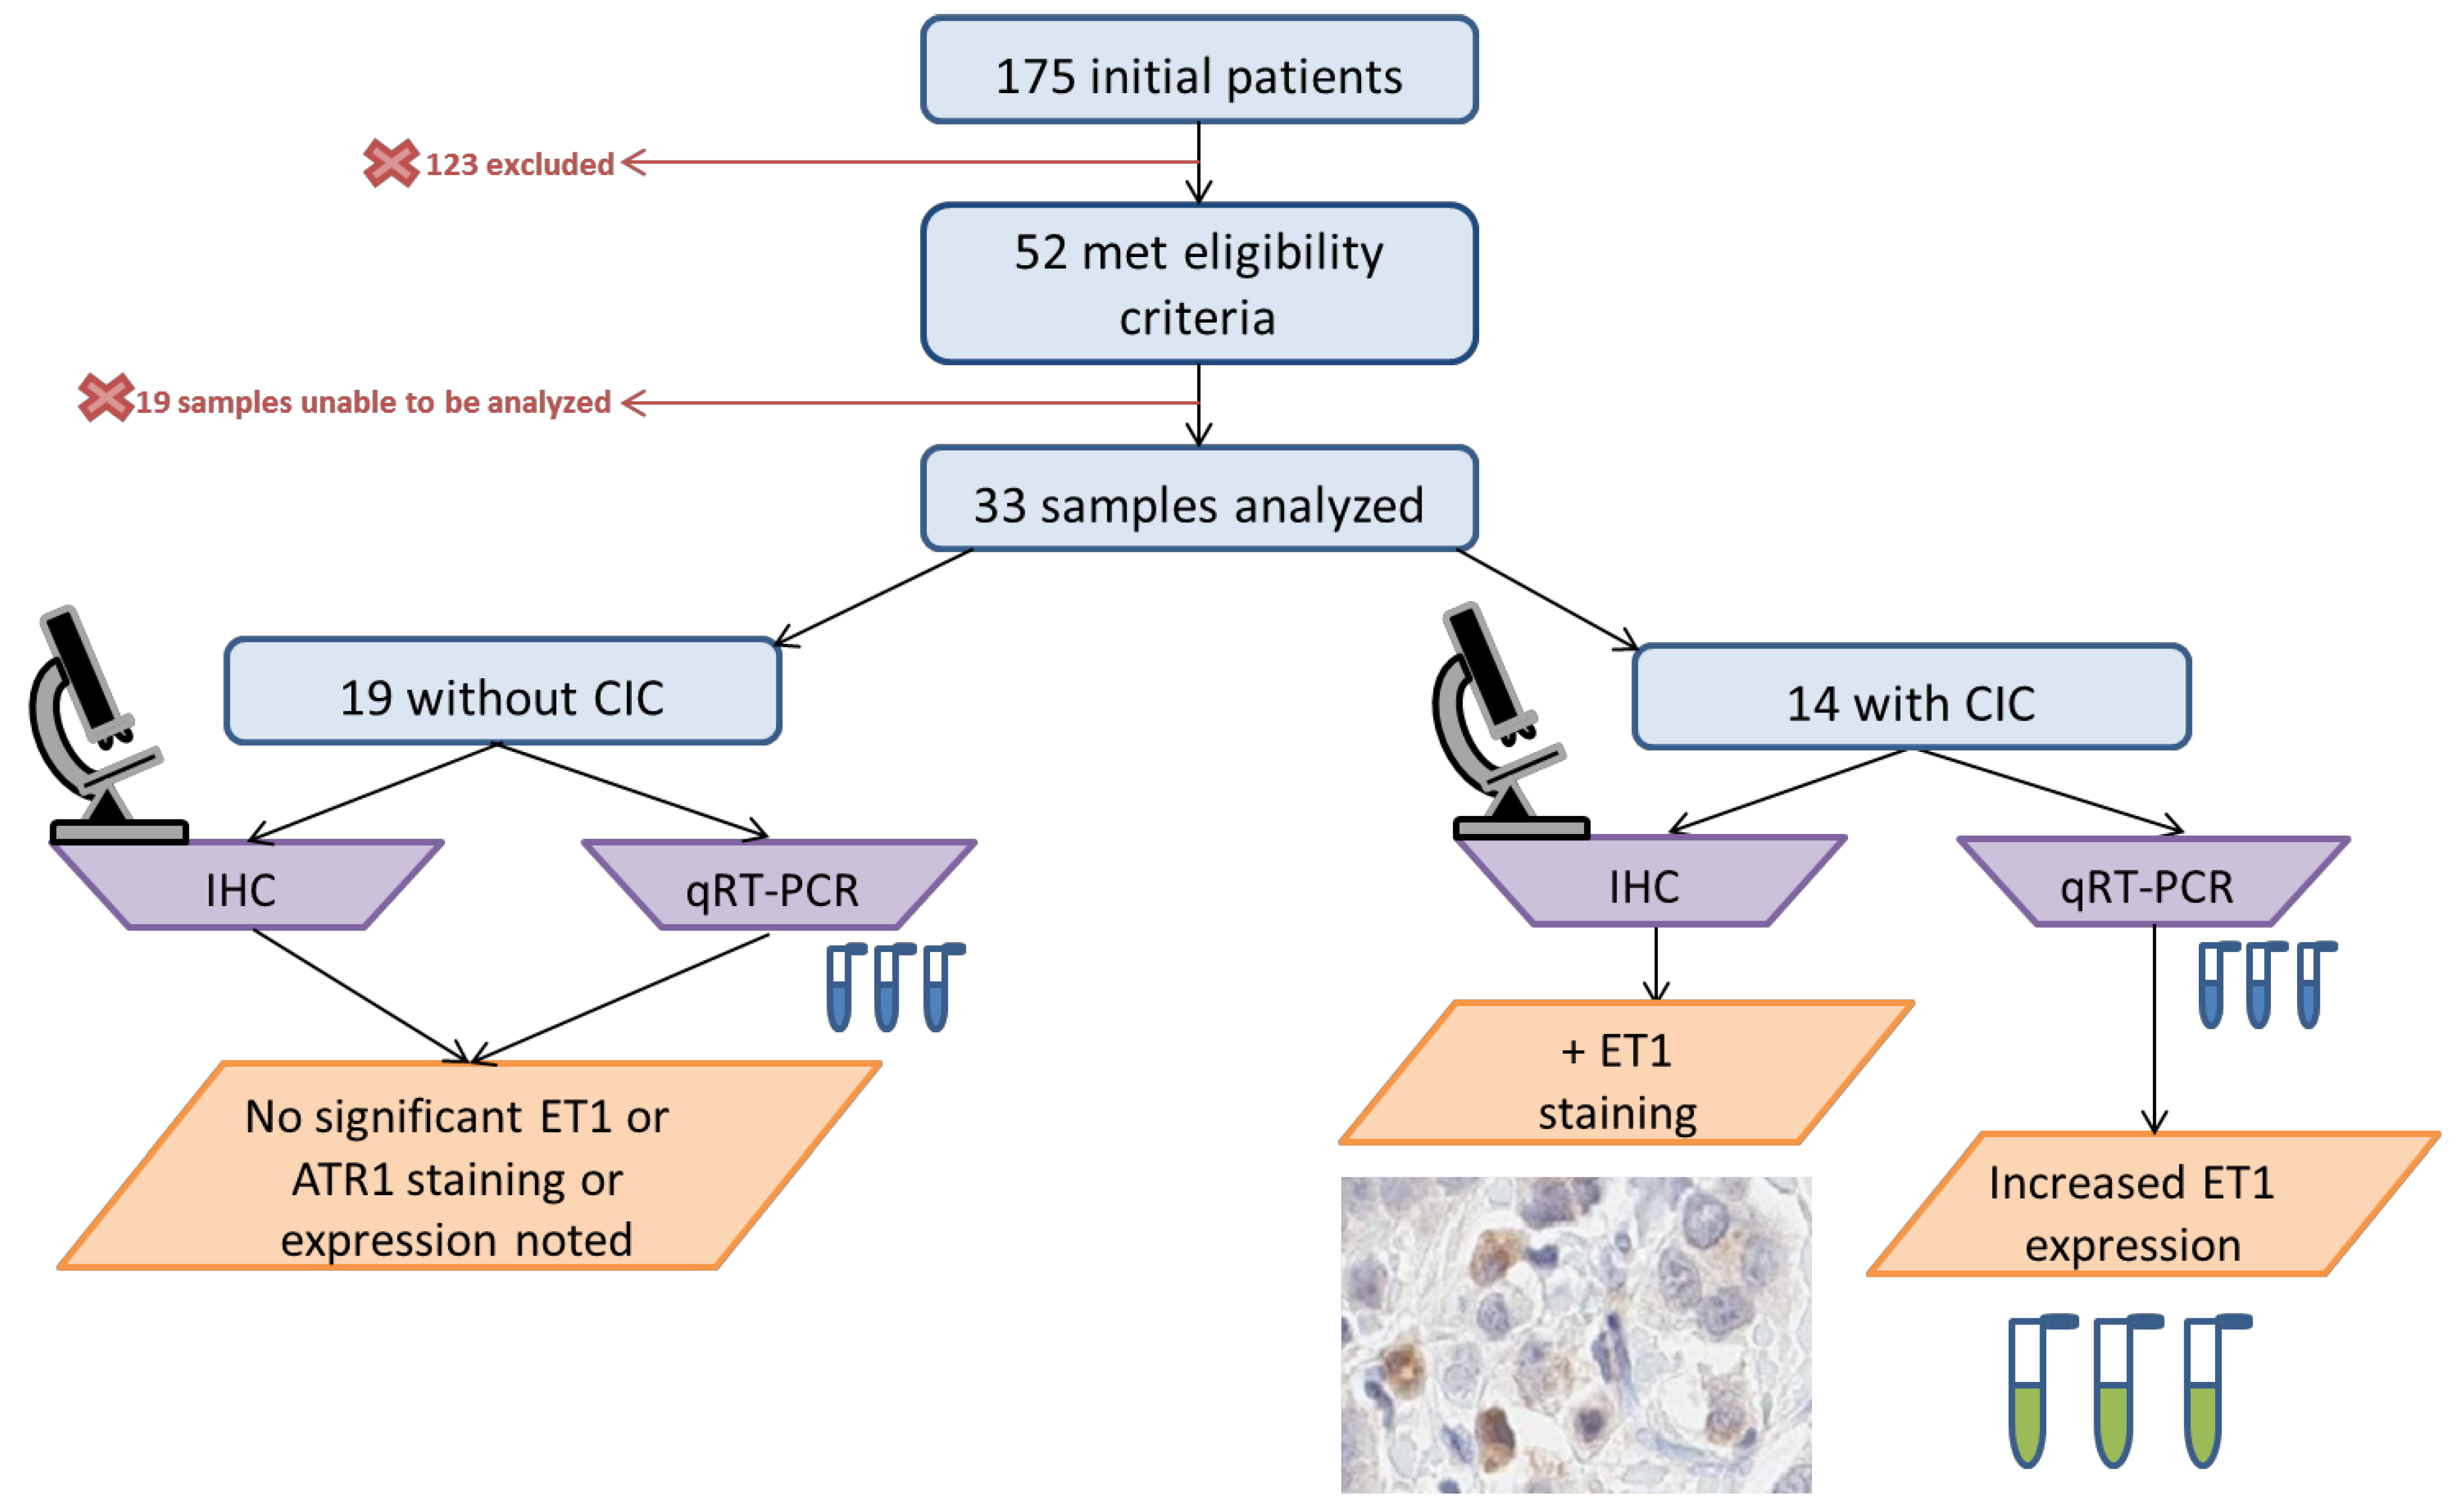
2.1. Study Population
2.2. Risk Factor Assessment
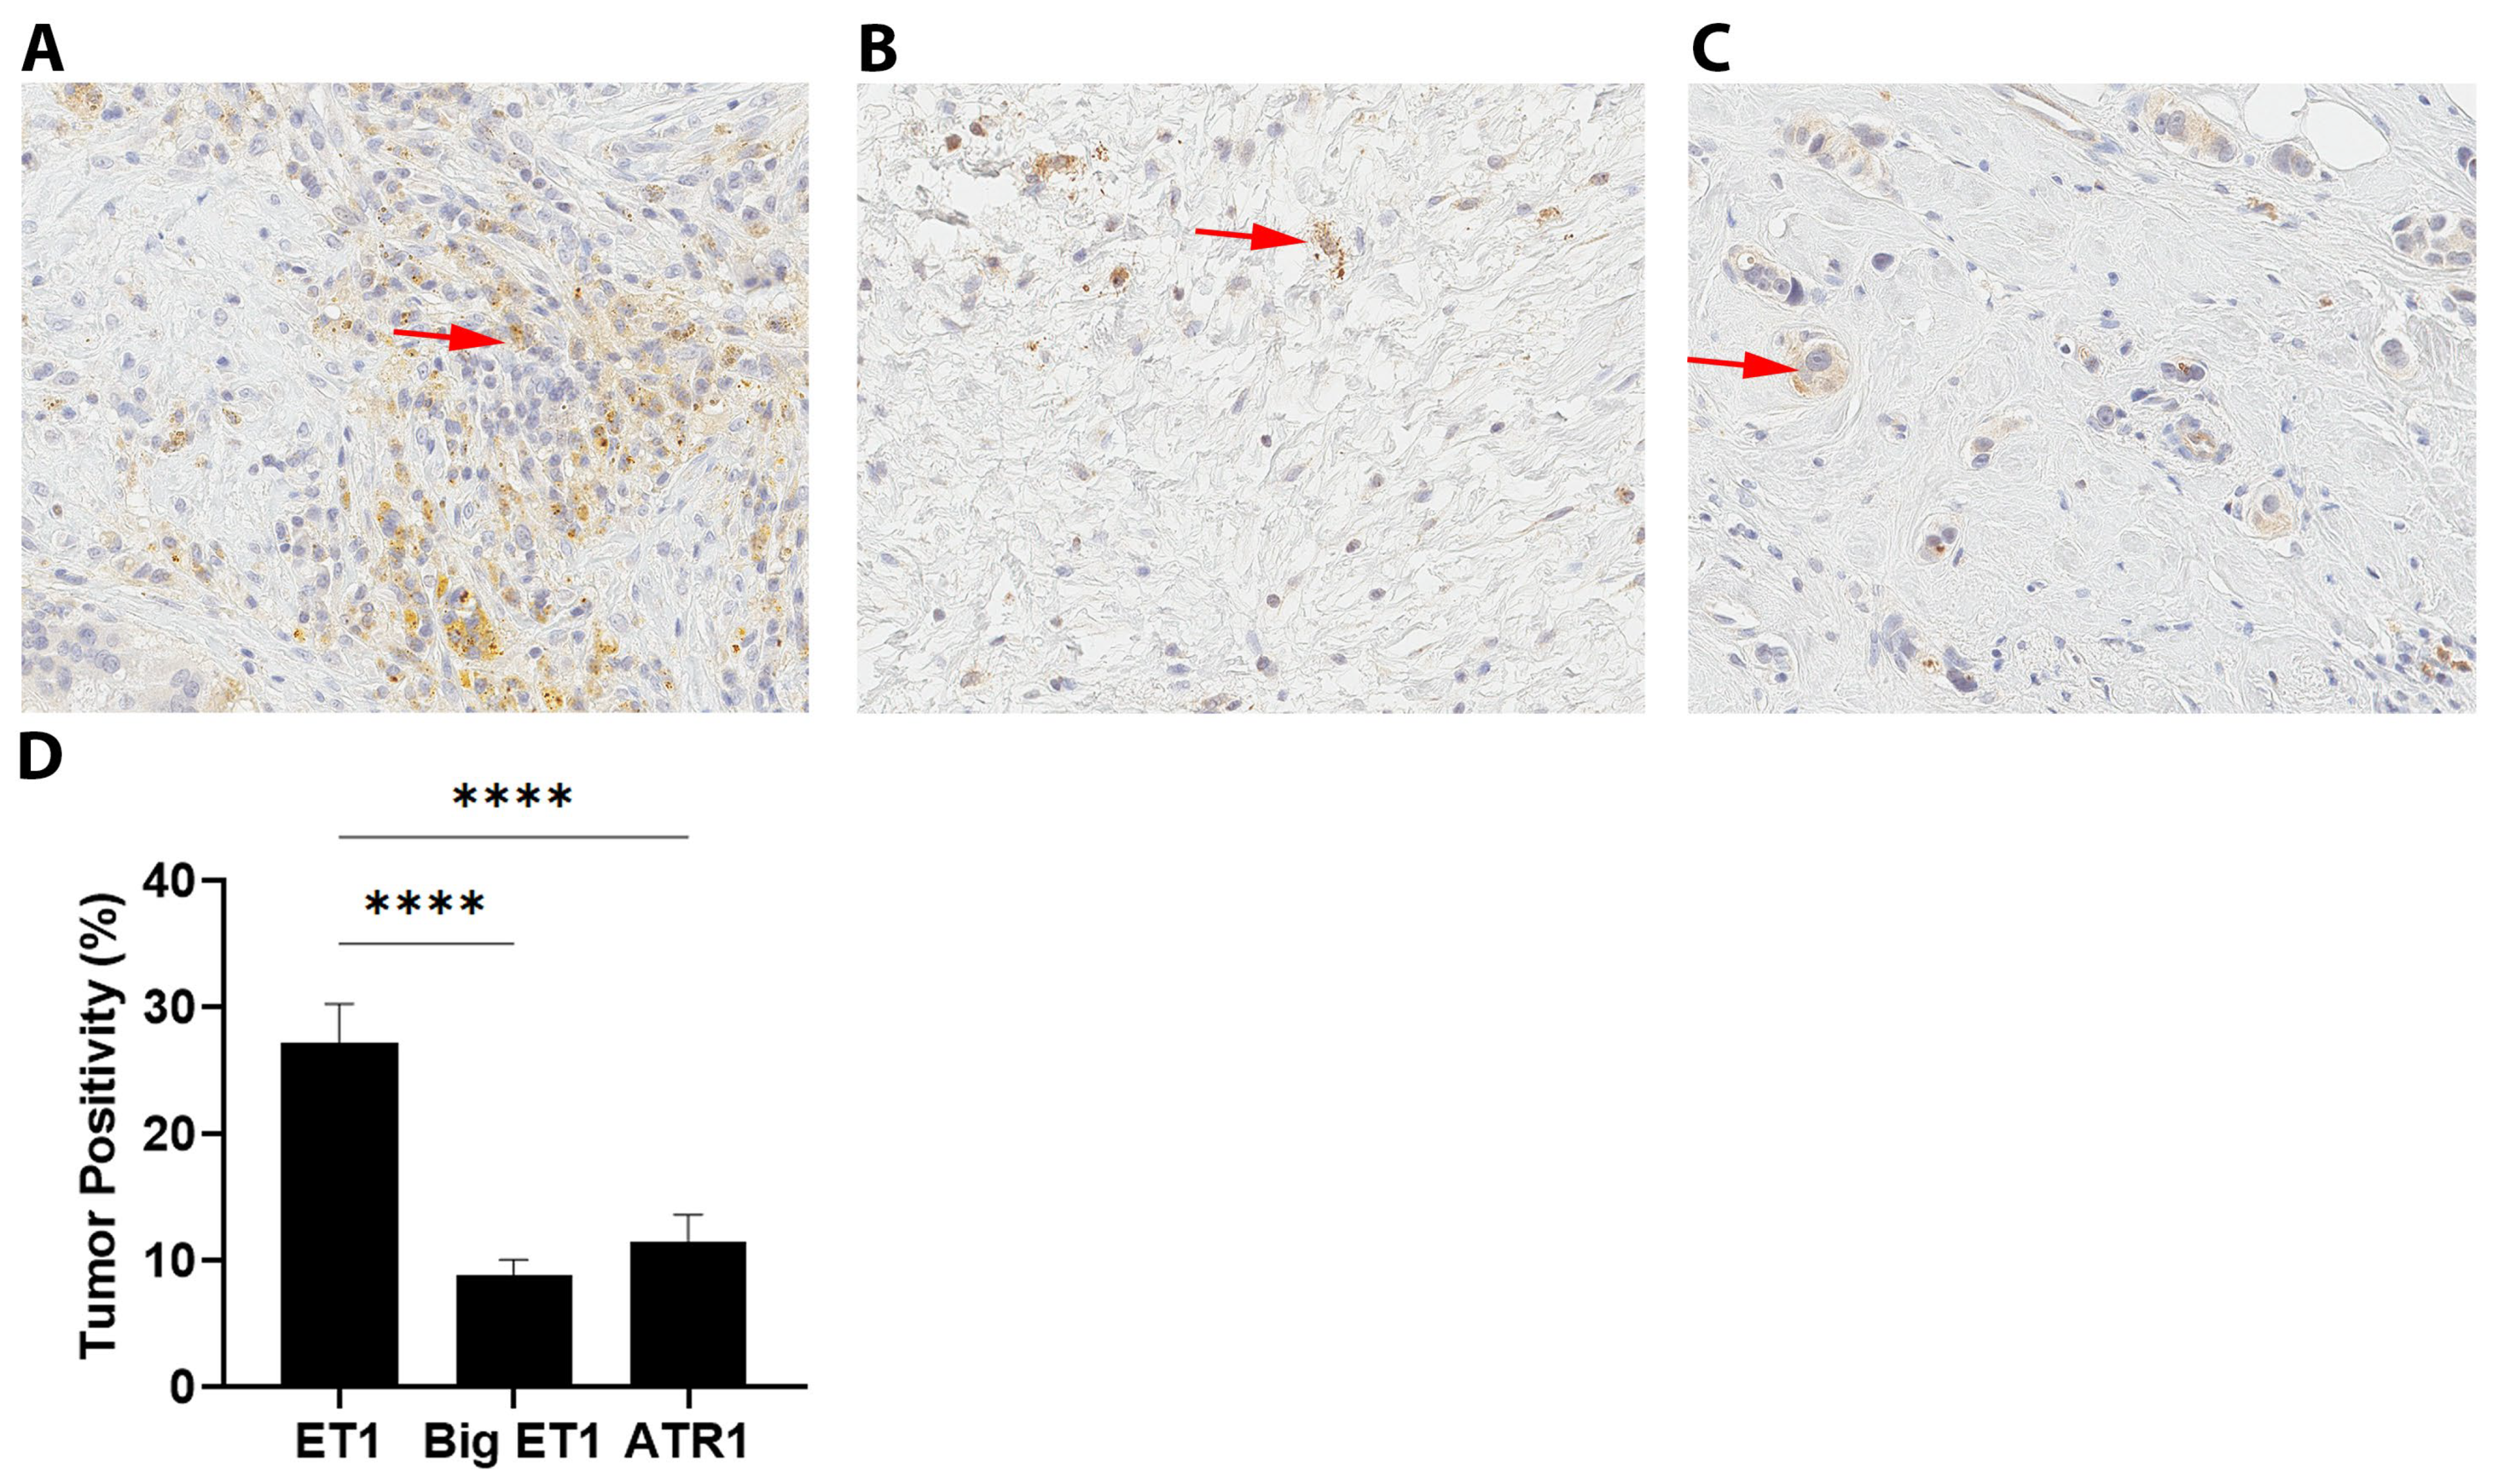
2.3. Immunohistochemistry
2.4. qRT-PCR
2.5. Statistical Methods
3. Results
3.1. Baseline Demographics
3.2. Hormone Receptor Status
3.3. Cardiovascular Risk Factors and Co-Morbidities
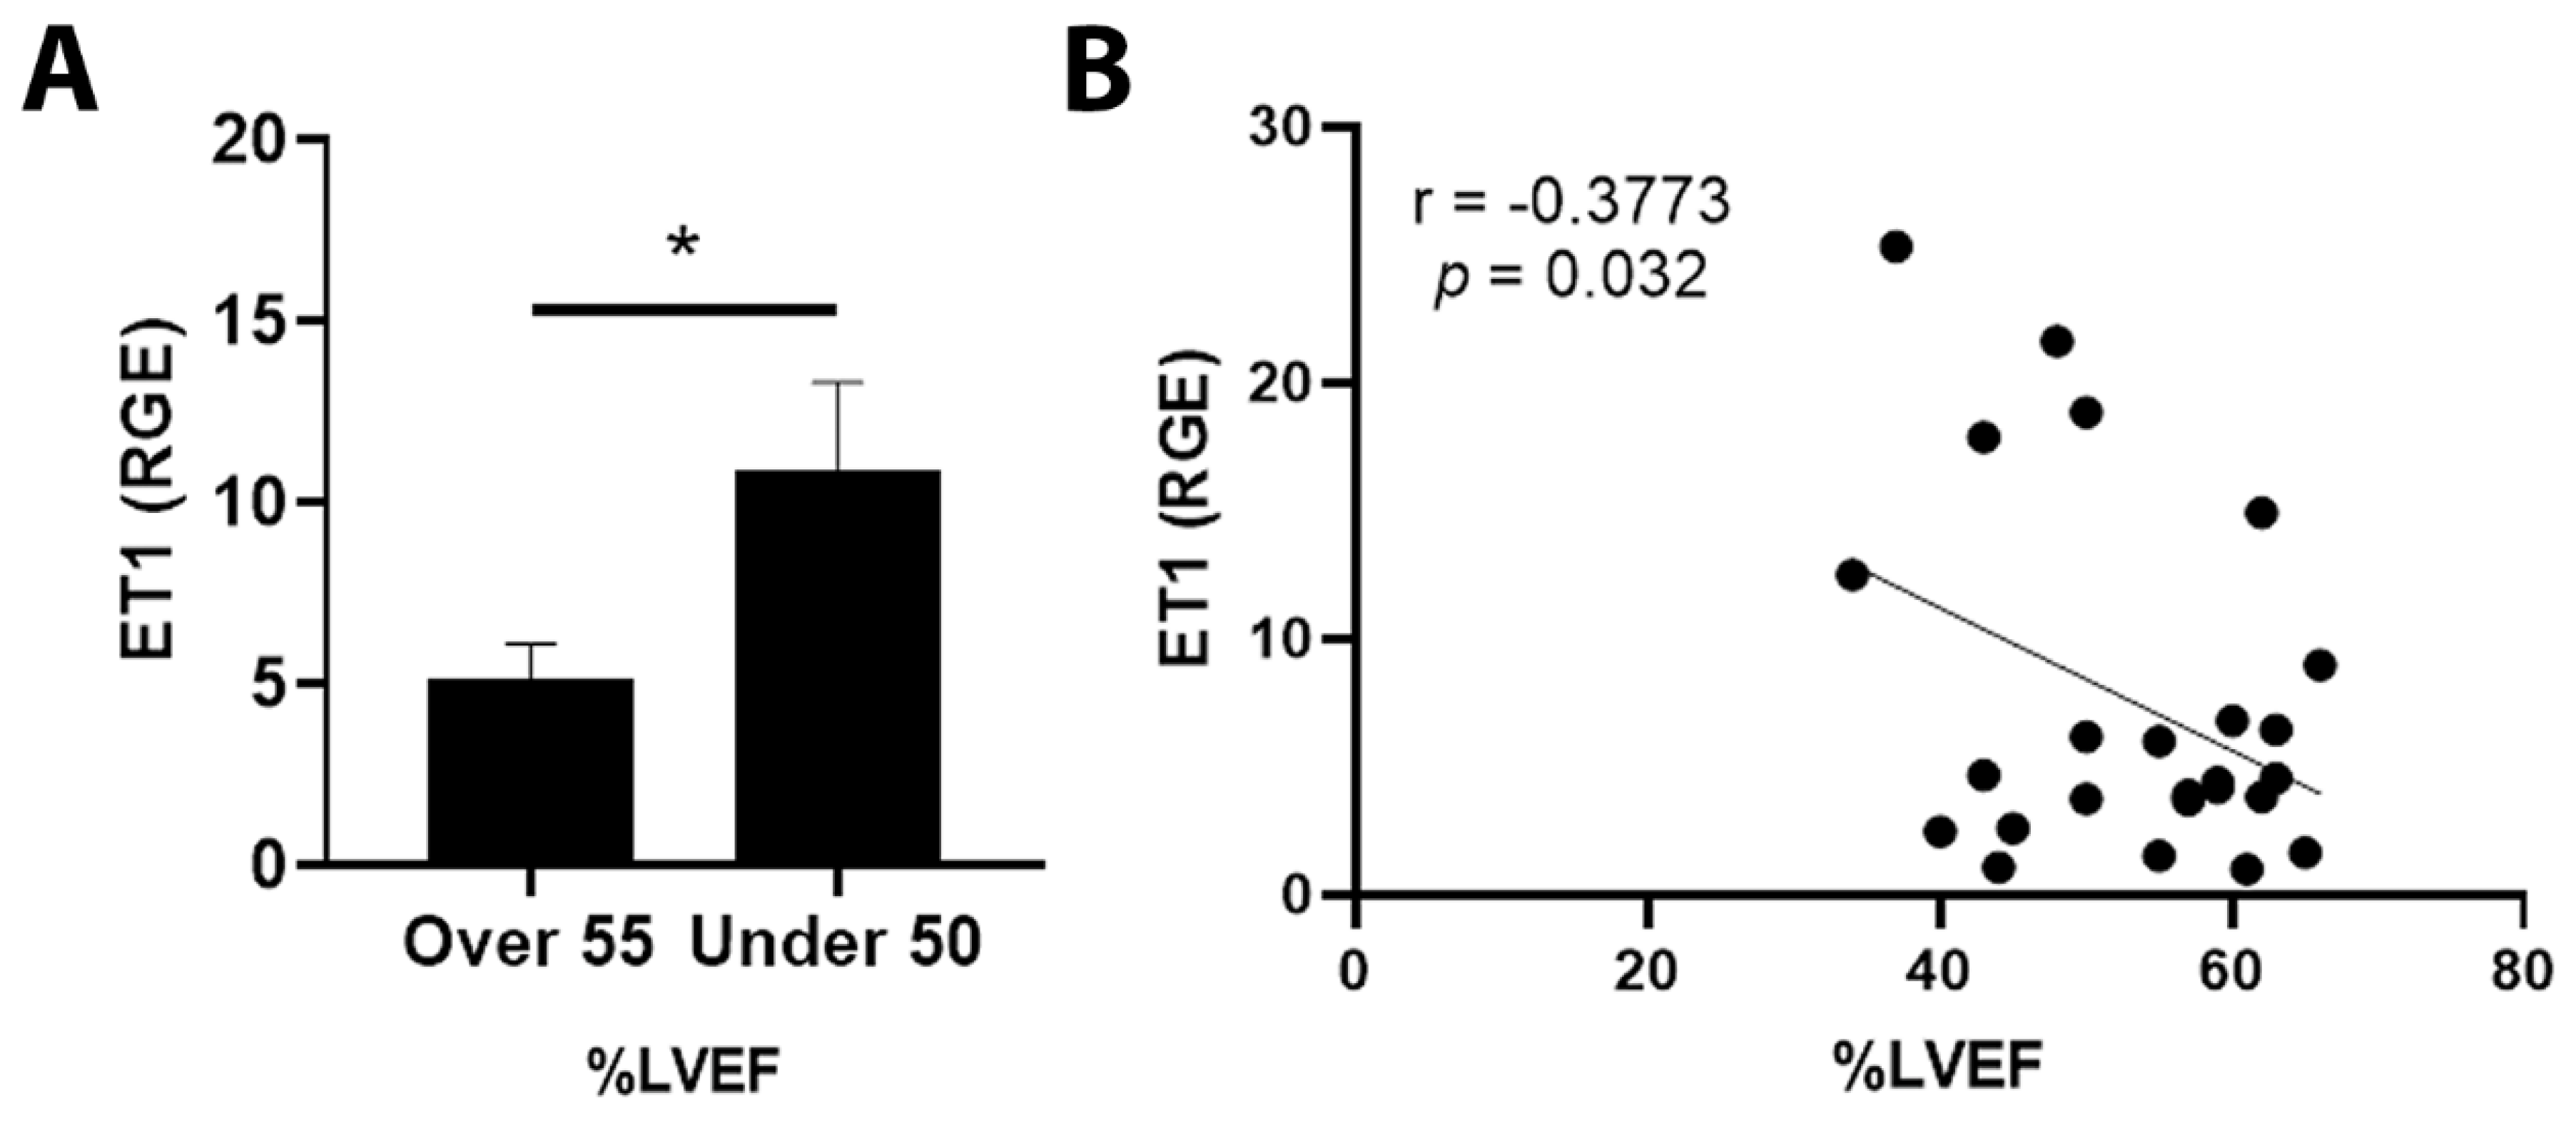
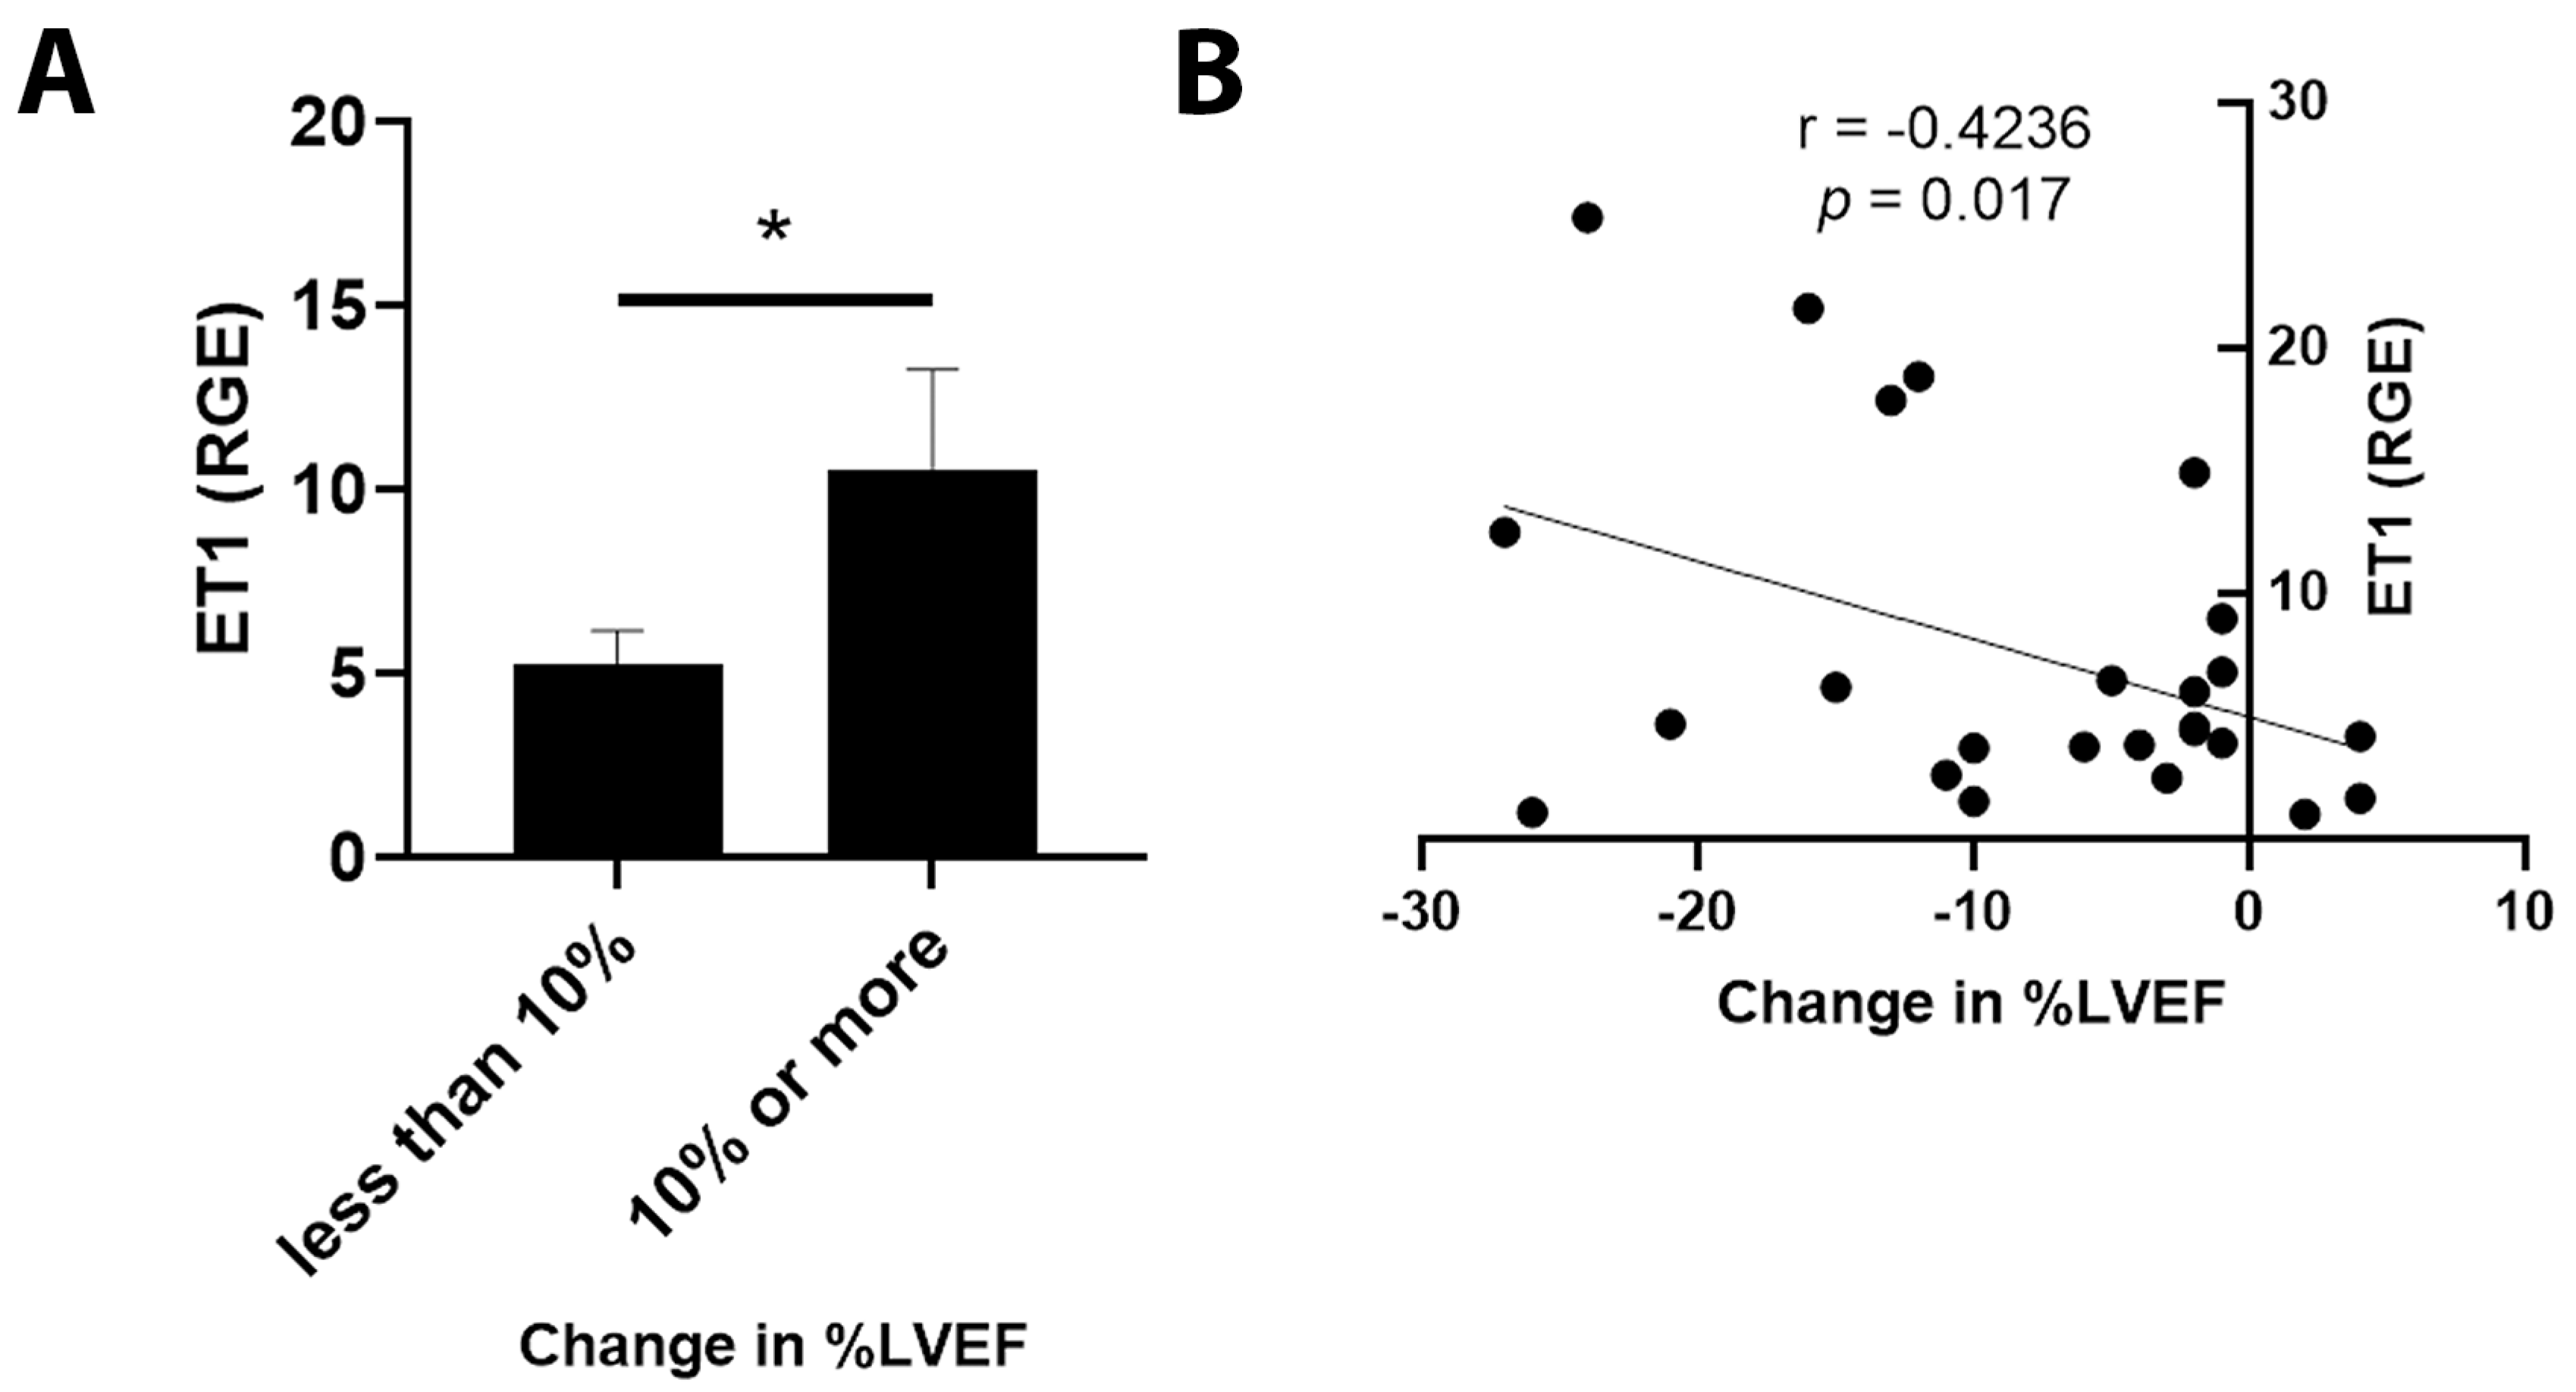
3.4. Echocardiographic Parameters
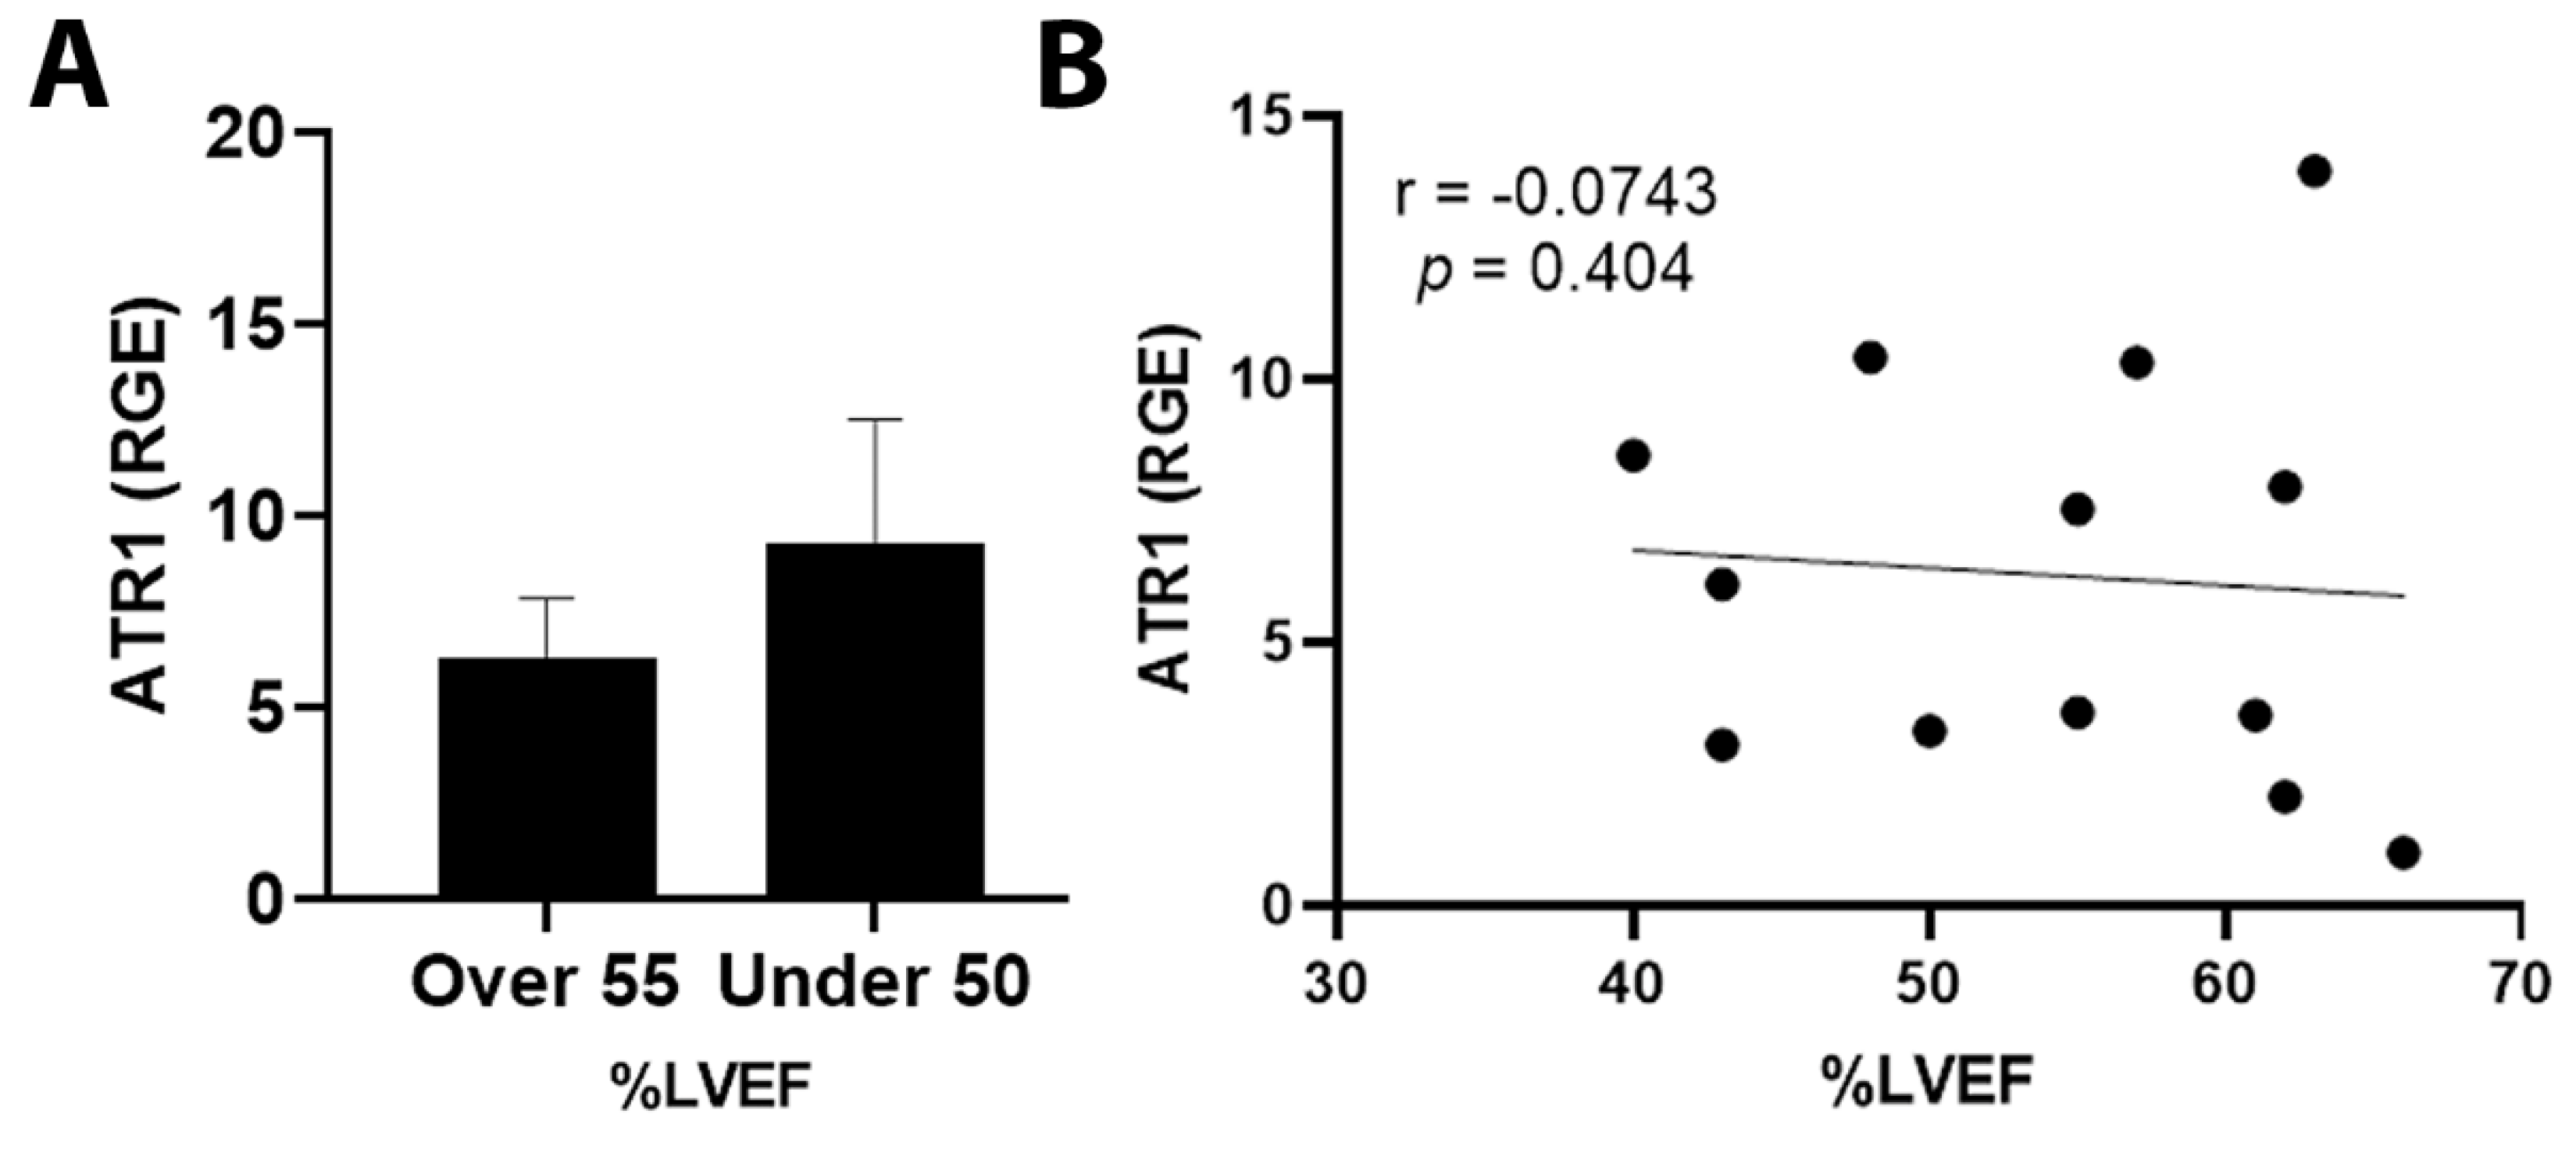
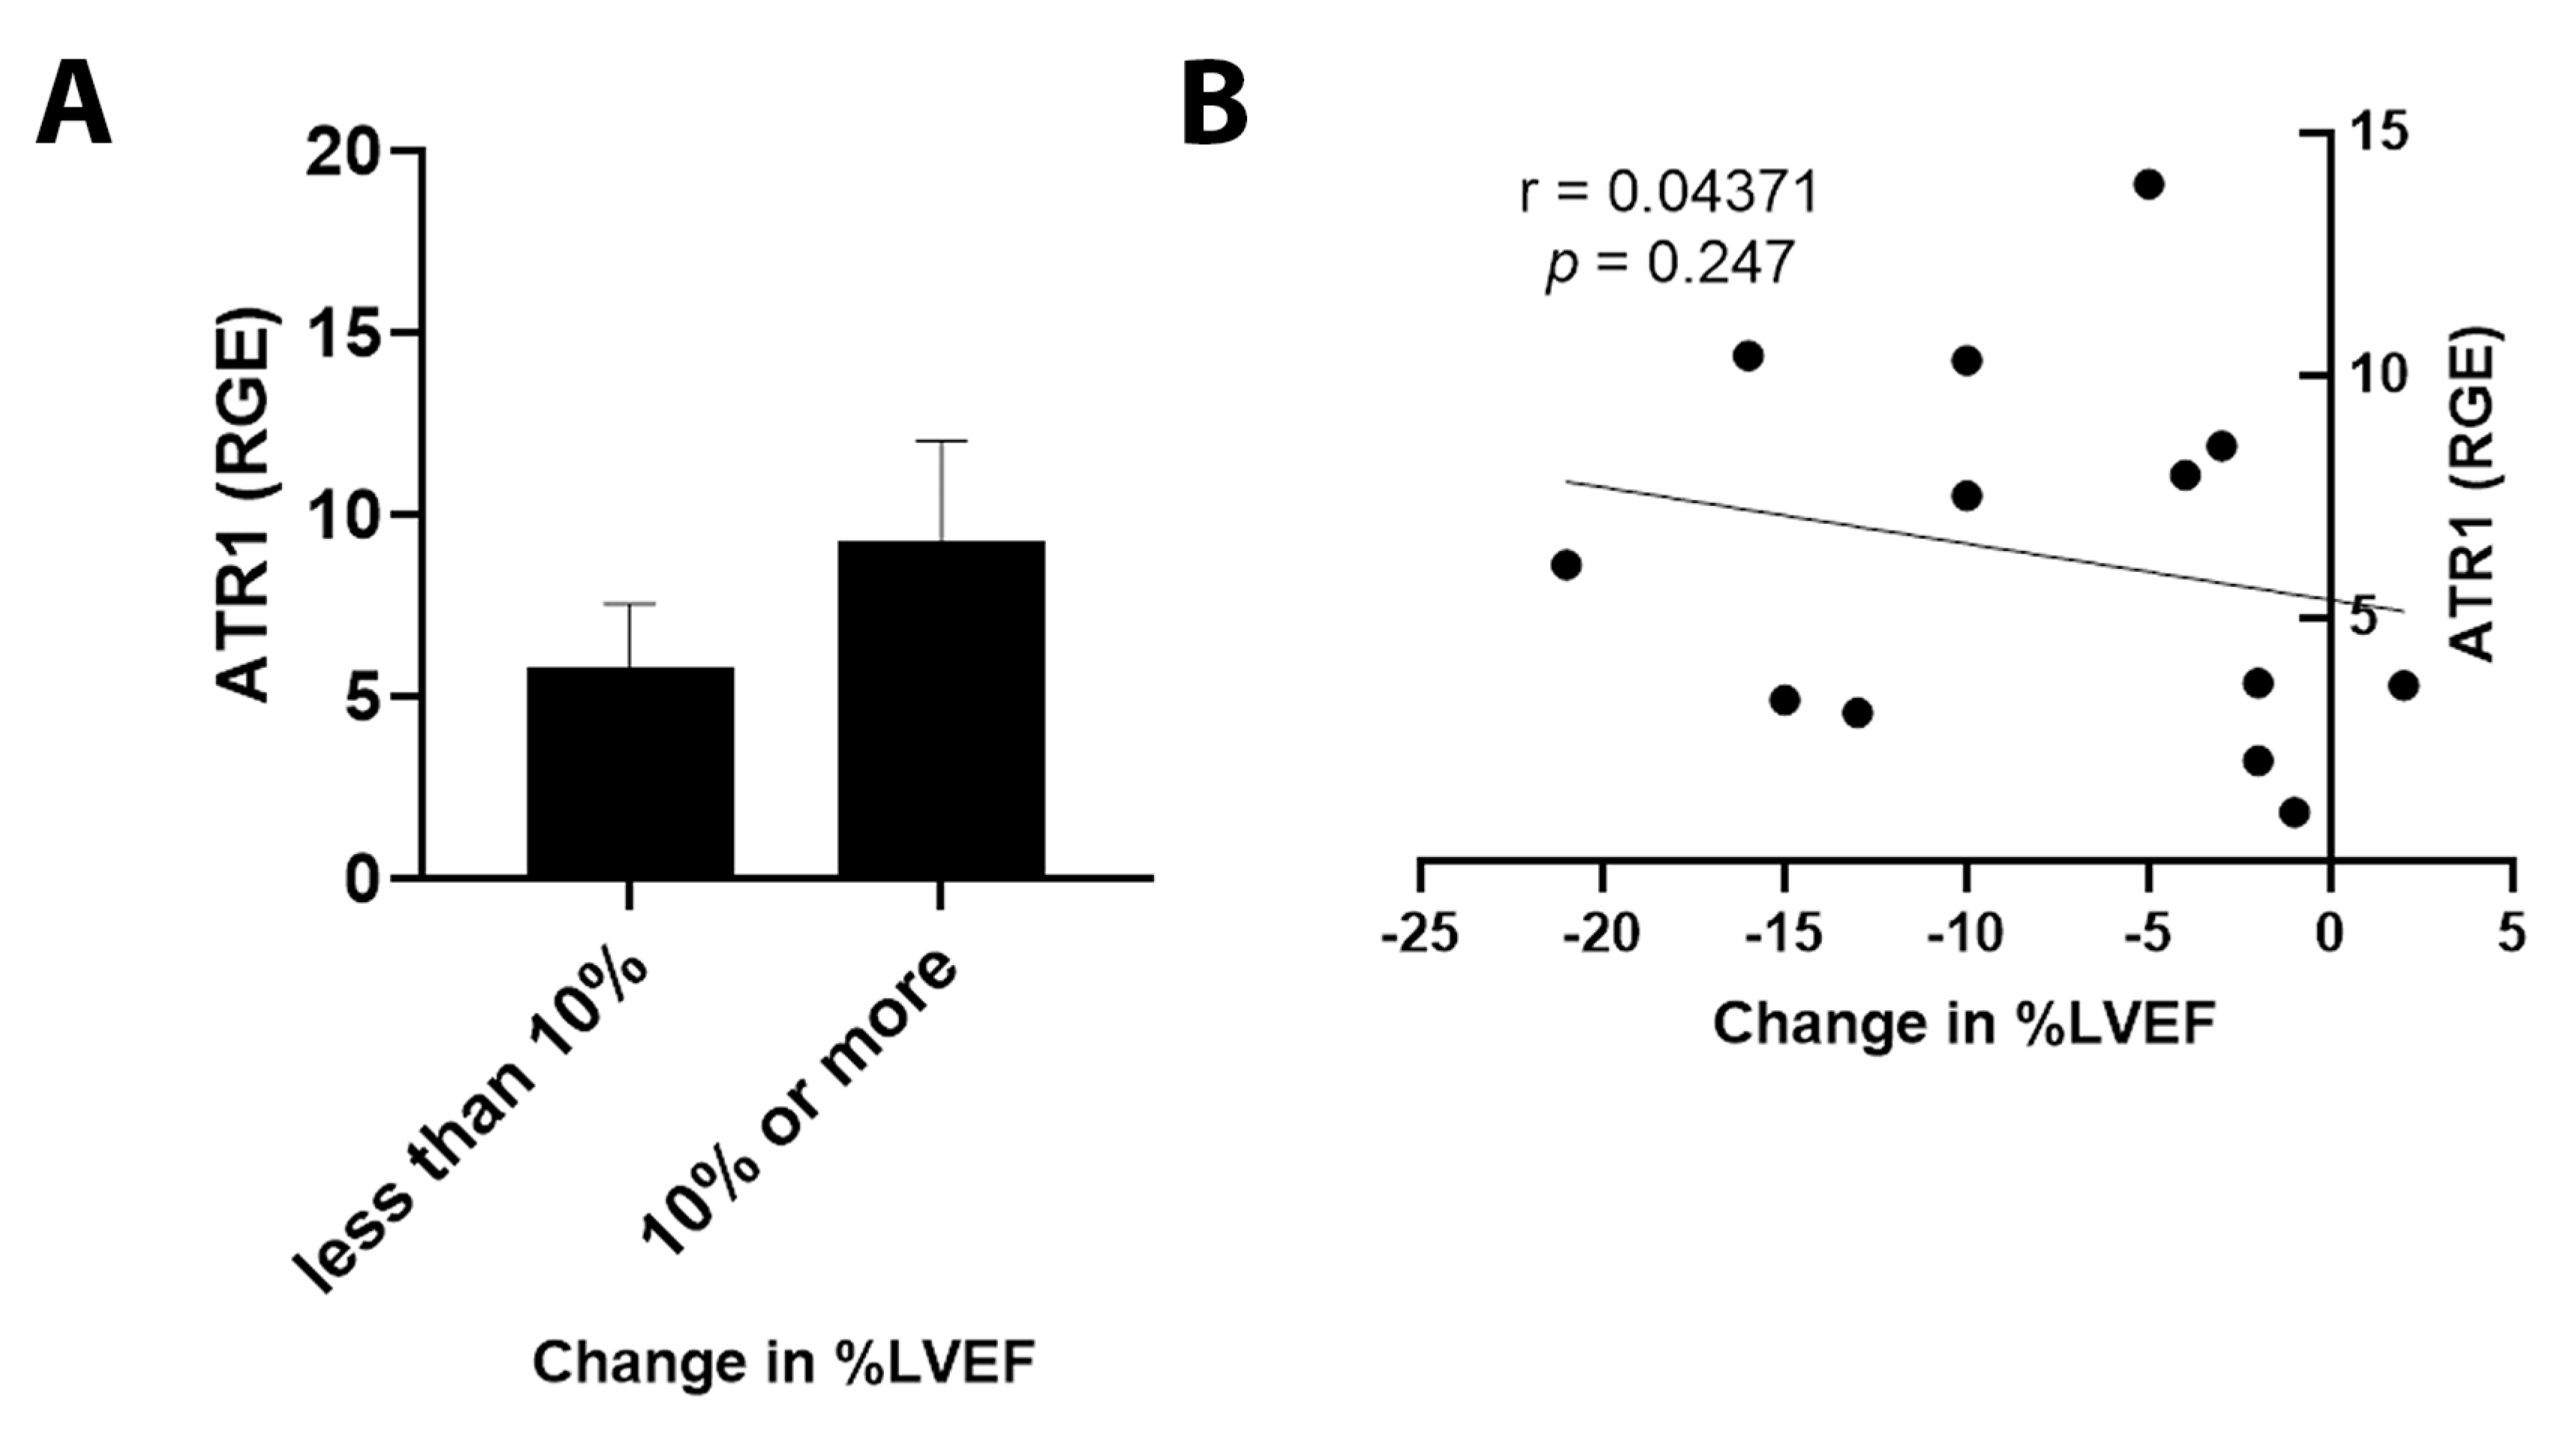
3.5. ET1 and ATR1 Expression
4. Discussion
4.1. Patient Population
4.2. ET1 Expression
4.3. Outcomes in Patients Expressing ET1 or ATR1
4.4. Hormone Receptor Status
5. Study Limitations
6. Conclusions
7. Perspectives
7.1. Competency in Medical Knowledge
7.2. Translational Outlook
Author Contributions
Funding
Institutional Review Board Statement
Informed Consent Statement
Data Availability Statement
Acknowledgments
Conflicts of Interest
References
- Florescu, M.; Cinteza, M.; Vinereanu, D. Chemotherapy-induced Cardiotoxicity. Maedica 2013, 8, 59–67. [Google Scholar]
- Cardinale, D.; Sandri, M.T. Role of biomarkers in chemotherapy-induced cardiotoxicity. Prog. Cardiovasc. Dis. 2010, 53, 121–129. [Google Scholar] [CrossRef] [PubMed]
- Dolci, A.; Dominici, R.; Cardinale, D.; Sandri, M.T.; Panteghini, M. Biochemical markers for prediction of chemotherapy-induced cardiotoxicity: Systematic review of the literature and recommendations for use. Am. J. Clin. Pathol. 2008, 130, 688–695. [Google Scholar] [CrossRef] [PubMed]
- Seidman, A.; Hudis, C.; Pierri, M.K.; Shak, S.; Paton, V.; Ashby, M.; Murphy, M.; Stewart, S.J.; Keefe, D. Cardiac dysfunction in the trastuzumab clinical trials experience. J. Clin. Oncol. 2002, 20, 1215–1221. [Google Scholar] [CrossRef]
- Truong, J.; Yan, A.T.; Cramarossa, G.; Chan, K.K. Chemotherapy-induced cardiotoxicity: Detection, prevention, and management. Can. J. Cardiol. 2014, 30, 869–878. [Google Scholar] [CrossRef] [PubMed]
- Sawaya, H.; Sebag, I.A.; Plana, J.C.; Januzzi, J.L.; Ky, B.; Cohen, V.; Gosavi, S.; Carver, J.R.; Wiegers, S.E.; Martin, R.P.; et al. Early detection and prediction of cardiotoxicity in chemotherapy-treated patients. Am. J. Cardiol. 2011, 107, 1375–1380. [Google Scholar] [CrossRef] [PubMed]
- Angsutararux, P.; Luanpitpong, S.; Issaragrisil, S. Chemotherapy-Induced Cardiotoxicity: Overview of the Roles of Oxidative Stress. Oxidative Med. Cell. Longev. 2015, 2015, 795602. [Google Scholar] [CrossRef]
- Bhatia, S. Genetics of Anthracycline Cardiomyopathy in Cancer Survivors: JACC: CardioOncology State-of-the-Art Review. JACC CardioOncol. 2020, 2, 539–552. [Google Scholar] [CrossRef] [PubMed]
- Hahn, V.S.; Lenihan, D.J.; Ky, B. Cancer therapy-induced cardiotoxicity: Basic mechanisms and potential cardioprotective therapies. J. Am. Heart Assoc. 2014, 3, e000665. [Google Scholar] [CrossRef] [PubMed]
- Magdy, T.; Burmeister, B.T.; Burridge, P.W. Validating the pharmacogenomics of chemotherapy-induced cardiotoxicity: What is missing? Pharmacol. Ther. 2016, 168, 113–125. [Google Scholar] [CrossRef] [PubMed]
- Zolty, R. The Role of Neurohormonal Systems, Inflammatory Mediators and Oxydative Stress in Cardiomyopathy. In Cardiomyopathy—Disease of the Heart Muscle; Mattsson, G., Magnusson, P., Eds.; IntechOpen: London, UK, 2021. [Google Scholar] [CrossRef]
- Grant, K.; Loizidou, M.; Taylor, I. Endothelin-1: A multifunctional molecule in cancer. Br. J. Cancer 2003, 88, 163–166. [Google Scholar] [CrossRef] [PubMed]
- Kedzierski, R.M.; Yanagisawa, M. Endothelin system: The double-edged sword in health and disease. Annu. Rev. Pharmacol. Toxicol. 2001, 41, 851–876. [Google Scholar] [CrossRef] [PubMed]
- Barton, M.; Yanagisawa, M. Endothelin: 30 Years From Discovery to Therapy. Hypertension 2019, 74, 1232–1265. [Google Scholar] [CrossRef] [PubMed]
- Miyauchi, T.; Yanagisawa, M.; Tomizawa, T.; Sugishita, Y.; Suzuki, N.; Fujino, M.; Ajisaka, R.; Goto, K.; Masaki, T. Increased plasma concentrations of endothelin-1 and big endothelin-1 in acute myocardial infarction. Lancet 1989, 2, 53–54. [Google Scholar] [CrossRef]
- Oh, E.; Kim, J.Y.; Cho, Y.; An, H.; Lee, N.; Jo, H.; Ban, C.; Seo, J.H. Overexpression of angiotensin II type 1 receptor in breast cancer cells induces epithelial-mesenchymal transition and promotes tumor growth and angiogenesis. Biochim. Biophys. Acta 2016, 1863, 1071–1081. [Google Scholar] [CrossRef] [PubMed]
- Tamkus, D.; Sikorskii, A.; Gallo, K.A.; Wiese, D.A.; Leece, C.; Madhukar, B.V.; Chivu, S.C.; Chitneni, S.; Dimitrov, N.V. Endothelin-1 enriched tumor phenotype predicts breast cancer recurrence. ISRN Oncol. 2013, 2013, 385398. [Google Scholar] [CrossRef]
- Du, N.; Feng, J.; Hu, L.J.; Sun, X.; Sun, H.B.; Zhao, Y.; Yang, Y.P.; Ren, H. Angiotensin II receptor type 1 blockers suppress the cell proliferation effects of angiotensin II in breast cancer cells by inhibiting AT1R signaling. Oncol. Rep. 2012, 27, 1893–1903. [Google Scholar] [CrossRef] [PubMed]
- Wulfing, P.; Diallo, R.; Kersting, C.; Wulfing, C.; Poremba, C.; Rody, A.; Greb, R.R.; Bocker, W.; Kiesel, L. Expression of endothelin-1, endothelin-A, and endothelin-B receptor in human breast cancer and correlation with long-term follow-up. Clin. Cancer Res. 2003, 9, 4125–4131. [Google Scholar] [PubMed]
- Wulfing, P.; Kersting, C.; Tio, J.; Fischer, R.J.; Wulfing, C.; Poremba, C.; Diallo, R.; Bocker, W.; Kiesel, L. Endothelin-1-, endothelin-A-, and endothelin-B-receptor expression is correlated with vascular endothelial growth factor expression and angiogenesis in breast cancer. Clin. Cancer Res. 2004, 10, 2393–2400. [Google Scholar] [CrossRef]
- Kojima, K.; Nihei, Z. Expression of endothelin-1 immunoreactivity in breast cancer. Surg. Oncol. 1995, 4, 309–315. [Google Scholar] [CrossRef]
- Ateeq, B.; Tomlins, S.A.; Chinnaiyan, A.M. AGTR1 as a therapeutic target in ER-positive and ERBB2-negative breast cancer cases. Cell Cycle 2009, 8, 3794–3795. [Google Scholar] [CrossRef] [PubMed]
- Rosano, L.; Spinella, F.; Bagnato, A. Endothelin 1 in cancer: Biological implications and therapeutic opportunities. Nat. Rev. Cancer 2013, 13, 637–651. [Google Scholar] [CrossRef] [PubMed]
- Alanen, K.; Deng, D.X.; Chakrabarti, S. Augmented expression of endothelin-1, endothelin-3 and the endothelin-B receptor in breast carcinoma. Histopathology 2000, 36, 161–167. [Google Scholar] [CrossRef]
- Bruno, K.A.; Macomb, L.P.; Morales-Lara, A.C.; Mathews, J.E.; Frisancho, J.A.; Yang, A.L.; Di Florio, D.N.; Edenfield, B.H.; Whelan, E.R.; Salomon, G.R.; et al. Sex-Specific Effects of Plastic Caging in Murine Viral Myocarditis. Int. J. Mol. Sci. 2021, 22, 8834. [Google Scholar] [CrossRef] [PubMed]
- Bruno, K.A.; Mathews, J.E.; Yang, A.L.; Frisancho, J.A.; Scott, A.J.; Greyner, H.D.; Molina, F.A.; Greenaway, M.S.; Cooper, G.M.; Bucek, A.; et al. BPA Alters Estrogen Receptor Expression in the Heart After Viral Infection Activating Cardiac Mast Cells and T Cells Leading to Perimyocarditis and Fibrosis. Front. Endocrinol. 2019, 10, 598. [Google Scholar] [CrossRef]
- Fairweather, D.; Coronado, M.J.; Garton, A.E.; Dziedzic, J.L.; Bucek, A.; Cooper, L.T., Jr.; Brandt, J.E.; Alikhan, F.S.; Wang, H.; Endres, C.J.; et al. Sex differences in translocator protein 18 kDa (TSPO) in the heart: Implications for imaging myocardial inflammation. J. Cardiovasc. Transl. Res. 2014, 7, 192–202. [Google Scholar] [CrossRef] [PubMed]
- Tilli, T.M.; Castro Cda, S.; Tuszynski, J.A.; Carels, N. A strategy to identify housekeeping genes suitable for analysis in breast cancer diseases. BMC Genom. 2016, 17, 639. [Google Scholar] [CrossRef]
- Yamashita, J.; Ogawa, M.; Shirakusa, T. Plasma endothelin-1 as a marker for doxorubicin cardiotoxicity. Int. J. Cancer 1995, 62, 542–547. [Google Scholar] [CrossRef]
- Luscher, T.F.; Enseleit, F.; Pacher, R.; Mitrovic, V.; Schulze, M.R.; Willenbrock, R.; Dietz, R.; Rousson, V.; Hurlimann, D.; Philipp, S.; et al. Hemodynamic and neurohumoral effects of selective endothelin A (ET(A)) receptor blockade in chronic heart failure: The Heart Failure ET(A) Receptor Blockade Trial (HEAT). Circulation 2002, 106, 2666–2672. [Google Scholar] [CrossRef] [PubMed]
- Writing, C.; Maddox, T.M.; Januzzi, J.L., Jr.; Allen, L.A.; Breathett, K.; Butler, J.; Davis, L.L.; Fonarow, G.C.; Ibrahim, N.E.; Lindenfeld, J.; et al. 2021 Update to the 2017 ACC Expert Consensus Decision Pathway for Optimization of Heart Failure Treatment: Answers to 10 Pivotal Issues About Heart Failure With Reduced Ejection Fraction: A Report of the American College of Cardiology Solution Set Oversight Committee. J. Am. Coll. Cardiol. 2021, 77, 772–810. [Google Scholar] [CrossRef]
- Spieker, L.E.; Noll, G.; Ruschitzka, F.T.; Luscher, T.F. Endothelin receptor antagonists in congestive heart failure: A new therapeutic principle for the future? J. Am. Coll. Cardiol. 2001, 37, 1493–1505. [Google Scholar] [CrossRef][Green Version]
- Yang, Z.; Krasnici, N.; Luscher, T.F. Endothelin-1 potentiates human smooth muscle cell growth to PDGF: Effects of ETA and ETB receptor blockade. Circulation 1999, 100, 5–8. [Google Scholar] [CrossRef] [PubMed]
- Maayah, Z.H.; Takahara, S.; Alam, A.S.; Ferdaoussi, M.; Sutendra, G.; El-Kadi, A.O.S.; Mackey, J.R.; Pituskin, E.; Paterson, D.I.; Dyck, J.R.B. Breast cancer diagnosis is associated with relative left ventricular hypertrophy and elevated endothelin-1 signaling. BMC Cancer 2020, 20, 751. [Google Scholar] [CrossRef] [PubMed]
- Omland, T.; Lie, R.T.; Aakvaag, A.; Aarsland, T.; Dickstein, K. Plasma endothelin determination as a prognostic indicator of 1-year mortality after acute myocardial infarction. Circulation 1994, 89, 1573–1579. [Google Scholar] [CrossRef] [PubMed]
- Pacher, R.; Stanek, B.; Hulsmann, M.; Koller-Strametz, J.; Berger, R.; Schuller, M.; Hartter, E.; Ogris, E.; Frey, B.; Heinz, G.; et al. Prognostic impact of big endothelin-1 plasma concentrations compared with invasive hemodynamic evaluation in severe heart failure. J. Am. Coll. Cardiol. 1996, 27, 633–641. [Google Scholar] [CrossRef]
- Gaggin, H.K.; Truong, Q.A.; Gandhi, P.U.; Motiwala, S.R.; Belcher, A.M.; Weiner, R.B.; Baggish, A.L.; Januzzi, J.L., Jr. Systematic Evaluation of Endothelin 1 Measurement Relative to Traditional and Modern Biomarkers for Clinical Assessment and Prognosis in Patients With Chronic Systolic Heart Failure: Serial Measurement and Multimarker Testing. Am. J. Clin. Pathol. 2017, 147, 461–472. [Google Scholar] [CrossRef]
- Galie, N.; Humbert, M.; Vachiery, J.L.; Gibbs, S.; Lang, I.; Torbicki, A.; Simonneau, G.; Peacock, A.; Vonk Noordegraaf, A.; Beghetti, M.; et al. 2015 ESC/ERS Guidelines for the diagnosis and treatment of pulmonary hypertension: The Joint Task Force for the Diagnosis and Treatment of Pulmonary Hypertension of the European Society of Cardiology (ESC) and the European Respiratory Society (ERS): Endorsed by: Association for European Paediatric and Congenital Cardiology (AEPC), International Society for Heart and Lung Transplantation (ISHLT). Eur. Respir. J. 2015, 46, 903–975. [Google Scholar] [CrossRef]
- Packer, M.; McMurray, J.J.V.; Krum, H.; Kiowski, W.; Massie, B.M.; Caspi, A.; Pratt, C.M.; Petrie, M.C.; DeMets, D.; Kobrin, I.; et al. Long-Term Effect of Endothelin Receptor Antagonism With Bosentan on the Morbidity and Mortality of Patients With Severe Chronic Heart Failure: Primary Results of the ENABLE Trials. JACC Heart Fail. 2017, 5, 317–326. [Google Scholar] [CrossRef]
- Vachiery, J.L.; Delcroix, M.; Al-Hiti, H.; Efficace, M.; Hutyra, M.; Lack, G.; Papadakis, K.; Rubin, L.J. Macitentan in pulmonary hypertension due to left ventricular dysfunction. Eur. Respir. J. 2018, 51, 1701886. [Google Scholar] [CrossRef]
- McCoy, E.K.; Lisenby, K.M. Aprocitentan (a Dual Endothelin-Receptor Antagonist) for Treatment-Resistant Hypertension. J. Cardiovasc. Pharmacol. 2021, 77, 699–706. [Google Scholar] [CrossRef]
- Olczak, K.J.; Taylor-Bateman, V.; Nicholls, H.L.; Traylor, M.; Cabrera, C.P.; Munroe, P.B. Hypertension genetics past, present and future applications. J. Intern. Med. 2021, 290, 1130–1152. [Google Scholar] [CrossRef] [PubMed]
- Leary, P.J.; Jenny, N.S.; Bluemke, D.A.; Kawut, S.M.; Kronmal, R.A.; Lima, J.A.; Maron, B.A.; Ralph, D.D.; Rayner, S.G.; Ryan, J.J.; et al. Endothelin-1, cardiac morphology, and heart failure: The MESA angiogenesis study. J. Heart Lung Transpl. 2020, 39, 45–52. [Google Scholar] [CrossRef]
- Totzeck, M.; Mincu, R.I.; Heusch, G.; Rassaf, T. Heart failure from cancer therapy: Can we prevent it? ESC Heart Fail. 2019, 6, 856–862. [Google Scholar] [CrossRef]
- Rhodes, D.R.; Ateeq, B.; Cao, Q.; Tomlins, S.A.; Mehra, R.; Laxman, B.; Kalyana-Sundaram, S.; Lonigro, R.J.; Helgeson, B.E.; Bhojani, M.S.; et al. AGTR1 overexpression defines a subset of breast cancer and confers sensitivity to losartan, an AGTR1 antagonist. Proc. Natl. Acad. Sci. USA 2009, 106, 10284–10289. [Google Scholar] [CrossRef]
- Boekhout, A.H.; Gietema, J.A.; Milojkovic Kerklaan, B.; van Werkhoven, E.D.; Altena, R.; Honkoop, A.; Los, M.; Smit, W.M.; Nieboer, P.; Smorenburg, C.H.; et al. Angiotensin II-Receptor Inhibition With Candesartan to Prevent Trastuzumab-Related Cardiotoxic Effects in Patients With Early Breast Cancer: A Randomized Clinical Trial. JAMA Oncol. 2016, 2, 1030–1037. [Google Scholar] [CrossRef] [PubMed]
- Heck, S.L.; Mecinaj, A.; Ree, A.H.; Hoffmann, P.; Schulz-Menger, J.; Fagerland, M.W.; Gravdehaug, B.; Rosjo, H.; Steine, K.; Geisler, J.; et al. Prevention of Cardiac Dysfunction During Adjuvant Breast Cancer Therapy (PRADA): Extended Follow-Up of a 2 × 2 Factorial, Randomized, Placebo-Controlled, Double-Blind Clinical Trial of Candesartan and Metoprolol. Circulation 2021, 143, 2431–2440. [Google Scholar] [CrossRef] [PubMed]
- Blanter, J.B.; Frishman, W.H. The Preventive Role of Angiotensin Converting Enzyme Inhibitors/Angiotensin-II Receptor Blockers and beta-Adrenergic Blockers in Anthracycline- and Trastuzumab-Induced Cardiotoxicity. Cardiol. Rev. 2019, 27, 256–259. [Google Scholar] [CrossRef] [PubMed]
- Naik, P.; Murumkar, P.; Giridhar, R.; Yadav, M.R. Angiotensin II receptor type 1 (AT1) selective nonpeptidic antagonists—A perspective. Bioorg. Med. Chem. 2010, 18, 8418–8456. [Google Scholar] [CrossRef] [PubMed]


|
LVEF ≤ 50%
(n = 14) |
LVEF ≥ 55%
(n = 19) |
Total
(n = 33) | p Value | |
|---|---|---|---|---|
| Age | 0.098 | |||
| Mean (SD) | 60.0 (10.4) | 63.4 (14.1) | 62.0 (12.6) | |
| Median (Range) | 59.0 (47.0, 77.0) | 62.0 (35.0, 88.0) | 62.0 (35.0, 88.0) | |
| Race | 0.318 | |||
| African American | 1 (7.1%) | 3 (15.8%) | 4 (12.1%) | |
| Asian | 0 (0.0%) | 1 (5.3%) | 1 (3.0%) | |
| White | 11 (78.6%) | 14 (73.7%) | 25 (75.8%) | |
| Mexican | 0 (0.0%) | 1 (5.3%) | 1 (3.0%) | |
| Middle Eastern | 2 (14.3%) | 0 (0.0%) | 2 (6.1%) | |
| Coronary artery disease | 0.383 | |||
| No | 14 (100.0%) | 18 (94.7%) | 32 (97.0%) | |
| Yes | 0 (0.0%) | 1 (5.3%) | 1 (3.0%) | |
| Hypertension | 0.881 | |||
| No | 7 (50.0%) | 9 (47.4%) | 16 (48.5%) | |
| Yes | 7 (50.0%) | 10 (52.6%) | 17 (51.5%) | |
| Hyperlipidemia | 0.024 | |||
| No | 12 (85.7%) | 9 (47.4%) | 21 (63.6%) | |
| Yes | 2 (14.3%) | 10 (52.6%) | 12 (36.4%) | |
| Diabetes | 0.119 | |||
| No | 14 (100.0%) | 16 (84.2%) | 30 (90.9%) | |
| Yes | 0 (0.0%) | 3 (15.8%) | 3 (9.1%) | |
| Obesity | 0.947 | |||
| No | 9 (64.3%) | 12 (63.2%) | 21 (63.6%) | |
| Yes | 5 (35.7%) | 7 (36.8%) | 12 (36.4%) | |
| Baseline LVDD | 0.252 | |||
| No | 12 (85.7%) | 13 (68.4%) | 25 (75.8%) | |
| Yes | 2 (14.3%) | 6 (31.6%) | 8 (24.2%) | |
| Conduction abnormalities/arrhythmias | 0.226 | |||
| LBBB | 2 (14.3%) | 0 (0.0%) | 2 (6.1%) | |
| No | 11 (78.6%) | 17 (89.5%) | 28 (84.8%) | |
| NSVT, PVCs | 1 (7.1%) | 0 (0.0%) | 1 (3.0%) | |
| RBBB | 0 (0.0%) | 1 (5.3%) | 1 (3.0%) | |
| SVT | 0 (0.0%) | 1 (5.3%) | 1 (3.0%) | |
| Liver disease | 0.210 | |||
| No | 14 (100.0%) | 17 (89.5%) | 31 (93.9%) | |
| Yes | 0 (0.0%) | 2 (10.5%) | 2 (6.1%) | |
| Smoking history | 0.450 | |||
| No | 7 (50.0%) | 12 (63.2%) | 19 (57.6%) | |
| Yes | 7 (50.0%) | 7 (36.8%) | 14 (42.4%) | |
| Renal disease | 0.160 | |||
| No | 11 (78.6%) | 18 (94.7%) | 29 (87.9%) | |
| Yes | 3 (21.4%) | 1 (5.3%) | 4 (12.1%) | |
| Depression/Anxiety | 0.518 | |||
| No | 11 (78.6%) | 13 (68.4%) | 24 (72.7%) | |
| Yes | 3 (21.4%) | 6 (31.6%) | 9 (27.3%) | |
| Connective tissue disease | 0.823 | |||
| No | 13 (92.9%) | 18 (94.7%) | 31 (93.9%) | |
| Yes | 1 (7.1%) | 1 (5.3%) | 2 (6.1%) | |
| Thyroid disease | 0.618 | |||
| No | 12 (85.7%) | 15 (78.9%) | 27 (81.8%) | |
| Yes | 2 (14.3%) | 4 (21.1%) | 6 (18.2%) | |
| Peri-partum period | 0.383 | |||
| No | 14 (100.0%) | 18 (94.7%) | 32 (97.0%) | |
| Yes | 0 (0.0%) | 1 (5.3%) | 1 (3.0%) | |
| Aspirin use | 0.979 | |||
| No | 11 (78.6%) | 15 (78.9%) | 26 (78.8%) | |
| Yes | 3 (21.4%) | 4 (21.1%) | 7 (21.2%) | |
| FH cardiac disease | 0.947 | |||
| No | 9 (64.3%) | 12 (63.2%) | 21 (63.6%) | |
| Yes | 5 (35.7%) | 7 (36.8%) | 12 (36.4%) | |
| ER positive | 0.187 | |||
| No | 5 (35.7%) | 3 (15.8%) | 8 (24.2%) | |
| Yes | 9 (64.3%) | 16 (84.2%) | 25 (75.8%) | |
| PR positive | 0.393 | |||
| No | 6 (42.9%) | 11 (57.9%) | 17 (51.5%) | |
| Yes | 8 (57.1%) | 8 (42.1%) | 16 (48.5%) | |
| Baseline EF | 0.556 | |||
| Mean (SD) | 59% (0.07) | 63% (0.04) | 61% (0.06) | |
| Median (Range %) | 61% (43, 70) | 62% (55, 71) | 62% (43, 71) | |
| Lowest EF | < 0.001 | |||
| Mean (SD) | 42% (0.08) | 61% (0.04) | 52% (0.11) | |
| Median (Range %) | 43% (18, 50) | 62% (55, 70) | 57% (18, 70) | |
| Change in EF | 0.007 | |||
| Mean (SD) | 17% (0.08) | 1% (0.05) | 8% (0.10) | |
| Median (Range %) | 16% (3, 32) | 1% (−8, 14) | 5% (−8, 32) | |
| Pre-chemo strain | 0.844 | |||
| Mean (SD) | −19% (0.04) | −21% (0.02) | −20% (0.03) | |
| Median (Range %) | −20% (−26, −10) | −21% (−25, −18) | −0.20% (−26, −10) | |
| Most recent strain | 0.011 | |||
| Mean (SD) | −16% (0.04) | −20% (0.03) | −0.18% (0.04) | |
| Median (Range %) | −16% (−24, −11) | −19% (−26, −16) | −18% (−26, −11) | |
| ER PR status | 0.070 | |||
| ER-/PR- | 5 (35.7%) | 3 (15.8%) | 8 (24.2%) | |
| ER+/PR- | 1 (7.1%) | 8 (42.1%) | 9 (27.3%) | |
| ER+/PR+ | 8 (57.1%) | 8 (42.1%) | 16 (48.5%) |
| House Keeping Gene | Gene of Interest | ≥55% LVEF (RGE) | <50% LVEF (RGE) | p-Value |
|---|---|---|---|---|
| PUM1 | ||||
| ET1 | 5.2 ± 0.9 | 10.8 ± 2.4 | 0.03 | |
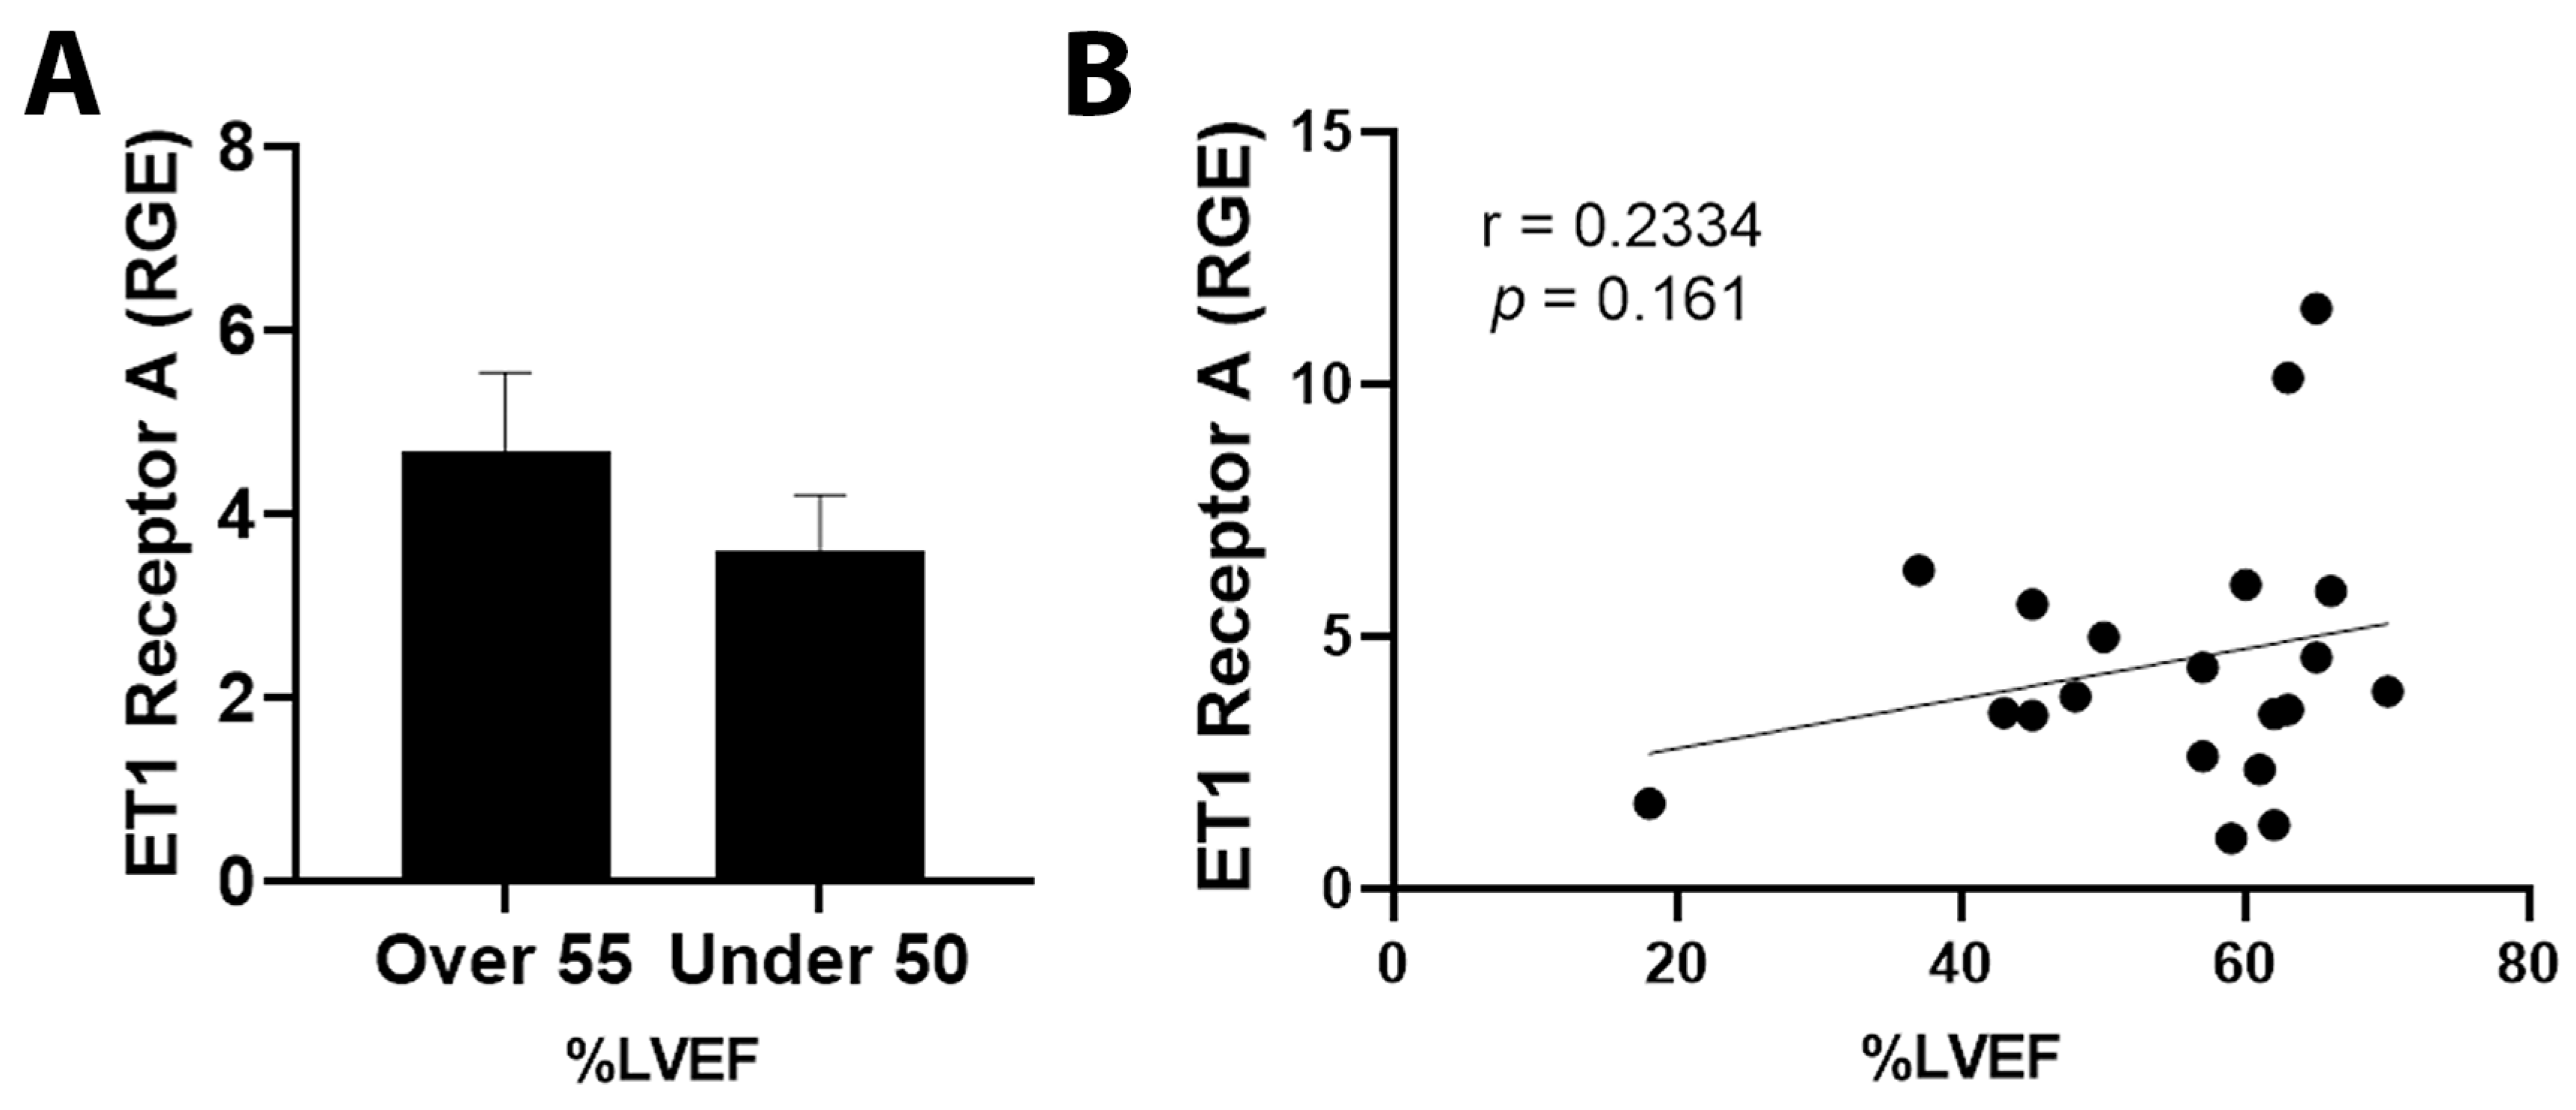
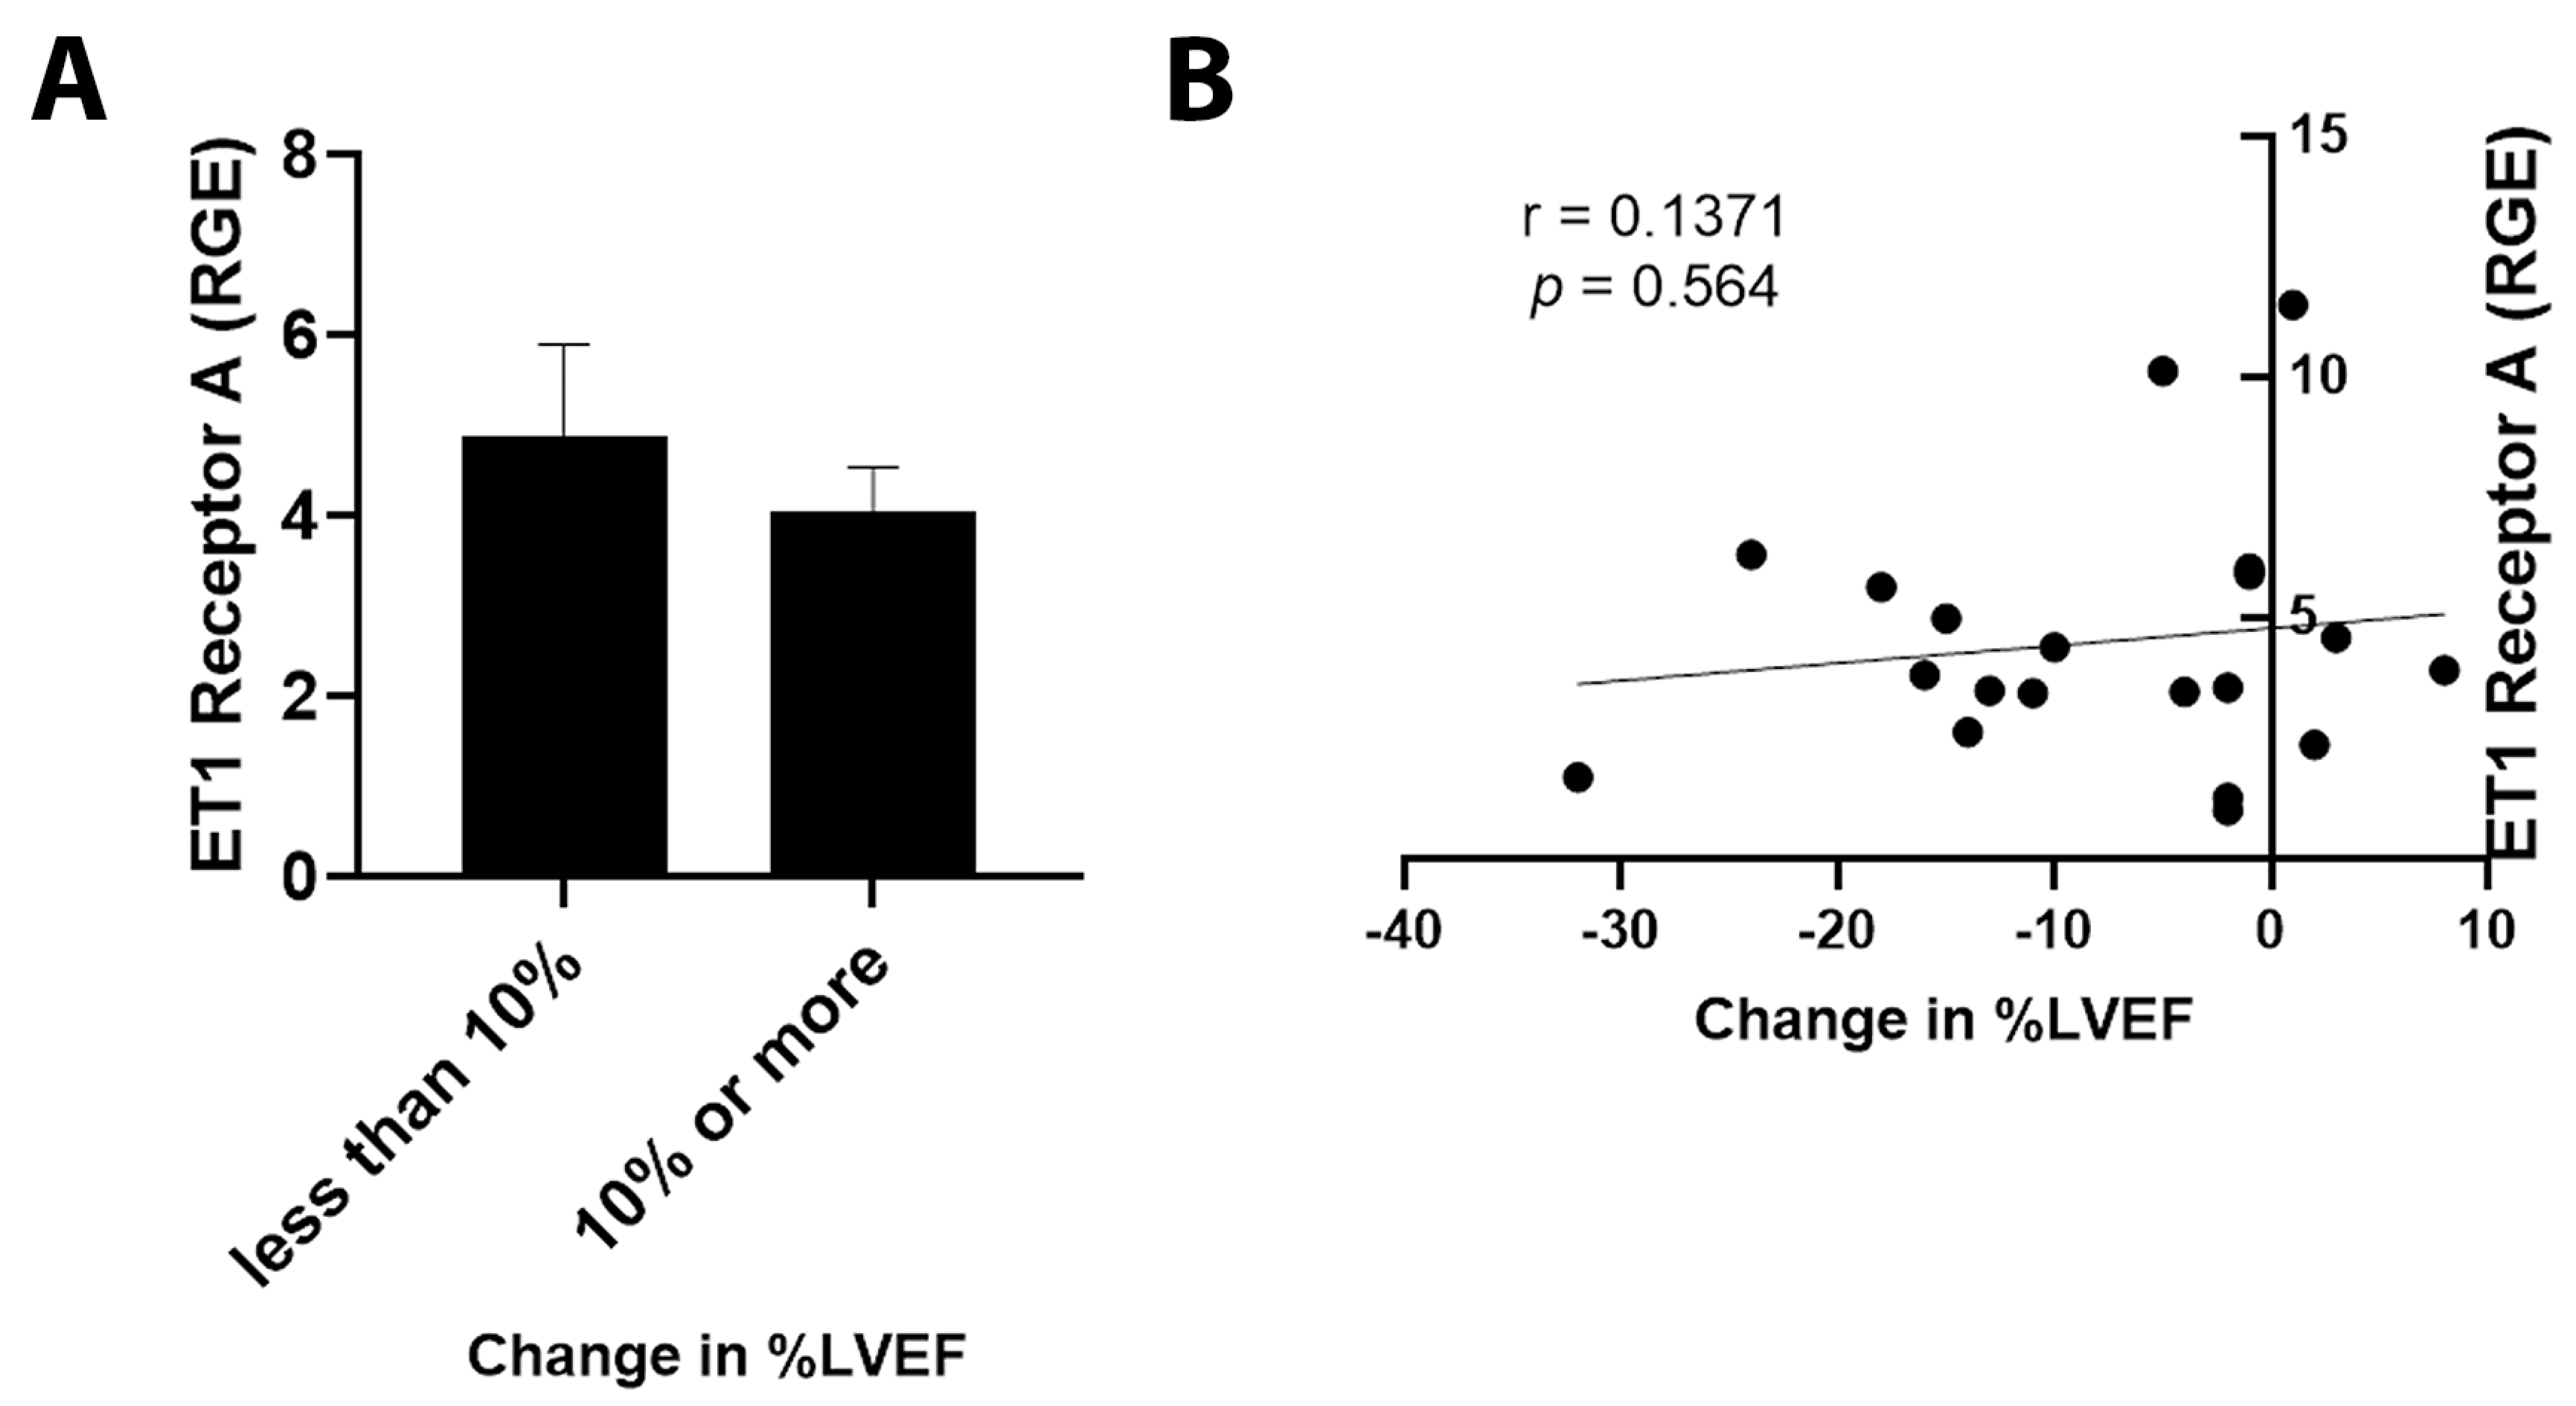
| ET1 Receptor A | 7.3 ± 2.8 | 3.6 ± 0.6 | 0.10 | |
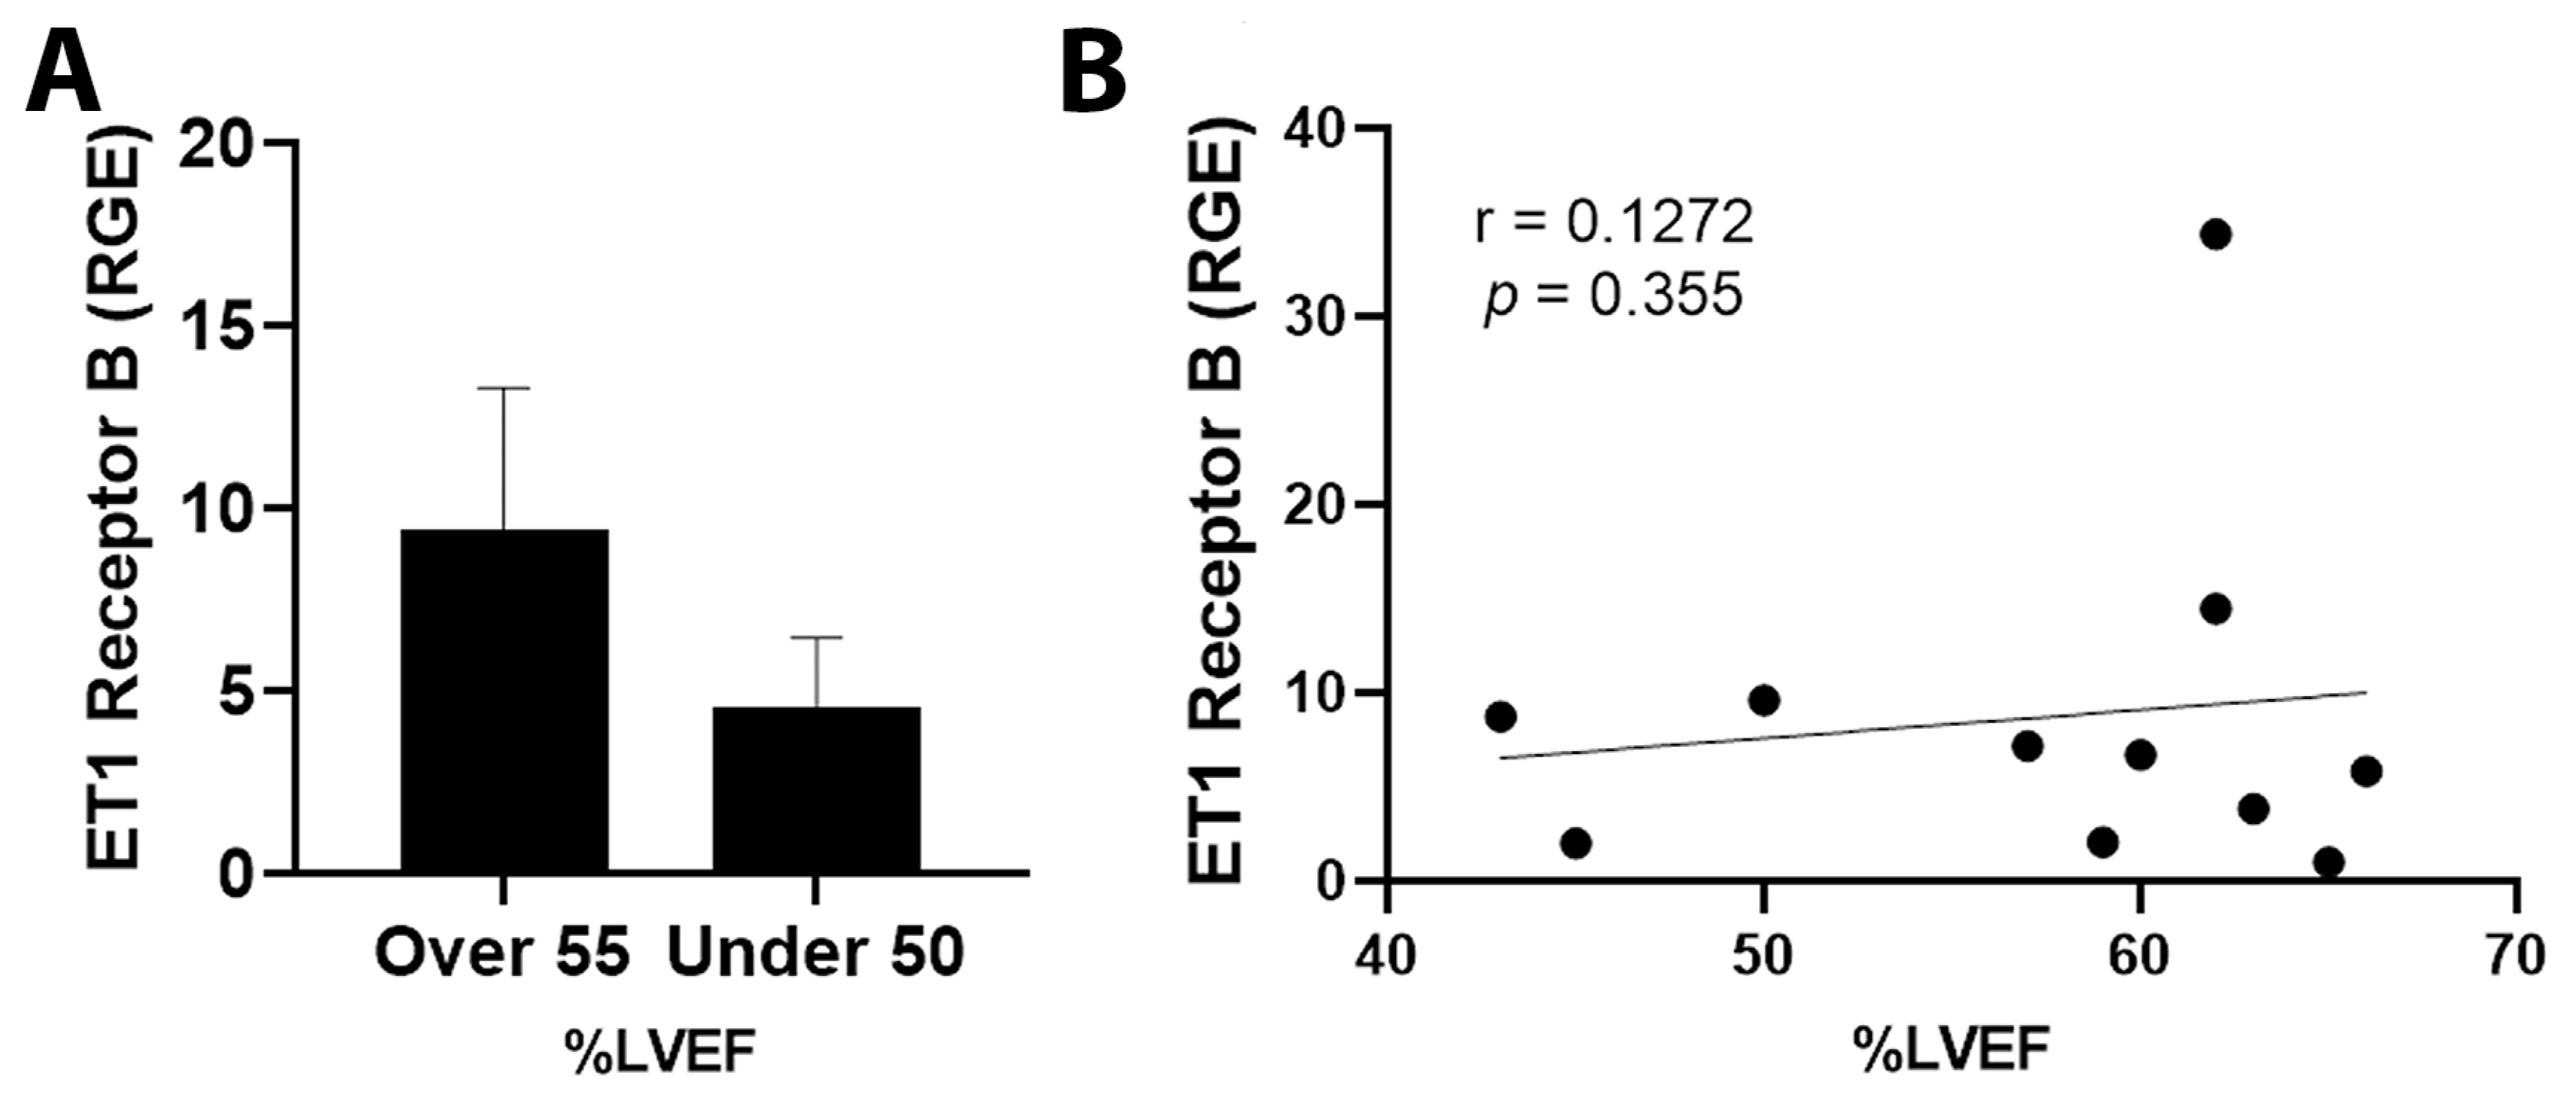
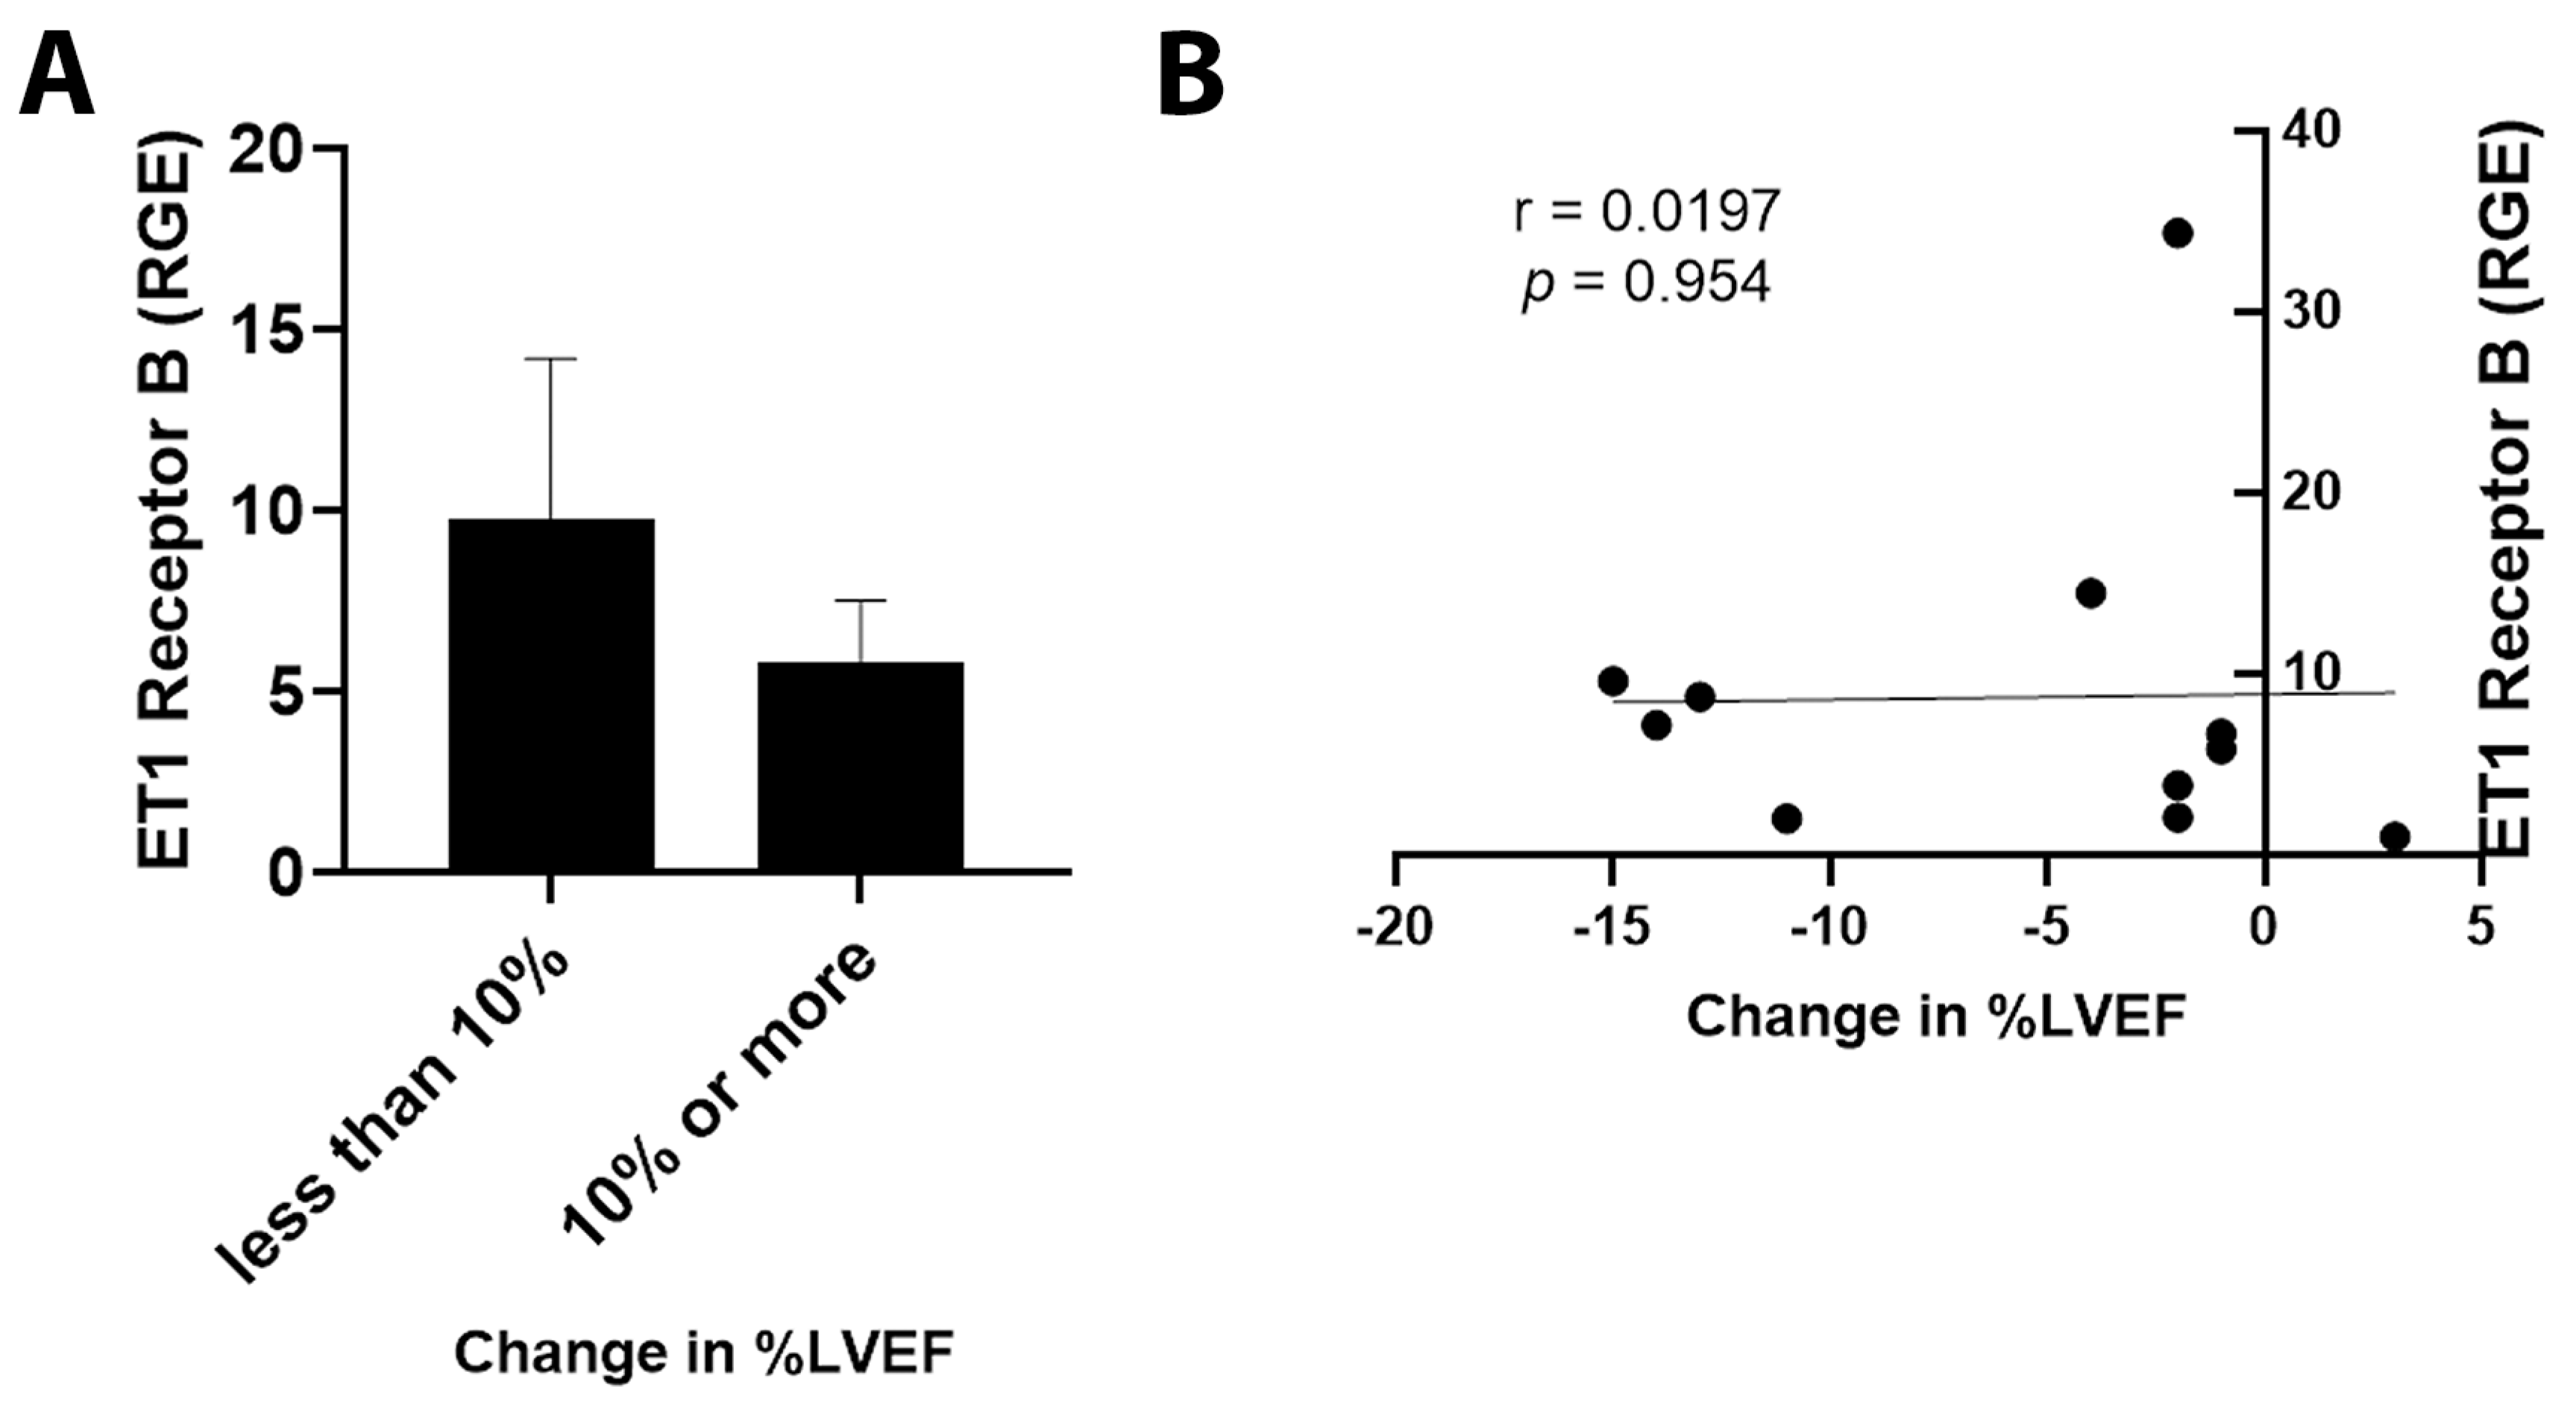
| ET1 Receptor B | 9.4 ± 3.8 | 4.5 ± 1.9 | 0.14 | |
| ART1 | 6.3 ± 1.6 | 9.3 ± 3.2 | 0.43 | |
| SYMPK | ||||
| ET1 | 6.5 ± 1.3 | 11.9 ± 2.3 | 0.04 | |
| ET1 Receptor A | 2.9 ± 0.3 | 2.1 ± 0.4 | 0.05 | |
| ET1 Receptor B | 38.6 ± 10.2 | 25.1 ± 6.3 | 0.14 | |
| ART1 | 36.7 ± 13.1 | 35.3 ± 14.4 | 0.47 | |
| CCSER2 | ||||
| ET1 | 5.5 ± 0.9 | 9.4 ± 3.9 | 0.17 | |
| ET1 Receptor A | 5.5 ± 1.6 | 3.4 ± 0.9 | 0.14 | |
| ET1 Receptor B | 10.8 ± 3.1 | 11.0 ± 6.5 | 0.48 | |
| ART1 | 72.5 ± 22.9 | 27.3 ± 6.7 | 0.05 | |
| ANKRD17 | ||||
| ET1 | 7.6 ± 1.2 | 14.2 ± 3.3 | 0.04 | |
| ET1 Receptor A | 9.4 ± 2.7 | 10.0 ± 2.3 | 0.43 | |
| ET1 Receptor B | 4.6 ± 0.7 | 4.7 ± 1.7 | 0.48 | |
| ART1 | 7.2 ± 1.4 | 27.1 ± 18.8 | 0.16 |
Publisher’s Note: MDPI stays neutral with regard to jurisdictional claims in published maps and institutional affiliations. |
© 2022 by the authors. Licensee MDPI, Basel, Switzerland. This article is an open access article distributed under the terms and conditions of the Creative Commons Attribution (CC BY) license (https://creativecommons.org/licenses/by/4.0/).
Share and Cite
Krishnarao, K.; Bruno, K.A.; Di Florio, D.N.; Edenfield, B.H.; Whelan, E.R.; Macomb, L.P.; McGuire, M.M.; Hill, A.R.; Ray, J.C.; Cornell, L.F.; et al. Upregulation of Endothelin-1 May Predict Chemotherapy-Induced Cardiotoxicity in Women with Breast Cancer. J. Clin. Med. 2022, 11, 3547. https://doi.org/10.3390/jcm11123547
Krishnarao K, Bruno KA, Di Florio DN, Edenfield BH, Whelan ER, Macomb LP, McGuire MM, Hill AR, Ray JC, Cornell LF, et al. Upregulation of Endothelin-1 May Predict Chemotherapy-Induced Cardiotoxicity in Women with Breast Cancer. Journal of Clinical Medicine. 2022; 11(12):3547. https://doi.org/10.3390/jcm11123547
Chicago/Turabian StyleKrishnarao, Krithika, Katelyn A. Bruno, Damian N. Di Florio, Brandy H. Edenfield, Emily R. Whelan, Logan P. Macomb, Molly M. McGuire, Anneliese R. Hill, Jordan C. Ray, Lauren F. Cornell, and et al. 2022. "Upregulation of Endothelin-1 May Predict Chemotherapy-Induced Cardiotoxicity in Women with Breast Cancer" Journal of Clinical Medicine 11, no. 12: 3547. https://doi.org/10.3390/jcm11123547
APA StyleKrishnarao, K., Bruno, K. A., Di Florio, D. N., Edenfield, B. H., Whelan, E. R., Macomb, L. P., McGuire, M. M., Hill, A. R., Ray, J. C., Cornell, L. F., Tan, W., Geiger, X. J., Salomon, G. R., Douglass, E. J., Fairweather, D., & Yamani, M. H. (2022). Upregulation of Endothelin-1 May Predict Chemotherapy-Induced Cardiotoxicity in Women with Breast Cancer. Journal of Clinical Medicine, 11(12), 3547. https://doi.org/10.3390/jcm11123547