
Parity-Adjusted Term Neonatal Growth Chart Modifies Neonatal Morbidity and Mortality Risk Stratification

 ,
, 
Abstract
:1. Introduction
2. Materials and Methods
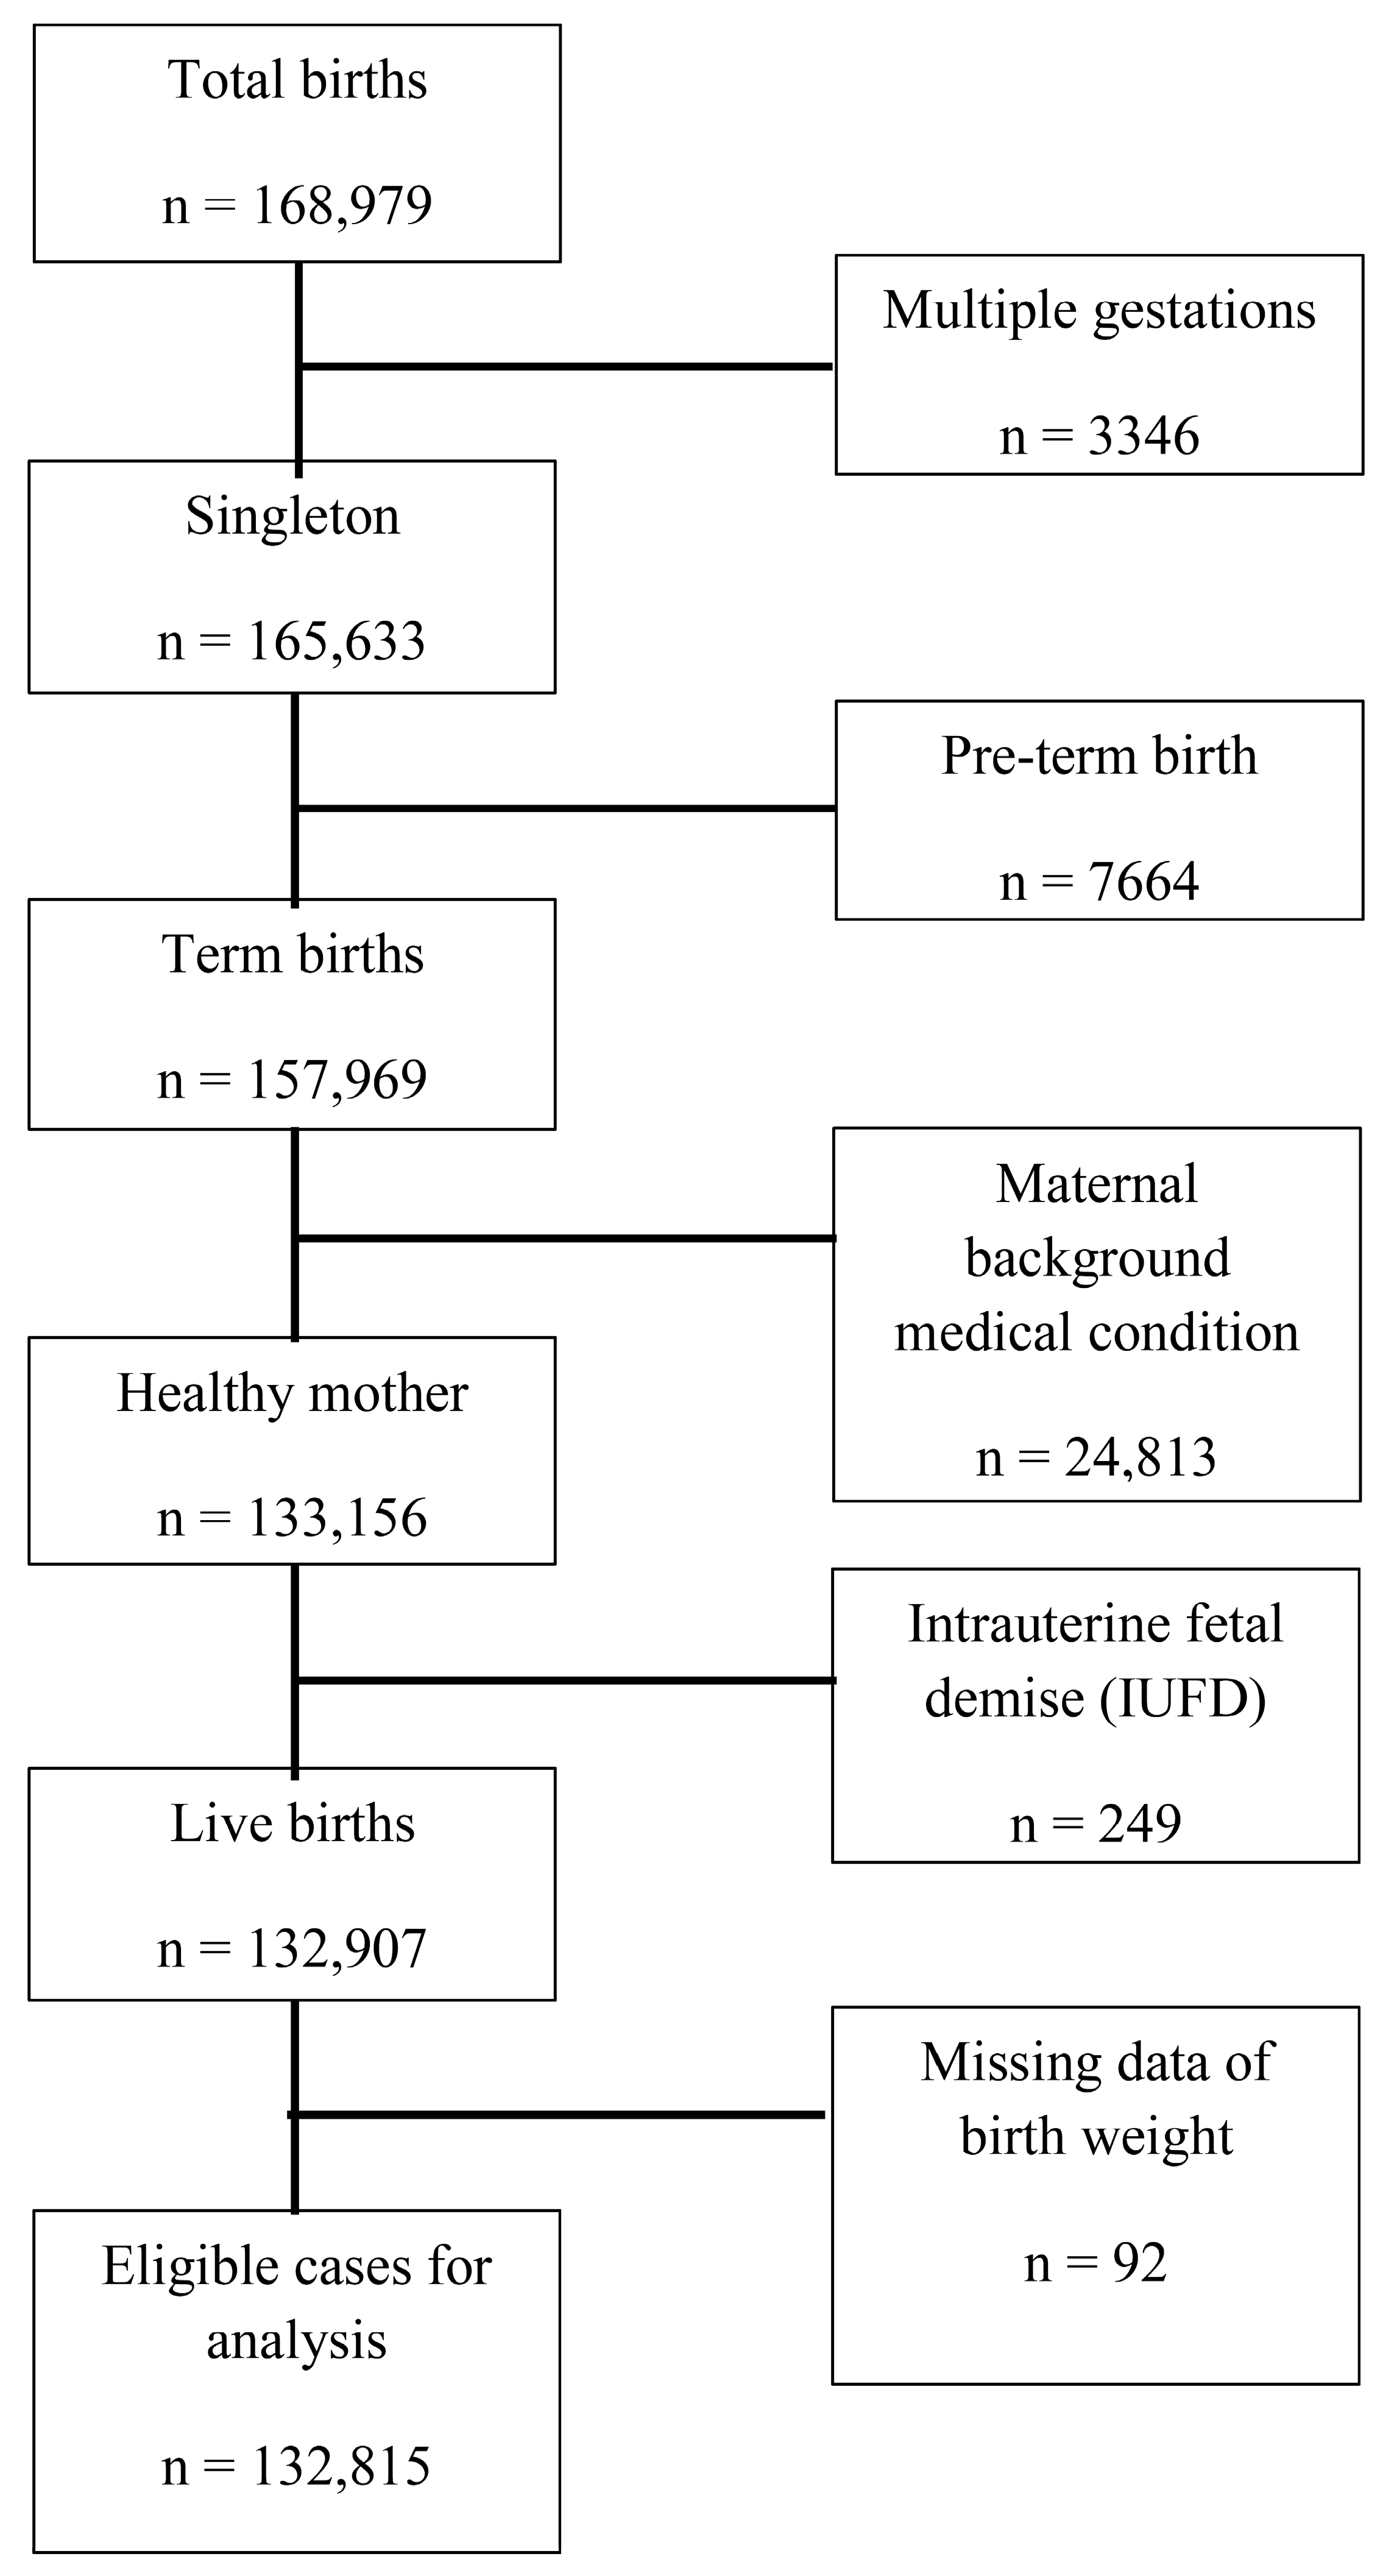
2.1. Study Population
2.2. Study Design
2.3. Statistical Methods
2.4. Ethics
3. Results
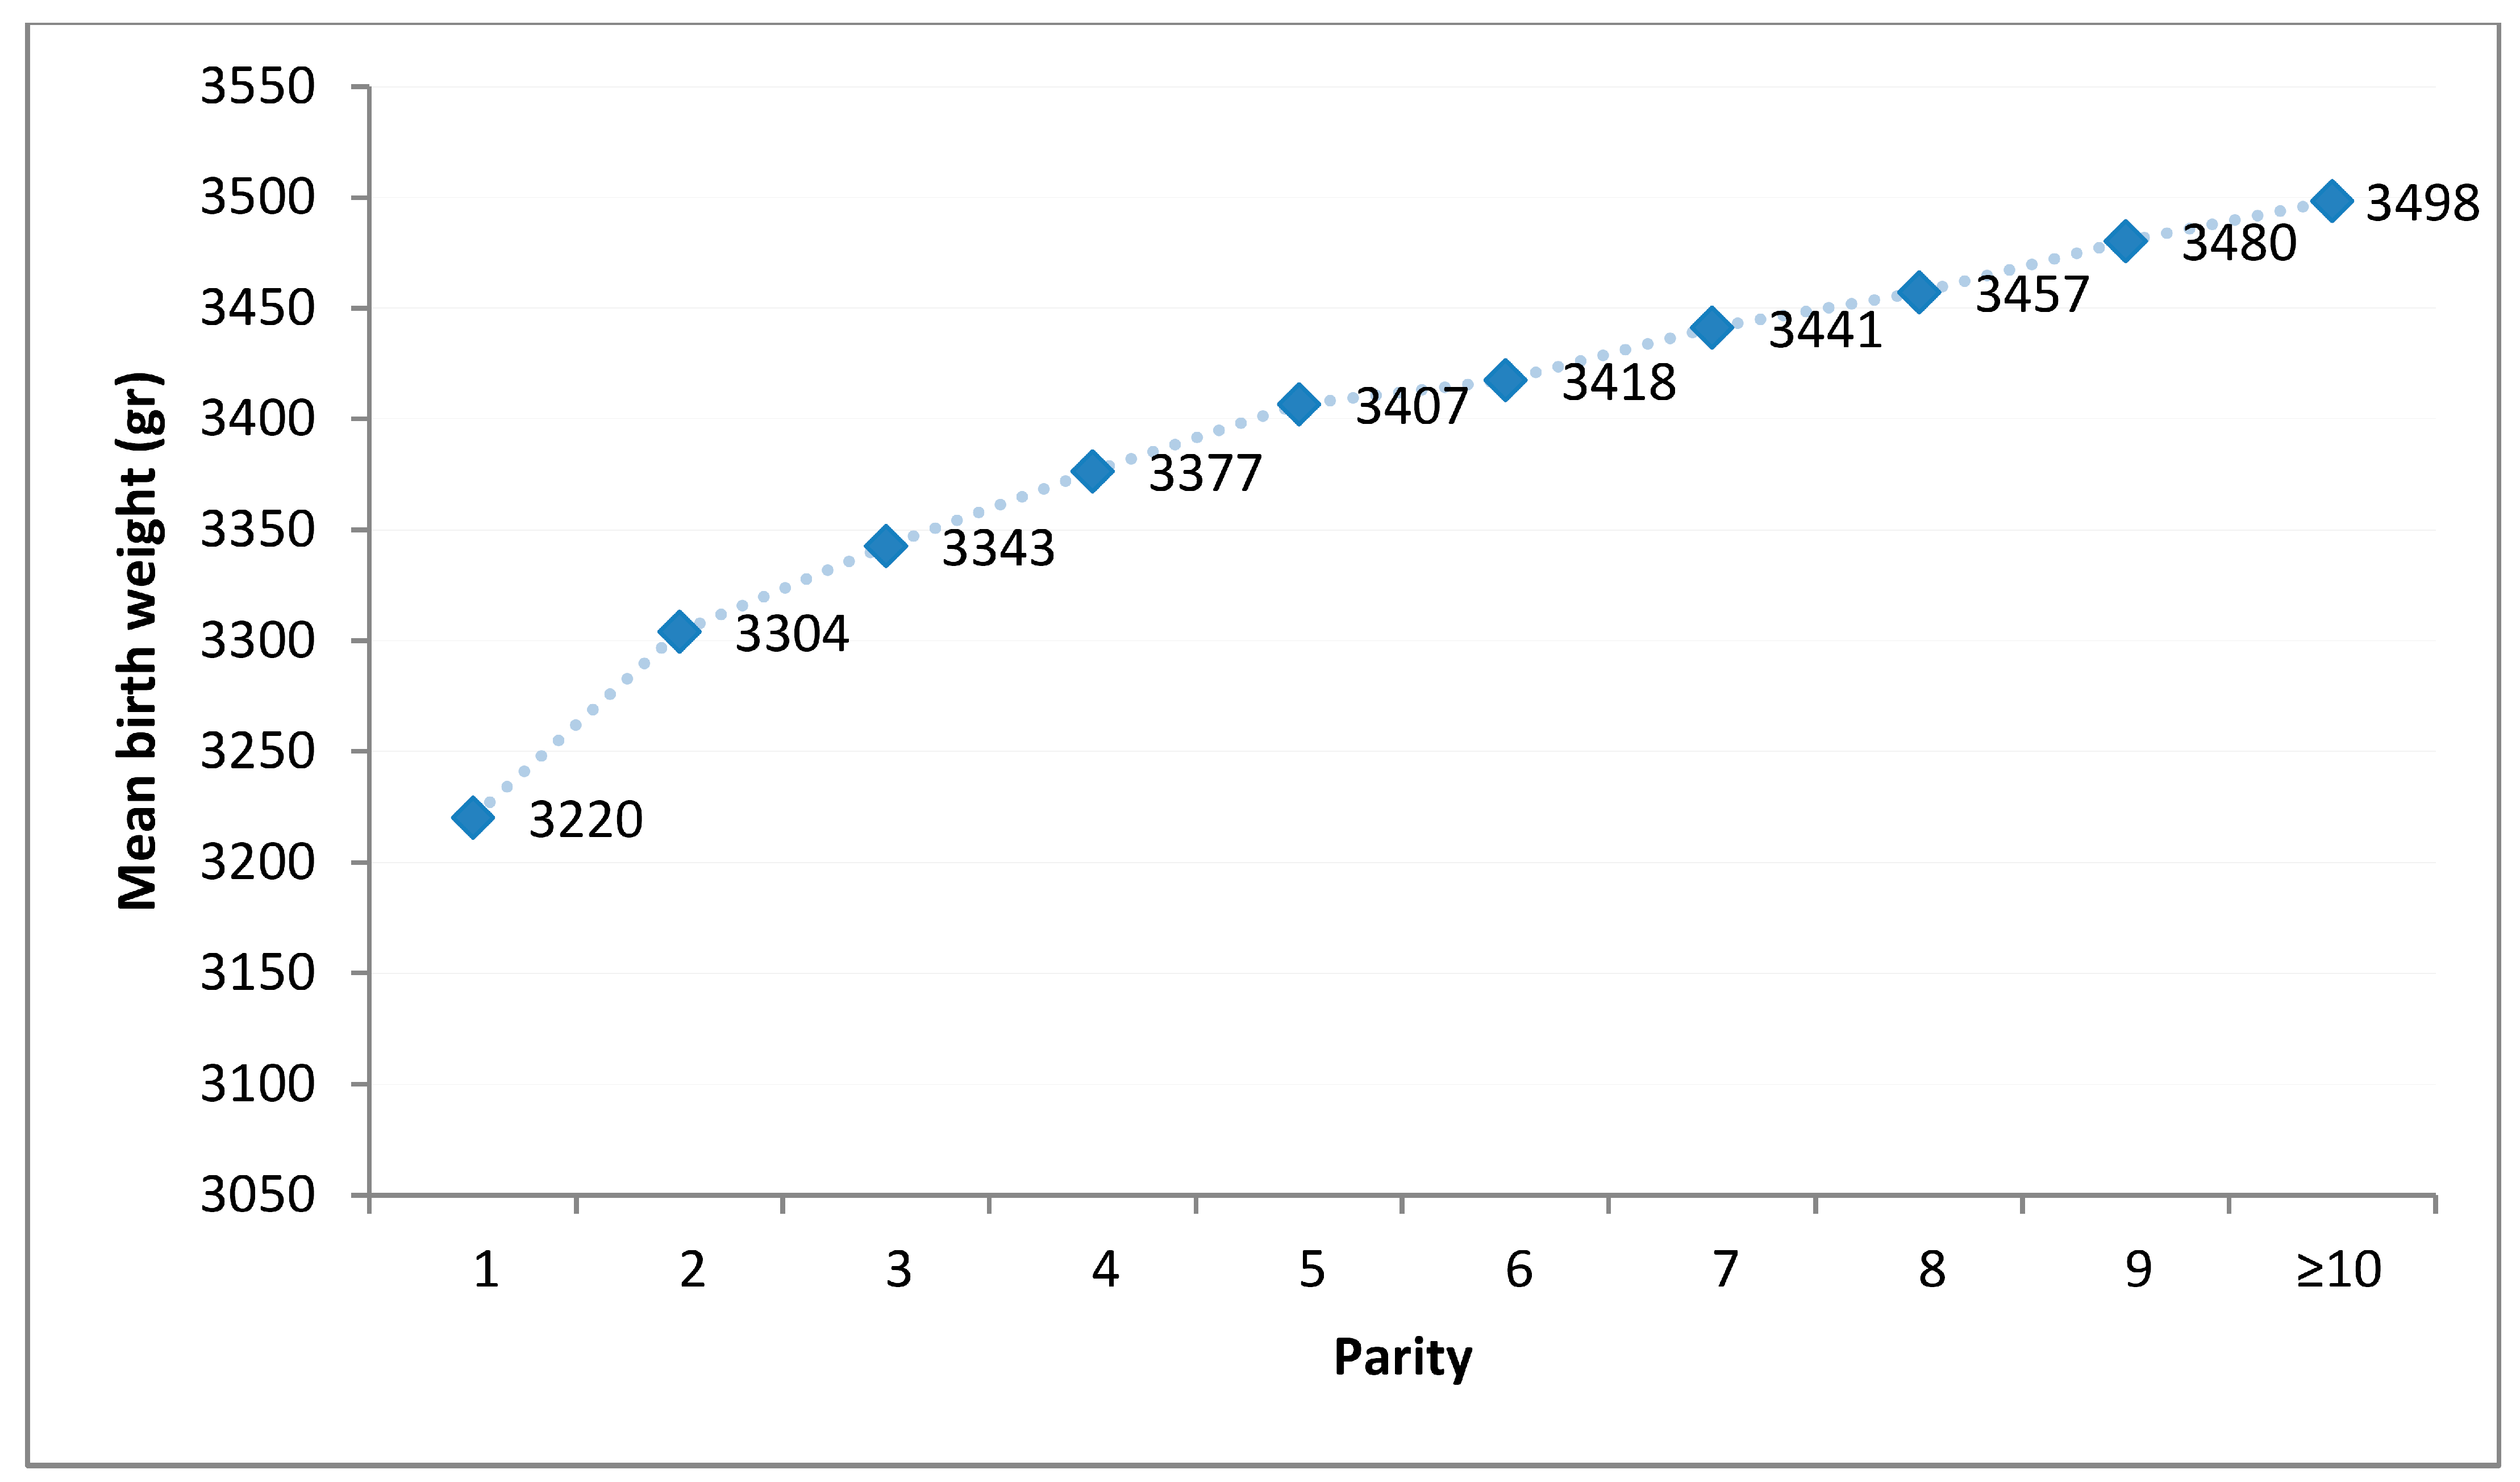
3.1. Birthweight
3.2. Overall Neonatal Risk of Morbidity and Mortality
3.3. Adverse Neonatal Outcome Analysis for Each Birth Weight Definition Groups
Univariable Models
3.4. Multivariable Models
4. Discussion
5. Conclusions
Author Contributions
Funding
Institutional Review Board Statement
Informed Consent Statement
Data Availability Statement
Conflicts of Interest
Abbreviations
Appendix A

| Parity | N | % |
|---|---|---|
| 1 | 32,351 | 24.3% |
| 2 | 28,704 | 21.6% |
| 3 | 22,757 | 17.1% |
| 4 | 16,218 | 12.2% |
| 5 | 11,224 | 8.4% |
| 6 | 7705 | 5.8% |
| 7 | 5168 | 3.9% |
| 8 | 3430 | 2.6% |
| 9 | 2195 | 17% |
| 10 | 1415 | 1.05% |
| 11 | 802 | 0.603% |
| 12 | 526 | 0.396% |
| 13 | 224 | 0.169% |
| 14 | 107 | 0.081% |
| 15 | 55 | 0.041% |
| 16 | 15 | 0.011% |
| 17 | 7 | 0.005% |
| 18 | 3 | 0.002% |
| 19 | 1 | 0.001% |
| Total | 132,907 | 100.000% |
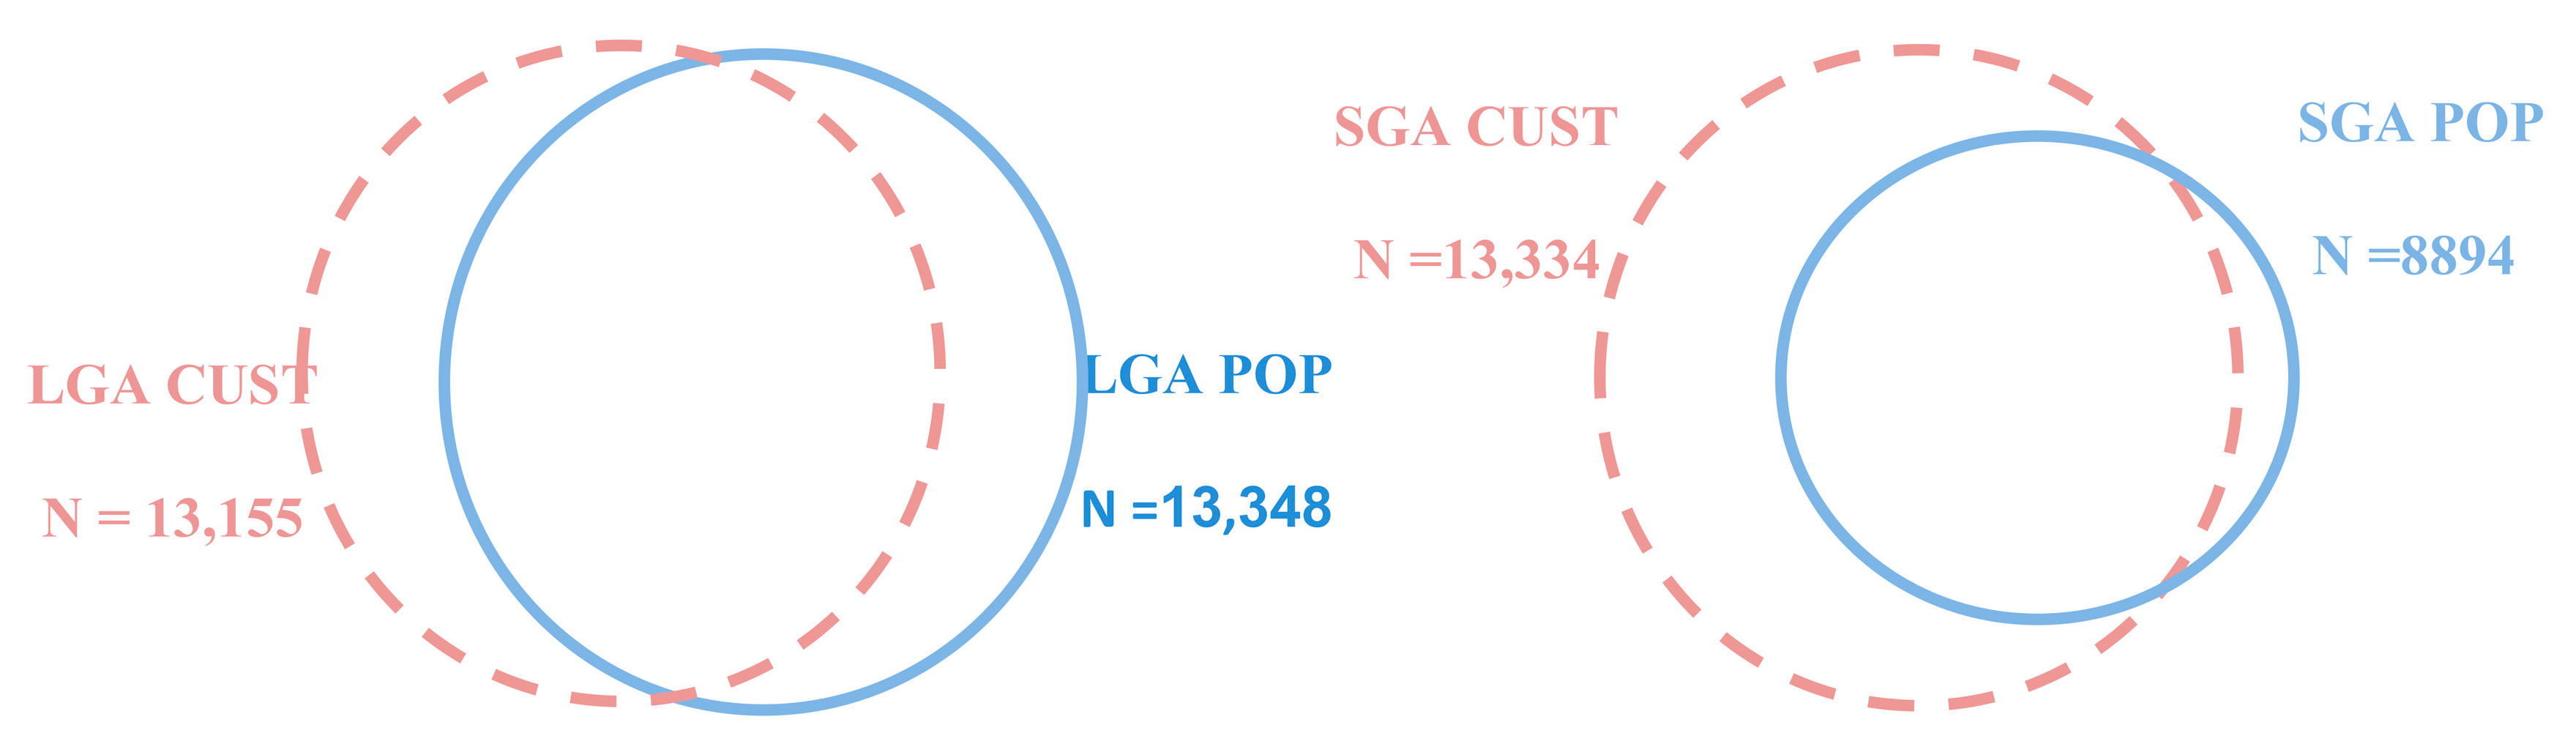
| Outcome | Full Cohort N = 132,815 N (%) | SGA CUST N=13,334 N (%) | p Value | SGA POP N=8,894 N (%) | p Value |
|---|---|---|---|---|---|
| 5’ Apgar < 7 | 1876 (1.4%) | 283 (2.1%) | <0.0001 | 194 (2.2%) | <0.0001 |
| Meconium aspiration | 217 (0.2%) | 35 (0.3%) | 0.003 | 27 (0.3%) | 0.001 |
| Hypoglycemia | 3640 (2.7%) | 507 (3.8%) | <0.0001 | 368 (4.1%) | <0.0001 |
| NICU > 72 h | 656 (0.5%) | 190 (1.4%) | <0.0001 | 176 (2.0%) | <0.0001 |
| Neonatal death | 12 (0.009%) | 8 (0.1%) | <0.0001 | 5 (0.1%) | <0.0001 |
| Outcome | Full Cohort N = 132,815 N (%) | LGA CUST N = 13,155 N (%) | p Value | LGA POP N = 13,348 N (%) | p Value |
|---|---|---|---|---|---|
| Shoulder dystocia | 426 (0.3%) | 218 (1.6%) | <0.0001 | 224 (2.5%) | <0.0001 |
| 5’ Apgar < 7 | 1876 (1.4%) | 134 (1.0%) | <0.0001 | 145 (1.6%) | 0.001 |
| Meconium aspiration | 217 (0.2%) | 25 (0.2%) | 0.42 | 21 (0.2%) | 0.85 |
| Hypoglycemia | 3640 (2.7%) | 564 (4.2%) | <0.0001 | 588 (6.6%) | <0.0001 |
| NICU > 72 h | 656 (0.5%) | 67 (0.5%) | 0.791 | 67 (0.8%) | 0.521 |
| Neonatal death | 12 (0.009%) | 0 (0.0%) | - | 0 (0.0%) | - |
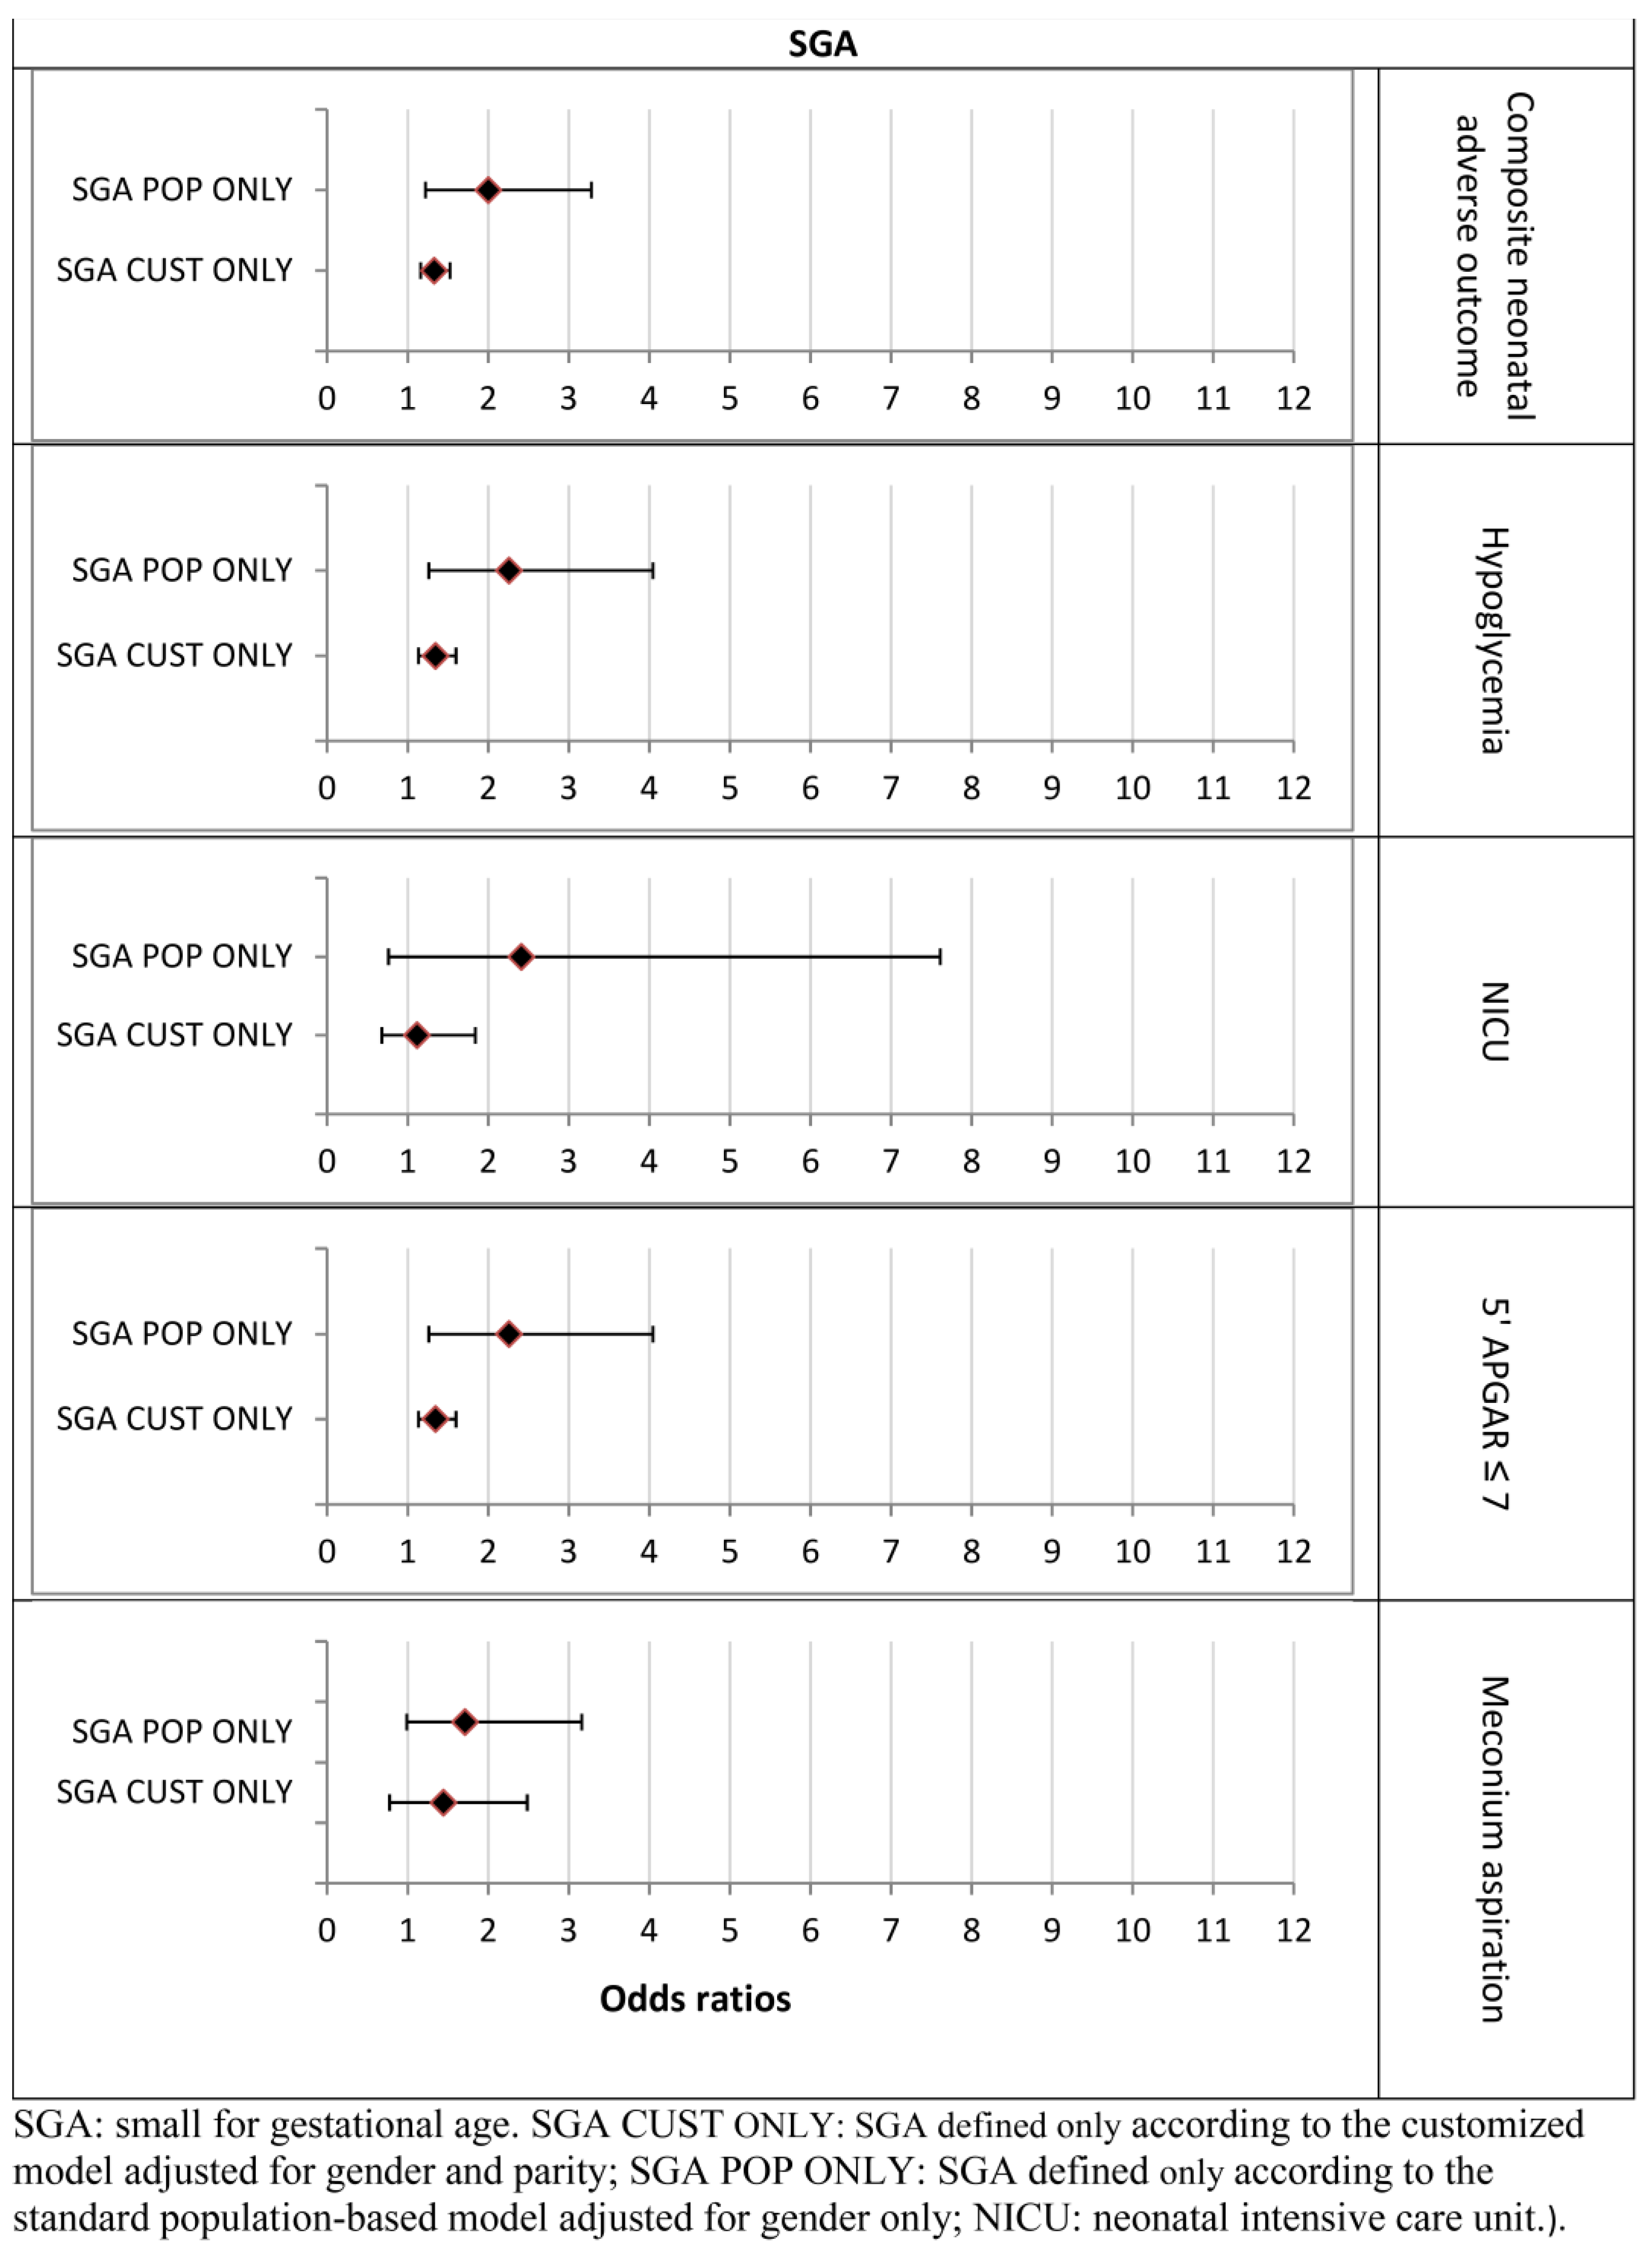
| Group | N (% of Total Cohort) | OR | [95% CI] | p Value |
|---|---|---|---|---|
| SGA BOTH | 8592 (6.4%) | 2.20 | [2.01–2.41] | <0.0001 |
| SGA-POP ONLY | 302 (0.2%) | 2.00 | [1.22–3.28] | 0.006 |
| SGA-CUST ONLY | 4742 (3.6%) | 1.33 | [1.16–1.53] | <0.0001 |
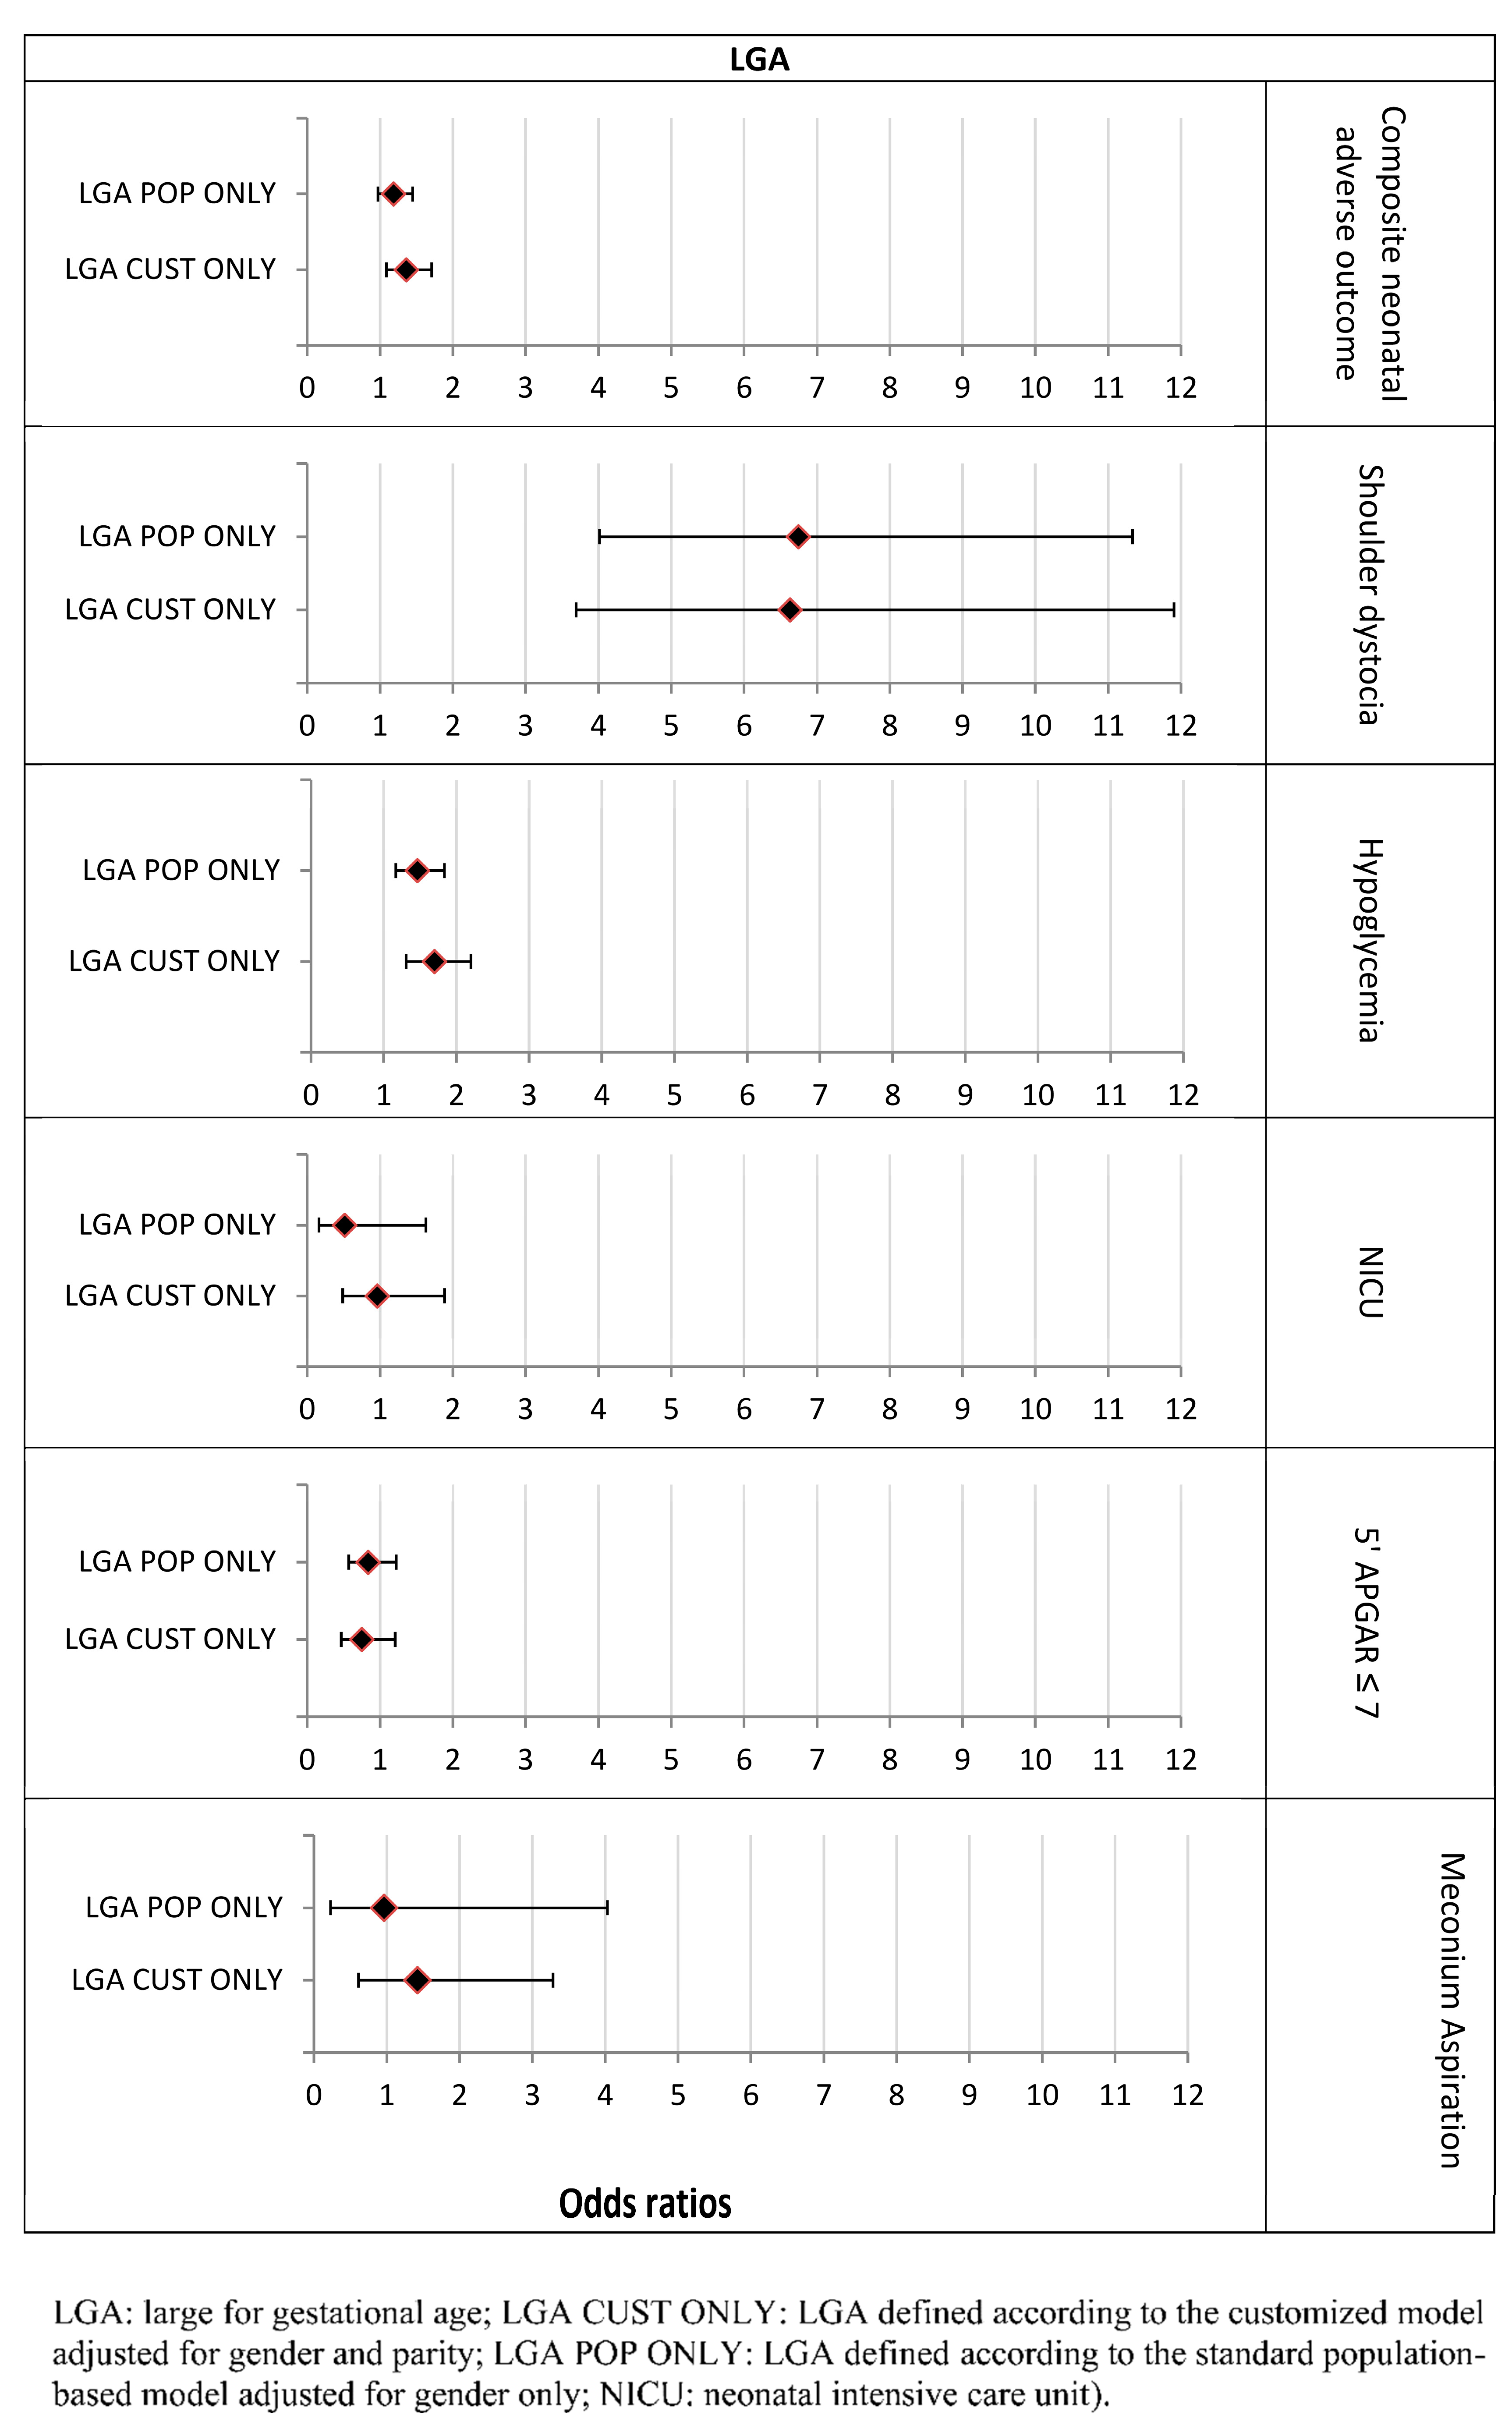
| LGA BOTH | 11,087 (8.3%) | 1.62 | [1.48–1.77] | <0.0001 |
| LGA-POP ONLY | 2261 (1.7%) | 1.19 | [0.97–1.45] | 0.092 |
| LGA-CUST ONLY | 2068 (1.5%) | 1.36 | [1.09–1.71] | 0.007 |
| Group | N (% of Total Cohort) | OR | [95% CI] | p Value |
|---|---|---|---|---|
| LGA BOTH | 11,087 (8.3%) | 16.6 | [12.63–21.82] | <0.0001 |
| LGA-POP ONLY | 2261 (1.7%) | 6.75 | [4.02–11.33] | <0.0001 |
| LGA-CUST ONLY | 2068 (1.5%) | 6.63 | [3.69–11.90] | <0.0001 |
References
- Anderson, M.S.; Hay, W.W. Intrauterine growth restriction and the small-for-gestational-age infant. Neonatology 1999, 1999, 411–444. [Google Scholar]
- Liu, J.; Wang, X.F.; Wang, Y.; Wang, H.W.; Liu, Y. The incidence rate, high-risk factors, and short- and long-term adverse outcomes of fetal growth restriction: A report from Mainland China. Medicine 2014, 93, e210. [Google Scholar] [CrossRef] [PubMed]
- Holtrop, P.C. The Frequency of Hypoglycemia in Full-Term Large and Small for Gestational Age Newborns. Am. J. Perinatol. 1993, 10, 150–154. [Google Scholar] [CrossRef]
- Williams, R.L.; Creasy, R.K.; Cunningham, G.C.; Hawes, W.E.; Norris, F.D.; Tashiro, M. Fetal growth and perinatal viability in California. Obstet. Gynecol. 1982, 59, 624–632. [Google Scholar]
- Wennergren, M.; Wennergren, G.; Vilbergsson, G. Obstetric characteristics and neonatal performance in a four-year small for gestational age population. Obstet. Gynecol. 1988, 72, 615–620. [Google Scholar]
- Malloy, M.H. Size for gestational age at birth: Impact on risk for sudden infant death and other causes of death, USA 2002. Arch. Dis. Child. Fetal Neonatal Ed. 2007, 92, F473–F478. [Google Scholar] [CrossRef] [Green Version]
- Kok, J.H.; Ouden, A.L.D.; Verloove-Vanhorick, S.P.; Brand, R. Outcome of very preterm small for gestational age infants: The first nine years of life. BJOG Int. J. Obstet. Gynaecol. 1998, 105, 162–168. [Google Scholar] [CrossRef]
- Boulet, S.; Alexander, G.R.; Salihu, H.M.; Pass, M. Macrosomic births in the united states: Determinants, outcomes, and proposed grades of risk. Am. J. Obstet. Gynecol. 2003, 188, 1372–1378. [Google Scholar] [CrossRef]
- Groenendaal, F.; Elferink-Stinkens, P.M.; Registry, T.N.P. Hypoglycaemia and seizures in large-for-gestational-age (LGA) full-term neonates. Acta Paediatr. 2007, 95, 874–876. [Google Scholar] [CrossRef]
- Persson, M.; Fadl, H.; Hanson, U.; Pasupathy, D. Disproportionate Body Composition and Neonatal Outcome in Offspring of Mothers With and Without Gestational Diabetes Mellitus. Diabetes Care 2013, 36, 3543–3548. [Google Scholar] [CrossRef] [Green Version]
- Ehrenberg, H.M.; Mercer, B.M.; Catalano, P.M. The influence of obesity and diabetes on the prevalence of macrosomia. Am. J. Obstet. Gynecol. 2004, 191, 964–968. [Google Scholar] [CrossRef] [PubMed]
- DeVader, S.R.; Neeley, H.L.; Myles, T.D.; Leet, T.L. Evaluation of gestational weight gain guidelines for women with normal prepregnancy body mass index. Obstet. Gynecol. 2007, 110, 745–751. [Google Scholar] [CrossRef] [PubMed]
- Anderson, N.H.; Sadler, L.C.; McKinlay, C.; McCowan, L. INTERGROWTH-21st vs. customized birthweight standards for identification of perinatal mortality and morbidity. Am. J. Obstet. Gynecol. 2016, 214, 509.e1–509.e7. [Google Scholar] [CrossRef] [Green Version]
- Clausson, B.; Gardosi, J.; Francis, A.; Cnattingius, S. Perinatal outcome in SGA births defined by customised versus population-based birthweight standards. BJOG Int. J. Obstet. Gynaecol. 2001, 108, 830–834. [Google Scholar] [CrossRef] [PubMed]
- Gardosi, J.; Clausson, B.; Francis, A. The value of customised centiles in assessing perinatal mortality risk associated with parity and maternal size. BJOG Int. J. Obstet. Gynaecol. 2009, 116, 1356–1363. [Google Scholar] [CrossRef]
- Gibbons, K.; Chang, A.; Flenady, V.; Mahomed, K.; Gardener, G.; Gray, P.; Beckmann, M.; Rossouw, D. Customised birthweight models: Do they increase identification of at-risk infants? J. Paediatr. Child Health 2013, 49, 380–387. [Google Scholar] [CrossRef]
- Iliodromiti, S.; Mackay, D.F.; Smith, G.C.; Pell, J.P.; Sattar, N.; Lawlor, D.A.; Nelson, S.M. Customised and noncustomised birth weight centiles and prediction of stillbirth and infant mortality and morbidity: A cohort study of 979,912 term singleton pregnancies in Scotland. PLoS Med. 2017, 14, e1002228. [Google Scholar] [CrossRef] [Green Version]
- Norris, T.; Johnson, W.; Farrar, D.; Tuffnell, D.; Wright, J.; Cameron, N. Small-for-gestational age and large-for-gestational age thresholds to predict infants at risk of adverse delivery and neonatal outcomes: Are current charts adequate? An observational study from the Born in Bradford cohort. BMJ Open 2015, 5, e006743. [Google Scholar] [CrossRef] [Green Version]
- Ego, A.; Subtil, D.; Grange, G.; Thiebaugeorges, O.; Vayssière, C.; Zeitlin, J.; Senat, M.-V. Should parity be included in customised fetal weight standards for identifying small-for-gestational-age babies? Results from a French multicentre study. BJOG Int. J. Obstet. Gynaecol. 2008, 115, 1256–1264. [Google Scholar] [CrossRef]
- Piaggio, U. Question 1: UK-WHO versus customised growth charts for the identification of at-risk small for gestational age infants: Which one should we use? Arch. Dis. Child. 2017, 103, 399–401. [Google Scholar] [CrossRef]
- Juntunen, K.S.; Läärä, E.M.; Kauppila, A.J. Grand grand multiparity and birth weight. Obstet. Gynecol. 1997, 90, 495–499. [Google Scholar] [CrossRef]
- Groom, K.M.; Poppe, K.K.; North, R.A.; McCowan, L.M. Small-for-gestational-age infants classified by customized or population birthweight centiles: Impact of gestational age at delivery. Am. J. Obstet. Gynecol. 2007, 197, 239.e1–239.e5. [Google Scholar] [CrossRef] [PubMed]
- Cha, H.-H.; Kim, J.-Y.; Choi, S.-J.; Oh, S.-Y.; Roh, C.-R.; Kim, J.-H. Can a customized standard for large for gestational age identify women at risk of operative delivery and shoulder dystocia? J. Périnat. Med. 2012, 40, 483–488. [Google Scholar] [CrossRef] [PubMed] [Green Version]
- Mele, L.; Landon, M.B.; Spong, C.Y.; Ramin, S.M.; Casey, B.; Wapner, R.J.; Varner, M.W.; Rouse, D.J.; Thorp, J.; Sciscione, A.; et al. Customized versus Population Approach for Evaluation of Fetal Overgrowth. Am. J. Perinatol. 2012, 30, 565–572. [Google Scholar] [CrossRef] [Green Version]
- Van Eerd, E.A.M.; Roex, A.J.M.; Nikpoor, P.; Dekker, G.A. Adverse perinatal outcome and maternal risk factors in population versus customized defined SGA babies. J. Matern. Neonatal Med. 2011, 25, 369–373. [Google Scholar] [CrossRef]
- Dollberg, S.; Haklai, Z.; Mimouni, F.B.; Gorfein, I.; Gordon, E.-S. Birth weight standards in the live-born population in Israel. Isr. Med. Assoc. J. 2005, 7, 311–314. [Google Scholar]
- Lyrenäs, S. Labor in the grand multipara. Gynecol. Obstet. Investig. 2002, 53, 6–12. [Google Scholar] [CrossRef]
- Fadeev, A.; Ioscovitch, A.; Rivlis, A.; Grisaru-Granovsky, S.; Samueloff, A.; Schimmel, M.S.; Elstein, D. Prospective study of maternal and neonatal outcome in great-grand multiparous women (≥10 births) and in aged-matched women with lesser parity. Arch. Gynecol. Obstet. 2010, 284, 799–805. [Google Scholar] [CrossRef]
- Ong, K.K.; Preece, M.A.; Emmett, P.M.; Ahmed, M.L.; Dunger, D.B. Size at birth and early childhood growth in relation to maternal smoking, parity and infant breast-feeding: Longitudinal birth cohort study and analysis. Pediatric Res. 2002, 52, 863–867. [Google Scholar] [CrossRef]
- Gardosi, J.; Mongelli, M.; Wilcox, M.; Chang, A. An adjustable fetal weight standard. Ultrasound Obstet. Gynecol. 1995, 6, 168–174. [Google Scholar] [CrossRef]
- Hinkle, S.; Albert, P.S.; Mendola, P.; Sjaarda, L.; Yeung, E.; Boghossian, N.S.; Laughon, S.K. The Association between Parity and Birthweight in a Longitudinal Consecutive Pregnancy Cohort. Paediatr. Périnat. Epidemiol. 2013, 28, 106–115. [Google Scholar] [CrossRef] [PubMed] [Green Version]
- Khong, T.; Adema, E.; Erwich, J. On an Anatomical Basis for the Increase in Birth Weight in Second and Subsequent Born Children. Placenta 2003, 24, 348–353. [Google Scholar] [CrossRef] [PubMed]
- Prefumo, F.; Ganapathy, R.; Thilaganathan, B.; Sebire, N.J. Influence of parity on first trimester endovascular trophoblast invasion. Fertil. Steril. 2006, 85, 1032–1036. [Google Scholar] [CrossRef]
- Ballering, G.; Leijnse, J.; Eijkelkamp, N.; Peeters, L.; de Heus, R. First-trimester placental vascular development in multiparous women differs from that in nulliparous women. J. Matern. Neonatal Med. 2017, 31, 209–215. [Google Scholar] [CrossRef]
- Kesavan, K.; Devaskar, S.U. Intrauterine growth restriction: Postnatal monitoring and outcomes. Pediatr. Clin. N. Am. 2019, 66, 403–423. [Google Scholar] [CrossRef] [PubMed]
- Sovio, U.; Smith, G. The effect of customization and use of a fetal growth standard on the association between birthweight percentile and adverse perinatal outcome. Am. J. Obstet. Gynecol. 2018, 218, S738–S744. [Google Scholar] [CrossRef] [Green Version]
- Chiossi, G.; Pedroza, C.; Costantine, M.M.; Truong, V.T.; Gargano, G.; Saade, G.R. Customized vs. population-based growth charts to identify neonates at risk of adverse outcome: Systematic review and Bayesian meta-analysis of observational studies. Ultrasound Obstet. Gynecol. 2017, 50, 156–166. [Google Scholar] [CrossRef] [Green Version]


Publisher’s Note: MDPI stays neutral with regard to jurisdictional claims in published maps and institutional affiliations. |
© 2022 by the authors. Licensee MDPI, Basel, Switzerland. This article is an open access article distributed under the terms and conditions of the Creative Commons Attribution (CC BY) license (https://creativecommons.org/licenses/by/4.0/).
Share and Cite
Kofman, R.; Farkash, R.; Rottenstreich, M.; Samueloff, A.; Wasserteil, N.; Kasirer, Y.; Grisaru Granovsky, S. Parity-Adjusted Term Neonatal Growth Chart Modifies Neonatal Morbidity and Mortality Risk Stratification. J. Clin. Med. 2022, 11, 3097. https://doi.org/10.3390/jcm11113097
Kofman R, Farkash R, Rottenstreich M, Samueloff A, Wasserteil N, Kasirer Y, Grisaru Granovsky S. Parity-Adjusted Term Neonatal Growth Chart Modifies Neonatal Morbidity and Mortality Risk Stratification. Journal of Clinical Medicine. 2022; 11(11):3097. https://doi.org/10.3390/jcm11113097
Chicago/Turabian StyleKofman, Roie, Rivka Farkash, Misgav Rottenstreich, Arnon Samueloff, Netanel Wasserteil, Yair Kasirer, and Sorina Grisaru Granovsky. 2022. "Parity-Adjusted Term Neonatal Growth Chart Modifies Neonatal Morbidity and Mortality Risk Stratification" Journal of Clinical Medicine 11, no. 11: 3097. https://doi.org/10.3390/jcm11113097
APA StyleKofman, R., Farkash, R., Rottenstreich, M., Samueloff, A., Wasserteil, N., Kasirer, Y., & Grisaru Granovsky, S. (2022). Parity-Adjusted Term Neonatal Growth Chart Modifies Neonatal Morbidity and Mortality Risk Stratification. Journal of Clinical Medicine, 11(11), 3097. https://doi.org/10.3390/jcm11113097