
Usefulness of Muscle Ultrasound to Study Sarcopenic Obesity: A Pilot Case-Control Study

 ,
,  , ,
, ,  and
and
Abstract
:1. Introduction
2. Materials and Methods
2.1. BIA
2.2. Ultrasonic Technique
2.3. Statistical Analysis
3. Results
4. Discussion
5. Conclusions
Author Contributions
Funding
Institutional Review Board Statement
Informed Consent Statement
Data Availability Statement
Acknowledgments
Conflicts of Interest
Abbreviations
| SO | sarcopenic obesity |
| BS | bariatric surgery |
| CT | computed tomography |
| DXA | dual-energy X-ray absorptiometry |
| MUS | musculoskeletal ultrasound |
| SMI | skeletal muscle mass index |
| SM | skeletal muscle mass |
| SF | subcutaneous fat |
| FM | fat mass |
| BMI | body mass index |
| MRI | magnetic resonance imaging |
| BIA | bioelectrical impedance analysis |
| LM | lean mass |
| TMT | thigh muscle thickness |
| US | ultrasound |
References
- Choi, K.M. Sarcopenia and sarcopenic obesity. Endocrinol. Metab. 2013, 28, 86–89. [Google Scholar] [CrossRef] [PubMed] [Green Version]
- Polyzos, S.A.; Margioris, A.N. Sarcopenic obesity. Hormones 2018, 17, 321–331. [Google Scholar] [CrossRef] [PubMed]
- Mastino, D.; Robert, M.; Betry, C.; Laville, M.; Gouillat, C.; Disse, E. Bariatric surgery outcomes in sarcopenic obesity. Obes. Surg. 2016, 26, 2355–2362. [Google Scholar] [CrossRef] [PubMed]
- Lee, K.; Shin, Y.; Huh, J.; Sung, Y.S.; Lee, I.S.; Yoon, K.H.; Kim, K.W. Recent Issues on Body Composition Imaging for Sarcopenia Evaluation. Korean J. Radiol. 2019, 20, 205–217. [Google Scholar] [CrossRef]
- Donini, L.M.; Busetto, L.; Bauer, J.M.; Bischoff, S.; Boirie, Y.; Cederholm, T.; Cruz-Jentoft, A.J.; Dicker, D.; Frühbeck, G.; Giustina, A.; et al. Critical appraisal of definitions and diagnostic criteria for sarcopenic obesity based on a systematic review. Clin. Nutr. 2020, 39, 2368–2388. [Google Scholar] [CrossRef]
- Cruz-Jentoft, A.J.; Bahat, G.; Bauer, J.; Boirie, Y.; Bruyère, O.; Cederholm, T.; Cooper, C.; Landi, F.; Rolland, Y.; Sayer, A.A.; et al. Sarcopenia: Revised European consensus on definition and diagnosis. Age Ageing 2019, 48, 16–31. [Google Scholar] [CrossRef] [Green Version]
- Donini, L.M.; Busetto, L.; Bischoff, S.C.; Cederholm, T.; Ballesteros-Pomar, M.D.; Batsis, J.A.; Bauer, J.M.; Boirie, Y.; Cruz-Jentoft, A.J.; Dicker, D.; et al. Definition and Diagnostic Criteria for Sarcopenic Obesity: ESPEN and EASO Consensus Statement. Obes. Facts 2022, 23, 1–15. [Google Scholar]
- Hong, S.H.; Choi, K.M. Sarcopenic Obesity, Insulin Resistance, and Their Implications in Cardiovascular and Metabolic Consequences. Int. J. Mol. Sci. 2020, 13, 494. [Google Scholar] [CrossRef] [Green Version]
- Kenngott, H.G.; Nickel, F.; Wise, P.A.; Wagner, F.; Billeter, A.T.; Nattenmüller, J.; Nabers, D.; Maier-Hein, K.; Kauczor, H.U.; Fischer, L.; et al. Weight Loss and Changes in Adipose Tissue and Skeletal Muscle Volume after Laparoscopic Sleeve Gastrectomy and Roux-en-Y Gastric Bypass: A Prospective Study with 12-Month Follow-Up. Obes. Surg. 2019, 29, 4018–4028. [Google Scholar] [CrossRef]
- Barazzoni, R.; Bischoff, S.; Boirie, Y.; Busetto, L.; Cederholm, T.; Dicker, D.; Toplak, H.; Van Gossum, A.; Yumuk, V.; Vettor, R. Sarcopenic obesity: Time to meet the challenge. Obes. Facts 2018, 11, 294–305. [Google Scholar] [CrossRef]
- Ballesteros-Pomar, M.D.; González-Arnáiz, E.; Pintor-de-la Maza, B.; Barajas-Galindo, D.; Ariadel-Cobo, D.; González-Roza, L.; Cano-Rodríguez, I. Bioelectrical impedance analysis as an alternative to dual-energy x-ray absorptiometry in the assessment of fat mass and appendicular lean mass in patients with obesity. Nutrition 2022, 93, 111442. [Google Scholar] [CrossRef]
- Rustani, K.; Kundisova, L.; Capecchi, P.L.; Nante, N.; Bicchi, M. Ultrasound measurement of rectus femoris muscle thickness as a quick screening test for sarcopenia assessment. Arch. Gerontol. Geriatr. 2019, 83, 151–154. [Google Scholar] [CrossRef] [PubMed]
- Martínez, M.C.; Meli, E.F.; Candia, F.P.; Filippi, F.; Vilallonga, R.; Cordero, E.; Hernández, I.; Eguinoa, A.Z.; Burgos, R.; Vila, A.; et al. The Impact of Bariatric Surgery on the Muscle Mass in Patients with Obesity: 2-Year Follow-up. Obes. Surg. 2022, 32, 625–633. [Google Scholar] [CrossRef] [PubMed]
- Jensen, B.; Braun, W.; Geisler, C.; Both, M.; Klückmann, K.; Müller, M.J.; Bosy-Westphal, A. Limitations of Fat-Free Mass for the Assessment of Muscle Mass in Obesity. Obes. Facts 2019, 12, 307–315. [Google Scholar] [CrossRef] [PubMed]
- Sizoo, D.; de Heide, L.J.; Emous, M.; van Zutphen, T.; Navis, G.; van Beek, A.P. Measuring Muscle Mass and Strength in Obesity: A Review of Various Methods. Obes. Surg. 2021, 31, 384–393. [Google Scholar] [CrossRef] [PubMed]
- Wilson, D.V.; Moorey, H.; Stringer, H.; Sahbudin, I.; Filer, A.; Lord, J.M.; Sapey, E. Bilateral Anterior Thigh Thickness: A New Diagnostic Tool for the Identification of Low Muscle Mass? J. Am. Med. Dir. Assoc. 2019, 20, 1247–1253. [Google Scholar] [CrossRef]
- Ticinesi, A.; Narici, M.V.; Lauretani, F.; Nouvenne, A.; Colizzi, E.; Mantovani, M.; Corsonello, A.; Landi, F.; Meschi, T.; Maggio, M. Assessing sarcopenia with vastus lateralis muscle ultrasound: An operative protocol. Aging Clin. Exp. Res. 2018, 30, 1437–1443. [Google Scholar] [CrossRef]
- Ido, A.; Nakayama, Y.; Ishii, K.; Iemitsu, M.; Sato, K.; Fujimoto, M.; Kurihara, T.; Hamaoka, T.; Satoh-Asahara, N.; Sanada, K. Ultrasound-Derived Abdominal Muscle Thickness Better Detects Metabolic Syndrome Risk in Obese Patients tan Skeletal Muscle Index Measured by Dual-Energy X-ray Absorptiometry. PLoS ONE 2015, 10, e0143858. [Google Scholar] [CrossRef] [Green Version]
- Thiebaud, R.S.; Loenneke, J.P.; Abe, T.; Fahs, C.A.; Rossow, L.M.; Kim, D.; Beck, T.W.; Bemben, D.A.; Larson, R.D.; Bemben, M.G. Appendicular lean mass and site-specific muscle loss in the extremities correlate with dynamic strength. Clin. Physiol. Funct. Imaging 2017, 37, 328–331. [Google Scholar] [CrossRef]
- Abe, T.; Ogawa, M.; Loenneke, J.P.; Thiebaud, R.S.; Loftin, M.; Mitsukawa, N. Relationship between site-specific loss of thigh muscle and gait performance in women: The HIREGASAKI study. Arch. Gerontol. Geriatr. 2012, 55, e21–e25. [Google Scholar] [CrossRef]
- Von Elm, E.; Altman, D.G.; Egger, M.; Pocock, S.J.; Gøtzsche, P.C.; Vandenbroucke, J.P. STROBE Initiative. The Strengthening the Reporting of Observational Studies in Epidemiology (STROBE) statement: Guidelines for reporting observational studies. Lancet 2007, 370, 1453–1457. [Google Scholar] [CrossRef]
- Abe, T.; Loenneke, J.P.; Thiebaud, R.S.; Fukunaga, T. Age-related site-specific muscle wasting of upper and lower extremities and trunk in Japanese men and women. Age 2014, 36, 813–821. [Google Scholar] [CrossRef] [PubMed]
- Hida, T.; Ando, K.; Kobayashi, K.; Ito, K.; Tsushima, M.; Kobayakawa, T.; Morozumi, M.; Tanaka, S.; Machino, M.; Ota, K.; et al. Ultrasound measurement of thigh muscle thickness for assessment of sarcopenia. Nagoya J. Med. Sci. 2018, 80, 519–527. [Google Scholar]
- Kawai, H.; Kera, T.; Hirayama, R.; Hirano, H.; Fujiwara, Y.; Ihara, K.; Kojima, M.; Obuchi, S. Morphological and qualitative characteristics of the quadriceps muscle of community-dwelling older adults based on ultrasound imaging: Classification using latent class analysis. Aging Clin. Exp. Res. 2018, 30, 283–291. [Google Scholar] [CrossRef]
- Pineau, J.C.; Guihard-Costa, A.M.; Bocquet, M. Validation of ultrasound techniques applied to body fat measurement. A comparison between ultrasound techniques, air displacement plethysmography and bioelectrical impedance vs. dual-energy X-ray absorptiometry. Ann. Nutr. Metab. 2007, 51, 421–427. [Google Scholar] [CrossRef]
- Souza, V.A.; Oliveira, D.; Cupolilo, E.N.; Miranda, C.S.; Colugnati, F.A.B.; Mansur, H.N.; Fernandes, N.M.D.S.; Bastos, M.G. Rectus femoris muscle mass evaluation by ultrasound: Facilitating sarcopenia diagnosis in pre-dialysis chronic kidney disease stages. Clinics 2018, 73, e392. [Google Scholar] [CrossRef] [PubMed]
- Welch, D.; Ndanyo, L.S.; Brown, S.; Agyapong-Badu, S.; Warner, M.; Stokes, M.; Samuel, D. Thigh muscle and subcutaneous tissue thickness measured using ultrasound imaging in older females living in extended care: A preliminary study. Aging Clin. Exp. Res. 2018, 30, 463–469. [Google Scholar] [CrossRef] [Green Version]
- Minetto, M.A.; Caresio, C.; Menapace, T.; Hajdareviv, A.; Marchini, A.; Molinari, F.; Maffiuletti, N.A. Ultrasound-based detection of low muscle mass for diagnosis of sarcopenia in older adults. PM&R 2016, 8, 453–462. [Google Scholar]
- Deniz, O.; Cruz-Jentoft, A.; Sengul Aycicek, G.; Unsal, P.; Esme, M.; Ucar, Y.; Burkuk, S.; Sendur, A.; Yavuz, B.B.; Cankurtaran, M.; et al. Role of Ultrasonography in Estimating Muscle Mass in Sarcopenic Obesity. J. Parenter Enteral. Nutr. 2020, 44, 1398–1406. [Google Scholar] [CrossRef]
- Radaelli, R.; Bottaro, M.; Wilhelm, E.N.; Wagner, D.R.; Pinto, R.S. Time course of strength and echo intensity recovery after resistance exercise in women. J. Strength Cond. Res. 2012, 26, 2577–2584. [Google Scholar] [CrossRef]
- Watanabe, Y.; Yamada, Y.; Fukumoto, Y.; Ishihara, T.; Yokoyama, K.; Yoshida, T.; Miyake, M.; Yamagata, E.; Kimura, M. Echo intensity obtained from ultrasonography images reflecting muscle strength in elderly men. Clin. Interv. Aging 2013, 8, 993–998. [Google Scholar] [CrossRef] [PubMed] [Green Version]
- Johnson Stoklossa, C.A.; Sharma, A.M.; Forhan, M.; Siervo, M.; Padwal, R.S.; Prado, C.M. Prevalence of sarcopenic obesity in adults with class II/III obesity using different diagnostic criteria. J. Nutr. Metabol. 2017, 2017, 7307618. [Google Scholar] [CrossRef] [PubMed]
- Voican, C.S.; Lebrun, A.; Maitre, S.; Lainas, P.; Lamouri, K.; Njike-Nakseu, M.; Gaillard, M.; Tranchart, H.; Balian, A.; Dagher, I.; et al. Predictive score of sarcopenia occurrence one year after bariatric surgery in severely obese patients. PLoS ONE 2018, 13, e0197248. [Google Scholar] [CrossRef] [PubMed]
- Xiao, J.; Cain, A.; Purcell, S.A.; Ormsbee, M.J.; Contreras, R.J.; Kim, J.S.; Thornberry, R.; Springs, D.; Gonzalez, M.C.; Prado, C.M. Sarcopenic obesity and health outcomes in patients seeking weight loss treatment. Clin. Nutr. 2018, 23, 79–83. [Google Scholar] [CrossRef]
- Beavers, K.M.; Lyles, M.F.; Davis, C.C.; Wang, X.; Beavers, D.P.; Nicklas, B.J. Is lost lean mass from intentional weight loss recovered during weight regain in postmenopausal women? Am. J. Clin. Nutr. 2011, 94, 767–774. [Google Scholar] [CrossRef]
- Mueller, N.; Murthy, S.; Tainter, C.R.; Lee, J.; Riddell, K.; Fintelmann, F.J.; Grabitz, S.D.; Timm, F.P.; Levi, B.; Kurth, T.; et al. Can Sarcopenia Quantified by Ultrasound of the Rectus Femoris Muscle Predict Adverse Outcome of Surgical Intensive Care Unit Patients as well as Frailty? A Prospective, Observational Cohort Study. Ann. Surg. 2016, 264, 1116–1124. [Google Scholar] [CrossRef] [Green Version]
- Sengul Aycicek, G.; Ozsurekci, C.; Caliskan, H.; Kizilarslanoglu, M.C.; Tuna Dogrul, R.; Balci, C.; Unsal, P.; Esme, M.; Yavuz, B.B.; Cankurtaran, M.; et al. Ultrasonography versus bioelectrical impedance analysis: Which predicts muscle strength better? Acta Clin. Belg. 2021, 76, 204–208. [Google Scholar] [CrossRef]
- Miyatani, M.; Kanehisa, H.; Kuno, S.; Nishijima, T.; Fukunaga, T. Validity of ultrasonograph muscle thickness measurements for estimating muscle volume of knee extensors in humans. Eur. J. Appl. Physiol. 2002, 86, 203–208. [Google Scholar] [CrossRef]
- Sanada, K.; Kearns, C.F.; Midorikawa, T.; Abe, T. Prediction and validation of total and regional skeletal muscle mass by ultrasound in Japanese adults. Eur. J. Appl. Physiol. 2006, 96, 24–31. [Google Scholar] [CrossRef]
- López-Gómez, J.J.; Benito- Sendín Plaar, K.; Izaola-Jauregui, O.; Primo-Martín, D.; Gómez-Hoyos, E.; Torres-Torres, B.; De Luis-Román, D.A. Muscular Ultrasonography in Morphofunctional Assessment of Patients with Oncological Pathology at Risk of Malnutrition. Nutrients 2022, 14, 1573. [Google Scholar] [CrossRef]
- Giraudo, C.; Cavaliere, A.; Lupi, A.; Guglielmi, G.; Quaia, E. Established paths and new avenues: A review of the main radiological techniques for investigating sarcopenia. Quant. Imaging Med. Surg. 2020, 10, 1602–1613. [Google Scholar] [CrossRef] [PubMed]
- Tosato, M.; Marzetti, E.; Cesari, M.; Savera, G.; Miller, R.R.; Bernabei, R.; Landi, F.; Calvani, R. Measurement of muscle mass in sarcopenia: From imaging to biochemical markers. Aging Clin. Exp. Res. 2017, 29, 19–27. [Google Scholar] [CrossRef] [PubMed]
- Ikai, M.; Fukunaga, T. The size and strength per unit cross-sectional area of human muscle by means of ultrasonic measurement. Int. Z. Angew. Physiol. 1968, 26, 26–32. [Google Scholar] [PubMed]
- Young, A.; Stokes, M.; Crowe, M. The size and strength of the quadriceps muscles of old and young woman. Eur. J. Clin. Investig. 1984, 14, 282–287. [Google Scholar] [CrossRef] [PubMed]
- Ochi, M.; Tabara, Y.; Kido, T.; Uetani, E.; Ochi, N.; Igase, M.; Miki, T.; Kohara, K. Quadriceps sarcopenia and visceral obesity are risk factors for postural instability in the middle-aged to elderly population. Geriatr. Gerontol. Int. 2010, 10, 233–243. [Google Scholar] [CrossRef]


| Total | BS-Group | C-Group | p Value | |
|---|---|---|---|---|
| Number of participants | 122 | 90 | 32 | - |
| Age (years) | 51.2 ± 9.75 | 52.02 ± 9.40 | 49 ± 10.53 | - |
| Female | 89 (73%) | 64 (71%) | 25 (78%) | - |
| BMI (kg/m2) | 39.05 ± 9.86 | 44.22 ± 5 | 24.54 ± 3.60 | <0.001 |
| BIA | ||||
| Lean mass (%) | 61.15 ± 16.03 | 65.44 ± 15.36 | 49.36 ± 11.33 | <0.001 |
| Fat mass (%) | 40.43 ± 11.70 | 45.61 ± 7.28 | 26.53 ± 9.88 | <0.001 |
| SMI (kg/heigh2) | 10.84 ± 2.35 | 11.58 ± 2.14 | 8.81 ± 1.63 | <0.001 |
| US | ||||
| TMT (cm) | 1.77 ± 0.74 | 1.96 ± 0.76 | 1.27 ± 0.35 | <0.001 |
| SF (cm) | 1.25 ± 0.72 | 1.42 ± 0.74 | 0.81 ± 0.39 | <0.001 |
| Correlations | R | p |
|---|---|---|
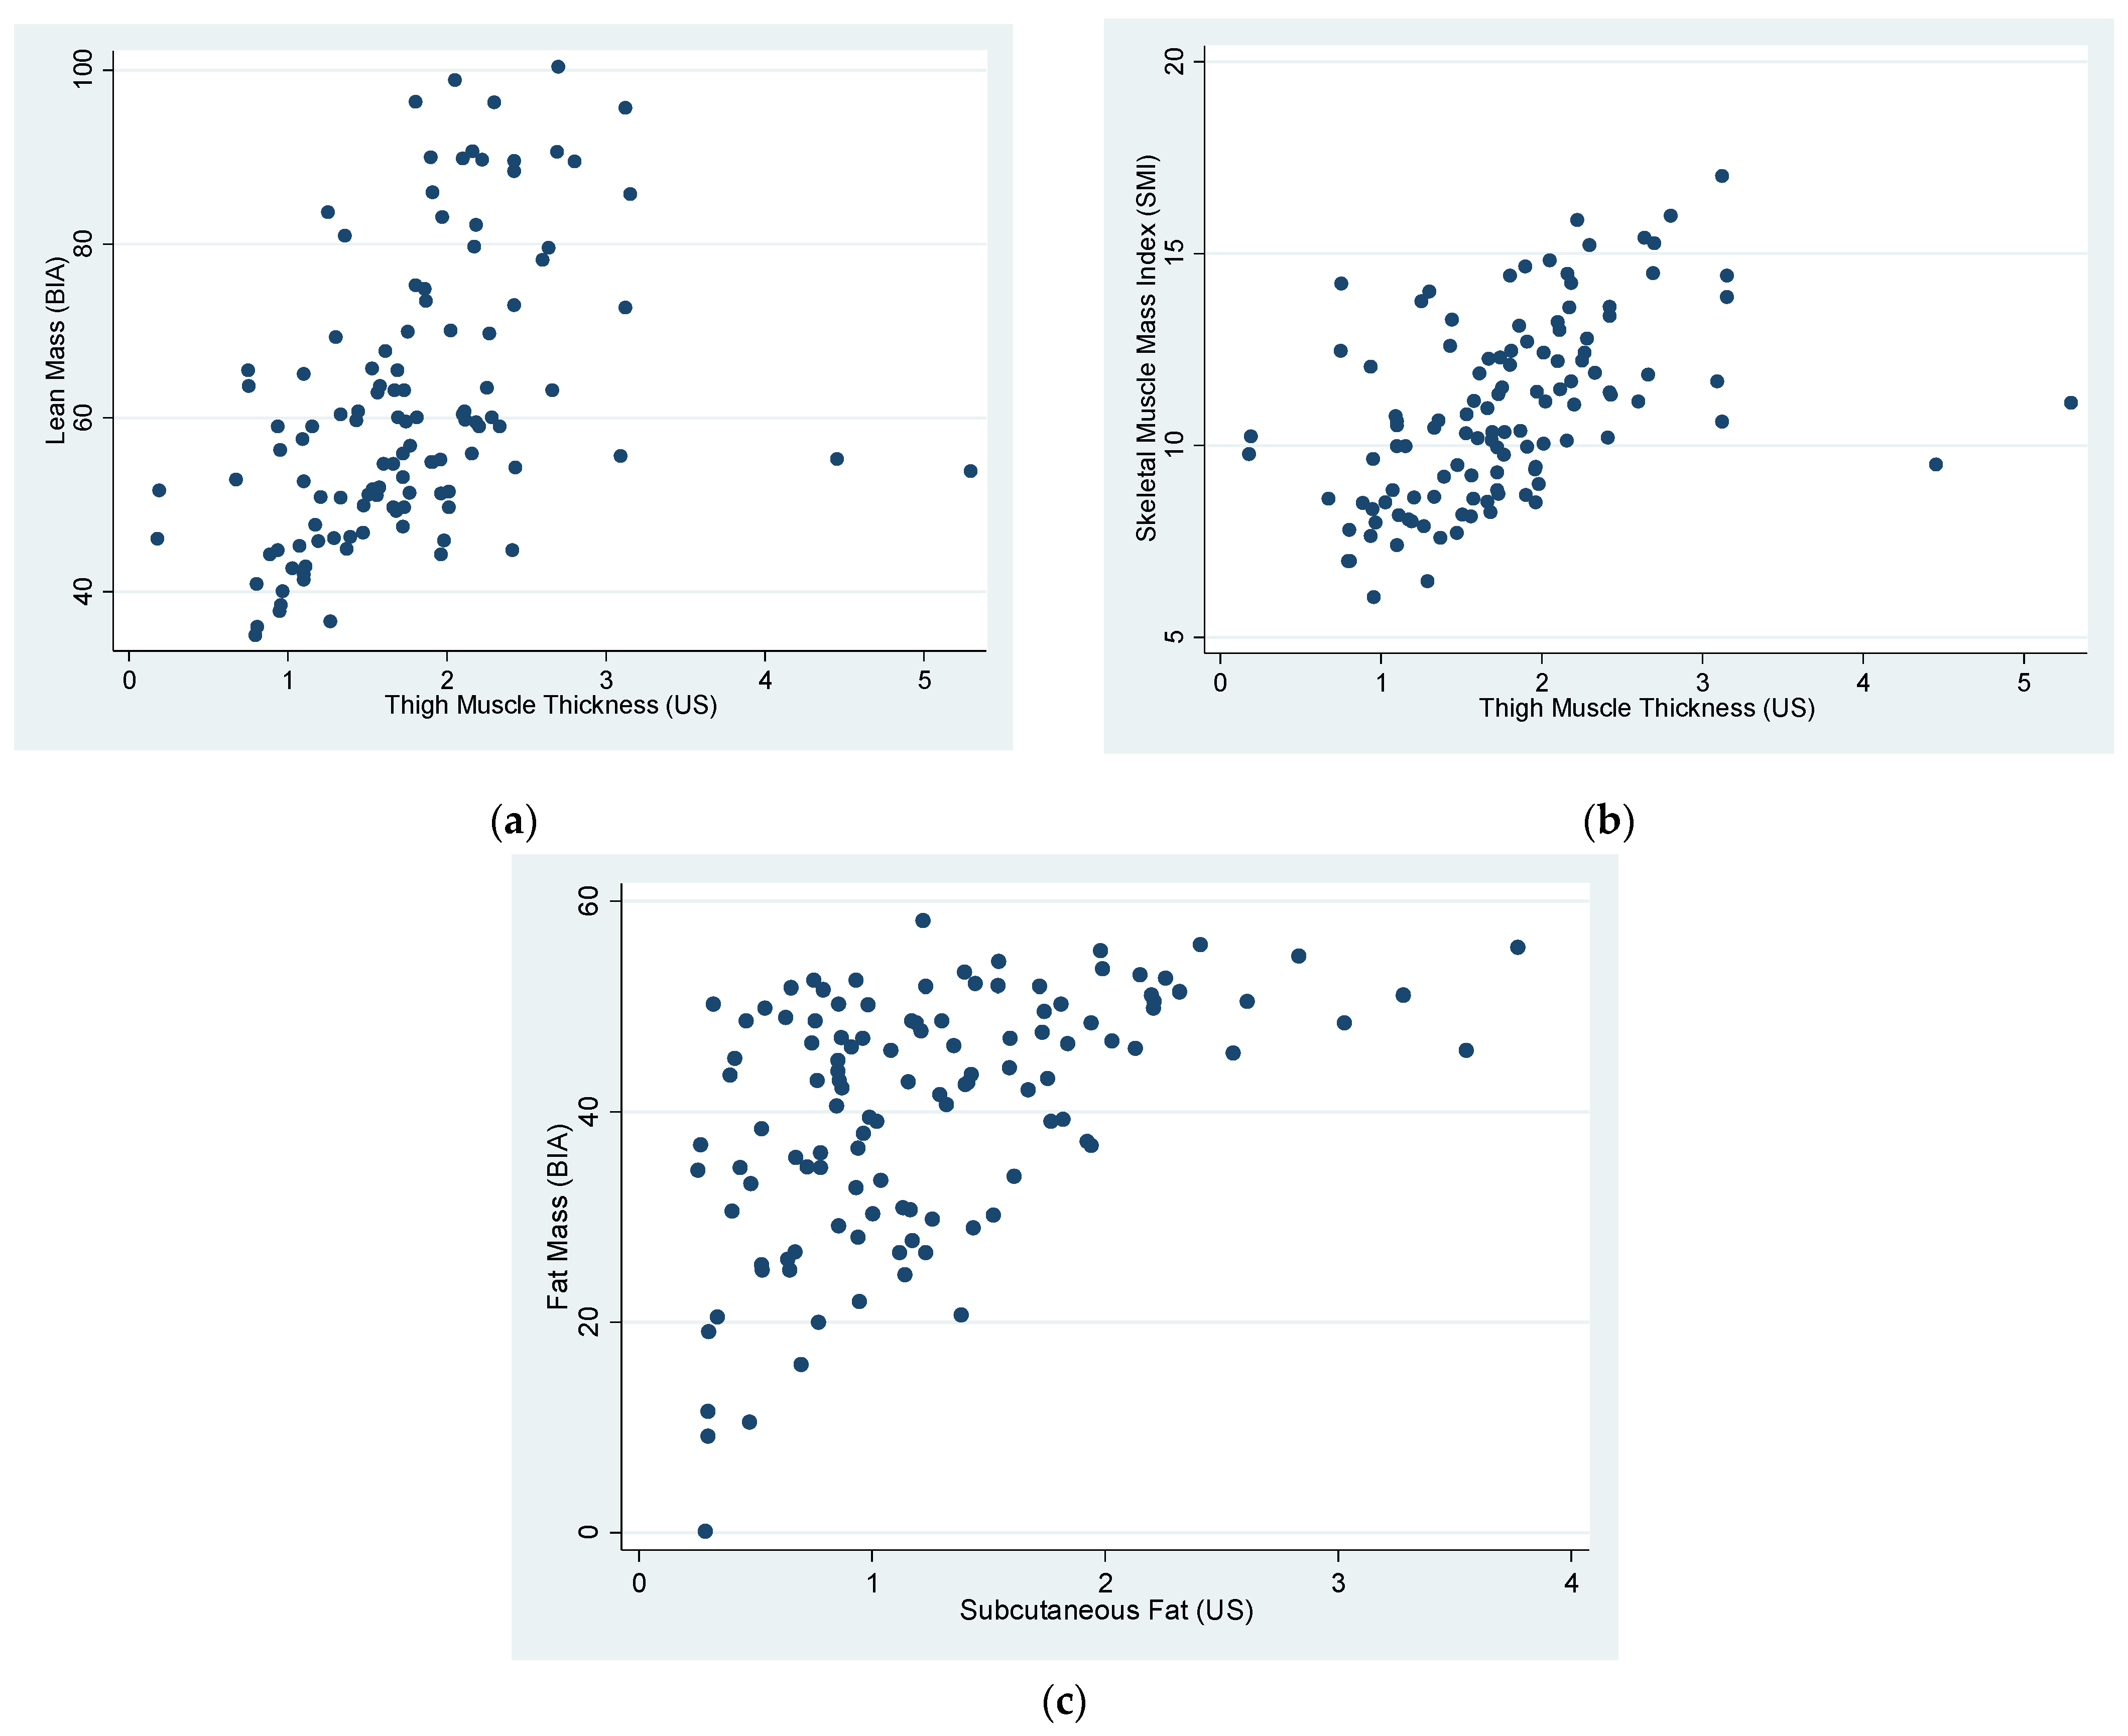
| LM (BIA) vs. TMT (US) | 0.46 | <0.0001 |
| LM (BIA) vs. TMT (US) (Sarcopenic group) | 0.79 | 0.0033 |
| SMI (SM kg/ height2 m2) vs. TMT (US) | 0.47 | <0.0001 |
| FM (BIA) vs. SF (US) | 0.5 | <0.0001 |
Publisher’s Note: MDPI stays neutral with regard to jurisdictional claims in published maps and institutional affiliations. |
© 2022 by the authors. Licensee MDPI, Basel, Switzerland. This article is an open access article distributed under the terms and conditions of the Creative Commons Attribution (CC BY) license (https://creativecommons.org/licenses/by/4.0/).
Share and Cite
Simó-Servat, A.; Ibarra, M.; Libran, M.; Rodríguez, S.; Perea, V.; Quirós, C.; Orois, A.; Pérez, N.; Simó, R.; Barahona, M.-J. Usefulness of Muscle Ultrasound to Study Sarcopenic Obesity: A Pilot Case-Control Study. J. Clin. Med. 2022, 11, 2886. https://doi.org/10.3390/jcm11102886
Simó-Servat A, Ibarra M, Libran M, Rodríguez S, Perea V, Quirós C, Orois A, Pérez N, Simó R, Barahona M-J. Usefulness of Muscle Ultrasound to Study Sarcopenic Obesity: A Pilot Case-Control Study. Journal of Clinical Medicine. 2022; 11(10):2886. https://doi.org/10.3390/jcm11102886
Chicago/Turabian StyleSimó-Servat, Andreu, Montse Ibarra, Mireia Libran, Silvia Rodríguez, Verónica Perea, Carmen Quirós, Aida Orois, Noelia Pérez, Rafael Simó, and Maria-José Barahona. 2022. "Usefulness of Muscle Ultrasound to Study Sarcopenic Obesity: A Pilot Case-Control Study" Journal of Clinical Medicine 11, no. 10: 2886. https://doi.org/10.3390/jcm11102886
APA StyleSimó-Servat, A., Ibarra, M., Libran, M., Rodríguez, S., Perea, V., Quirós, C., Orois, A., Pérez, N., Simó, R., & Barahona, M.-J. (2022). Usefulness of Muscle Ultrasound to Study Sarcopenic Obesity: A Pilot Case-Control Study. Journal of Clinical Medicine, 11(10), 2886. https://doi.org/10.3390/jcm11102886