
Association between Neurologic Outcomes and Changes of Muscle Mass Measured by Brain Computed Tomography in Neurocritically Ill Patients


Abstract
1. Introduction
2. Materials and Methods
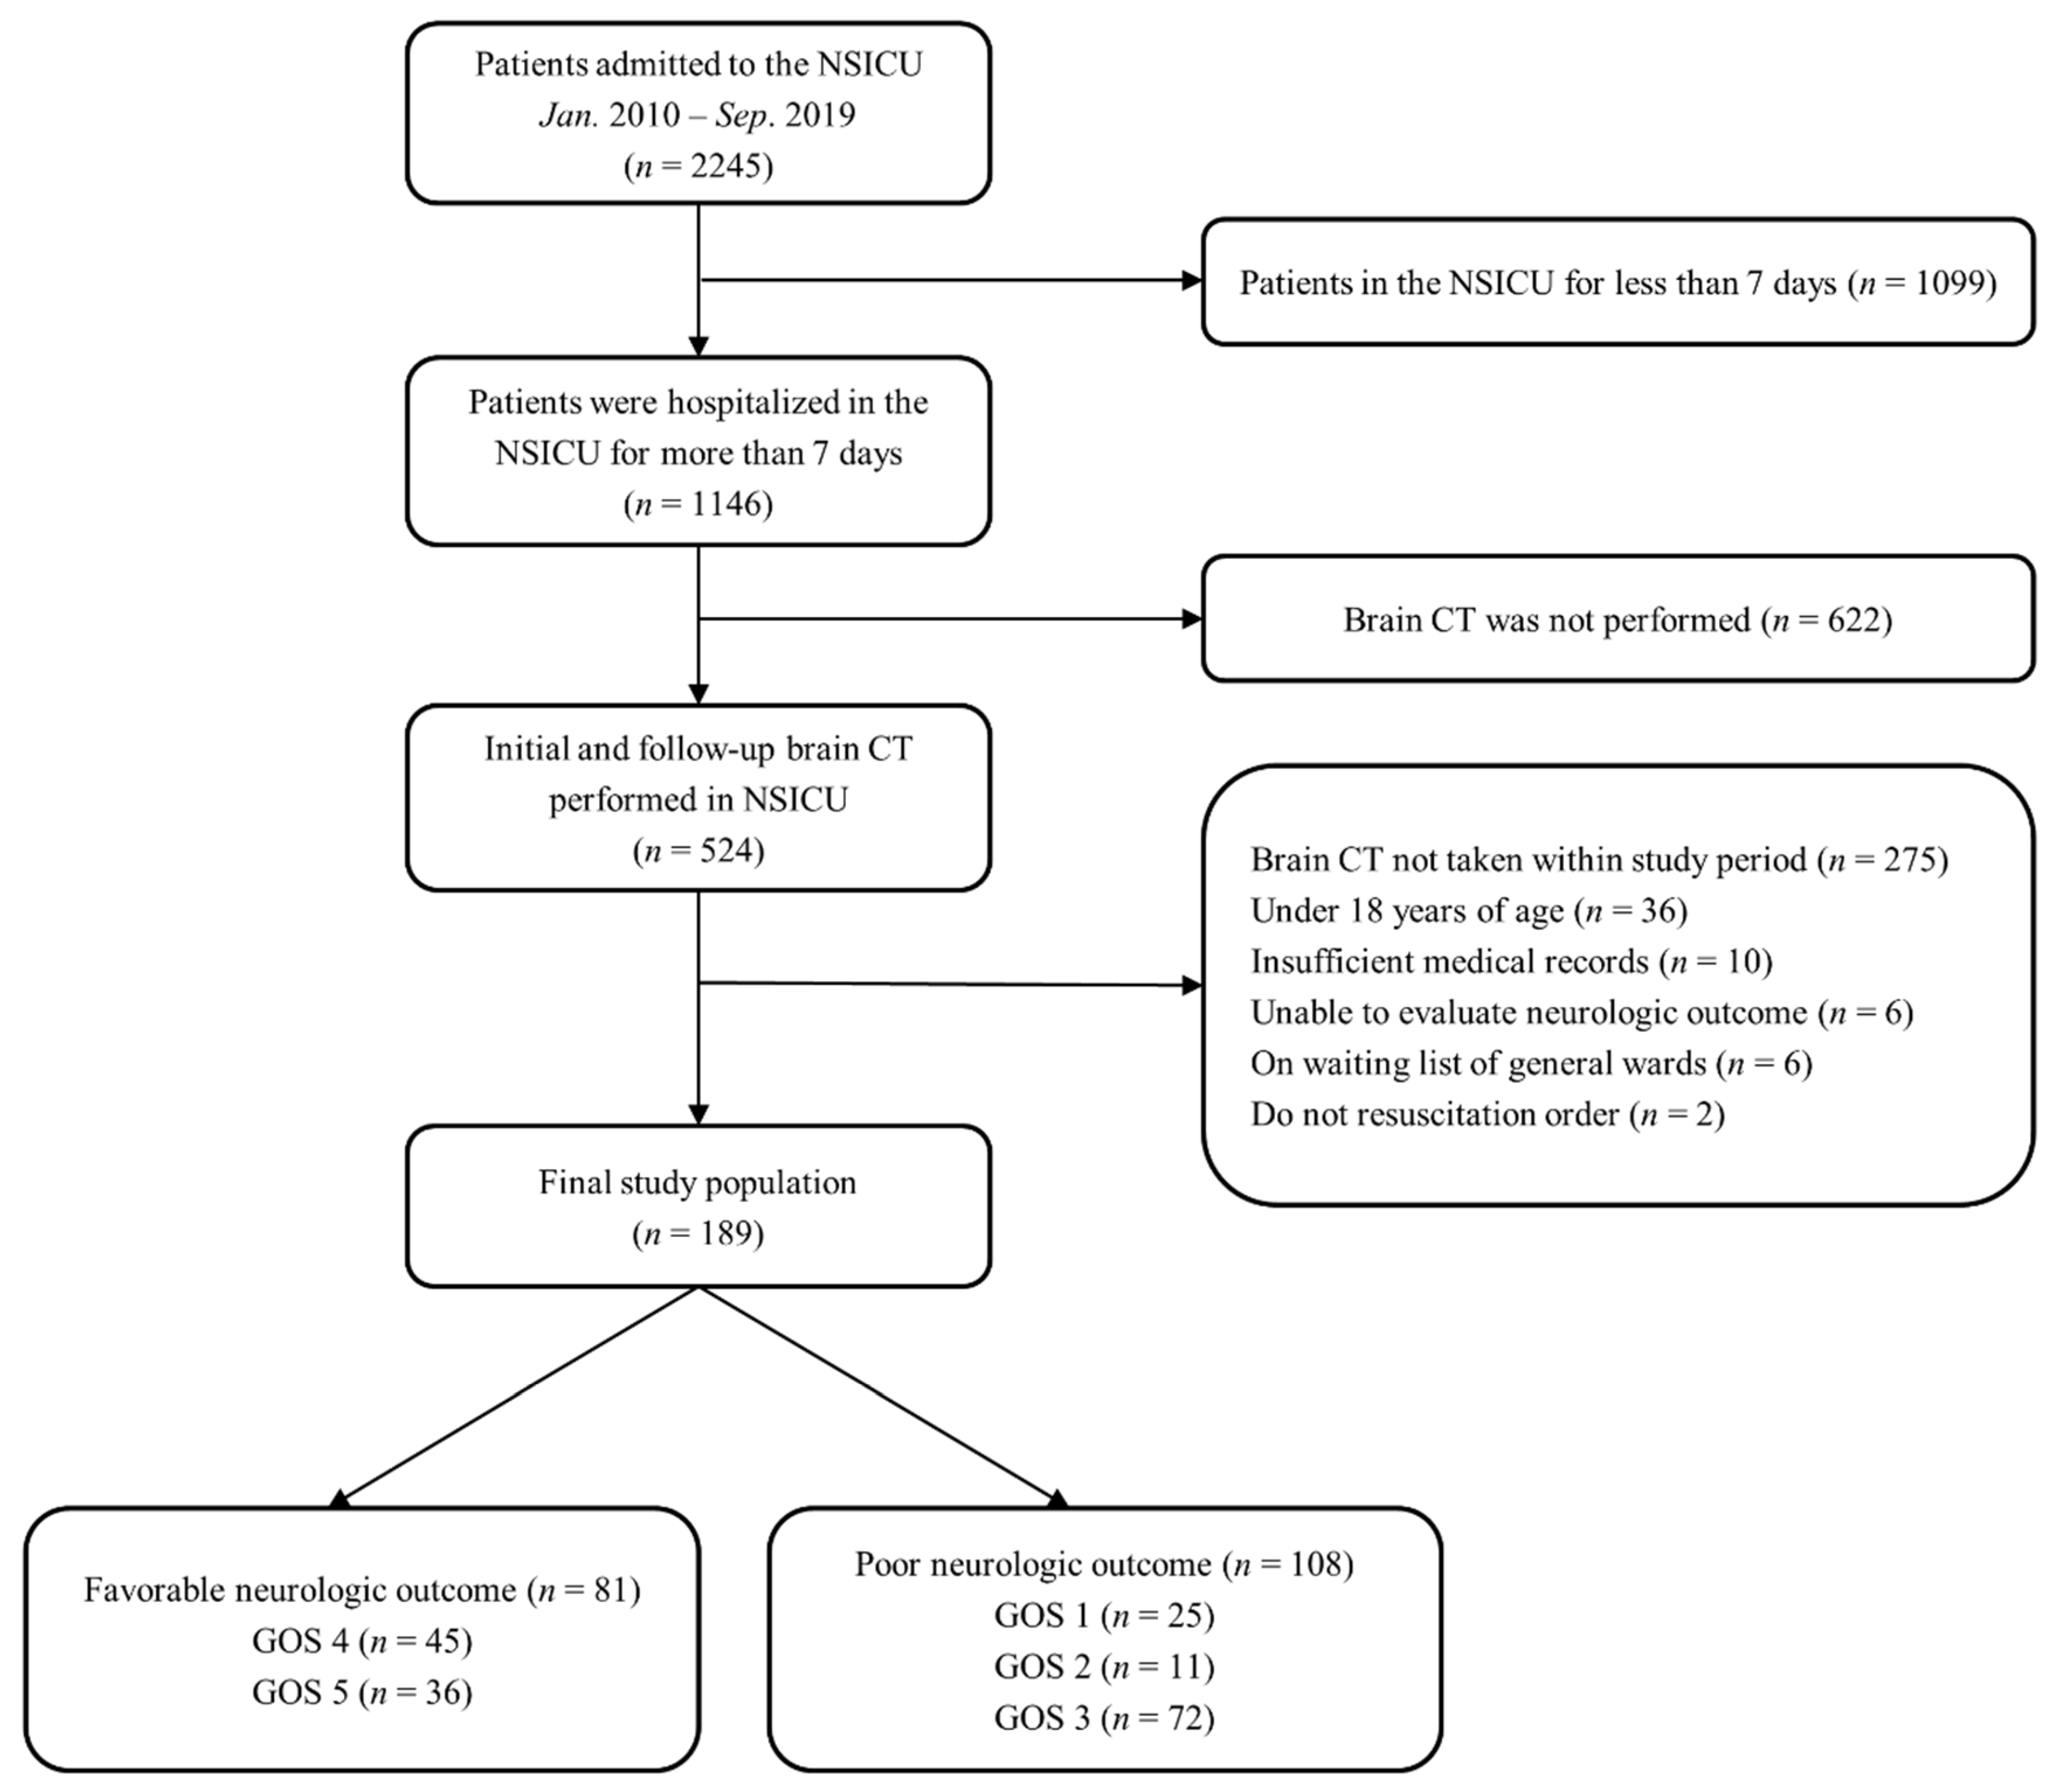
2.1. Study Population
2.2. Definitions and Endpoints
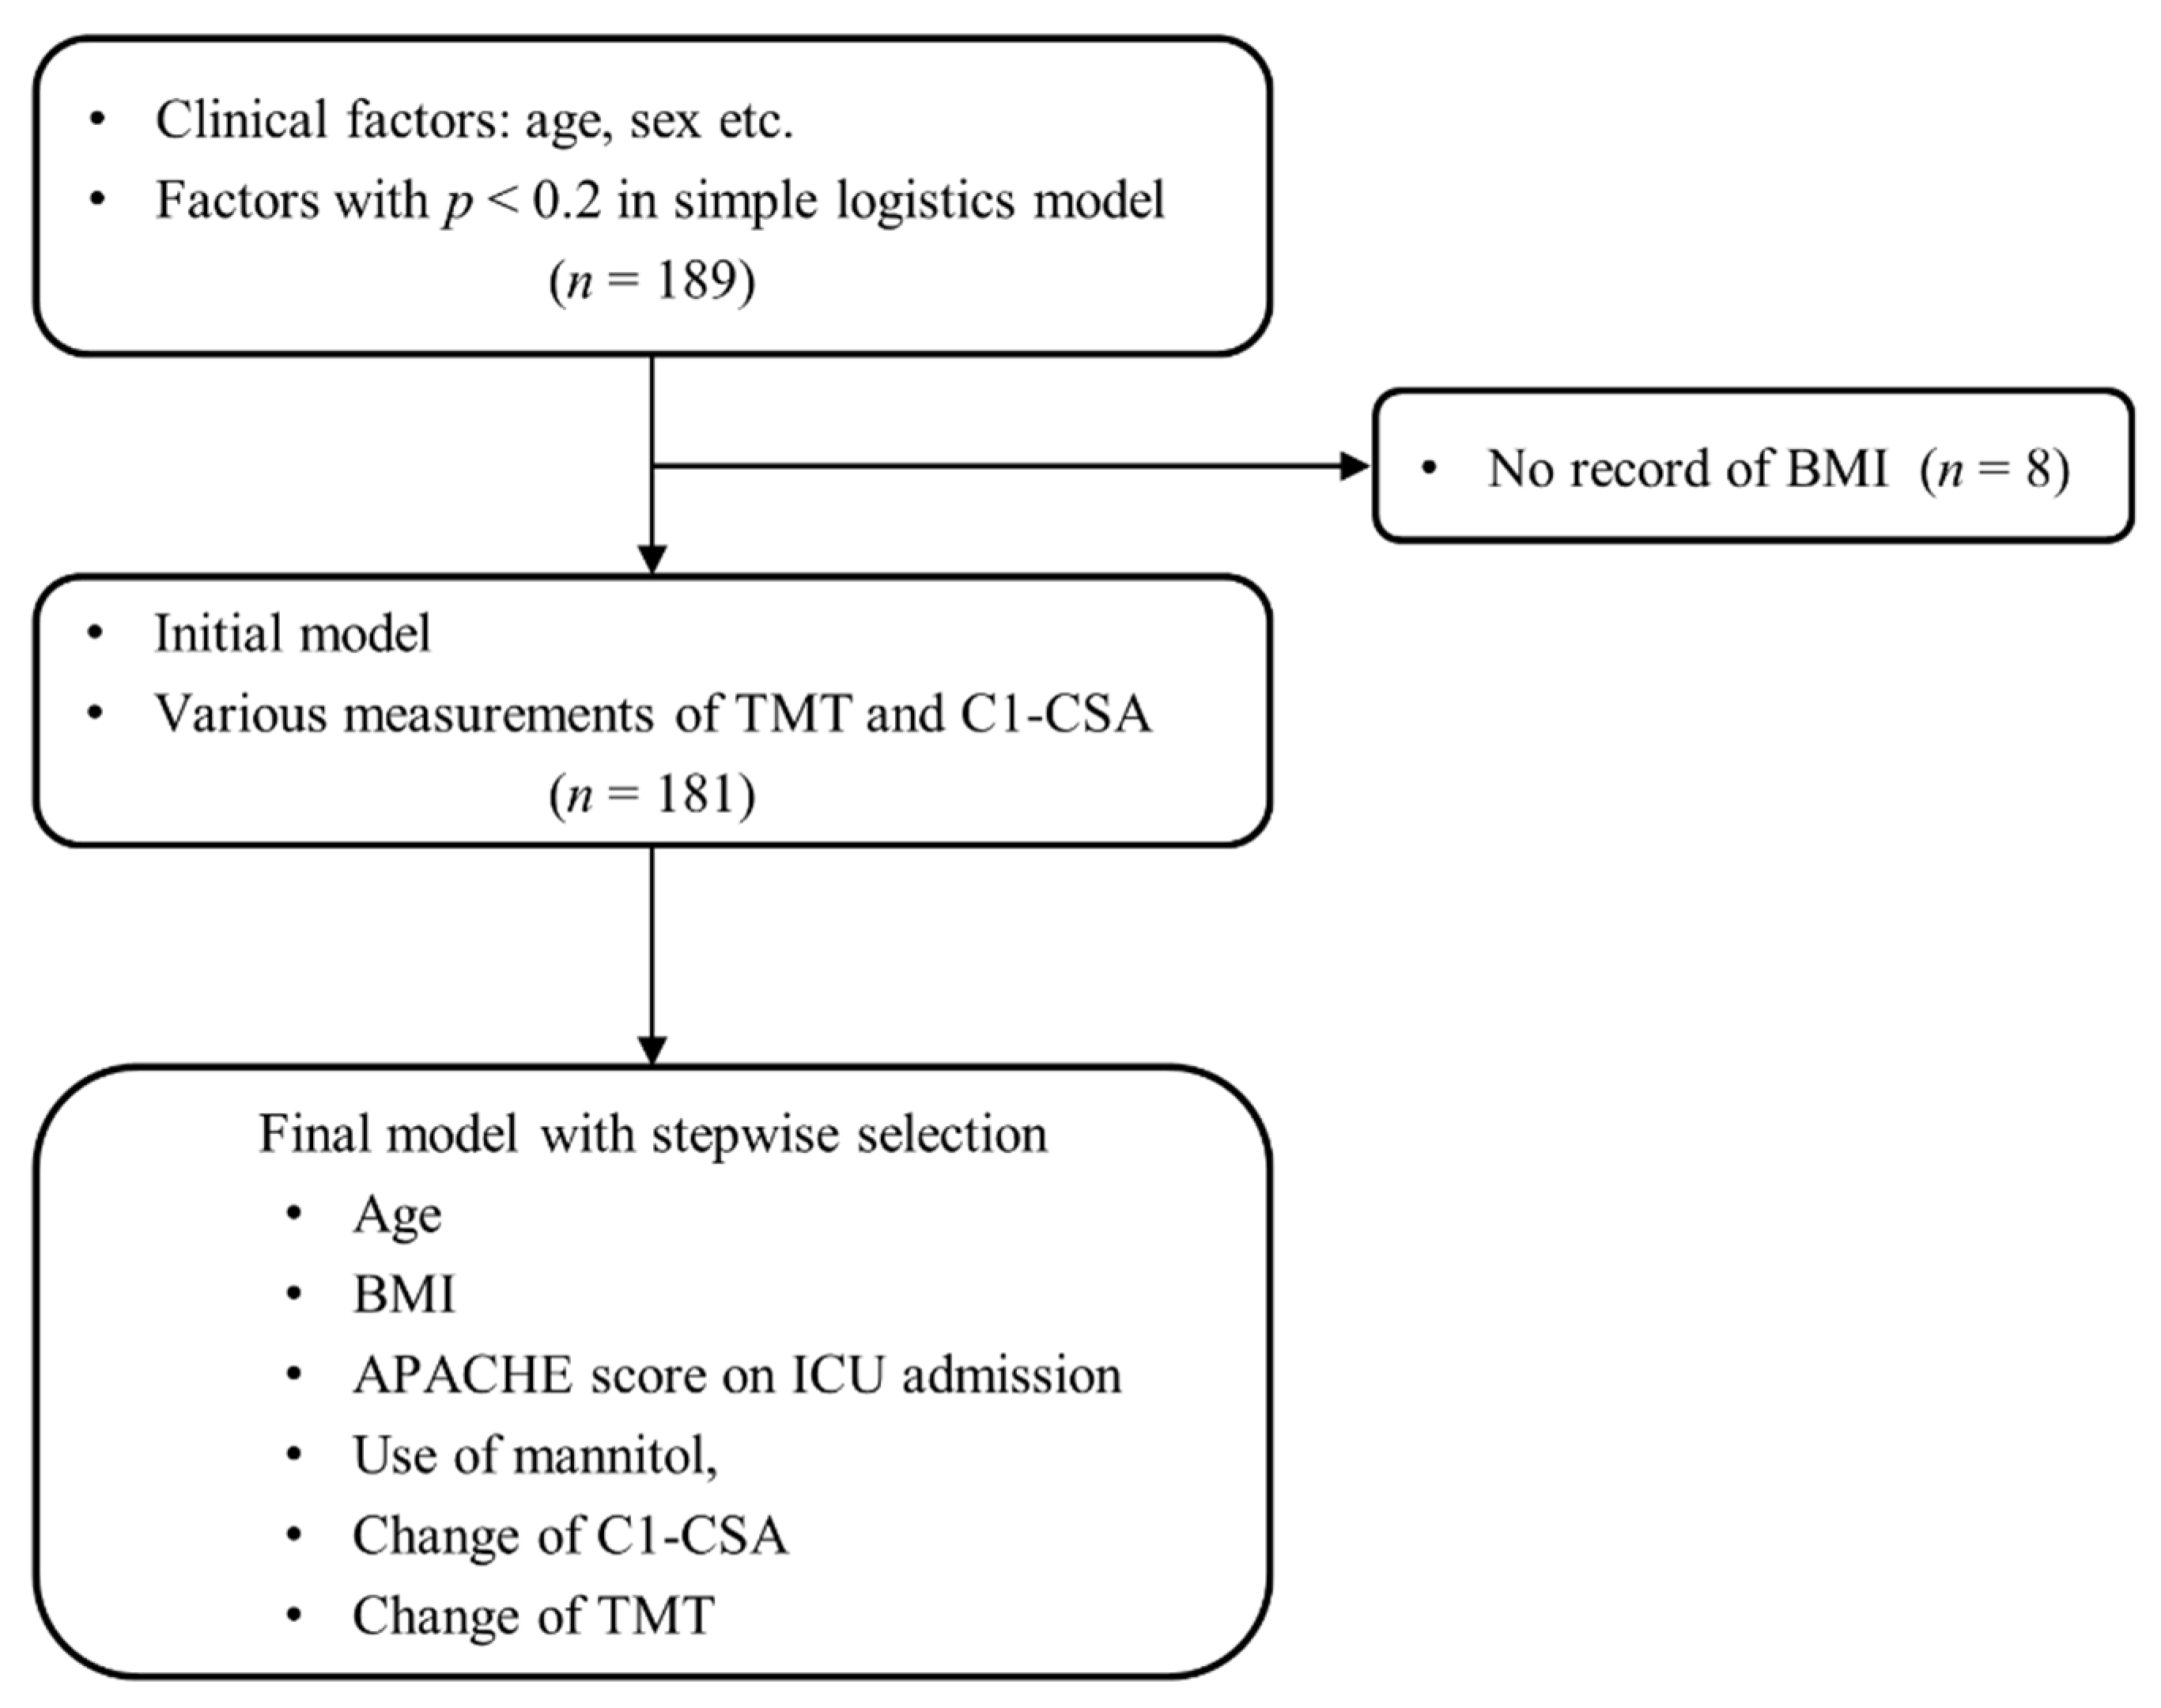
2.3. Statistical Analyses
3. Results
3.1. Baseline Characteristics and Clinical Outcomes
3.2. Relationship between C1-CSAs, TMTs, and Neurological Outcomes
4. Discussion
5. Conclusions
Author Contributions
Funding
Institutional Review Board Statement
Informed Consent Statement
Data Availability Statement
Acknowledgments
Conflicts of Interest
Abbreviations
| APACHE II | acute physiology and chronic health evaluation II |
| AUC | area under the curve |
| BSA | body surface area |
| CI | confidence interval |
| CSA | cross-sectional area |
| CT | computed tomography |
| GOS | Glasgow outcome scale |
| ICU | intensive care unit |
| OR | odd ratio |
| TMT | temporalis muscle thickness |
References
- Higgins, P.A.; Daly, B.J.; Lipson, A.R.; Guo, S.E. Assessing nutritional status in chronically critically ill adult patients. Am. J. Crit. Care 2006, 15, 166–176; quiz 177. [Google Scholar] [CrossRef] [PubMed]
- Moisey, L.L.; Mourtzakis, M.; Cotton, B.A.; Premji, T.; Heyland, D.K.; Wade, C.E.; Bulger, E.; Kozar, R.A.; The Nutrition and Rehabilitation Investigators Consortium (NUTRIC). Skeletal muscle predicts ventilator-free days, ICU-free days, and mortality in elderly ICU patients. Crit. Care 2013, 17, R206. [Google Scholar] [CrossRef] [PubMed]
- Puthucheary, Z.A.; Rawal, J.; McPhail, M.; Connolly, B.; Ratnayake, G.; Chan, P.; Hopkinson, N.S.; Phadke, R.; Dew, T.; Sidhu, P.S.; et al. Acute skeletal muscle wasting in critical illness. JAMA 2013, 310, 1591–1600. [Google Scholar] [CrossRef]
- Villet, S.; Chiolero, R.L.; Bollmann, M.D.; Revelly, J.P.; Cayeux, R.N.M.; Delarue, J.; Berger, M.M. Negative impact of hypocaloric feeding and energy balance on clinical outcome in ICU patients. Clin. Nutr. 2005, 24, 502–509. [Google Scholar] [CrossRef] [PubMed]
- Dvir, D.; Cohen, J.; Singer, P. Computerized energy balance and complications in critically ill patients: An observational study. Clin. Nutr. 2006, 25, 37–44. [Google Scholar] [CrossRef]
- Yoo, S.H.; Kim, J.S.; Kwon, S.U.; Yun, S.C.; Koh, J.Y.; Kang, D.W. Undernutrition as a predictor of poor clinical outcomes in acute ischemic stroke patients. Arch. Neurol. 2008, 65, 39–43. [Google Scholar] [CrossRef]
- Wang, X.; Dong, Y.; Han, X.; Qi, X.Q.; Huang, C.G.; Hou, L.J. Nutritional support for patients sustaining traumatic brain injury: A systematic review and meta-analysis of prospective studies. PLoS ONE 2013, 8, e58838. [Google Scholar] [CrossRef]
- Sabbouh, T.; Torbey, M.T. Malnutrition in Stroke Patients: Risk Factors, Assessment, and Management. Neurocrit. Care 2018, 29, 374–384. [Google Scholar] [CrossRef]
- Santilli, V.; Bernetti, A.; Mangone, M.; Paoloni, M. Clinical definition of sarcopenia. Clin. Cases Miner. Bone Metab. 2014, 11, 177–180. [Google Scholar] [CrossRef]
- Nelke, C.; Dziewas, R.; Minnerup, J.; Meuth, S.G.; Ruck, T. Skeletal muscle as potential central link between sarcopenia and immune senescence. EBioMedicine 2019, 49, 381–388. [Google Scholar] [CrossRef]
- Dao, T.; Green, A.E.; Kim, Y.A.; Bae, S.; Ha, K.; Gariani, K.; Lee, M.; Menzies, K.J.; Rye, D. Sarcopenia and Muscle Aging: A Brief Overview. Endocrinol. Metab. 2020, 35, 716–732. [Google Scholar] [CrossRef]
- Zwart, A.T.; van der Hoorn, A.; van Ooijen, P.M.A.; Steenbakkers, R.; de Bock, G.H.; Halmos, G.B. CT-measured skeletal muscle mass used to assess frailty in patients with head and neck cancer. J. Cachexia Sarcopenia Muscle 2019, 10, 1060–1069. [Google Scholar] [CrossRef]
- Kilgour, A.H.; Subedi, D.; Gray, C.D.; Deary, I.J.; Lawrie, S.M.; Wardlaw, J.M.; Starr, J.M. Design and validation of a novel method to measure cross-sectional area of neck muscles included during routine MR brain volume imaging. PLoS ONE 2012, 7, e34444. [Google Scholar] [CrossRef]
- Kubo, Y.; Naito, T.; Mori, K.; Osawa, G.; Aruga, E. Skeletal muscle loss and prognosis of breast cancer patients. Support Care Cancer 2017, 25, 2221–2227. [Google Scholar] [CrossRef]
- Marklund, S.; Bui, K.; Nyberg, A. Measuring and monitoring skeletal muscle function in COPD: Current perspectives. Int. J. Chron. Obstruct. Pulmon. Dis. 2019, 19, 1825–1838. [Google Scholar] [CrossRef]
- Swartz, J.E.; Pothen, A.J.; Wegner, I.; Smid, E.J.; Swart, K.M.; de Bree, R.; Leenen, L.P.; Grolman, W. Feasibility of using head and neck CT imaging to assess skeletal muscle mass in head and neck cancer patients. Oral Oncol. 2016, 62, 28–33. [Google Scholar] [CrossRef]
- Ranganathan, K.; Terjimanian, M.; Lisiecki, J.; Rinkinen, J.; Mukkamala, A.; Brownley, C.; Buchman, S.R.; Wang, S.C.; Levi, B. Temporalis muscle morphomics: The psoas of the craniofacial skeleton. J. Surg. Res. 2014, 186, 246–252. [Google Scholar] [CrossRef]
- Leitner, J.; Pelster, S.; Schopf, V.; Berghoff, A.S.; Woitek, R.; Asenbaum, U.; Nenning, K.H.; Widhalm, G.; Kiesel, B.; Gatterbauer, B.; et al. High correlation of temporal muscle thickness with lumbar skeletal muscle cross-sectional area in patients with brain metastases. PLoS ONE 2018, 13, e0207849. [Google Scholar] [CrossRef]
- Knaus, W.A.; Draper, E.A.; Wagner, D.P.; Zimmerman, J.E. APACHE II: A severity of disease classification system. Crit. Care Med. 1985, 13, 818–829. [Google Scholar] [CrossRef]
- Capuzzo, M.; Valpondi, V.; Sgarbi, A.; Bortolazzi, S.; Pavoni, V.; Gilli, G.; Candini, G.; Gritti, G.; Alvisi, R. Validation of severity scoring systems SAPS II and APACHE II in a single-center population. Intensive Care Med. 2000, 26, 1779–1785. [Google Scholar] [CrossRef]
- Meredith, W.; Rutledge, R.; Fakhry, S.M.; Emery, S.; Kromhout-Schiro, S. The conundrum of the Glasgow Coma Scale in intubated patients: A linear regression prediction of the Glasgow verbal score from the Glasgow eye and motor scores. J. Trauma 1998, 44, 839–844; discussion 844–845. [Google Scholar] [CrossRef]
- Furtner, J.; Berghoff, A.S.; Albtoush, O.M.; Woitek, R.; Asenbaum, U.; Prayer, D.; Widhalm, G.; Gatterbauer, B.; Dieckmann, K.; Birner, P.; et al. Survival prediction using temporal muscle thickness measurements on cranial magnetic resonance images in patients with newly diagnosed brain metastases. Eur. Radiol. 2017, 27, 3167–3173. [Google Scholar] [CrossRef]
- Ryu, J.A.; Jung, W.; Jung, Y.J.; Kwon, D.Y.; Kang, K.; Choi, H.; Kong, D.S.; Seol, H.J.; Lee, J.I. Early prediction of neurological outcome after barbiturate coma therapy in patients undergoing brain tumor surgery. PLoS ONE 2019, 14, e0215280. [Google Scholar]
- Jennett, B.; Bond, M. Assessment of outcome after severe brain damage. Lancet 1975, 1, 480–484. [Google Scholar] [CrossRef]
- Jennett, B.; Snoek, J.; Bond, M.R.; Brooks, N. Disability after severe head injury: Observations on the use of the Glasgow Outcome Scale. J. Neurol. Neurosurg. Psychiatry 1981, 44, 285–293. [Google Scholar] [CrossRef]
- Bouziana, S.D.; Tziomalos, K. Malnutrition in patients with acute stroke. J. Nutr. Metab. 2011, 2011, 167898. [Google Scholar] [CrossRef]
- Davalos, A.; Ricart, W.; Gonzalez-Huix, F.; Soler, S.; Marrugat, J.; Molins, A.; Suner, R.; Genis, D. Effect of malnutrition after acute stroke on clinical outcome. Stroke 1996, 27, 1028–1032. [Google Scholar] [CrossRef]
- Shachar, S.S.; Williams, G.R.; Muss, H.B.; Nishijima, T.F. Prognostic value of sarcopenia in adults with solid tumours: A meta-analysis and systematic review. Eur. J. Cancer 2016, 57, 58–67. [Google Scholar] [CrossRef]
- Shen, W.; Punyanitya, M.; Wang, Z.; Gallagher, D.; St-Onge, M.P.; Albu, J.; Heymsfield, S.B.; Heshka, S. Total body skeletal muscle and adipose tissue volumes: Estimation from a single abdominal cross-sectional image. J. Appl. Physiol. 2004, 97, 2333–2338. [Google Scholar] [CrossRef]
- Ufuk, F.; Herek, D.; Yuksel, D. Diagnosis of Sarcopenia in Head and Neck Computed Tomography: Cervical Muscle Mass as a Strong Indicator of Sarcopenia. Clin. Exp. Otorhinolaryngol. 2019, 12, 317–324. [Google Scholar] [CrossRef]
- Jaumard, N.V.; Welch, W.C.; Winkelstein, B.A. Spinal facet joint biomechanics and mechanotransduction in normal, injury, and degenerative conditions. J. Biomech. Eng. 2011, 133, 071010. [Google Scholar] [CrossRef] [PubMed]
- Canseco, J.A.; Schroeder, G.D.; Patel, P.D.; Grasso, G.; Chang, M.; Kandziora, F.; Vialle, E.N.; Oner, F.C.; Schnake, K.J.; Dvorak, M.F.; et al. Regional and experiential differences in surgeon preference for the treatment of cervical facet injuries: A case study survey with the AO Spine Cervical Classification Validation Group. Eur. Spine J. 2021, 30, 517–523. [Google Scholar] [CrossRef]
- Ulbrich, E.J.; Anderson, S.E.; Busato, A.; Abderhalden, S.; Boesch, C.; Zimmernann, H.; Heini, P.; Hodler, J.; Sturzenegger, M. Cervical muscle area measurements in acute whiplash patients and controls. J. Magn. Reson. Imaging. 2011, 33, 668–675. [Google Scholar] [CrossRef]
- Ulbrich, E.J.; Aeberhard, R.; Wetli, S.; Busato, A.; Boesch, C.; Zimmernann, H.; Hodler, J.; Anderson, S.E.; Sturzenegger, M. Cervical muscle area measurements in whiplash patients; acute, 3, and 6 months of follow-up. J. Magn. Reson. Imaging. 2012, 36, 1413–1420. [Google Scholar] [CrossRef]
- Nakanishi, N.; Tsutsumi, R.; Okayama, Y.; Takashima, T.; Ueno, Y.; Itagaki, T.; Tsutsumi, Y.; Sakaue, H.; Oto, J. Monitoring of muscle mass in critically ill patients: Comparison of ultrasound and two bioelectrical impedance analysis devices. J. Intensive Care 2019, 7, 61. [Google Scholar] [CrossRef]
- Nakanishi, N.; Oto, J.; Tsutsumi, R.; Iuchi, M.; Onodera, M.; Nishimuras, M. Upper and lower limb muscle atrophy in critically ill patients: An observational ultrasonography study. Intensive Care Med. 2018, 44, 263–264. [Google Scholar] [CrossRef]
- Abdulazim, A.; Filis, A.; Sadr-Eshkevari, P.; Schulte, F.; Sandu, N.; Schaller, B. Postcraniotomy function of the temporal muscle in skull base surgery: Technical note based on a preliminary study. Sci. World J. 2012, 2012, 427081. [Google Scholar] [CrossRef][Green Version]


| Favorable Neurologic Outcome (n = 81) | Poor Neurologic Outcome (n = 108) | p Value | |
|---|---|---|---|
| Age (year) | 53.0 (33–63.5) | 63.5 (52.3–72.8) | <0.001 |
| Sex, male | 41 (50.6) | 59 (54.6) | 0.689 |
| BMI (kg/m2) | 24.1 (22.6–26.7) | 22.8 (20.7–25.1) | <0.001 |
| Body surface area (m2) | 1.8 (1.6–1.8) | 1.6 (1.5–1.8)) | <0.001 |
| Comorbidities | |||
| Malignancy | 46 (56.8) | 60 (55.6) | 0.983 |
| Hypertension | 30 (37.0) | 55 (50.9) | 0.080 |
| Diabetes mellitus | 11 (13.6) | 28 (25.9) | 0.058 |
| Current smoker | 13 (16.0) | 15 (13.9) | 0.836 |
| Ischemic heart disease | 4(4.9) | 8 (7.4) | 0.698 |
| Chronic kidney disease | 4 (4.9) | 8 (7.4) | 0.698 |
| Cause of ICU admission | 0.027 | ||
| Brain tumor | 34 (42.0) | 44 (40.7) | |
| Stroke * | 29 (35.8) | 41 (38.0) | |
| Traumatic brain injury | 4 (4.9) | 16 (14.8) | |
| Others | 14 (17.3) | 7 (6.5) | |
| GCS on ICU admission | 7.0 (3.0–13.0) | 6.0 (3.0–10.0) | 0.030 |
| APACHE II score on ICU admission | 18.0 (14.0–23.0) | 21.0 (17.3–26.0) | 0.001 |
| Use of mannitol † | 70 (86.4) | 104 (96.3) | 0.027 |
| Use of glycerin † | 54 (66.7) | 75 (69.4) | 0.804 |
| Use of dexamethasone | 57 (70.4) | 68 (63.0) | 0.363 |
| Initial albumin level (g/dL) | 3.4 (3.1–3.9) | 3.4 (3.0–3.9) | 0.403 |
| Favorable Neurologic Outcome (n = 81) | Poor Neurologic Outcome (n = 108) | p Value | |
|---|---|---|---|
| Initial C1-CSA (mm2) | 1825.2 (1602.4–2165.3) | 1853.9 (1605.1–2206.6) | 0.495 |
| Initial C1-CSA/BSA (mm2/m2) | 1071.5 (952.0–1225.4) | 1120.4 (1040.4–1299.0) | 0.029 |
| Follow-up C1-CSA (mm2) | 1850.0 (1598.3–2150.6) | 1807.8 (1577.1–2089.1) | 0.686 |
| Follow-up C1-CSA/BSA (mm2/m2) | 1072.6 (930.6–1201.8) | 1099.4 (978.5–1231.8) | 0.390 |
| ∆C1-CSA (mm2) | 22.8 (−147.3–180.6) | 78.1 (−86.3–225.7) | 0.123 |
| ∆C1-CSA/BSA (mm2/m2) | 7.5 (−84.8–111.3) | 60.0 (−42.4–137.7) | 0.086 |
| Change of C1-CSA | 1.4 (−7.9–9.4) | 4.4 (−4.4–11.6) | 0.133 |
| Initial TMT (mm) | 7.2 (6.1–9.1) | 6.4 (5.2–7.6) | 0.003 |
| Follow-up TMT (mm) | 5.9 (4.9–7.6) | 5.1 (4.0–6.6) | 0.001 |
| ∆TMT (mm) | 1.0 (0.2–1.9) | 1.3 (0.4–2.1) | 0.496 |
| Change of TMT | 14.1 (−2.9–26.5) | 18.1 (7.9–29.6) | 0.110 |
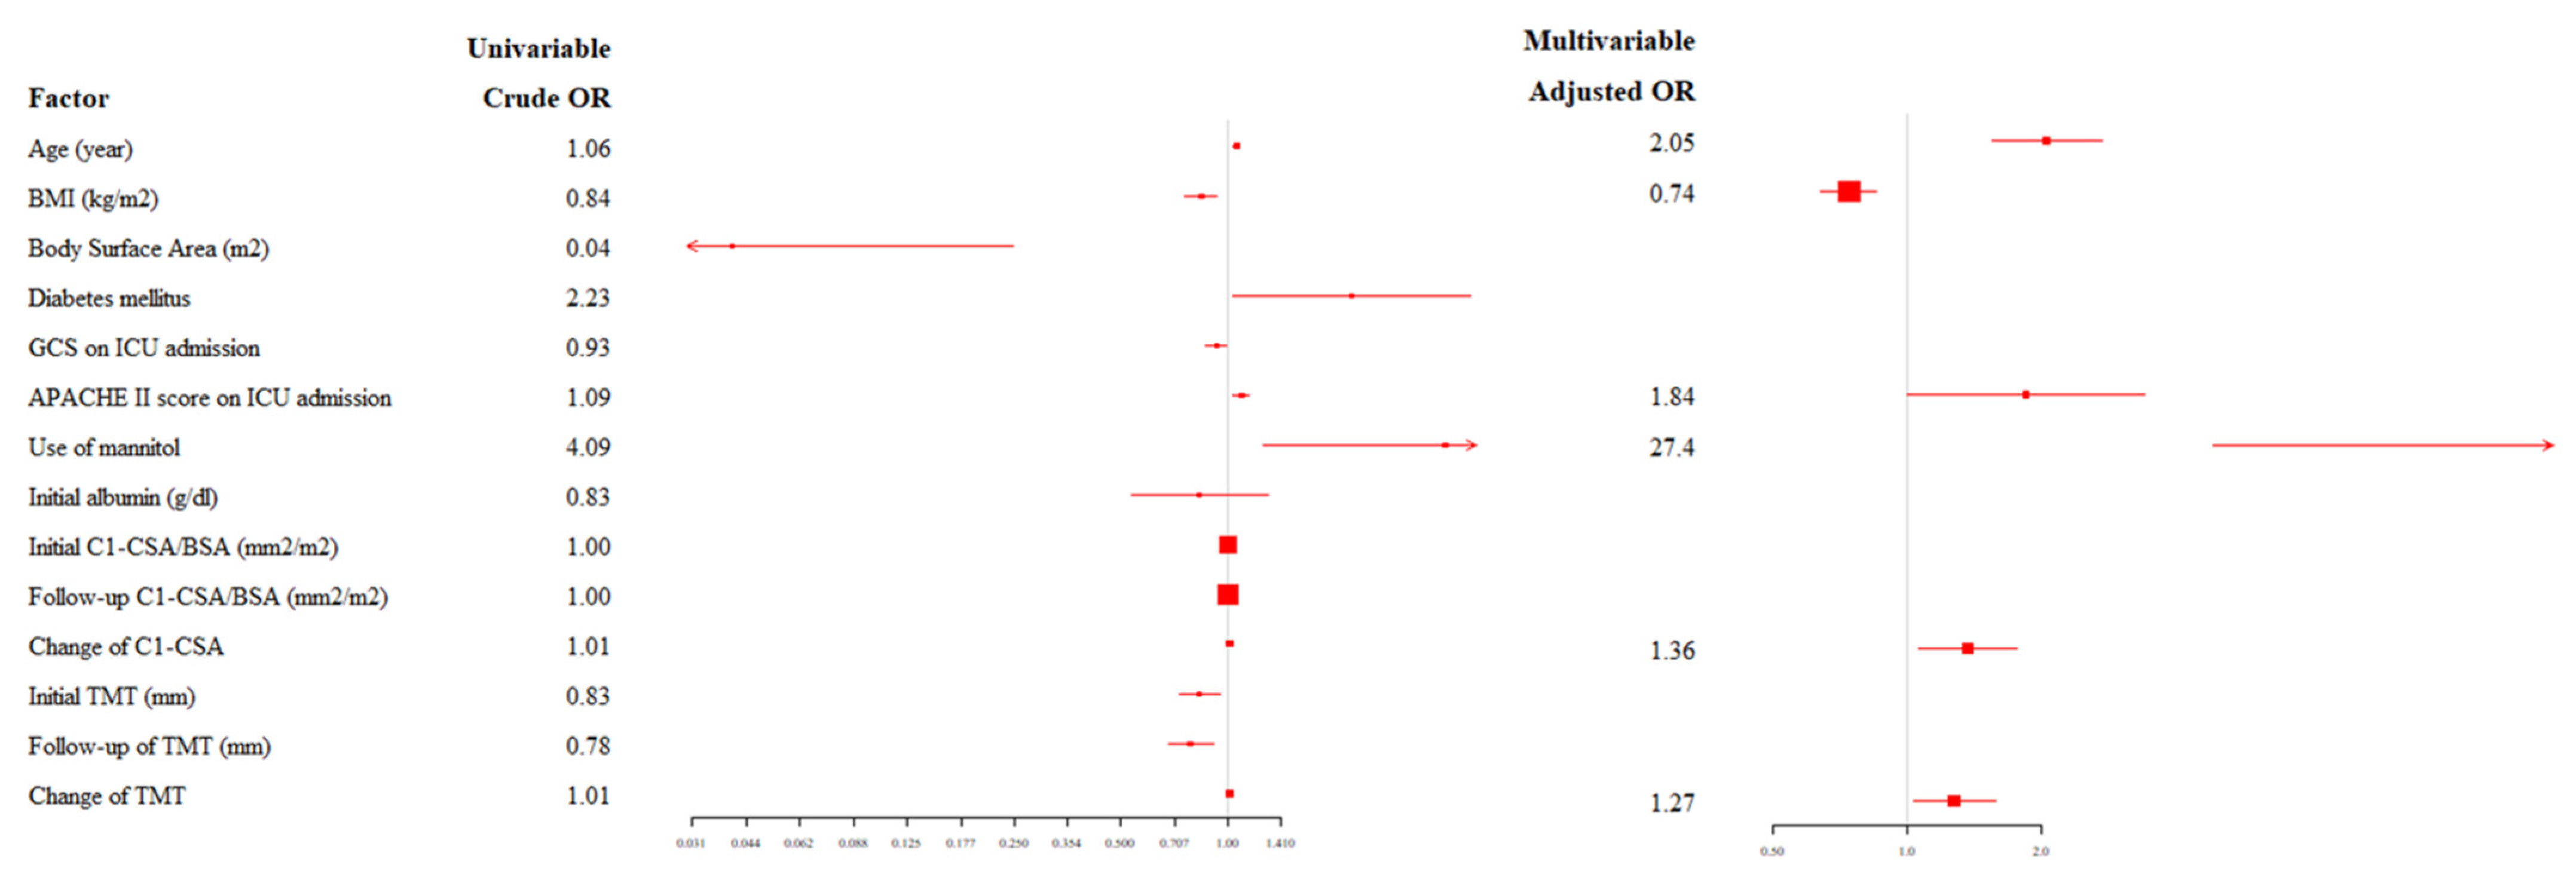
| Univariable Analysis | Multivariable Analysis | |||
|---|---|---|---|---|
| Crude Odds Ratio (95% CI) | p Value | Adjusted Odds Ratio (95% CI) | p Value | |
| Age (year) | 1.06 (1.033–1.078) | <0.001 | 2.05 (1.543–2.724) | <0.001 |
| BMI (kg/m2) | 0.84 (0.757–0.930) | 0.001 | 0.74 (0.638–0.849) | <0.001 |
| Body surface area (m2) | 0.04 (0.007–0.247) | <0.001 | ||
| Diabetes mellitus | 2.23 (1.034–4.799) | 0.041 | ||
| GCS on ICU admission | 0.93 (0.865–0.991) | 0.026 | ||
| APACHE II score on ICU admission | 1.09 (1.035–1.143) | 0.001 | 1.84 (0.996–3.396) | 0.052 |
| Use of mannitol | 4.09 (1.251–13.347) | 0.020 | 27.4 (4.833–155.860) | <0.001 |
| Initial albumin level (g/dL) | 0.83 (0.535–1.298) | 0.420 | ||
| Initial C1-CSA/BSA (mm2/m2) | 1.00 (1.000–1.003) | 0.026 | ||
| Follow-up C1-CSA/BSA (mm2/m2) | 1.00 (1.000–1.002) | 0.155 | ||
| Change of C1-CSA | 1.01 (0.989–1.026) | 0.432 | 1.36 (1.054–1.761) | 0.018 |
| Initial TMT (mm) | 0.83 (0.733–0.945) | 0.005 | ||
| Follow-up TMT (mm) | 0.78 (0.677–0.909) | 0.001 | ||
| Change of TMT | 1.01 (0.993–1.019) | 0.383 | 1.27 (1.028–1.576) | 0.027 |
Publisher’s Note: MDPI stays neutral with regard to jurisdictional claims in published maps and institutional affiliations. |
© 2021 by the authors. Licensee MDPI, Basel, Switzerland. This article is an open access article distributed under the terms and conditions of the Creative Commons Attribution (CC BY) license (https://creativecommons.org/licenses/by/4.0/).
Share and Cite
Lee, Y.I.; Ko, R.-E.; Ahn, J.; Carriere, K.C.; Ryu, J.-A. Association between Neurologic Outcomes and Changes of Muscle Mass Measured by Brain Computed Tomography in Neurocritically Ill Patients. J. Clin. Med. 2022, 11, 90. https://doi.org/10.3390/jcm11010090
Lee YI, Ko R-E, Ahn J, Carriere KC, Ryu J-A. Association between Neurologic Outcomes and Changes of Muscle Mass Measured by Brain Computed Tomography in Neurocritically Ill Patients. Journal of Clinical Medicine. 2022; 11(1):90. https://doi.org/10.3390/jcm11010090
Chicago/Turabian StyleLee, Yun Im, Ryoung-Eun Ko, Joonghyun Ahn, Keumhee C. Carriere, and Jeong-Am Ryu. 2022. "Association between Neurologic Outcomes and Changes of Muscle Mass Measured by Brain Computed Tomography in Neurocritically Ill Patients" Journal of Clinical Medicine 11, no. 1: 90. https://doi.org/10.3390/jcm11010090
APA StyleLee, Y. I., Ko, R.-E., Ahn, J., Carriere, K. C., & Ryu, J.-A. (2022). Association between Neurologic Outcomes and Changes of Muscle Mass Measured by Brain Computed Tomography in Neurocritically Ill Patients. Journal of Clinical Medicine, 11(1), 90. https://doi.org/10.3390/jcm11010090