Abstract
Circulating osteoprotegerin (OPG) is a biomarker for cardiovascular complications that are closely related to chronic kidney disease (CKD). To investigate the association between circulating OPG level with long-term visit-to-visit blood pressure variability (BPV) in patients with pre-dialysis CKD, a total of 1855 subjects with CKD from stage 1 to pre-dialysis stage 5 from a prospective cohort were analyzed. Long-term visit-to-visit BPV was determined by average real variability (ARV), standard deviation (SD), and coefficient of variation (CoV) of systolic and diastolic blood pressure (SBP and DBP). ARV of SBP (Adjusted β coefficient 0.143, 95% confidence interval 0.021 to 0.264) was significantly associated with serum OPG level. Although SD and CoV of SBP were not significantly associated with serum OPG level in multivariate linear regression analyses, restricted cubic spline visualized the linear correlation of serum OPG level with all of ARV, SD, and CoV. The association between serum OPG level and DBP variability was not significant. Subgroup analyses revealed that the association of serum OPG with BPV is more prominent in the subjects with Charlson comorbidity index ≤3 and in the subjects without history of diabetes mellitus. In conclusion, circulating OPG level is potentially associated with long-term visit-to-visit BPV in patients with pre-dialysis CKD.
1. Introduction
Blood pressure variability (BPV) is an emerging surrogate of cardiovascular (CV) outcomes, as it predicts the risk of CV events and all-cause mortality in general population [1,2,3], independent of mean blood pressure (BP). Among patients with chronic kidney disease (CKD), long-term visit-to-visit BPV is also associated with adverse CV outcomes [4]. Further, visit-to-visit BPV increases the risk of incident CKD in hypertensive individuals [5] and accelerates the decline of renal function in patients with CKD [6,7,8]. Provided that CV events are the leading cause of death in patients with reduced kidney function [9], the prediction of long-term BPV is becoming more and more important in the management of CKD patients.
Osteoprotegerin (OPG) is a decoy receptor of receptor activator of nuclear factor kappa-B ligand (RANKL) [10], which belongs to soluble tumor necrosis factor superfamily receptor [11]. OPG inhibits RANKL-mediated differentiation of osteoclast as well as activation and survival of mature osteoclasts [11], playing a pivotal role in the regulation of bone turnover. Circulating OPG levels increase with initiation of atherogenic diet, while exogenous OPG injection inhibits vascular calcification [12,13,14], indicating circulating OPG as a biomarker, but not a mediator, of atherosclerosis that is also closely related to CKD. Previous studies demonstrated that high serum OPG level is associated with the presence [15] and severity [16] of coronary artery calcification in patients with CKD. In this regard, elevated circulating OPG level has been proposed as a predictor of cardiovascular [17,18] and all-cause [19,20] mortality in patients with CKD. Serum OPG level is positively associated with peripheral artery disease, arterial stiffness, and arterial calcification in patients with end-stage renal disease [21,22,23,24]. Moreover, kidney transplantation decreases circulating level of OPG [25], and early post-transplantation circulating OPG level in serum predicts long-term patient survival up to 8 years [26], collectively suggesting a prognostic impact of circulating OPG level in patients with renal insufficiency. Nevertheless, the association between circulating OPG level and BPV has not been validated yet, especially in patients with CKD.
We here investigated the association between circulating OPG level with long-term visit-to-visit BPV in patients with pre-dialysis CKD. Taking advantage of various BPV indices, we intensively examined the linear correlation between serum OPG level and BPV. We also conducted subgroup analyses to address whether the association of serum OPG level with BPV modified by clinical contexts.
2. Materials and Methods
2.1. Study Design
The Korean Cohort Study for Outcomes in Patients with Chronic Kidney Disease (KNOW-CKD) is a nationwide prospective cohort study involving 9 tertiary-care general hospitals in Korea [27]. Korean patients with CKD from stage 1 to pre-dialysis stage 5, who voluntarily provided informed consent were enrolled. The study was conducted in accordance with the principles of the Declaration of Helsinki, and the study protocol was approved by the institutional review boards of participating centers. A total of 2238 subjects were longitudinally followed up. (Figure 1). After excluding those lacking the baseline measurement of BP, those with the number of BP measurement during follow-up periods less than three time, and those lacking the baseline measurement of serum OPG level, a total of 1855 subjects were finally included for the analyses. The median follow-up duration was 6.124 years.
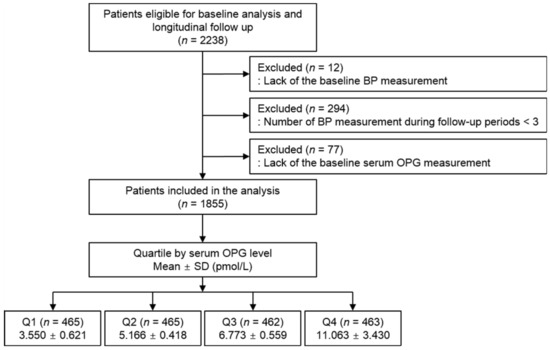
Figure 1.
Flow diagram of the study participants. Abbreviations: ASV, average successive variability; BP, blood pressure; OPG, osteoprotegerin; Q1, 1st quartile; Q2, 2nd quartile; Q3, 3rd quartile; Q4, 4th quartile; SD, standard deviation.
2.2. Data Collection from Participants
Demographic information was collected from all eligible participants, including age, gender, comorbid conditions, and medication history (angiotensin-converting enzyme inhibitor/angiotensin II receptor blockers (ACEi/ARBs), diuretics, total number of antihypertensive drugs, statins). Trained staff members measured the height and weight of study participants. Body mass index (BMI) was calculated as weight divided by height squared. Venous samples were collected following overnight fasting, to determine hemoglobin, albumin, total cholesterol, low density lipoprotein cholesterol (LDL-C) high density lipoprotein cholesterol (HDL-C), triglyceride (TG), fasting glucose, high-sensitivity C-reactive protein (hs-CRP), 25-hydroxyvitamin D (25(OH) vitamin D) and creatinine levels at the baseline. Estimated glomerular filtration rate (eGFR) was calculated by Chronic Kidney Disease Epidemiology Collaboration (CKD-EPI) equation [28]. Urine albumin-to-creatinine ratio was measured in random, preferably second-voided, spot urine samples. Twenty-four-hour urine protein excretion was also determined.
2.3. Measurement of Serum OPG Concentration
Serum OPG level was measured by using enzyme-linked immunosorbent assay kit (BioVendor R&D, Brno, The Czech Republic) in the central laboratory (Lab Genomics, Seongnam, Korea) [29]. Intra-assay coefficients of variations was <4.9% and inter-assay coefficients of variations was <9.0%. Mean values of duplicated assay were used for reporting results.
2.4. Determination of Long-Term Visit-to-Visit BPV
BP was measured by an electronic sphygmomanometer after seated rest for 5 min, at 0, 6, and 12 months and then yearly thereafter up to 8 years. Long-term visit-to-visit BPV was determined by average real variability (ARV), standard deviation (SD), and coefficient of variation (CoV) of systolic and diastolic BP (SBP and DBP) across visits. The median number of BP measurement in the study participants was 7 times.
2.5. Study Outcomes
The changes in ARV (in mmHg), SD (in mmHg), and CoV of SBP and DBP by serum OPG level (in pmol/L) were analyzed. ARV of SBP was used in the primary analysis, as its correlation with serum OPG level was strongest (Pearson r = 0.195, p < 0.001), while the others were used in the secondary analyses.
2.6. Statistical Analysis
Continuous variables were expressed as mean ± standard deviation or median [interquartile range]. Categorical variables were expressed as number of participants and percentage. For descriptive analyses, Student’s t test or one-way analysis of variance and χ2 test were used for continuous and categorical variates, respectively. The subjects with any missing data were excluded from further analyses. Multivariate linear regression analyses were used to define the association between serum OPG level and BPV. The models were adjusted for age, sex, Charlson comorbidity index, smoking history, BMI, SBP, DBP, medication (ACEi/ARB, diuretic use, number of antihypertensive drugs, statins), hemoglobin, albumin, HDL-C, fasting glucose, 25(OH) vitamin D, hs-CRP levels, eGFR and 24 h urine protein. The results of multivariate linear regression models were presented as beta coefficient and 95% CIs. Restricted cubic splines were used to visualize the association between serum OPG level as a continuous variable and adjusted beta coefficients for BPV indices. Two-sided p values <0.05 were considered statistically significant. Statistical analysis was performed using SPSS for Windows version 22.0 (IBM Corp., Armonk, NY, USA) and R (version 4.1.1; R project for Statistical Computing, Vienna, Austria).
3. Results
3.1. Baseline Characteristics
To address the baseline characteristics, study participants were divided into the quartile by serum OPG level (Table 1). The mean age was lowest and highest in the 1st (Q1) and 4th (Q4) quartile, respectively. Inversely, the frequency of male sex was highest in Q1. Most of the subjects in Q1 (94.8%) belonged to Charlson commodity index ≤3, while the frequency of the subjects with Charlson commodity index ≥4 was relatively higher in Q4. The frequency of the subjects with previous history of DM and coronary artery disease was significantly higher in Q4, while there was no significant difference in the frequency of the history of arrhythmia and ever-time smoking among the quartile groups. The proportion of the subjects with DM increased as serum OPG level increased, whereas the proportion of the subjects with glomerulonephritis or polycystic kidney disease decreased as serum OPG increased. Although the frequency of ACEi/ARB use was not significantly different among the groups, the use of diuretics, the use of no less than three antihypertensive drugs, and statin medication was more frequently observed in Q4. BMI did not significantly differ among the groups either. SBP gradually increases from Q1 to Q4, whereas DBP, despite the significant difference across the groups, did not show any clear correlation with serum OPG level. Hemoglobin and albumin levels were highest and lowest in Q1 and Q4, respectively. Total cholesterol, LDL-C, and TG levels were highest in Q4, whereas HDL-C level was lowest in Q4. Fasting glucose and hs-CRP levels were highest in Q4, while 25(OH) vitamin D level was lowest in Q4. Both proteinuria in 24 h urine and albumin-to-creatinine ratio in spot urine were highest in Q4. eGFR was also significantly lower in Q4. Accordingly, the subjects with more advanced stages of CKD were more frequently observed in Q4. Taken together, high serum OPG level was clearly associated with deleterious clinical features in patients with CKD.

Table 1.
Baseline characteristics of study participants by serum OPG level.
3.2. Association of Serum OPG Level with BPV in Patients with CKD
To compare SBP variability among the quartile group by serum OPG levels, one-way analysis of variance was conducted (Figure 2). All of ARV, SD, and CoV of SBP significantly increased as serum OPG increased. ARV and CoV of DBP were also highest in Q4 (Figure S1). To determine the independent association between serum OPG level and systolic BPV, multivariate linear regression models were analyzed (Table 2). In the analyses of all subjects, ARV of SBP (Adjusted β coefficient 0.143, 95% confidence interval (CI) 0.021 to 0.264, p = 0.021) was significantly associated with serum OPG level. The association between serum OPG level and DBP variability was not significant (Table S1), regardless of BPV indices. To visualize the association between serum OPG level and SBP variability, restricted cubic splines were constructed, which revealed a stringent, linear correlation between serum OPG level and ARV of SBP (Figure 3). Although SD (Adjusted β coefficient 0.074, 95% CI -0.018 to 0.165, p = 0.113) or CoV of SBP (Adjusted β coefficient 0.000, 95% CI 0.000 to 0.000, p = 0.203) was not significantly associated with serum OPG level in the multivariate linear regression model (Table 2), restricted cubic splines demonstrated linear correlations (Figure S2).
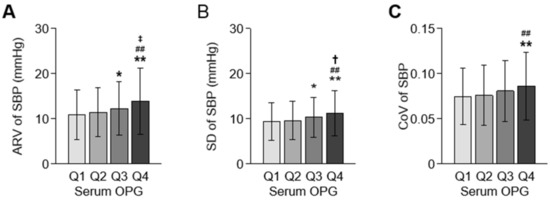
Figure 2.
Comparisons of systolic BPV by serum OPG level. Systolic BPV, represented by ARV (A), SD (B), and CoV (C), is compared by the quartile of serum OPG level. Error bars indicate standard deviation. * p < 0.05, ** p < 0.01 vs. Q1; ## p < 0.01 vs. Q2; † p < 0.05, ‡ p < 0.01 vs. Q3 by one-way ANOVA with Scheffe test. Abbreviations: ARV, average real variability; CoV, coefficient of variation; OPG, osteoprotegerin; Q1, 1st quartile; Q2, 2nd quartile; Q3, 3rd quartile; Q4, 4th quartile; SBP, systolic blood pressure; SD, standard deviation.
Table 2.
Multivariate linear regression analyses of serum OPG level (per pmol/L) for systolic BPV.
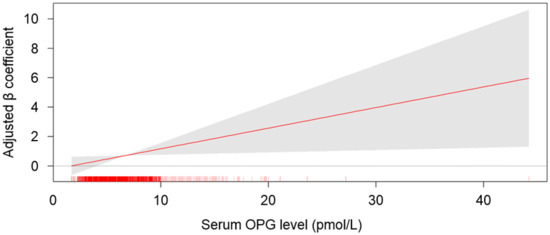
Figure 3.
Restricted cubic spline of serum OPG on ARV of SBP. Adjusted β coefficient of serum OPG as a continuous variable for ARV of SBP is depicted. The model was adjusted for age, gender, Charlson comorbidity index, smoking history, BMI, SBP, DBP, medication (ACEi/ARBs, diuretics, number of antihypertensive drugs, statins), hemoglobin, albumin, HDL-C, fasting serum glucose, hs-CRP, 25(OH) vitamin D levels, eGFR, and 24 h urine protein. Abbreviations: OPG, osteoprotegerin.
3.3. Sensitivity Analysis
To substantiate our findings, we conducted sensitivity analyses by excluding the subjects with CKD stage 1 (n = 312), who are considered close to normal kidney function (Table 3). Multivariate linear regression analyses revealed that serum OPG level was robustly and significantly associated with ARV of SBP (Adjusted β coefficient 0.143, 95% CI 0.008 to 0.277, p = 0.038). In addition, to exclude those with possible risk of exaggerated BPV due to less frequent BP measurement, we only included the subjects with BP measurement no less than 5 time (n = 1502) and analyzed the association of serum OPG level and BPV. Despite the decreased number of the subjects being analyzed, serum OPG level was robustly and significantly associated with SD (Adjusted β coefficient 0.149, 95% CI 0.034 to 0.264, p = 0.011), and CoV (Adjusted β coefficient 0.001, 95% CI 0.000 to 0.002, p = 0.025), but not with ARV (Adjusted β coefficient 0.096, 95% CI -0.022 to 0.264, p = 0.096), of SBP (Table S2). Among the subjects with BP measurement no less than 5 time, serum OPG level was not significantly associated with any of ARV (Adjusted β coefficient 0.071, 95% CI -0.036 to 0.178, p = 0.196), SD (Adjusted β coefficient 0.072, 95% CI -0.010 to 0.155, p = 0.086), and CoV (Adjusted β coefficient 0.001, 95% CI 0.000 to 0.002, p = 0.055) of DBP (Table S3). Overall, the sensitivity analyses confirmed that serum OPG level is significantly associated with BPV in patients with pre-dialysis CKD.
Table 3.
Multivariate linear regression analyses of serum OPG level (per pmol/L) for SBPV excluding the subjects with CKD stage 1.
3.4. Subgroup Analysis
To address whether the association of serum OPG level with BPV modified by clinical contexts, we conducted subgroup analyses. The subgroups were stratified by age (<60 or ≥60 years), gender (male or female), Charlson comorbidity index (≤3 or ≥4), BMI (<23 or ≥23 kg/m2), history of DM (without or with), eGFR (≥45 or <45 mL/min/1.73m2), 24 h urine protein (<200 or ≥200 mg/g). Although the association between serum OPG level and ARV of SBP was not significantly modified in any subgroups (Table 4), the association of serum OPG level with SD (Table 5) and CoV of SBP (Table S4) was significantly modified by Charlson comorbidity index and history of DM, suggesting that the association of serum OPG with BPV is more prominent in the subjects with Charlson comorbidity index ≤3 and in the subjects without history of DM. The association between serum OPG level and ARV, SD, or CoV of DBP was not significantly modified in any subgroups (Tables S5–S7).
Table 4.
Multivariate linear regression analyses of serum OPG level (per pmol/L) for ARV of SBP in various subgroups.
Table 5.
Multivariate linear regression analyses of serum OPG level (per pmol/L) for SD of SBP in various subgroups.
4. Discussion
In the present study, we found a significant association between circulating OPG level and long-term visit-to-visit BPV in patients with pre-dialysis CKD. The association between circulating OPG level with BPV was especially prominent in the subjects with Charlson comorbidity index ≤3 and in the subjects without history of DM.
Elevation of serum OPG level in the subjects with reduced eGFR has been previously reported [30]. Despite the debate on the role of circulating OPG in atherosclerotic disease [31], as an experimental study reported that exogenous OPG treatment lead to endothelial and vascular smooth cell dysfunction by promoting the production of reactive oxygen species, which may underlie vascular injurious effects in conditions such as hypertension [32], the phenotype of OPG-knockout mice ultimately indicates circulating OPG as a biomarker, rather than a mediator, of atherosclerosis, as OPG-deficient mice develop early onset arterial calcification [33]. In this context, the association of high serum OPG level with coronary artery calcification [15,16], and cardiovascular [17,18] and all-cause mortality [19,20] in patients with CKD has been suggested. The association between serum OPG level with long-term visit-to-visit BPV presented in this study highlights a novel role of circulating OPG as a biomarker that predict a surrogate of CV events. It should be further elucidated whether the association is also valid in general population or in patients with end-stage renal disease.
We could not present a precise mechanism of the association between circulating OPG level and BPV, thought a possible explanation is an effect that is mediated by arterial stiffness. Mounting evidence suggests that serum OPG level is associated with vascular calcification and arterial stiffness as well as coronary artery calcification [10,34,35]. As arterial stiffness significantly correlates with increase in BPV [36], it is speculated that arterial stiffness may mediate the association between circulating OPG level and BPV.
The methods for the evaluation of visit-to-visit BPV is variable. SD is relatively easier and probably more practical but tends to correlate with the average of blood pressure measurements. Therefore, CoV, which is calculated by dividing the mean value by the SD, has been also used to determine visit-to-visit BPV [37]. ARV, which is defined as the average of the absolute differences of consecutive measurements, is a more reliable and sensitive representation of time series variability despite relatively low sampling frequency than SD [38], which is the reason why ARV was used as the primary analysis in the current study. The other index of BPV is the variation independent of the mean (VIM), which is calculated based on non-linear regression [39]. Although VIM is considered to be a better index of BP variability than the other indices, because VIM is literally not association with mean blood pressure. However, VIM was not evaluated in this study, as there is a significant difference between VIM and the other indices of BPV (SD, CoV, and ARV) and as it is less practical in clinical perspectives [37].
There are a number of limitations in this study. First, we did not analyze whether the casual relation between high circulating OPG and previously known adverse CV outcomes is mediated by high BPV. Second, despite the clear association of high circulating OPG with BPV, the precise mechanism should be further addressed. Third, although the results indicate an independent association of serum OPG level and BPV, a possibility cannot be still excluded that the factors other than BPV may have some effects on serum OPG levels, because the baseline characteristics were strikingly differed by serum OPG levels. Fourth, as this cohort study enrolled only ethnic Koreans, a precaution is required to extrapolate the data in the present study to other populations.
5. Conclusions
In conclusion, we report a potential association between circulating OPG level and long-term visit-to-visit BPV in patients with pre-dialysis CKD. The association between circulating OPG level with BPV is especially prominent in the subjects with Charlson comorbidity index ≤3 and in the subjects without history of DM.
Supplementary Materials
The following are available online at https://www.mdpi.com/article/10.3390/jcm11010178/s1, Figure S1: Restricted cubic spline of serum OPG on SD and CoV of SBP, Table S1: Multivariate linear regression analyses of serum OPG level (per pmol/L) for DBPV, Table S2: Multivariate linear regression analyses of serum OPG level (per pmol/L) for SBPV in subjects with BP measurements no less than 5 times during follow-up periods, Table S3: Multivariate linear regression analyses of serum OPG level (per pmol/L) for DBPV in subjects with BP measurements no less than 5 times during follow-up periods, Table S4: Multivariate linear regression analyses of serum OPG level (per pmol/L) for ARV of SBP in various subgroups, Table S5: Multivariate linear regression analyses of serum OPG level (per pmol/L) for CoV of SBP in various subgroups, Table S6: Multivariate linear regression analyses of serum OPG level (per pmol/L) for ARV of DBP in various subgroups.
Author Contributions
Conceptualization, S.H.S.; methodology, S.H.S., T.R.O. and H.S.C.; validation, C.S.K.; formal analysis, S.H.S.; resources, K.-H.O., J.L., Y.K.O., J.Y.J. and K.H.C.; writing—original draft preparation, S.H.S.; writing—review and editing, S.H.S.; visualization, S.H.S.; supervision, E.H.B. and S.W.K.; project administration, S.K.M. and S.W.K.; funding acquisition, K.-H.O., H.S.C. and S.W.K. All authors have read and agreed to the published version of the manuscript.
Funding
This work was supported by the Research Program funded by the Korea Centers for Disease Control and Prevention (grant numbers 2011E3300300, 2012E3301100, 2013E3301600, 2013E3301601, 2013E3301602, 2016E3300200, 2016E3300201, 2016E3300202, and 2019E320100), and by the National Research Foundation of Korea (NRF) funded by the Korea Government (MSIT) (NRF-2019R1A2C2086276).
Institutional Review Board Statement
The study protocol was approved by the Institutional Review Board at each participating clinical center (Seoul National University Hospital (1104-089-359), Seoul National University Bundang Hospital (B-1106/129–008), Yonsei University Severance Hospital (4-2011-0163), Kangbuk Sam-sung Medical Center (2011-01-076), Seoul St. Mary’s Hospital (KC11OIMI0441), Gil Hospital (GIRBA2553), Eulji General Hospital (201105-01), Chonnam National University Hospital (CNUH-2011-092), and Busan Paik Hospital (11-091)).
Informed Consent Statement
Informed consent was obtained from all subjects involved in the study.
Data Availability Statement
The raw data supporting the conclusions of this article will be made available by the authors, without undue reservation.
Acknowledgments
KNOW-CKD: Study Group Clinical Centers. Seoul National University, Curie Ahn, Kook-Hwan Oh, Dong Wan Chae, Ho Jun Chin, Hayne Cho Park, Seungmi Lee, Hyun Hwa Jang and Hyun Jin Cho. Yonsei University, Severance Hospital, Kyu Hun Choi, Seung Hyeok Han, Tae Hyun Yoo and Mi Hyun Yu. Kangbuk Samsung Medical Center, Kyubeck Lee and Sooyeon Jin. The Catholic University of Korea, Seoul St. Mary’s Hospital, Yong-Soo Kim and Sol Ji Kim. Gachon University, Gil Hospital, Wookyung Chung, Youkyoung Jang and Ji Hye Park. Eulji University, Eulji General Hospital. Young-Hwan Hwang, Su-Ah Sung and Jeong Ok So. Chonnam University, Soo Wan Kim and Ji Seon Lee. Inje University, Pusan Paik Hospital, Yeong Hoon Kim, Sun Woo Kang and Yun Jin Kim. Epidemiology and Biostatistics. Department of Preventive Medicine, Seoul National University College of Medicine, Byung-Joo Park, Sue Kyung Park and Juyeon Lee. Coordinating Center. Medical Research Collaborating Center, Seoul National University Hospital and Seoul National University College of Medicine, Joongyub Lee, Dayeon Nam, Soohee Kang and Heejung Ahn. Central Laboratory, Donghee Seo, Lab Genomics, Korea and Dae Yeon Cho, Lab Genomics, Korea. Biobank. Korea Biobank, Korea Centers for Disease Control and Prevention, Osong, Korea. Korea Center for Disease Control and Prevention, Dukhyoung Lee, Hyekyung Park (Project Officer), Eunkyeong Jung (Project Officer), Suyeon Jeong, Eunmi Ahn and Sil-Hea Sung.
Conflicts of Interest
The authors declare no conflict of interest.
References
- Eguchi, K.; Hoshide, S.; Schwartz, J.E.; Shimada, K.; Kario, K. Visit-to-visit and ambulatory blood pressure variability as predictors of incident cardiovascular events in patients with hypertension. Am. J. Hypertens. 2012, 25, 962–968. [Google Scholar] [CrossRef] [PubMed]
- Muntner, P.; Shimbo, D.; Tonelli, M.; Reynolds, K.; Arnett, D.K.; Oparil, S. The relationship between visit-to-visit variability in systolic blood pressure and all-cause mortality in the general population: Findings from NHANES III, 1988 to 1994. Hypertension 2011, 57, 160–166. [Google Scholar] [CrossRef] [PubMed]
- Suchy-Dicey, A.M.; Wallace, E.R.; Mitchell, S.V.; Aguilar, M.; Gottesman, R.F.; Rice, K.; Kronmal, R.; Psaty, B.M.; Longstreth, W.T., Jr. Blood pressure variability and the risk of all-cause mortality, incident myocardial infarction, and incident stroke in the cardiovascular health study. Am. J. Hypertens. 2013, 26, 1210–1217. [Google Scholar] [CrossRef] [PubMed]
- Mallamaci, F.; Minutolo, R.; Leonardis, D.; D’Arrigo, G.; Tripepi, G.; Rapisarda, F.; Cicchetti, T.; Maimone, I.; Enia, G.; Postorino, M.; et al. Long-term visit-to-visit office blood pressure variability increases the risk of adverse cardiovascular outcomes in patients with chronic kidney disease. Kidney Int. 2013, 84, 381–389. [Google Scholar] [CrossRef] [PubMed]
- Li, Y.; Li, D.; Song, Y.; Gao, L.; Fan, F.; Wang, B.; Liang, M.; Wang, G.; Li, J.; Zhang, Y.; et al. Visit-to-visit variability in blood pressure and the development of chronic kidney disease in treated general hypertensive patients. Nephrol. Dial. Transplant. 2020, 35, 1739–1746. [Google Scholar] [CrossRef] [PubMed]
- Whittle, J.; Lynch, A.I.; Tanner, R.M.; Simpson, L.M.; Davis, B.R.; Rahman, M.; Whelton, P.K.; Oparil, S.; Muntner, P. Visit-to-Visit Variability of BP and CKD Outcomes: Results from the ALLHAT. Clin. J. Am. Soc. Nephrol. 2016, 11, 471–480. [Google Scholar] [CrossRef] [PubMed]
- Yokota, K.; Fukuda, M.; Matsui, Y.; Hoshide, S.; Shimada, K.; Kario, K. Impact of visit-to-visit variability of blood pressure on deterioration of renal function in patients with non-diabetic chronic kidney disease. Hypertens. Res. 2013, 36, 151–157. [Google Scholar] [CrossRef] [PubMed]
- Yokota, K.; Fukuda, M.; Matsui, Y.; Kario, K.; Kimura, K. Visit-to-visit variability of blood pressure and renal function decline in patients with diabetic chronic kidney disease. J. Clin. Hypertens. 2014, 16, 362–366. [Google Scholar] [CrossRef]
- Thompson, S.; James, M.; Wiebe, N.; Hemmelgarn, B.; Manns, B.; Klarenbach, S.; Tonelli, M.; Alberta Kidney Disease, N. Cause of Death in Patients with Reduced Kidney Function. J. Am. Soc. Nephrol. 2015, 26, 2504–2511. [Google Scholar] [CrossRef]
- Montañez-Barragán, A.; Gómez-Barrera, I.; Sanchez-Niño, M.D.; Ucero, A.C.; González-Espinoza, L.; Ortiz, A. Osteoprotegerin and kidney disease. J. Nephrol. 2014, 27, 607–617. [Google Scholar] [CrossRef]
- Simonet, W.S.; Lacey, D.L.; Dunstan, C.R.; Kelley, M.; Chang, M.S.; Lüthy, R.; Nguyen, H.Q.; Wooden, S.; Bennett, L.; Boone, T.; et al. Osteoprotegerin: A novel secreted protein involved in the regulation of bone density. Cell 1997, 89, 309–319. [Google Scholar] [CrossRef]
- Morony, S.; Tintut, Y.; Zhang, Z.; Cattley, R.C.; Van, G.; Dwyer, D.; Stolina, M.; Kostenuik, P.J.; Demer, L.L. Osteoprotegerin inhibits vascular calcification without affecting atherosclerosis in ldlr(-/-) mice. Circulation 2008, 117, 411–420. [Google Scholar] [CrossRef]
- Bennett, B.J.; Scatena, M.; Kirk, E.A.; Rattazzi, M.; Varon, R.M.; Averill, M.; Schwartz, S.M.; Giachelli, C.M.; Rosenfeld, M.E. Osteoprotegerin inactivation accelerates advanced atherosclerotic lesion progression and calcification in older ApoE-/- mice. Arterioscler. Thromb. Vasc. Biol. 2006, 26, 2117–2124. [Google Scholar] [CrossRef]
- Weiss, R.M.; Lund, D.D.; Chu, Y.; Brooks, R.M.; Zimmerman, K.A.; El Accaoui, R.; Davis, M.K.; Hajj, G.P.; Zimmerman, M.B.; Heistad, D.D. Osteoprotegerin inhibits aortic valve calcification and preserves valve function in hypercholesterolemic mice. PLoS ONE 2013, 8, e65201. [Google Scholar] [CrossRef]
- Morena, M.; Dupuy, A.M.; Jaussent, I.; Vernhet, H.; Gahide, G.; Klouche, K.; Bargnoux, A.S.; Delcourt, C.; Canaud, B.; Cristol, J.P. A cut-off value of plasma osteoprotegerin level may predict the presence of coronary artery calcifications in chronic kidney disease patients. Nephrol. Dial. Transplant. 2009, 24, 3389–3397. [Google Scholar] [CrossRef][Green Version]
- Mikami, S.; Hamano, T.; Fujii, N.; Nagasawa, Y.; Isaka, Y.; Moriyama, T.; Matsuhisa, M.; Ito, T.; Imai, E.; Hori, M. Serum osteoprotegerin as a screening tool for coronary artery calcification score in diabetic pre-dialysis patients. Hypertens. Res. 2008, 31, 1163–1170. [Google Scholar] [CrossRef]
- Marques, G.L.; Hayashi, S.; Bjallmark, A.; Larsson, M.; Riella, M.; Olandoski, M.; Lindholm, B.; Nascimento, M.M. Osteoprotegerin is a marker of cardiovascular mortality in patients with chronic kidney disease stages 3-5. Sci. Rep. 2021, 11, 2473. [Google Scholar] [CrossRef]
- Huang, Q.X.; Li, J.B.; Huang, N.; Huang, X.W.; Li, Y.L.; Huang, F.X. Elevated Osteoprotegerin Concentration Predicts Increased Risk of Cardiovascular Mortality in Patients with Chronic Kidney Disease: A Systematic Review and Meta-Analysis. Kidney Blood Press. Res. 2020, 45, 565–575. [Google Scholar] [CrossRef]
- Kamińska, J.; Stopiński, M.; Mucha, K.; Pac, M.; Gołębiowski, M.; Niewczas, M.A.; Pączek, L.; Foroncewicz, B. Circulating Osteoprotegerin in Chronic Kidney Disease and All-Cause Mortality. Int. J. Gen. Med. 2021, 14, 2413–2420. [Google Scholar] [CrossRef]
- Huang, Q.X.; Li, J.B.; Huang, X.W.; Jiang, L.P.; Huang, L.; An, H.W.; Yang, W.Q.; Pang, J.; Li, Y.L.; Huang, F.X. Circulating Osteoprotegerin Levels Independently Predict All-cause Mortality in Patients with Chronic Kidney Disease: A Meta-analysis. Int. J. Med. Sci. 2019, 16, 1328–1337. [Google Scholar] [CrossRef]
- Lin, W.C.; Tsai, J.P.; Lai, Y.H.; Lin, Y.L.; Kuo, C.H.; Wang, C.H.; Hsu, B.G. Serum osteoprotegerin level is positively associated with peripheral artery disease in patients with peritoneal dialysis. Ren. Fail. 2020, 42, 131–136. [Google Scholar] [CrossRef]
- Hou, J.S.; Lin, Y.L.; Wang, C.H.; Lai, Y.H.; Kuo, C.H.; Subeq, Y.M.; Hsu, B.G. Serum osteoprotegerin is an independent marker of central arterial stiffness as assessed using carotid-femoral pulse wave velocity in hemodialysis patients: A cross sectional study. BMC Nephrol. 2019, 20, 184. [Google Scholar] [CrossRef]
- Csiky, B.; Sági, B.; Peti, A.; Lakatos, O.; Prémusz, V.; Sulyok, E. The Impact of Osteocalcin, Osteoprotegerin and Osteopontin on Arterial Stiffness in Chronic Renal Failure Patients on Hemodialysis. Kidney Blood Press. Res. 2017, 42, 1312–1321. [Google Scholar] [CrossRef]
- Avila, M.; Mora, C.; Prado, M.D.C.; Zavala, M.; Paniagua, R. Osteoprotegerin Is the Strongest Predictor for Progression of Arterial Calcification in Peritoneal Dialysis Patients. Am. J. Nephrol. 2017, 46, 39–46. [Google Scholar] [CrossRef]
- Bargnoux, A.S.; Dupuy, A.M.; Garrigue, V.; Deleuze, S.; Cristol, J.P.; Mourad, G. Renal transplantation decreases osteoprotegerin levels. Transplant. Proc. 2006, 38, 2317–2318. [Google Scholar] [CrossRef]
- Hjelmesaeth, J.; Ueland, T.; Flyvbjerg, A.; Bollerslev, J.; Leivestad, T.; Jenssen, T.; Hansen, T.K.; Thiel, S.; Sagedal, S.; Røislien, J.; et al. Early posttransplant serum osteoprotegerin levels predict long-term (8-year) patient survival and cardiovascular death in renal transplant patients. J. Am. Soc. Nephrol. 2006, 17, 1746–1754. [Google Scholar] [CrossRef]
- Oh, K.H.; Park, S.K.; Park, H.C.; Chin, H.J.; Chae, D.W.; Choi, K.H.; Han, S.H.; Yoo, T.H.; Lee, K.; Kim, Y.S.; et al. KNOW-CKD (KoreaN cohort study for Outcome in patients With Chronic Kidney Disease): Design and methods. BMC Nephrol. 2014, 15, 80. [Google Scholar] [CrossRef]
- Levey, A.S.; Stevens, L.A.; Schmid, C.H.; Zhang, Y.L.; Castro, A.F., 3rd; Feldman, H.I.; Kusek, J.W.; Eggers, P.; Van Lente, F.; Greene, T.; et al. A new equation to estimate glomerular filtration rate. Ann. Intern. Med. 2009, 150, 604–612. [Google Scholar] [CrossRef] [PubMed]
- Kim, C.S.; Bae, E.H.; Ma, S.K.; Han, S.H.; Choi, K.H.; Lee, J.; Chae, D.W.; Oh, K.H.; Ahn, C.; Kim, S.W.; et al. Association of Serum Osteoprotegerin Levels with Bone Loss in Chronic Kidney Disease: Insights from the KNOW-CKD Study. PLoS ONE 2016, 11, e0166792. [Google Scholar] [CrossRef] [PubMed]
- Rymarz, A.; Romejko, K.; Matyjek, A.; Bartoszewicz, Z.; Niemczyk, S. Serum Osteoprotegerin Is an Independent Marker of Metabolic Complications in Non-DialysisDependent Chronic Kidney Disease Patients. Nutrients 2021, 13, 3609. [Google Scholar] [CrossRef] [PubMed]
- Del Toro, R.; Cavallari, I.; Tramontana, F.; Park, K.; Strollo, R.; Valente, L.; De Pascalis, M.; Grigioni, F.; Pozzilli, P.; Buzzetti, R.; et al. Association of bone biomarkers with advanced atherosclerotic disease in people with overweight/obesity. Endocrine 2021, 73, 339–346. [Google Scholar] [CrossRef]
- Alves-Lopes, R.; Neves, K.B.; Strembitska, A.; Harvey, A.P.; Harvey, K.Y.; Yusuf, H.; Haniford, S.; Hepburn, R.T.; Dyet, J.; Beattie, W.; et al. Osteoprotegerin regulates vascular function through syndecan-1 and NADPH oxidase-derived reactive oxygen species. Clin. Sci. 2021, 135, 2429–2444. [Google Scholar] [CrossRef]
- Bucay, N.; Sarosi, I.; Dunstan, C.R.; Morony, S.; Tarpley, J.; Capparelli, C.; Scully, S.; Tan, H.L.; Xu, W.; Lacey, D.L.; et al. osteoprotegerin-deficient mice develop early onset osteoporosis and arterial calcification. Genes Dev. 1998, 12, 1260–1268. [Google Scholar] [CrossRef]
- Chae, S.Y.; Chung, W.; Kim, Y.H.; Oh, Y.K.; Lee, J.; Choi, K.H.; Ahn, C.; Kim, Y.S. The Correlation of Serum Osteoprotegerin with Non-Traditional Cardiovascular Risk Factors and Arterial Stiffness in Patients with Pre-Dialysis Chronic Kidney Disease: Results from the KNOW-CKD Study. J. Korean. Med. Sci. 2018, 33, e322. [Google Scholar] [CrossRef]
- Sigrist, M.K.; Levin, A.; Er, L.; McIntyre, C.W. Elevated osteoprotegerin is associated with all-cause mortality in CKD stage 4 and 5 patients in addition to vascular calcification. Nephrol. Dial. Transplant. 2009, 24, 3157–3162. [Google Scholar] [CrossRef][Green Version]
- Boardman, H.; Lewandowski, A.J.; Lazdam, M.; Kenworthy, Y.; Whitworth, P.; Zwager, C.L.; Francis, J.M.; Aye, C.Y.; Williamson, W.; Neubauer, S.; et al. Aortic stiffness and blood pressure variability in young people: A multimodality investigation of central and peripheral vasculature. J. Hypertens. 2017, 35, 513–522. [Google Scholar] [CrossRef]
- Hoshide, S. Clinical implication of visit-to-visit blood pressure variability. Hypertens. Res. 2018, 41, 993–999. [Google Scholar] [CrossRef]
- Mena, L.; Pintos, S.; Queipo, N.V.; Aizpúrua, J.A.; Maestre, G.; Sulbarán, T. A reliable index for the prognostic significance of blood pressure variability. J. Hypertens. 2005, 23, 505–511. [Google Scholar] [CrossRef]
- Rothwell, P.M.; Howard, S.C.; Dolan, E.; O’Brien, E.; Dobson, J.E.; Dahlöf, B.; Sever, P.S.; Poulter, N.R. Prognostic significance of visit-to-visit variability, maximum systolic blood pressure, and episodic hypertension. Lancet 2010, 375, 895–905. [Google Scholar] [CrossRef]


Publisher’s Note: MDPI stays neutral with regard to jurisdictional claims in published maps and institutional affiliations. |
© 2021 by the authors. Licensee MDPI, Basel, Switzerland. This article is an open access article distributed under the terms and conditions of the Creative Commons Attribution (CC BY) license (https://creativecommons.org/licenses/by/4.0/).