
Association between Enzyme-Linked Immunosorbent Assay-Measured Kidney Injury Markers and Urinary Cadmium Levels in Chronic Kidney Disease

 ,
,  ,
,  , , and
Abstract
1. Introduction
2. Materials and Methods
2.1. Patients
2.2. Demographic Profiles and Clinical Characteristics Collection
2.3. Measurement of Blood Biochemical Profiles and Urinary Renal Biomarkers
2.4. Inductively Coupled Plasma Mass Spectrometry (ICP-MS) for Urinary Cadmium
2.5. Statistical Analysis
3. Results
3.1. Demographic, Clinical, and Biochemical Characteristics of Enrolled Patients
3.2. Differences in Demographic, Clinical, and Biochemical Characteristics between Subclasses
3.3. Differences in Urinary Renal Biomarkers between Subclasses
3.4. Factors and Renal Biomarkers Independently Associated with High UCd in CKD Patients
4. Discussion
5. Conclusions
Author Contributions
Funding
Institutional Review Board Statement
Informed Consent Statement
Data Availability Statement
Acknowledgments
Conflicts of Interest
References
- Genchi, G.; Sinicropi, M.S.; Lauria, G.; Carocci, A.; Catalano, A. The Effects of Cadmium Toxicity. Int. J. Environ. Res. Public Health 2020, 17, 3782. [Google Scholar] [CrossRef]
- Taha, M.M.; Mahdy-Abdallah, H.; Shahy, E.M.; Ibrahim, K.S.; Elserougy, S. Impact of occupational cadmium exposure on bone in sewage workers. Int. J. Occup. Environ. Health 2018, 24, 101–108. [Google Scholar] [CrossRef]
- Ginsberg, G.L. Cadmium Risk Assessment in Relation to Background Risk of Chronic Kidney Disease. J. Toxicol. Environ. Health Part A 2012, 75, 374–390. [Google Scholar] [CrossRef]
- Oh, C.-M.; Oh, I.-H.; Lee, J.-K.; Park, Y.H.; Choe, B.K.; Yoon, T.-Y.; Choi, J.-M. Blood cadmium levels are associated with a decline in lung function in males. Environ. Res. 2014, 132, 119–125. [Google Scholar] [CrossRef]
- Zhou, Z.; Lu, Y.-H.; Pi, H.-F.; Gao, P.; Li, M.; Zhang, L.; Pei, L.-P.; Mei, X.; Liu, L.; Zhao, Q.; et al. Cadmium Exposure is Associated with the Prevalence of Dyslipidemia. Cell. Physiol. Biochem. 2016, 40, 633–643. [Google Scholar] [CrossRef]
- Vallée, A.; Gabet, A.; Grave, C.; Blacher, J.; Olié, V. Associations between urinary cadmium levels, blood pressure, and hypertension: The ESTEBAN survey. Environ. Sci. Pollut. Res. 2020, 27, 10748–10756. [Google Scholar] [CrossRef]
- Kumar, S.; Sharma, A. Cadmium toxicity: Effects on human reproduction and fertility. Rev. Environ. Health 2019, 34, 327–338. [Google Scholar] [CrossRef]
- Chen, H.-L.; Fang, J.; Chang, C.-J.; Wu, T.-F.; Wang, I.-K.; Fu, J.-F.; Huang, Y.-C.; Yen, J.-S.; Weng, C.-H.; Yen, T.-H. Environmental Cadmium Exposure and Dental Indices in Orthodontic Patients. Health 2021, 9, 413. [Google Scholar] [CrossRef]
- Dix-Cooper, L.; Kosatsky, T. Blood mercury, lead and cadmium levels and determinants of exposure among newcomer South and East Asian women of reproductive age living in Vancouver, Canada. Sci. Total Environ. 2017, 619–620, 1409–1419. [Google Scholar] [CrossRef]
- Liu, T.-Y.; Hung, Y.-M.; Huang, W.-C.; Wu, M.-L.; Lin, S.-L. Do people from Taiwan have higher heavy metal levels than those from Western countries? Singap. Med. J. 2017, 58, 267–271. [Google Scholar] [CrossRef]
- Kim, N.H.; Hyun, Y.Y.; Lee, K.-B.; Chang, Y.; Rhu, S.; Oh, K.-H.; Ahn, C. Environmental Heavy Metal Exposure and Chronic Kidney Disease in the General Population. J. Korean Med. Sci. 2015, 30, 272–277. [Google Scholar] [CrossRef]
- Navas-Acien, A.; Tellez-Plaza, M.; Guallar, E.; Muntner, P.; Silbergeld, E.; Jaar, B.; Weaver, V. Blood Cadmium and Lead and Chronic Kidney Disease in US Adults: A Joint Analysis. Am. J. Epidemiol. 2009, 170, 1156–1164. [Google Scholar] [CrossRef] [PubMed]
- Satarug, S.; Gobe, G.C.; Vesey, D.A.; Phelps, K.R. Cadmium and Lead Exposure, Nephrotoxicity, and Mortality. Toxics 2020, 8, 86. [Google Scholar] [CrossRef] [PubMed]
- Järup, L.; Åkesson, A. Current status of cadmium as an environmental health problem. Toxicol. Appl. Pharmacol. 2009, 238, 201–208. [Google Scholar] [CrossRef]
- Vacchi-Suzzi, C.; Kruse, D.; Harrington, J.; Levine, K.; Meliker, J.R. Is Urinary Cadmium a Biomarker of Long-term Exposure in Humans? A Review. Curr. Environ. Health Rep. 2016, 3, 450–458. [Google Scholar] [CrossRef]
- Tsai, H.-J.; Hung, C.-H.; Wang, C.-W.; Tu, H.-P.; Li, C.-H.; Tsai, C.-C.; Lin, W.-Y.; Chen, S.-C.; Kuo, C.-H. Associations among Heavy Metals and Proteinuria and Chronic Kidney Disease. Diagnostics 2021, 11, 282. [Google Scholar] [CrossRef]
- Wu, C.-Y.; Wong, C.-S.; Chung, C.-J.; Wu, M.-Y.; Huang, Y.-L.; Ao, P.-L.; Lin, Y.-F.; Lin, Y.-C.; Shiue, H.-S.; Su, C.-T.; et al. The association between plasma selenium and chronic kidney disease related to lead, cadmium and arsenic exposure in a Taiwanese population. J. Hazard. Mater. 2019, 375, 224–232. [Google Scholar] [CrossRef]
- Tsai, K.-F.; Hsu, P.-C.; Kung, C.-T.; Lee, C.-T.; You, H.-L.; Huang, W.-T.; Li, S.-H.; Cheng, F.-J.; Wang, C.-C.; Lee, W.-C. The Risk Factors of Blood Cadmium Elevation in Chronic Kidney Disease. Int. J. Environ. Res. Public Health 2021, 18, 12337. [Google Scholar] [CrossRef]
- Tsai, M.-H.; Hsu, C.-Y.; Lin, M.-Y.; Yen, M.-F.; Chen, H.-H.; Chiu, Y.-H.; Hwang, S.-J. Incidence, Prevalence, and Duration of Chronic Kidney Disease in Taiwan: Results from a Community-Based Screening Program of 106,094 Individuals. Nephron 2018, 140, 175–184. [Google Scholar] [CrossRef]
- Taiwan Society of Nephrology. Kidney Disease in Taiwan 2020 Annual Report; Taiwan Society of Nephrology: Taipei City, Taiwan, 2020. [Google Scholar]
- Satarug, S.; Boonprasert, K.; Gobe, G.C.; Ruenweerayut, R.; Johnson, D.W.; Na-Bangchang, K.; Vesey, D. Chronic exposure to cadmium is associated with a marked reduction in glomerular filtration rate. Clin. Kidney J. 2019, 12, 468–475. [Google Scholar] [CrossRef]
- Weaver, V.M.; Kim, N.-S.; Lee, B.-K.; Parsons, P.J.; Spector, J.; Fadrowski, J.; Jaar, B.G.; Steuerwald, A.J.; Todd, A.C.; Simon, D.; et al. Differences in urine cadmium associations with kidney outcomes based on serum creatinine and cystatin C. Environ. Res. 2011, 111, 1236–1242. [Google Scholar] [CrossRef][Green Version]
- Jin, R.; Zhu, X.; Shrubsole, M.J.; Yu, C.; Xia, Z.; Dai, Q. Associations of renal function with urinary excretion of metals: Evidence from NHANES 2003–2012. Environ. Int. 2018, 121, 1355–1362. [Google Scholar] [CrossRef]
- Diamond, G.L.; Thayer, W.C.; Klotzbach, J.M.; Ingerman, L.D. Urinary cadmium clearance, its relationship to glomerular filtration rate and implications for cadmium epidemiology. J. Toxicol. Environ. Health Part A 2019, 82, 1187–1198. [Google Scholar] [CrossRef]
- Rysz, J.; Gluba-Brzózka, A.; Franczyk, B.; Jabłonowski, Z.; Ciałkowska-Rysz, A. Novel Biomarkers in the Diagnosis of Chronic Kidney Disease and the Prediction of Its Outcome. Int. J. Mol. Sci. 2017, 18, 1702. [Google Scholar] [CrossRef]
- Wasung, M.E.; Chawla, L.; Madero, M. Biomarkers of renal function, which and when? Clin. Chim. Acta 2015, 438, 350–357. [Google Scholar] [CrossRef] [PubMed]
- Tsai, K.-F.; Li, L.-C.; Hsu, C.-N.; Lin, C.-C.; Lin, Y.-H.; Cheng, Y.-F.; Wang, C.-C.; Chen, C.-L. Effects of Conversion from Calcineurin Inhibitors to Sirolimus or Everolimus on Renal Function and Possible Mechanisms in Liver Transplant Recipients. J. Clin. Pharmacol. 2019, 59, 326–334. [Google Scholar] [CrossRef] [PubMed]
- Ju, W.; Nair, V.; Smith, S.; Zhu, L.; Shedden, K.; Song, P.X.K.; Mariani, L.H.; Eichinger, F.H.; Berthier, C.C.; Randolph, A.; et al. Tissue transcriptome-driven identification of epidermal growth factor as a chronic kidney disease biomarker. Sci. Transl. Med. 2015, 7, 316ra193. [Google Scholar] [CrossRef] [PubMed]
- Satarug, S. Dietary Cadmium Intake and Its Effects on Kidneys. Toxics 2018, 6, 15. [Google Scholar] [CrossRef]
- Jin, Y.; Lu, Y.; Li, Y.; Zhao, H.; Wang, X.; Shen, Y.; Kuang, X. Correlation between environmental low-dose cadmium exposure and early kidney damage: A comparative study in an industrial zone vs. a living quarter in Shanghai, China. Environ. Toxicol. Pharmacol. 2020, 79, 103381. [Google Scholar] [CrossRef] [PubMed]
- Xu, P.; Mo, Z.; Wu, L.; Chen, W.; He, S.; Chen, Y.; Xu, D.; Xiang, J.; Chen, Z.; Lou, X.; et al. Elevated cadmium and 8-hydroxy-2’-deoxyguanosine (8-OHdG) levels in residents living near electroplating industries. Environ. Sci. Pollut. Res. 2021, 28, 34427–34435. [Google Scholar] [CrossRef] [PubMed]
- Stevens, P.E.; Levin, A. Kidney Disease: Improving Global Outcomes Chronic Kidney Disease Guideline Development Work Group Members. Evaluation and Management of Chronic Kidney Disease: Synopsis of the Kidney Disease: Improving Global Outcomes 2012 Clinical Practice Guideline. Ann. Intern. Med. 2013, 158, 825–830. [Google Scholar] [CrossRef]
- Levey, A.S.; Bosch, J.P.; Lewis, J.B.; Greene, T.; Rogers, N.; Roth, D. A More Accurate Method To Estimate Glomerular Filtration Rate from Serum Creatinine: A New Prediction Equation. Ann. Intern. Med. 1999, 130, 461–470. [Google Scholar] [CrossRef]
- Obeng-Gyasi, E. Chronic cadmium exposure and cardiovascular disease in adults. J. Environ. Sci. Health Part A 2020, 55, 726–729. [Google Scholar] [CrossRef]
- Satarug, S.; Vesey, D.; Gobe, G.C. Health Risk Assessment of Dietary Cadmium Intake: Do Current Guidelines Indicate How Much is Safe? Environ. Health Perspect. 2017, 125, 284–288. [Google Scholar] [CrossRef]
- Weaver, V.M.; Kim, N.-S.; Jaar, B.; Schwartz, B.S.; Parsons, P.; Steuerwald, A.J.; Todd, A.C.; Simon, D.; Lee, B.-K. Associations of low-level urine cadmium with kidney function in lead workers. Occup. Environ. Med. 2010, 68, 250–256. [Google Scholar] [CrossRef]
- Tanase, D.M.; Gosav, E.M.; Radu, S.; Costea, C.F.; Ciocoiu, M.; Carauleanu, A.; Lacatusu, C.M.; Maranduca, M.A.; Floria, M.; Rezus, C. The Predictive Role of the Biomarker Kidney Molecule-1 (KIM-1) in Acute Kidney Injury (AKI) Cisplatin-Induced Nephrotoxicity. Int. J. Mol. Sci. 2019, 20, 5238. [Google Scholar] [CrossRef] [PubMed]
- Prozialeck, W.C.; Vaidya, V.S.; Liu, J.; Waalkes, M.P.; Edwards, J.R.; Lamar, P.C.; Bernard, A.M.; Dumont, X.; Bonventre, J.V. Kidney injury molecule-1 is an early biomarker of cadmium nephrotoxicity. Kidney Int. 2007, 72, 985–993. [Google Scholar] [CrossRef] [PubMed]
- Prozialeck, W.C.; Edwards, J.R.; Vaidya, V.S.; Bonventre, J.V. Preclinical evaluation of novel urinary biomarkers of cadmium nephrotoxicity. Toxicol. Appl. Pharmacol. 2009, 238, 301–305. [Google Scholar] [CrossRef]
- Prozialeck, W.C.; Edwards, J.R.; Lamar, P.C.; Liu, J.; Vaidya, V.S.; Bonventre, J.V. Expression of kidney injury molecule-1 (Kim-1) in relation to necrosis and apoptosis during the early stages of Cd-induced proximal tubule injury. Toxicol. Appl. Pharmacol. 2009, 238, 306–314. [Google Scholar] [CrossRef]
- Ruangyuttikarn, W.; Panyamoon, A.; Nambunmee, K.; Honda, R.; Swaddiwudhipong, W.; Nishijo, M. Use of the kidney injury molecule-1 as a biomarker for early detection of renal tubular dysfunction in a population chronically exposed to cadmium in the environment. SpringerPlus 2013, 2, 533. [Google Scholar] [CrossRef] [PubMed]
- Pennemans, V.; De Winter, L.M.; Munters, E.; Nawrot, T.S.; Van Kerkhove, E.; Rigo, J.-M.; Reynders, C.; Dewitte, H.; Carleer, R.; Penders, J.; et al. The association between urinary kidney injury molecule 1 and urinary cadmium in elderly during long-term, low-dose cadmium exposure: A pilot study. Environ. Health 2011, 10, 77. [Google Scholar] [CrossRef]
- Valcke, M.; Ouellet, N.; Dubé, M.; Sidi, E.A.L.; LeBlanc, A.; Normandin, L.; Balion, C.; Ayotte, P. Biomarkers of cadmium, lead and mercury exposure in relation with early biomarkers of renal dysfunction and diabetes: Results from a pilot study among aging Canadians. Toxicol. Lett. 2019, 312, 148–156. [Google Scholar] [CrossRef] [PubMed]
- Aoshima, K. Epidemiology of renal tubular dysfunction in the inhabitants of a cadmium-polluted area in the Jinzu River basin in Toyama prefecture. Tohoku J. Exp. Med. 1987, 152, 151–172. [Google Scholar] [CrossRef] [PubMed]
- Huynh, Q.T.; Pham, N.M.; Pham, D.T.; Hoang, M.T.; Dam, L.P.T.; Ho, H.T.; Phan, V.A.; Can, L.T.; Ngo, T.T.M.; Dang, D.Q.; et al. Evaluation of Urinary Neutrophil Gelatinase Associated Lipocalin and Kidney Injury Molecule-1 as Diagnostic Markers for Early Nephropathy in Patients with Type 2 Diabetes Mellitus. Diabetes Metab. Syndr. Obes. Targets Ther. 2020, 13, 2199–2207. [Google Scholar] [CrossRef]
- Singh, M.; Tong, Y.; Webster, K.; Cesewski, E.; Haring, A.P.; Laheri, S.; Carswell, B.; O’Brien, T.J.; Aardema, C.H.; Senger, R.S.; et al. 3D printed conformal microfluidics for isolation and profiling of biomarkers from whole organs. Lab A Chip 2017, 17, 2561–2571. [Google Scholar] [CrossRef] [PubMed]
- Lee, W.-C.; Ng, H.-Y.; Hou, C.-Y.; Lee, C.-T.; Fu, L.-M. Recent advances in lab-on-paper diagnostic devices using blood samples. Lab A Chip 2021, 21, 1433–1453. [Google Scholar] [CrossRef] [PubMed]
- Graille, M.; Wild, P.; Sauvain, J.-J.; Hemmendinger, M.; Canu, I.G.; Hopf, N.B. Urinary 8-OHdG as a Biomarker for Oxidative Stress: A Systematic Literature Review and Meta-Analysis. Int. J. Mol. Sci. 2020, 21, 3743. [Google Scholar] [CrossRef]
- Wiener, R.C.; Bhandari, R. Association of electronic cigarette use with lead, cadmium, barium, and antimony body burden: NHANES 2015-2016. J. Trace Elem. Med. Biol. 2020, 62, 126602. [Google Scholar] [CrossRef]
- Jain, R.B. Cadmium and kidney function: Concentrations, variabilities, and associations across various stages of glomerular function. Environ. Pollut. 2020, 256, 113361. [Google Scholar] [CrossRef]
- Kim, S.H.; Kim, Y.; Kim, N.-S.; Lee, B.-K. Gender difference in blood cadmium concentration in the general population: Can it be explained by iron deficiency? J. Trace Elem. Med. Biol. 2014, 28, 322–327. [Google Scholar] [CrossRef]
- Nordberg, G.F. Historical perspectives on cadmium toxicology. Toxicol. Appl. Pharmacol. 2009, 238, 192–200. [Google Scholar] [CrossRef] [PubMed]
- Madrigal, J.M.; Ricardo, A.; Persky, V.; Turyk, M. Associations between blood cadmium concentration and kidney function in the U.S. population: Impact of sex, diabetes and hypertension. Environ. Res. 2019, 169, 180–188. [Google Scholar] [CrossRef] [PubMed]


| Total Patients (n = 167) | Low UCd ≤2.71 μmol/g Cr (n = 55) | Middle UCd 2.72–4.62 μmol/g Cr (n = 55) | High UCd ≥4.63 μmol/g Cr (n = 57) | Univariate Analysis p-Value | |
|---|---|---|---|---|---|
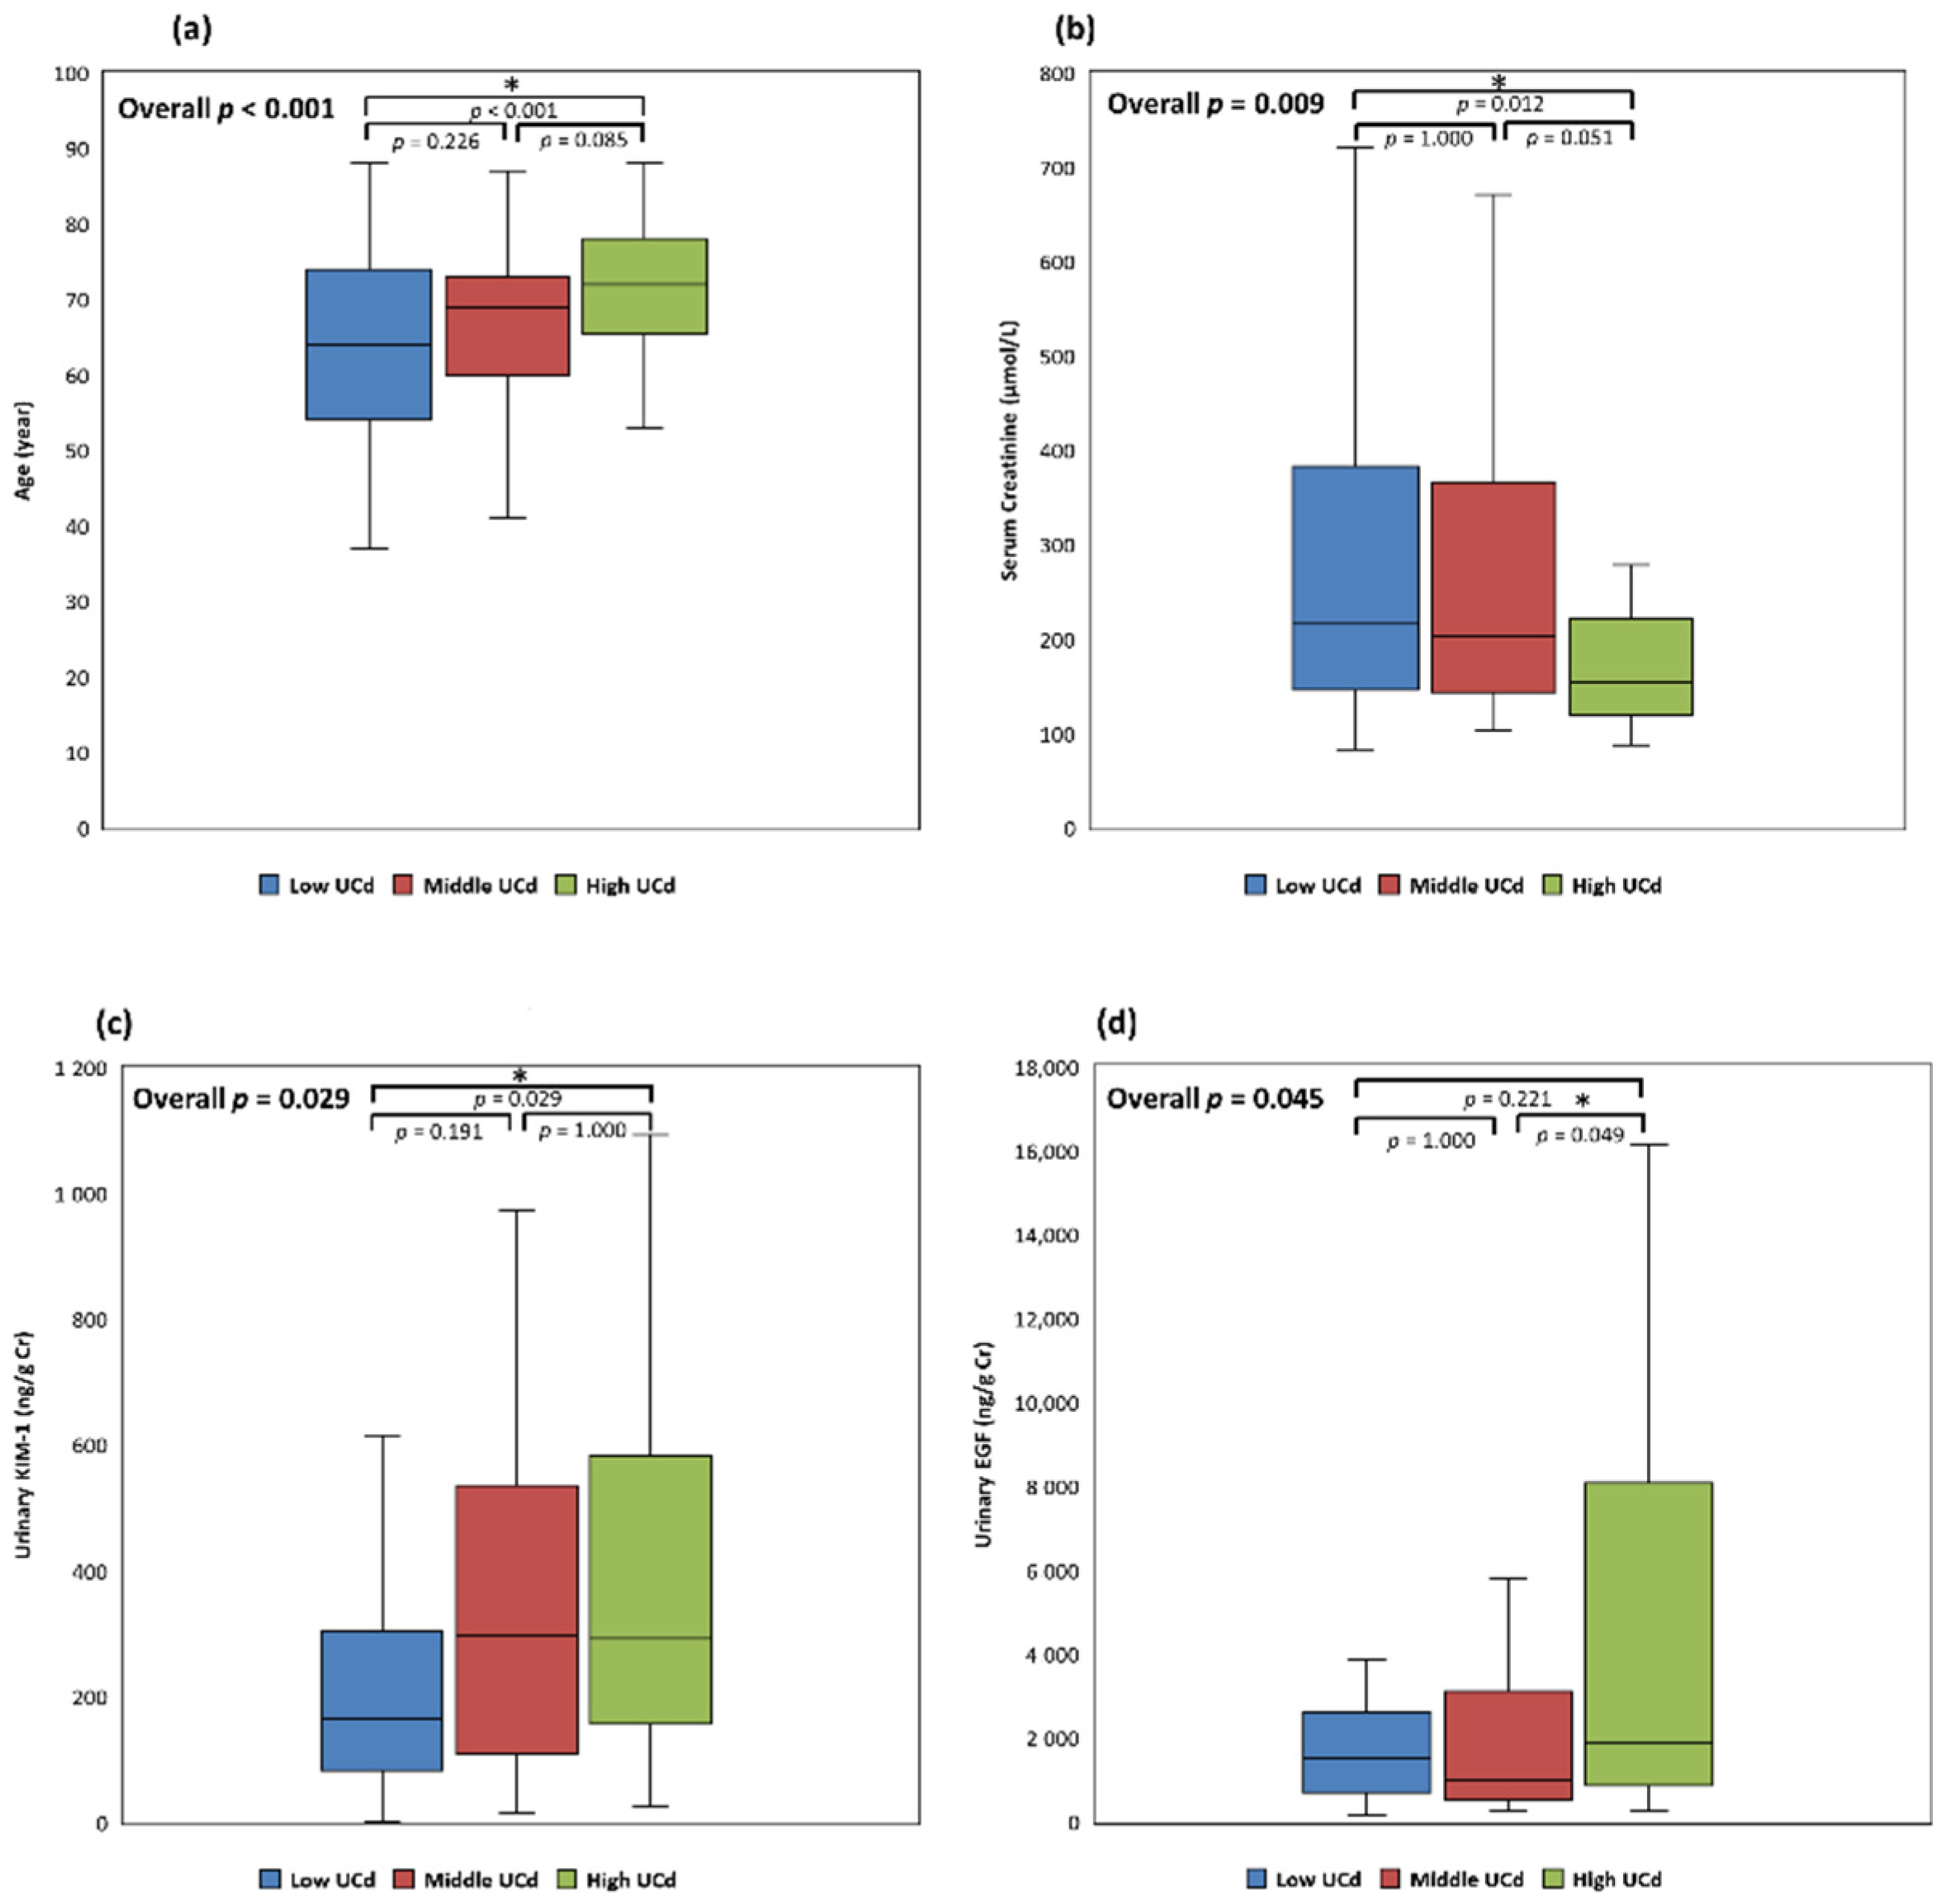
| Age (year), median (IQR) | 69 (60–76) | 64 (54–74) | 69 (60–73) | 72 (66–78) # | <0.001 * |
| BMI (kg/m2), median (IQR) | 25.04 (22.41–27.89) | 24.46 (22.41–27.68) | 25.14 (21.97–28.04) | 25.22 (22.57–27.98) | 0.682 |
| Female, n (%) | 54 (32.34) | 15 (27.27) | 16 (29.09) | 23 (40.35) | 0.275 |
| Urban Residence, n (%) | 132 (79.04) | 46 (83.64) | 40 (72.73) | 46 (80.70) | 0.347 |
| CKD Stage 3a, n (%) | 36 (21.56) | 9 (16.36) | 13 (23.64) | 14 (24.56) | 0.516 |
| CKD Stage 3b, n (%) | 46 (27.54) | 13 (23.64) | 11 (20.00) | 22 (38.60) | 0.065 |
| CKD Stage 4, n (%) | 49 (29.34) | 18 (32.73) | 16 (29.09) | 15 (26.32) | 0.757 |
| CKD Stage 5, n (%) | 36 (21.56) | 15 (27.27) | 15 (27.27) | 6 (10.53) #,$ | 0.044 * |
| Drinking, n (%) | 18 (10.91) | 8 (15.09) | 4 (7.27) | 6 (10.53) | 0.425 |
| Smoking, n (%) | 21 (12.73) | 7 (13.21) | 6 (10.91) | 8 (14.04) | 0.877 |
| Betelnut Usage, n (%) | 13 (7.87) | 5 (9.43) | 4 (7.27) | 4 (7.02) | 0.877 |
| Hypertension, n (%) | 140 (83.83) | 43 (78.18) | 46 (83.64) | 51 (89.47) | 0.268 |
| Diabetes Mellitus, n (%) | 46 (27.54) | 10 (18.18) | 17 (30.90) | 19 (33.33) | 0.158 |
| Dyslipidemia, n (%) | 135 (80.84) | 43 (78.18) | 43 (78.18) | 49 (85.96) | 0.480 |
| Vascular Disease, n (%) | 36 (21.56) | 9 (16.36) | 11 (20.00) | 16 (28.07) | 0.303 |
| Heart Failure, n (%) | 17 (10.18) | 3 (5.45) | 7 (12.72) | 7 (12.28) | 0.366 |
| COPD, n (%) | 15 (8.98) | 4 (7.27) | 6 (10.91) | 5 (8.77) | 0.799 |
| Gout or Hyperuricemia, n (%) | 90 (53.89) | 29 (52.73) | 31 (56.36) | 30 (52.63) | 0.904 |
| Kidney Transplant, n (%) | 2 (1.20) | 0 (0.00) | 1 (1.82) | 1 (1.75) | 0.608 |
| Extrarenal Transplant, n (%) | 2 (1.20) | 1 (1.82) | 0 (0.00) | 1 (1.75) | 0.608 |
| Previous Malignancy, n (%) | 22 (13.17) | 7 (12.73) | 5 (9.09) | 10 (17.54) | 0.414 |
| Lipid-Lowering Agent, n (%) | 86 (51.50) | 26 (47.27) | 30 (54.55) | 30 (52.63) | 0.731 |
| Glucose-Lowering Agent, n (%) | 31 (18.56) | 6 (10.91) | 13 (23.64) | 12 (21.05) | 0.192 |
| Antihypertensives ≥ 3 types, n (%) | 68 (40.72) | 27 (49.09) | 19 (34.55) | 22 (38.60) | 0.276 |
| Total Patients (n = 167) | Low UCd ≤2.71 μmol/g Cr (n = 55) | Middle UCd 2.72–4.62 μmol/g Cr (n = 55) | High UCd ≥4.63 μmol/g Cr (n = 57) | Univariate Analysis p-Value | |
|---|---|---|---|---|---|
| Biochemical Profiles, Median (IQR) | |||||
| Serum Creatinine (μmol/L) | 177.68 (129.95–288.18) | 215.70 (145.86–382.77) | 202.44 (143.21–365.98) | 153.82 (120.22–221.88) # | 0.009 * |
| eGFR (mL/min/1.73 m2) | 28.80 (16.20–42.00) | 25.80 (13.20–39.00) | 28.20 (13.20–42.00) | 37.20 (24.00–43.80) | 0.076 |
| Hemoglobin (g/L) | 120.00 (105.00–131.00) | 120.00 (106.00–131.00) | 120.00 (105.80–135.00) | 114.00 (101.00–130.00) | 0.626 |
| Glycated Hemoglobin (%) | 5.90 (5.50–6.30) | 5.65 (5.40–6.10) | 5.90 (5.55–6.45) | 5.90 (5.70–6.33) | 0.235 |
| Total Cholesterol (mmol/L) | 4.27 (3.76–4.89) | 4.22 (3.78–5.05) | 4.35 (3.72–4.88) | 4.11 (3.53–4.70) | 0.474 |
| LDL-C (mmol/L) | 2.39 (1.90–2.82) | 2.40 (2.02–2.92) | 2.42 (1.90–2.83) | 2.28 (1.74–2.80) | 0.634 |
| HDL-C (mmol/L) | 1.22 (1.01–1.53) | 1.24 (1.04–1.53) | 1.22 (1.01–1.57) | 1.18 (1.01–1.50) | 0.788 |
| Triglyceride (mmol/L) | 1.38 (0.94–1.85) | 1.33 (0.77–1.77) | 1.54 (0.98–1.98) | 1.34 (1.00–1.84) | 0.449 |
| ALT (μkat/L) | 0.28 (0.20–0.42) | 0.31 (0.20–0.47) | 0.28 (0.21–0.34) | 0.28 (0.20–0.42) | 0.728 |
| Albumin (g/L) | 43.60 (41.30–45.80) | 44.00 (40.80–45.80) | 43.70 (42.30–46.00) | 42.60 (41.10–45.50) | 0.295 |
| Uric Acid (mmol/L) | 0.37 (0.31–0.43) | 0.37 (0.30–0.43) | 0.36 (0.31–0.43) | 0.37 (0.30–0.43) | 0.987 |
| Ca (mmol/L) | 2.30 (2.24–2.38) | 2.30 (2.20–2.38) | 2.30 (2.24–2.40) | 2.33 (2.25–2.40) | 0.548 |
| P (mmol/L) | 1.20 (1.08–1.36) | 1.23 (1.07–1.42) | 1.23 (1.08–1.36) | 1.16 (1.08–1.32) | 0.464 |
| K (mmol/L) | 4.50 (4.10–4.80) | 4.50 (4.10–4.80) | 4.50 (4.10–4.73) | 4.40 (4.15–4.80) | 0.939 |
| Urinary Renal Biomarkers, Median (IQR) | |||||
| UPCR (mg/mmol Cr) | 59.21 (15.06–128.14) | 82.33 (29.97–161.92) | 38.97 (12.15–176.32) | 44.76 (10.88–109.80) | 0.124 |
| KIM-1 (ng/g Cr) | 253.29 (117.52–506.29) | 165.75 (82.18–304.43) | 295.87 (108.03–535.65) | 292.42 (156.82–583.42) # | 0.029 * |
| 8-OHdG (μg/g Cr) | 93.93 (51.36–205.27) | 87.35 (54.84–223.24) | 108.51 (58.81–177.04) | 80.39 (47.12–220.06) | 0.921 |
| EGF (ng/g Cr) | 1447.83 (700.08–3681.40) | 1511.25 (701.96–2604.99) | 981.26 (535.40–3114.03) | 1902.74 (868.00–8079.27) $ | 0.045 * |
| Middle UCd vs. Low UCd | High UCd vs. Low UCd | |||
|---|---|---|---|---|
| Odds Ratio (95% CI) | p-Value | Odds Ratio (95% CI) | p-Value | |
| Age (year) | 1.0229 (0.9862–1.0610) | 0.224 | 1.0534 (1.0091–1.0997) | 0.018 * |
| SCr (μmol/L) | 1.0004 (0.9973–1.0036) | 0.796 | 1.0005 (0.9972–1.0039) | 0.751 |
| KIM-1 (ng/g Cr) | 1.0010 (0.9994–1.0025) | 0.221 | 1.0016 (1.0001–1.0032) | 0.043 * |
| EGF (ng/g Cr) | 1.0000 (0.9999–1.0001) | 0.653 | 1.0000 (1.0000–1.0001) | 0.262 |
| Diabetes | 1.8685 (0.6577–5.3080) | 0.241 | 2.2529 (0.7447–6.8151) | 0.150 |
| Smoking | 1.2985 (0.2712–6.2168) | 0.744 | 0.8577 (0.1484–4.9573) | 0.864 |
| CKD Stage 3a | Reference | Reference | ||
| Stage 3b | 0.6638 (0.1678–2.6268) | 0.559 | 1.2347 (0.2973–5.1276) | 0.772 |
| Stage 4 | 0.5730 (0.1395–2.3543) | 0.440 | 0.5822 (0.1255–2.7015) | 0.492 |
| Stage 5 | 0.4929 (0.0784–3.1010) | 0.451 | 0.2050 (0.0250–1.6808) | 0.140 |
Publisher’s Note: MDPI stays neutral with regard to jurisdictional claims in published maps and institutional affiliations. |
© 2021 by the authors. Licensee MDPI, Basel, Switzerland. This article is an open access article distributed under the terms and conditions of the Creative Commons Attribution (CC BY) license (https://creativecommons.org/licenses/by/4.0/).
Share and Cite
Tsai, K.-F.; Hsu, P.-C.; Lee, C.-T.; Kung, C.-T.; Chang, Y.-C.; Fu, L.-M.; Ou, Y.-C.; Lan, K.-C.; Yen, T.-H.; Lee, W.-C. Association between Enzyme-Linked Immunosorbent Assay-Measured Kidney Injury Markers and Urinary Cadmium Levels in Chronic Kidney Disease. J. Clin. Med. 2022, 11, 156. https://doi.org/10.3390/jcm11010156
Tsai K-F, Hsu P-C, Lee C-T, Kung C-T, Chang Y-C, Fu L-M, Ou Y-C, Lan K-C, Yen T-H, Lee W-C. Association between Enzyme-Linked Immunosorbent Assay-Measured Kidney Injury Markers and Urinary Cadmium Levels in Chronic Kidney Disease. Journal of Clinical Medicine. 2022; 11(1):156. https://doi.org/10.3390/jcm11010156
Chicago/Turabian StyleTsai, Kai-Fan, Pai-Chin Hsu, Chien-Te Lee, Chia-Te Kung, Yi-Chin Chang, Lung-Ming Fu, Yu-Che Ou, Kuo-Chung Lan, Tzung-Hai Yen, and Wen-Chin Lee. 2022. "Association between Enzyme-Linked Immunosorbent Assay-Measured Kidney Injury Markers and Urinary Cadmium Levels in Chronic Kidney Disease" Journal of Clinical Medicine 11, no. 1: 156. https://doi.org/10.3390/jcm11010156
APA StyleTsai, K.-F., Hsu, P.-C., Lee, C.-T., Kung, C.-T., Chang, Y.-C., Fu, L.-M., Ou, Y.-C., Lan, K.-C., Yen, T.-H., & Lee, W.-C. (2022). Association between Enzyme-Linked Immunosorbent Assay-Measured Kidney Injury Markers and Urinary Cadmium Levels in Chronic Kidney Disease. Journal of Clinical Medicine, 11(1), 156. https://doi.org/10.3390/jcm11010156