
Role of Baseline Computed-Tomography-Evaluated Body Composition in Predicting Outcome and Toxicity from First-Line Therapy in Advanced Gastric Cancer Patients

 , , , , , and
Abstract
1. Introduction
2. Materials and Methods
2.1. Study Population
2.2. Treatment
2.3. Efficacy and Outcome
2.4. Body Composition Parameters Assessment
2.5. Statistical Analysis
3. Results
3.1. Patient Characteristics and Body Composition Parameters Distribution
3.1.1. Skeletal Muscle
3.1.2. Adipose Tissue
3.2. Body Composition Parameters and Outcome
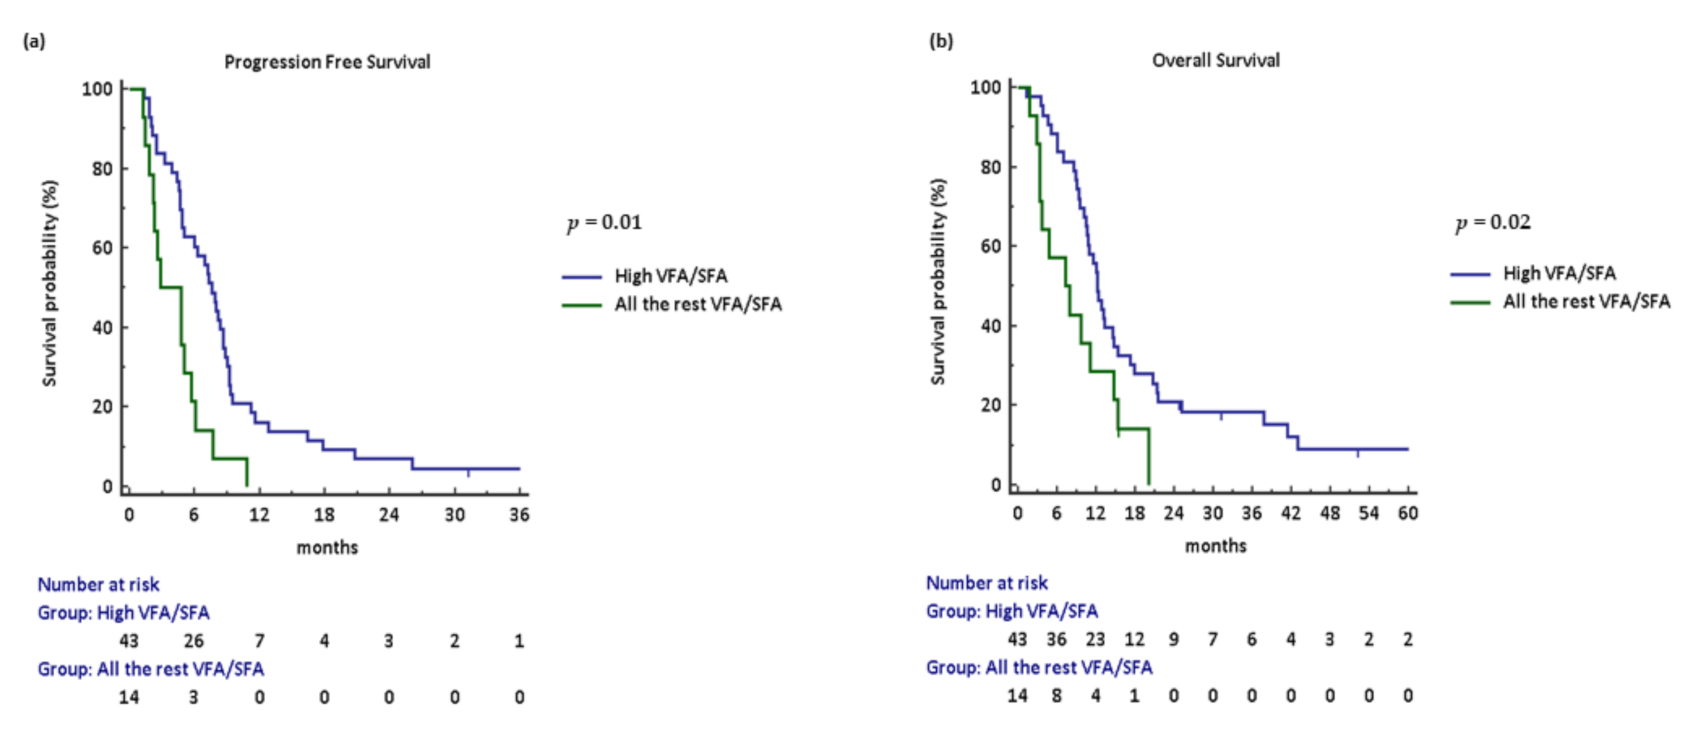
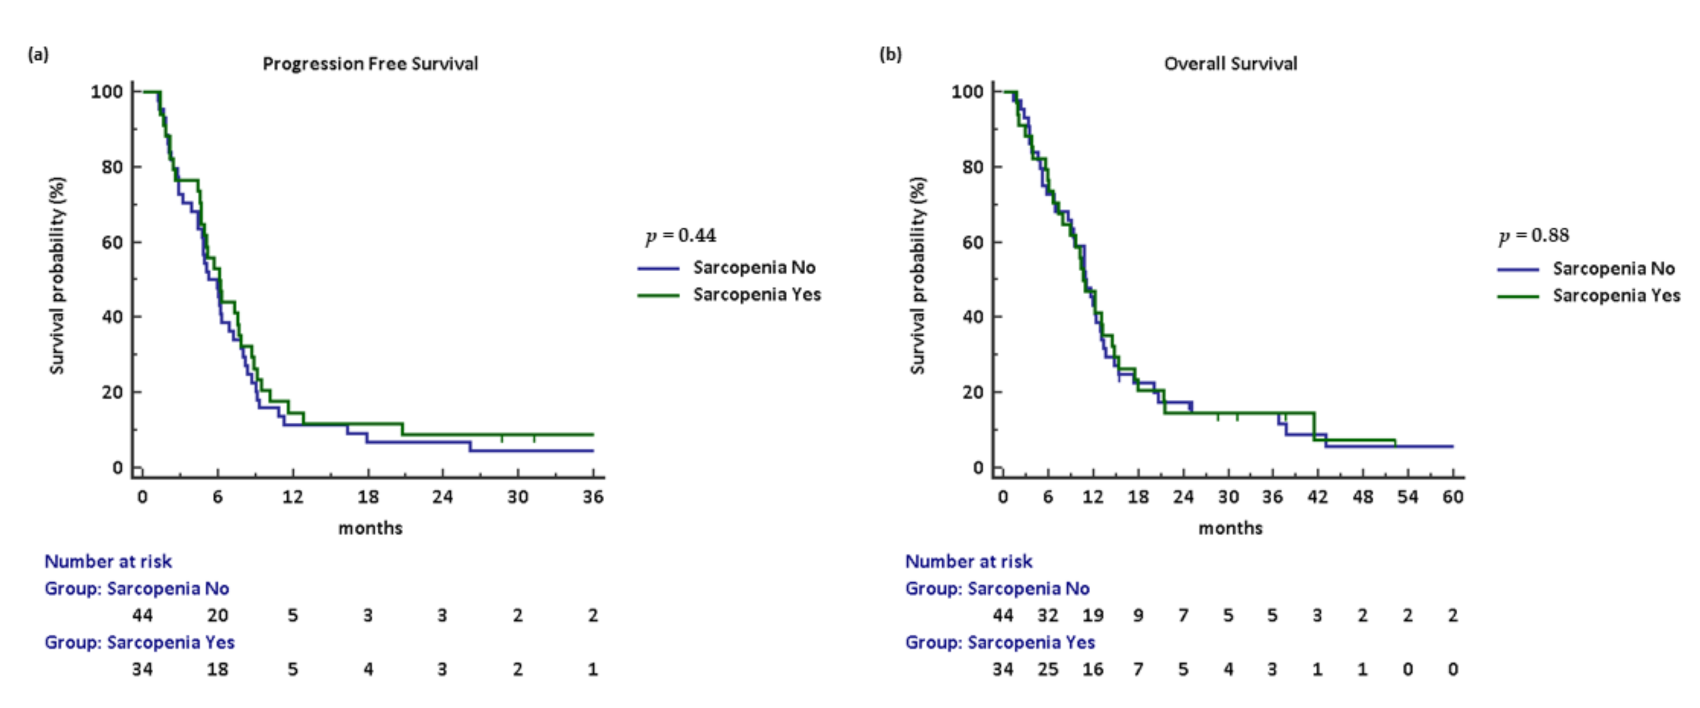
3.2.1. Efficacy
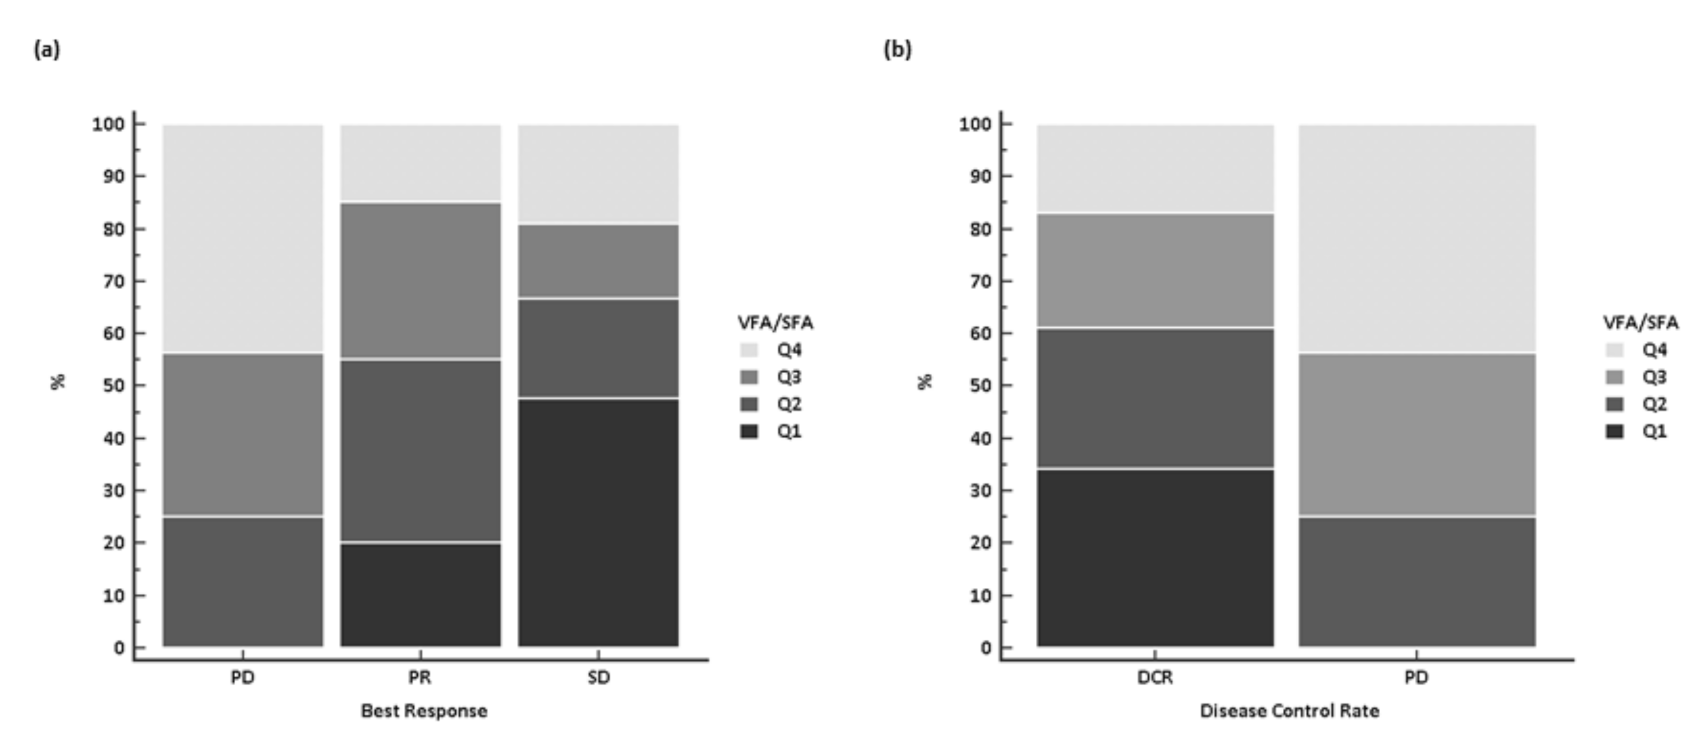
3.2.2. Activity
3.3. Cox Proportional Hazards Model for Survival of Body Composition and Clinical Parameters
3.3.1. Univariate Analysis
3.3.2. Multivariate Analysis
3.4. Body Composition Parameters as Toxicity Predictors
3.4.1. Treatment Exposure
3.4.2. Adverse Events
4. Discussion
5. Conclusions
Author Contributions
Funding
Institutional Review Board Statement
Informed Consent Statement
Data Availability Statement
Conflicts of Interest
Appendix A


| VFA/SFA Quartile | N° | Progression-Free Survival | Overall Survival | ||
|---|---|---|---|---|---|
| HR (95% CI) | p-Value | HR (95% CI) | p-Value | ||
| Q4 (≥1.54) | 14 | 1 (Reference Value) | 0.01 | 1 (Reference Value) | 0.08 |
| Q3 (1.10–1.53) | 14 | 1.89 (0.74–4.84) | – | 1.56 (0.63–3.88) | – |
| Q2 (0.59–1.09) | 15 | 2.85 (1.16–6.97) | – | 2.42 (1.02–5.78) | – |
| Q1 (≤0.58) | 14 | 2.76 (1.14–6.71) | – | 2.16 (0.89–5.21) | – |
References
- Siegel, R.L.; Miller, K.D.; Jemal, A. Cancer statistics, 2020. CA Cancer J. Clin. 2020, 70, 7–30. [Google Scholar] [CrossRef]
- Glimelius, B.; Ekström, K.; Hoffman, K.; Graf, W.; Sjödén, P.-O.; Haglund, U.; Svensson, C.; Enander, L.-K.; Linné, T.; Sellsröm, H.; et al. Randomized comparison between chemotherapy plus best supportive care with best supportive care in advanced gastric cancer. Ann. Oncol. 1997, 8, 163–168. [Google Scholar] [CrossRef]
- Brown, J.C.; Feliciano, E.M.C.; Caan, B.J. The evolution of body composition in oncology-epidemiology, clinical trials, and the future of patient care: Facts and numbers. J. Cachex Sarcopenia Muscle 2018, 9, 1200–1208. [Google Scholar] [CrossRef] [PubMed]
- Mourtzakis, M.; Prado, C.M.M.; Lieffers, J.R.; Reiman, T.; McCargar, L.J.; Baracos, V.E. A practical and precise approach to quantification of body composition in cancer patients using computed tomography images acquired during routine care. Appl. Physiol. Nutr. Metab. 2008, 33, 997–1006. [Google Scholar] [CrossRef]
- Maurovichhorvat, P.; Massaro, J.M.; Fox, C.S.; Moselewski, F.; Odonnell, C.J.; Hoffmann, U. Comparison of anthropometric, area- and volume-based assessment of abdominal subcutaneous and visceral adipose tissue volumes using multi-detector computed tomography. Int. J. Obes. 2006, 31, 500–506. [Google Scholar] [CrossRef]
- Martin, L.; Birdsell, L.; Macdonald, N.; Reiman, T.; Clandinin, M.T.; McCargar, L.J.; Murphy, R.; Ghosh, S.; Sawyer, M.B.; Baracos, V.E. Cancer Cachexia in the Age of Obesity: Skeletal Muscle Depletion Is a Powerful Prognostic Factor, Independent of Body Mass Index. J. Clin. Oncol. 2013, 31, 1539–1547. [Google Scholar] [CrossRef]
- Prado, C.M.; Lieffers, J.R.; McCargar, L.J.; Reiman, T.; Sawyer, M.B.; Martin, L.; E Baracos, V. Prevalence and clinical implications of sarcopenic obesity in patients with solid tumours of the respiratory and gastrointestinal tracts: A population-based study. Lancet Oncol. 2008, 9, 629–635. [Google Scholar] [CrossRef]
- Prado, C.M.; Baracos, V.E.; McCargar, L.J.; Reiman, T.; Mourtzakis, M.; Tonkin, K.; Mackey, J.R.; Koski, S.; Pituskin, E.; Sawyer, M.B. Sarcopenia as a Determinant of Chemotherapy Toxicity and Time to Tumor Progression in Metastatic Breast Cancer Patients Receiving Capecitabine Treatment. Clin. Cancer Res. 2009, 15, 2920–2926. [Google Scholar] [CrossRef] [PubMed]
- Rinninella, E.; Cintoni, M.; Raoul, P.; Pozzo, C.; Strippoli, A.; Bria, E.; Tortora, G.; Gasbarrini, A.; Mele, M.C. Muscle mass, assessed at diagnosis by L3-CT scan as a prognostic marker of clinical outcomes in patients with gastric cancer: A systematic review and meta-analysis. Clin. Nutr. 2020, 39, 2045–2054. [Google Scholar] [CrossRef]
- Zhuang, C.-L.; Huang, D.-D.; Pang, W.-Y.; Zhou, C.-J.; Wang, S.-L.; Lou, N.; Ma, L.-L.; Yu, Z.; Shen, X. Sarcopenia is an Independent Predictor of Severe Postoperative Complications and Long-Term Survival After Radical Gastrectomy for Gastric Cancer: Analysis from a Large-Scale Cohort. Medicine 2016, 95, e3164. [Google Scholar] [CrossRef]
- Levolger, S.; van Vugt, J.L.A.; de Bruin, R.W.F.; Ijzermans, J.N.M. Systematic review of sarcopenia in patients operated on for gastrointestinal and hepatopancreatobiliary malignancies. BJS 2015, 102, 1448–1458. [Google Scholar] [CrossRef]
- Sugiyama, K.; Narita, Y.; Mitani, S.; Honda, K.; Masuishi, T.; Taniguchi, H.; Kadowaki, S.; Ura, T.; Ando, M.; Tajika, M.; et al. Baseline Sarcopenia and Skeletal Muscle Loss During Chemotherapy Affect Survival Outcomes in Metastatic Gastric Cancer. Anticancer. Res. 2018, 38, 5859–5866. [Google Scholar] [CrossRef]
- Hayashi, N.; Ando, Y.; Gyawali, B.; Shimokata, T.; Maeda, O.; Fukaya, M.; Goto, H.; Nagino, M.; Kodera, Y. Low skeletal muscle density is associated with poor survival in patients who receive chemotherapy for metastatic gastric cancer. Oncol. Rep. 2015, 35, 1727–1731. [Google Scholar] [CrossRef] [PubMed]
- Lee, J.S.; Kim, Y.S.; Kim, E.Y.; Jin, W. Prognostic significance of CT-determined sarcopenia in patients with advanced gastric cancer. PLoS ONE 2018, 13, e0202700. [Google Scholar] [CrossRef]
- Dijksterhuis, W.P.; Pruijt, M.J.; Van Der Woude, S.O.; Klaassen, R.; Kurk, S.A.; Van Oijen, M.G.; Van Laarhoven, H.W. Association between body composition, survival, and toxicity in advanced esophagogastric cancer patients receiving palliative chemotherapy. J. Cachex Sarcopenia Muscle 2019, 10, 199–206. [Google Scholar] [CrossRef] [PubMed]
- Hacker, U.T.; Hasenclever, D.; Linder, N.; Stocker, G.; Chung, H.; Kang, Y.; Moehler, M.; Busse, H.; Lordick, F. Prognostic role of body composition parameters in gastric/gastroesophageal junction cancer patients from the EXPAND trial. J. Cachex Sarcopenia Muscle 2019, 11, 135–144. [Google Scholar] [CrossRef]
- Tan, B.; Brammer, K.; Randhawa, N.; Welch, N.; Parsons, S.; James, E.; Catton, J. Sarcopenia is associated with toxicity in patients undergoing neo-adjuvant chemotherapy for oesophago-gastric cancer. Eur. J. Surg. Oncol. 2015, 41, 333–338. [Google Scholar] [CrossRef]
- Palmela, C.; Velho, S.; Agostinho, L.; Branco, F.; Santos, M.; Santos, M.P.C.; Oliveira, M.H.; Strecht, J.; Maio, R.; Cravo, M.; et al. Body Composition as a Prognostic Factor of Neoadjuvant Chemotherapy Toxicity and Outcome in Patients with Locally Advanced Gastric Cancer. J. Gastric Cancer 2017, 17, 74–87. [Google Scholar] [CrossRef]
- Dev, R.; Bruera, E.; Dalal, S. Insulin resistance and body composition in cancer patients. Ann. Oncol. 2018, 29, ii18–ii26. [Google Scholar] [CrossRef] [PubMed]
- Moon, H.-G.; Ju, Y.-T.; Jeong, C.-Y.; Jung, E.-J.; Lee, Y.-J.; Hong, S.-C.; Ha, W.-S.; Park, S.-T.; Choi, S.-K. Visceral Obesity May Affect Oncologic Outcome in Patients with Colorectal Cancer. Ann. Surg. Oncol. 2008, 15, 1918–1922. [Google Scholar] [CrossRef]
- Clark, W.; Siegel, E.M.; Chen, Y.A.; Zhao, X.; Parsons, C.M.; Hernandez, J.M.; Weber, J.; Thareja, S.; Choi, J.; Shibata, D. Quantitative Measures of Visceral Adiposity and Body Mass Index in Predicting Rectal Cancer Outcomes after Neoadjuvant Chemoradiation. J. Am. Coll. Surg. 2013, 216, 1070–1081. [Google Scholar] [CrossRef]
- Harada, K.; Baba, Y.; Ishimoto, T.; Kosumi, K.; Tokunaga, R.; Izumi, D.; Ida, S.; Imamura, Y.; Iwagami, S.; Miyamoto, Y.; et al. Low Visceral Fat Content is Associated with Poor Prognosis in a Database of 507 Upper Gastrointestinal Cancers. Ann. Surg. Oncol. 2015, 22, 3946–3953. [Google Scholar] [CrossRef]
- Okamura, A.; Watanabe, M.; Mine, S.; Nishida, K.; Imamura, Y.; Kurogochi, T.; Kitagawa, Y.; Sano, T. Clinical Impact of Abdominal Fat Distribution on Prognosis After Esophagectomy for Esophageal Squamous Cell Carcinoma. Ann. Surg. Oncol. 2015, 23, 1387–1394. [Google Scholar] [CrossRef]
- Park, H.S.; Kim, H.S.; Beom, S.H.; Rha, S.Y.; Chung, H.C.; Kim, J.H.; Chun, Y.J.; Lee, S.W.; Choe, E.-A.; Heo, S.J.; et al. Marked Loss of Muscle, Visceral Fat, or Subcutaneous Fat After Gastrectomy Predicts Poor Survival in Advanced Gastric Cancer: Single-Center Study from the CLASSIC Trial. Ann. Surg. Oncol. 2018, 25, 3222–3230. [Google Scholar] [CrossRef]
- Kim, H.; Ro, S.M.; Yang, J.H.; Jeong, J.W.; Lee, J.E.; Roh, S.Y.; Kim, I.-H. The neutrophil-to-lymphocyte ratio prechemotherapy and postchemotherapy as a prognostic marker in metastatic gastric cancer. Korean J. Intern. Med. 2018, 33, 990–999. [Google Scholar] [CrossRef] [PubMed]
- Wang, J.; Qu, J.; Li, Z.; Che, X.; Liu, J.; Teng, Y.; Jin, B.; Zhao, M.; Liu, Y.; Qu, X. Pretreatment platelet-to-lymphocyte ratio is associated with the response to first-line chemotherapy and survival in patients with metastatic gastric cancer. J. Clin. Lab. Anal. 2017, 32, e22185. [Google Scholar] [CrossRef]
- Common Terminology Criteria for Adverse Events (CTCAE) Protocol Development CTEP. Available online: https://ctep.cancer.gov/protocoldevelopment/electronic_applications/ctc.htm (accessed on 29 January 2021).
- Schwartz, L.H.; Litière, S.; De Vries, E.; Ford, R.; Gwyther, S.; Mandrekar, S.; Shankar, L.; Bogaerts, J.; Chen, A.; Dancey, J.; et al. RECIST 1.1—Update and clarification: From the RECIST committee. Eur. J. Cancer 2016, 62, 132–137. [Google Scholar] [CrossRef]
- Prado, C.M.; Baracos, V.E.; McCargar, L.J.; Mourtzakis, M.; Mulder, K.E.; Reiman, T.; Butts, C.A.; Scarfe, A.G.; Sawyer, M.B. Body Composition as an Independent Determinant of 5-Fluorouracil–Based Chemotherapy Toxicity. Clin. Cancer Res. 2007, 13, 3264–3268. [Google Scholar] [CrossRef] [PubMed]
- Aubrey, J.; Esfandiari, N.; Baracos, V.E.; Buteau, F.A.; Frenette, J.; Putman, C.T.; Mazurak, V.C. Measurement of skeletal muscle radiation attenuation and basis of its biological variation. Acta Physiol. 2014, 210, 489–497. [Google Scholar] [CrossRef] [PubMed]
- Doyle, S.L.; Donohoe, C.L.; Lysaght, J.; Reynolds, J.V. Visceral obesity, metabolic syndrome, insulin resistance and cancer. Proc. Nutr. Soc. USA 2012, 71, 181–189. [Google Scholar] [CrossRef]


| Characteristics | All Patients | Sarcopenia | p-Value | VFA/SFA | p-Value | ||
|---|---|---|---|---|---|---|---|
| (n = 78) N (%) | Yes (n = 34) N (%) | No (n = 44) N (%) | All the Rest (n = 43) N (%) | High (n = 14) N (%) | |||
| Age, years | |||||||
| Median, (range) | 67, (35–80) | 70, (35–80) | 66, (37–79) | 0.29 | 66, (35–80) | 65, (55–78) | 0.87 |
| Sex | |||||||
| Female/male | 22 (18)/56 (72) | 12 (35)/22 (65) | 10 (23)/34 (77) | 0.33 | 13 (30)/30 (70) | 2 (14)/12 (86) | 0.40 |
| ECOG PS | |||||||
| 0 vs. 1–2 | 34 (44)/44 (56) | 12 (35)/22 (65) | 22 (50)/22 (50) | 0.28 | 23 (54)/20 (46) | 4 (29)/10 (71) | 0.19 |
| Primary tumour site | |||||||
| EGJ/PGC/DGC | 32 (41)/26 (33)/20 (27) | 13 (38)/10 (30)/11 (32) | 19 (43)/16 (36)/9 (20) | 0.48 | 12 (28)/21 (49)/10 (23) | 8 (58)/3 (21)/3 (21) | 0.10 |
| Primary tumour surgery | |||||||
| Yes/no | 22 (28)/56 (72) | 31 (91)/3 (9) | 41 (93)/3 (7) | 0.95 | 15 (35)/28 (65) | 3 (21)/11 (79) | 0.62 |
| N° metastatic sites | |||||||
| 1 vs. ≥2 | 30 (38)/48 (62) | 12 (35)/22 (65) | 18 (41)/26 (59) | 0.78 | 20 (46)/23 (54) | 1 (7)/13 (93) | 0.02 |
| Metastatic sites | |||||||
| Liver | 30 (38) | 11 (32) | 19 (43) | 0.46 | 20 (47) | 5 (36) | 0.69 |
| Lung | 6 (7) | 4 (12) | 2 (5) | 0.45 | 2 (5) | 3 (22) | 0.16 |
| Lymph nodes | 52 (66) | 24 (71) | 28 (64) | 0.68 | 24 (56) | 13 (93) | 0.02 |
| Peritoneum | 39 (50) | 17 (50) | 22 (50) | 0.81 | 22 (51) | 6 (43) | 0.81 |
| Bone | 7 (9) | 6 (18) | 1 (2) | 0.05 | 2 (5) | 3 (21) | 0.16 |
| HER2 * | |||||||
| Yes/no | 16 (24)/51 (76) | 7 (25)/21 (75) | 9 (23)/30 (77) | 0.91 | 10 (25)/30 (75) | 2 (25)/6 (75) | 0.65 |
| NLR>3 | |||||||
| Yes/no/na | 39 (50)/38 (49,9)/1(0,1) | 18 (53)/15 (44)/1 (3) | 21 (48)/23 (52)/– | 0.71 | 21 (49)/22 (51) | 8 (62)/5 (38) | 0.62 |
| PLR >200 | |||||||
| Yes/no/na | 36 (46)/40 (51,8)/2 (0,2) | 13 (38)/20 (59)/1 (3) | 23 (52)/20 (45)/1 (3) | 0.32 | 24 (57)/18 (43) | 4 (31)/9 (69) | 0.18 |
| BMI | |||||||
| ≤20/20–24.9/25–30/≥30 | 17 (23)/37 (47)/19 (24)/5 (6) | – | – | – | – | – | – |
| SMI, median (range; SD) | |||||||
| Female | 40.65 (25.48–61.94; 8.55) | – | – | – | – | – | – |
| Male | 48.51 (32.73–68.70; 8.50) | – | – | – | – | – | – |
| VFA §, median (Range; SD) | 89.10 (3.56–407.77; 88.57) | – | – | – | – | – | – |
| SFA §, median (Range; SD) | 108.99 (0.88–355.97; 80.55) | – | – | – | – | – | – |
| Variables | Progression-Free Survival | Overall Survival | ||
|---|---|---|---|---|
| HR (95% CI) | p-Value | HR (95% CI) | p-Value | |
| Age | ||||
| ≥ vs. < 67 years | 0.85 (0.54–1.35) | 0.47 | 0.73 (0.46–1.18) | 0.18 |
| ECOG PS | ||||
| 0 vs. 1–2 | 0.58 (0.37–0.92) | 0.02 | 0.59 (0.37–0.95) | 0.03 |
| Primary tumour surgery | ||||
| Yes vs. no | 0.70 (0.43–1.13) | 0.16 | 0.69 (0.42– 1.13) | 0.16 |
| N° metastatic sites | ||||
| 1 vs. ≥2 | 0.64 (0.41–1.01) | 0.06 | 0.63 (0.39– 1.01) | 0.06 |
| Metastatic sites | ||||
| Liver | 0.91 (0.57–1.44) | 0.68 | 0.67 (0.42–1.07) | 0.09 |
| Lung | 1.56 (0.57–4.30) | 0.29 | 1.27 (0.46–3.47) | 0.61 |
| Lymph nodes | 1.21 (0.75–1.75) | 0.43 | 1.31 (0.81–2.12) | 0.29 |
| Peritoneum | 1.07 (0.67–1.68) | 0.77 | 1.40 (0.87–2.24) | 0.16 |
| Bone | 2.10 (0.72– 6.15) | 0.05 | 4.35 (0.97–19.57) | <0.001 |
| NLR > 3 | ||||
| Yes vs. no | 1.81 (1.13–2.90) | 0.008 | 1.88 (1.16–3.05) | 0.007 |
| PLR > 200 | ||||
| Yes vs. no | 1.44 (0.90–2.30) | 0.11 | 1.63 (1.00–2.65) | 0.04 |
| SMI | ||||
| Yes vs. no | 0.83 (0.53–1.32) | 0.44 | 0.96 (0.60–1.55) | 0.88 |
| VFA/SFA | ||||
| All the rest vs. high | 0.40 (0.18–0.90) | 0.002 | 0.49 (0.23–1.10) | 0.02 |
| Variables | Progression-Free Survival | Overall Survival | ||
|---|---|---|---|---|
| HR (95% CI) | p-Value | HR (95% CI) | p-Value | |
| ECOG PS | ||||
| 0 vs. 1–2 | 1.59 (0.90–2.81) | 0.11 | 2.36 (1.25–4.44) | 0.008 |
| N° metastatic sites | ||||
| 1 vs. ≥2 | 0.99 (0.52–1.87) | 0.97 | 1.35 (0.67–2.63) | 0.41 |
| Metastatic sites | ||||
| Bone | 2.32 (0.86–6.26) | 0.09 | 9.63 (3.16–29.37) | <0.001 |
| NLR>3 | ||||
| Yes vs. no | 2.00 (1.08–3.69) | 0.03 | 2.19 (1.08–4.45) | 0.03 |
| PLR >200 | ||||
| Yes vs. no | – | – | 1.59 (0.80–3.19) | 0.18 |
| VFA/SFA | ||||
| All the rest vs. high | 2.23 (1.08–4.59) | 0.03 | 2.42 (1.44–5.13) | 0.02 |
Publisher’s Note: MDPI stays neutral with regard to jurisdictional claims in published maps and institutional affiliations. |
© 2021 by the authors. Licensee MDPI, Basel, Switzerland. This article is an open access article distributed under the terms and conditions of the Creative Commons Attribution (CC BY) license (http://creativecommons.org/licenses/by/4.0/).
Share and Cite
Catanese, S.; Aringhieri, G.; Vivaldi, C.; Salani, F.; Vitali, S.; Pecora, I.; Massa, V.; Lencioni, M.; Vasile, E.; Tintori, R.; et al. Role of Baseline Computed-Tomography-Evaluated Body Composition in Predicting Outcome and Toxicity from First-Line Therapy in Advanced Gastric Cancer Patients. J. Clin. Med. 2021, 10, 1079. https://doi.org/10.3390/jcm10051079
Catanese S, Aringhieri G, Vivaldi C, Salani F, Vitali S, Pecora I, Massa V, Lencioni M, Vasile E, Tintori R, et al. Role of Baseline Computed-Tomography-Evaluated Body Composition in Predicting Outcome and Toxicity from First-Line Therapy in Advanced Gastric Cancer Patients. Journal of Clinical Medicine. 2021; 10(5):1079. https://doi.org/10.3390/jcm10051079
Chicago/Turabian StyleCatanese, Silvia, Giacomo Aringhieri, Caterina Vivaldi, Francesca Salani, Saverio Vitali, Irene Pecora, Valentina Massa, Monica Lencioni, Enrico Vasile, Rachele Tintori, and et al. 2021. "Role of Baseline Computed-Tomography-Evaluated Body Composition in Predicting Outcome and Toxicity from First-Line Therapy in Advanced Gastric Cancer Patients" Journal of Clinical Medicine 10, no. 5: 1079. https://doi.org/10.3390/jcm10051079
APA StyleCatanese, S., Aringhieri, G., Vivaldi, C., Salani, F., Vitali, S., Pecora, I., Massa, V., Lencioni, M., Vasile, E., Tintori, R., Balducci, F., Falcone, A., Cappelli, C., & Fornaro, L. (2021). Role of Baseline Computed-Tomography-Evaluated Body Composition in Predicting Outcome and Toxicity from First-Line Therapy in Advanced Gastric Cancer Patients. Journal of Clinical Medicine, 10(5), 1079. https://doi.org/10.3390/jcm10051079