
Supersaturation of VEP in Migraine without Aura Patients Treated with Topiramate: An Anatomo-Functional Biomarker of the Disease

 ,
, 
 , ,
, ,  and
and
Abstract
1. Introduction
2. Materials and Methods
2.1. Study Population
2.2. Clinical Evaluation
2.3. Electrophysiological Evaluation
2.4. Mathematical Model for Contrast Gain Assessment
2.5. Statistical Analysis
3. Results
4. Discussion
5. Conclusions
Author Contributions
Funding
Institutional Review Board Statement
Informed Consent Statement
Data Availability Statement
Conflicts of Interest
References
- Russo, A.; Silvestro, M.; Tedeschi, G.; Tessitore, A. Physiopathology of Migraine: What Have We Learned from Functional Imaging? Curr. Neurol. Neurosci. Rep. 2017, 17, 95. [Google Scholar] [CrossRef]
- Coppola, G.; Bracaglia, M.; Di Lenola, D.; Iacovelli, E.; Di Lorenzo, C.; Serrao, M.; Evangelista, M.; Parisi, V.; Schoenen, J.; Pierelli, F. Lateral inhibition in the somatosensory cortex during and between migraine without aura attacks: Correlations with thalamocortical activity and clinical features. Cephalalgia Int. J. Headache 2015, 36, 568–578. [Google Scholar] [CrossRef]
- Coppola, G.; Di Renzo, A.; Tinelli, E.; Di Lorenzo, C.; Di Lorenzo, G.; Parisi, V.; Serrao, M.; Schoenen, J.; Pierelli, F. Thalamo-cortical network activity during spontaneous migraine attacks. Neurology 2016, 87, 2154–2160. [Google Scholar] [CrossRef] [PubMed]
- Coppola, G.; Di Renzo, A.; Tinelli, E.; Lepre, C.; Di Lorenzo, C.; Di Lorenzo, G.; Scapeccia, M.; Parisi, V.; Serrao, M.; Colonnese, C.; et al. Thalamo-cortical network activity between migraine attacks: Insights from MRI-based microstructural and functional resting-state network correlation analysis. J. Headache Pain 2016, 17, 100. [Google Scholar] [CrossRef] [PubMed]
- Lisicki, M.; D’Ostilio, K.; Coppola, G.; Maertens de Noordhout, A.; Parisi, V.; Schoenen, J.; Magis, D. Brain Correlates of Single Trial Visual Evoked Potentials in Migraine: More Than Meets the Eye. Front. Neurol. 2018, 9, 393. [Google Scholar] [CrossRef]
- Nguyen, B.N.; McKendrick, A.M.; Vingrys, A.J. Abnormal inhibition-excitation imbalance in migraine. Cephalalgia Int. J. Headache 2016, 36, 5–14. [Google Scholar] [CrossRef] [PubMed]
- Giorgio, A.; Lupi, C.; Zhang, J.; De Cesaris, F.; Alessandri, M.; Mortilla, M.; Federico, A.; Geppetti, P.; De Stefano, N.; Benemei, S. Changes in grey matter volume and functional connectivity in cluster headache versus migraine. Brain Imaging Behav. 2020, 14, 496–504. [Google Scholar] [CrossRef] [PubMed]
- Bassez, I.; Van de Steen, F.; Ricci, K.; Vecchio, E.; Gentile, E.; Marinazzo, D.; de Tommaso, M. Dynamic Causal Modelling of the Reduced Habituation to Painful Stimuli in Migraine: An EEG Study. Brain Sci. 2020, 10, 712. [Google Scholar] [CrossRef]
- Baldacci, F.; Vedovello, M.; Ulivi, M.; Vergallo, A.; Poletti, M.; Borelli, P.; Cipriani, G.; Nuti, A.; Bonuccelli, U. Triggers in allodynic and non-allodynic migraineurs. A clinic setting study. Headache 2013, 53, 152–160. [Google Scholar] [CrossRef]
- Baldacci, F.; Vedovello, M.; Ulivi, M.; Vergallo, A.; Poletti, M.; Borelli, P.; Nuti, A.; Bonuccelli, U. How aware are migraineurs of their triggers? Headache 2013, 53, 834–837. [Google Scholar] [CrossRef]
- Cortese, F.; Coppola, G.; Di Lenola, D.; Serrao, M.; Di Lorenzo, C.; Parisi, V.; Pierelli, F. Excitability of the motor cortex in patients with migraine changes with the time elapsed from the last attack. J. Headache Pain 2017, 18, 2. [Google Scholar] [CrossRef] [PubMed]
- Lisicki, M.; D’Ostilio, K.; Coppola, G.; Nonis, R.; Maertens de Noordhout, A.; Parisi, V.; Magis, D.; Schoenen, J. Headache Related Alterations of Visual Processing in Migraine Patients. J. Pain 2020, 21, 593–602. [Google Scholar] [CrossRef]
- De Tommaso, M.; Sciruicchio, V.; Bellotti, R.; Castellano, M.; Tota, P.; Guido, M.; Sasanelli, G.; Puca, F. Discrimination between migraine patients and normal subjects based on steady state visual evoked potentials: Discriminant analysis and artificial neural network classifiers. Funct. Neurol. 1997, 12, 333–338. [Google Scholar] [PubMed]
- Logi, F.; Bonfiglio, L.; Orlandi, G.; Bonanni, E.; Iudice, A.; Sartucci, F. Asymmetric scalp distribution of pattern visual evoked potentials during interictal phases in migraine. Acta Neurol. Scand. 2001, 104, 301–307. [Google Scholar] [CrossRef]
- Sulejmanpasic, G.; Drnda, S. Magnetic Resonance Imaging (MRI) and Visual Evoked Potentials (VEPs) of Occipital Region in Patients with Schizophrenia and Migraine Headache. Acta Inform. Med. AIM J. Soc. Med. Inform. Bosnia Herzeg. Cas. Drus. Med. Inform. BiH 2017, 25, 103–107. [Google Scholar] [CrossRef] [PubMed]
- Schulte, L.H.; May, A. The migraine generator revisited: Continuous scanning of the migraine cycle over 30 days and three spontaneous attacks. Brain J. Neurol. 2016, 139, 1987–1993. [Google Scholar] [CrossRef]
- Wei, H.L.; Chen, J.; Chen, Y.C.; Yu, Y.S.; Guo, X.; Zhou, G.P.; Zhou, Q.Q.; He, Z.Z.; Yang, L.; Yin, X.; et al. Impaired effective functional connectivity of the sensorimotor network in interictal episodic migraineurs without aura. J. Headache Pain 2020, 21, 111. [Google Scholar] [CrossRef]
- Michels, L.; Villanueva, J.; O’Gorman, R.; Muthuraman, M.; Koirala, N.; Büchler, R.; Gantenbein, A.R.; Sandor, P.S.; Luechinger, R.; Kollias, S.; et al. Interictal Hyperperfusion in the Higher Visual Cortex in Patients With Episodic Migraine. Headache 2019, 59, 1808–1820. [Google Scholar] [CrossRef]
- Carandini, M.; Heeger, D.J. Summation and division by neurons in primate visual cortex. Science 1994, 264, 1333. [Google Scholar] [CrossRef] [PubMed]
- Heeger, D.J. Normalization of cell responses in cat striate cortex. Vis. Neurosci. 2009, 9, 181–197. [Google Scholar] [CrossRef]
- Ledgeway, T.; Zhan, C.; Johnson, A.P.; Song, Y.; Baker, C.L., Jr. The direction-selective contrast response of area 18 neurons is different for first- and second-order motion. Vis. Neurosci. 2005, 22, 87–99. [Google Scholar] [CrossRef] [PubMed]
- Peirce, J.W. The potential importance of saturating and supersaturating contrast response functions in visual cortex. J. Vis. 2007, 7, 13. [Google Scholar] [CrossRef]
- Zhang, D.; Huang, X.; Su, W.; Chen, Y.; Wang, P.; Mao, C.; Miao, Z.; Liu, C.; Xu, C.; Yin, X.; et al. Altered lateral geniculate nucleus functional connectivity in migraine without aura: A resting-state functional MRI study. J. Headache Pain 2020, 21, 17. [Google Scholar] [CrossRef] [PubMed]
- Vialatte, F.-B.; Maurice, M.; Dauwels, J.; Cichocki, A. Steady-state visually evoked potentials: Focus on essential paradigms and future perspectives. Prog. Neurobiol. 2010, 90, 418–438. [Google Scholar] [CrossRef]
- Kjellström, S.; Bruun, A.; Isaksson, B.; Eriksson, T.; Andréasson, S.; Ponjavic, V. Retinal function and histopathology in rabbits treated with Topiramate. Doc. Ophthalmol. Adv. Ophthalmol. 2006, 113, 179–186. [Google Scholar] [CrossRef]
- Wang, M.; Li, Y.; Lin, Y. GABAA receptor α2 subtype activation suppresses retinal spreading depression. Neuroscience 2015, 298, 137–144. [Google Scholar] [CrossRef]
- Ziemann, U. Pharmacology of TMS. Suppl. Clin. Neurophysiol. 2003, 56, 226–231. [Google Scholar]
- Arnold, M. Headache Classification Committee of the International Headache Society (IHS) The International Classification of Headache Disorders, 3rd edition. Cephalalgia Int. J. Headache 2018, 38, 1–211. [Google Scholar] [CrossRef]
- Robson, A.G.; Nilsson, J.; Li, S.; Jalali, S.; Fulton, A.B.; Tormene, A.P.; Holder, G.E.; Brodie, S.E. ISCEV guide to visual electrodiagnostic procedures. Doc. Ophthalmol. Adv. Ophthalmol. 2018, 136, 1–26. [Google Scholar] [CrossRef] [PubMed]
- Sand, T.; Zhitniy, N.; White, L.R.; Stovner, L.J. Visual evoked potential latency, amplitude and habituation in migraine: A longitudinal study. Clin. Neurophysiol. 2008, 119, 1020–1027. [Google Scholar] [CrossRef]
- Coppola, G.; Pierelli, F.; Schoenen, J. Habituation and migraine. Neurobiol. Learn. Mem. 2009, 92, 249–259. [Google Scholar] [CrossRef]
- Angelucci, A.; Bressloff, P.C. Contribution of feedforward, lateral and feedback connections to the classical receptive field center and extra-classical receptive field surround of primate V1 neurons. In Progress in Brain Research; Martinez-Conde, S., Macknik, S.L., Martinez, L.M., Alonso, J.M., Tse, P.U., Eds.; Elsevier: Amsterdam, The Netherlands, 2006; Volume 154, pp. 93–120. [Google Scholar]
- De Luca, C.; Colangelo, A.M.; Virtuoso, A.; Alberghina, L.; Papa, M. Neurons, glia, extracellular matrix and neurovascular unit: A systems biology approach to the complexity of synaptic plasticity in health and disease. Int. J. Mol. Sci. 2020, 21, 1539. [Google Scholar] [CrossRef]
- Petta, F.; De Luca, C.; Triggiani, M.; Casolaro, V. Fragments of truth: T-cell targets of polyclonal immunoglobulins in autoimmune diseases. Curr. Opin. Pharmacol. 2014, 17, 1–11. [Google Scholar] [CrossRef]
- Tsai, J.J.; Norcia, A.M.; Ales, J.M.; Wade, A.R. Contrast gain control abnormalities in idiopathic generalized epilepsy. Ann. Neurol. 2011, 70, 574–582. [Google Scholar] [CrossRef] [PubMed]
- Coppola, G.; Parisi, V.; Di Lorenzo, C.; Serrao, M.; Magis, D.; Schoenen, J.; Pierelli, F. Lateral inhibition in visual cortex of migraine patients between attacks. J. Headache Pain 2013, 14, 20. [Google Scholar] [CrossRef]
- Priebe, N.J.; Ferster, D. Mechanisms of neuronal computation in mammalian visual cortex. Neuron 2012, 75, 194–208. [Google Scholar] [CrossRef]
- Shahaf, G.; Kuperman, P.; Bloch, Y.; Yariv, S.; Granovsky, Y. Monitoring Migraine Cycle Dynamics with an Easy-to-Use Electrophysiological Marker-A Pilot Study. Sensors 2018, 18, 3918. [Google Scholar] [CrossRef]
- Szabó, E.; Galambos, A.; Kocsel, N.; Édes, A.E.; Pap, D.; Zsombók, T.; Kozák, L.R.; Bagdy, G.; Kökönyei, G.; Juhász, G. Association between migraine frequency and neural response to emotional faces: An fMRI study. NeuroImage. Clin. 2019, 22, 101790. [Google Scholar] [CrossRef] [PubMed]
- Coppola, G.; Di Lenola, D.; Abagnale, C.; Ferrandes, F.; Sebastianelli, G.; Casillo, F.; Di Lorenzo, C.; Serrao, M.; Evangelista, M.; Schoenen, J.; et al. Short-latency afferent inhibition and somato-sensory evoked potentials during the migraine cycle: Surrogate markers of a cycling cholinergic thalamo-cortical drive? J. Headache Pain 2020, 21, 34. [Google Scholar] [CrossRef] [PubMed]
- Dini, E.; Mazzucchi, S.; De Luca, C.; Cafalli, M.; Chico, L.; Lo Gerfo, A.; Siciliano, G.; Bonuccelli, U.; Baldacci, F.; Gori, S. Plasma Levels of Oxidative Stress Markers, before and after BoNT/A Treatment, in Chronic Migraine. Toxins 2019, 11, 608. [Google Scholar] [CrossRef] [PubMed]
- Pomes, L.M.; Guglielmetti, M.; Bertamino, E.; Simmaco, M.; Borro, M.; Martelletti, P. Optimising migraine treatment: From drug-drug interactions to personalized medicine. J. Headache Pain 2019, 20, 56. [Google Scholar] [CrossRef] [PubMed]
- Edvinsson, J.C.A.; Viganò, A.; Alekseeva, A.; Alieva, E.; Arruda, R.; De Luca, C.; D’Ettore, N.; Frattale, I.; Kurnukhina, M.; Macerola, N.; et al. The fifth cranial nerve in headaches. J. Headache Pain 2020, 21, 65. [Google Scholar] [CrossRef] [PubMed]
- De Logu, F.; Landini, L.; Janal, M.N.; Li Puma, S.; De Cesaris, F.; Geppetti, P. Migraine-provoking substances evoke periorbital allodynia in mice. J. Headache Pain 2019, 20, 18. [Google Scholar] [CrossRef] [PubMed]
- Russo, A.; Tessitore, A.; Silvestro, M.; Di Nardo, F.; Trojsi, F.; Del Santo, T.; De Micco, R.; Esposito, F.; Tedeschi, G. Advanced visual network and cerebellar hyperresponsiveness to trigeminal nociception in migraine with aura. J. Headache Pain 2019, 20, 46. [Google Scholar] [CrossRef]


| Variable | Controls | Migraineurs | ||
|---|---|---|---|---|
| Number | 13 | 15 | ||
| Male | 4 | 4 | P = 1 a | |
| Female | 9 | 11 | ||
| Age median (IQR) | 30 (27) | 34 (38) | P = 0.89 b | |
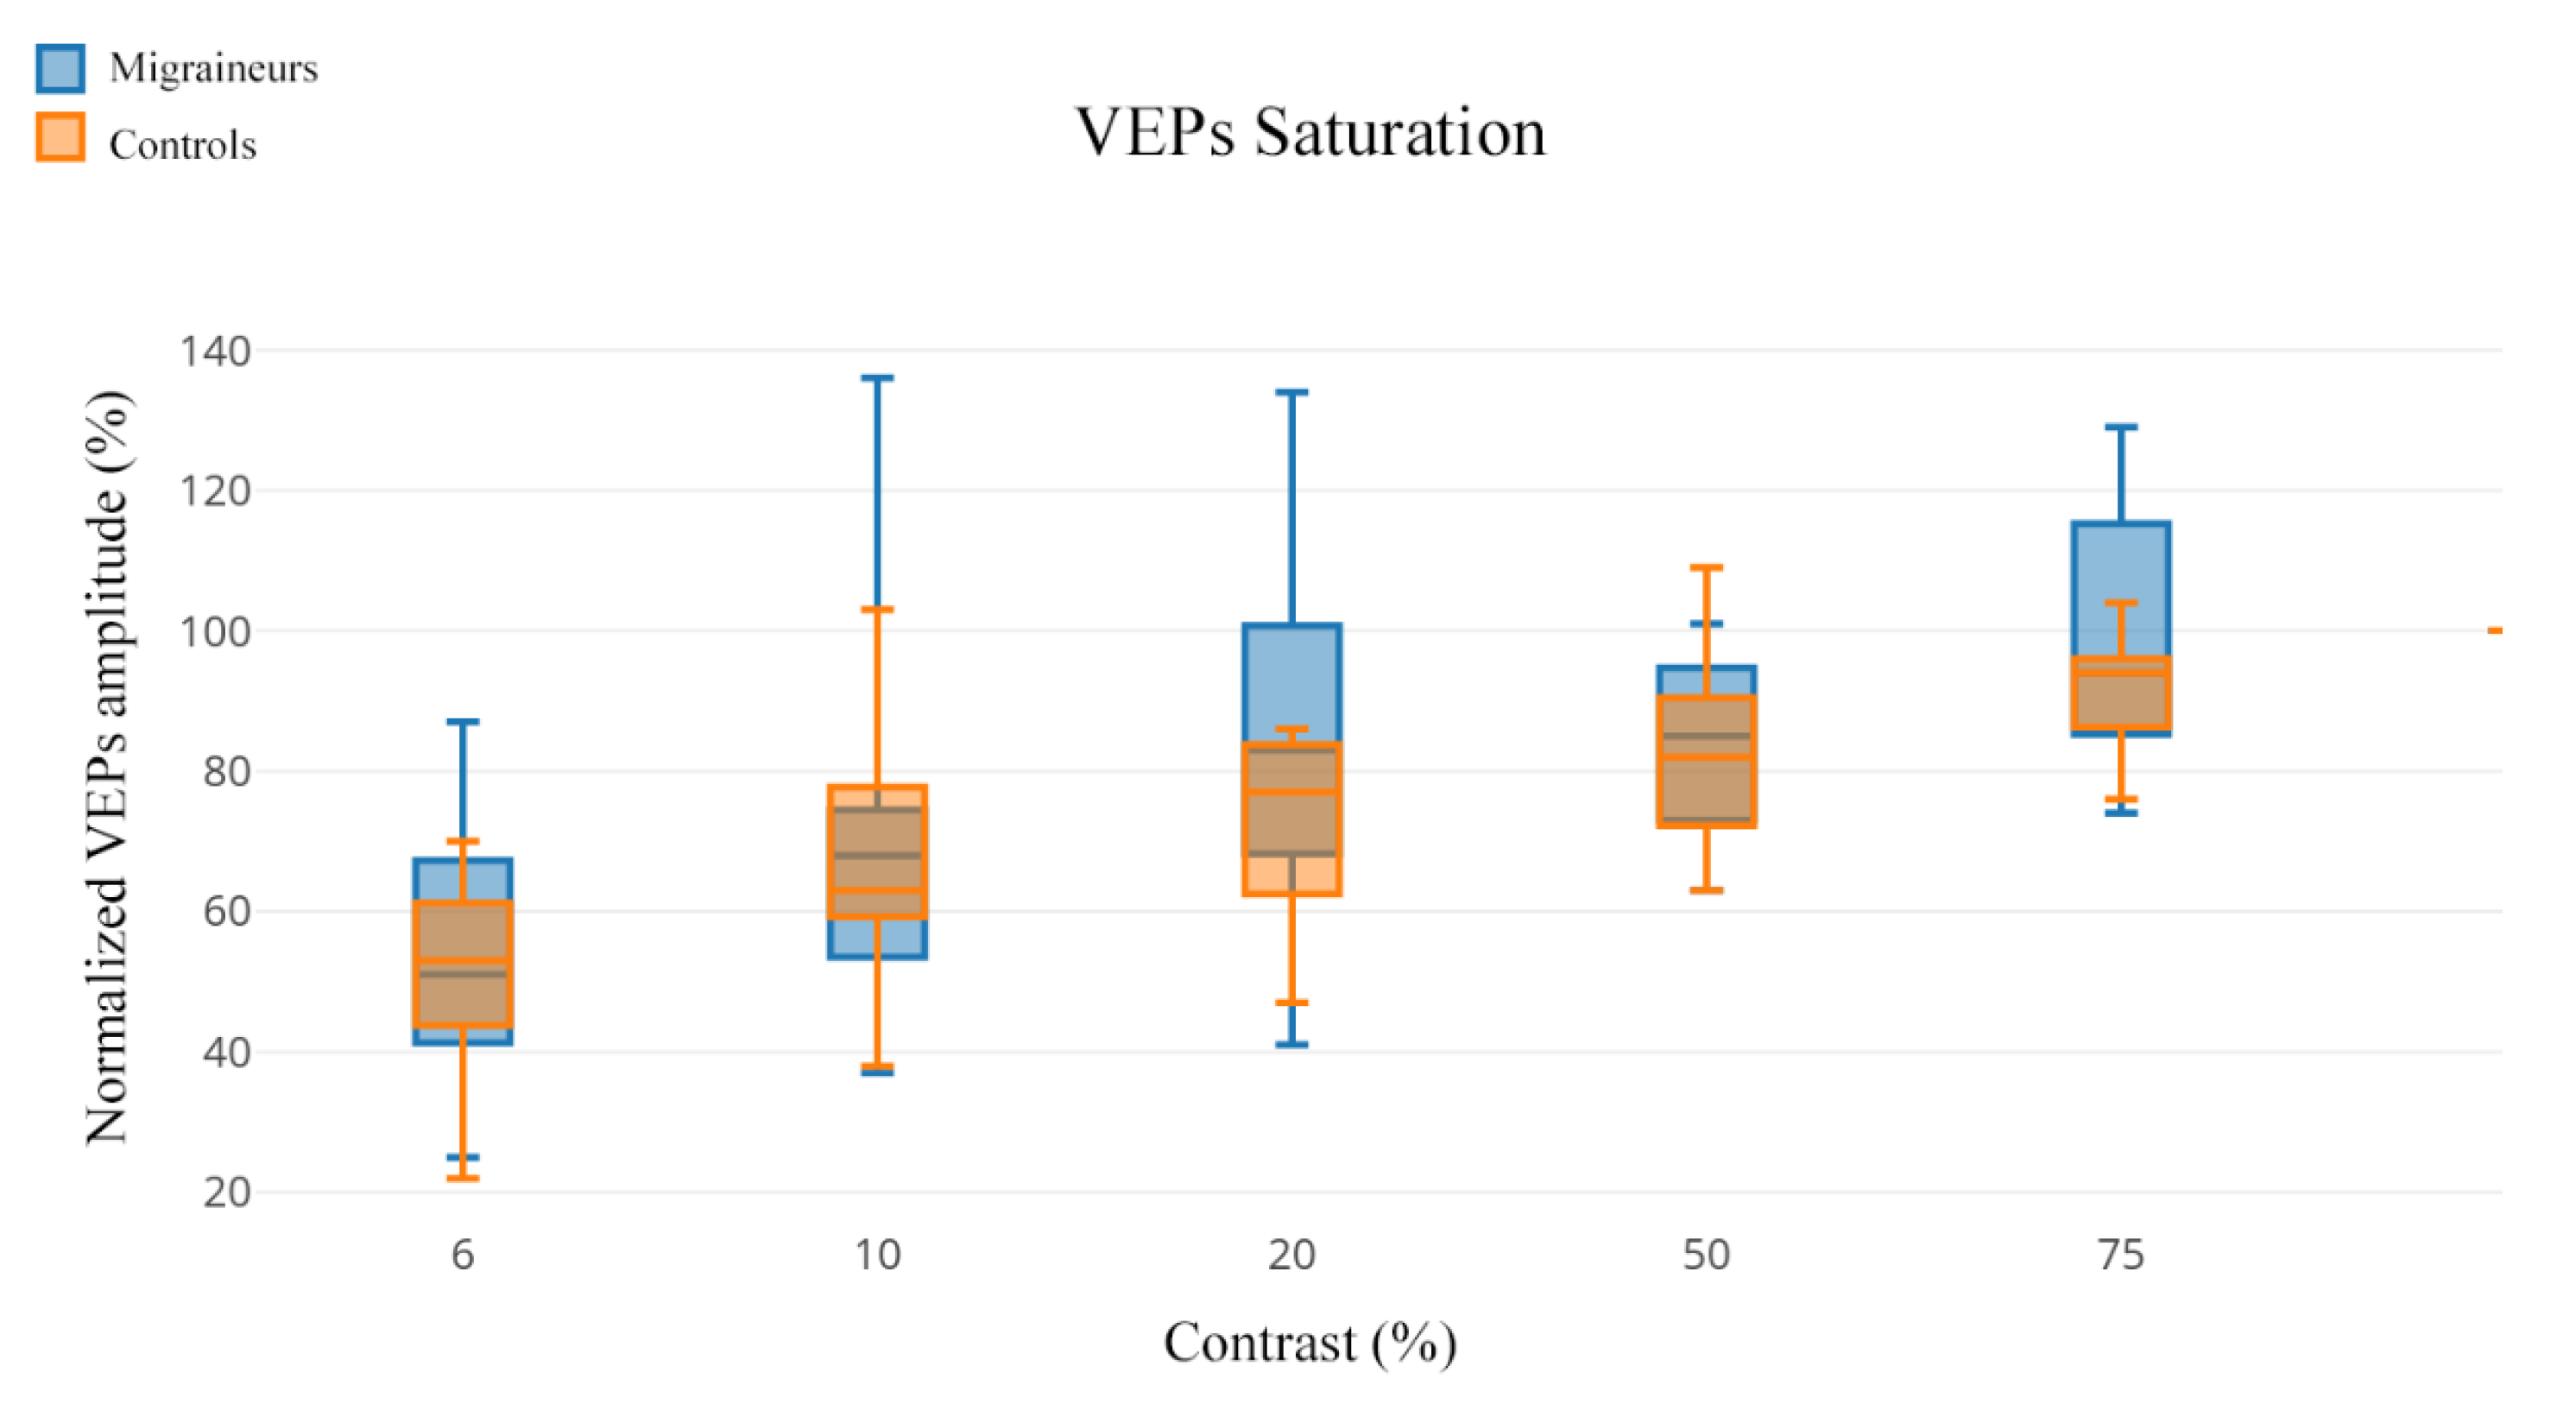
| Normalized VEP Amplitude (An%) Median (IQR) | ||||
|---|---|---|---|---|
| Contrast | Controls | Migraineurs | U | P |
| 6% | 53% (52) | 51% (62) | 95.50 | 0.945 |
| 10% | 60% (70) | 68% (99) | 88.50 | 0.695 |
| 20% | 69% (39) | 83% (93) | 69.50 | 0.205 |
| 50% | 78% (46) | 85% (38) | 81.50 | 0.475 |
| 75% | 91% (28) | 94% (55) | 81.50 | 0.475 |
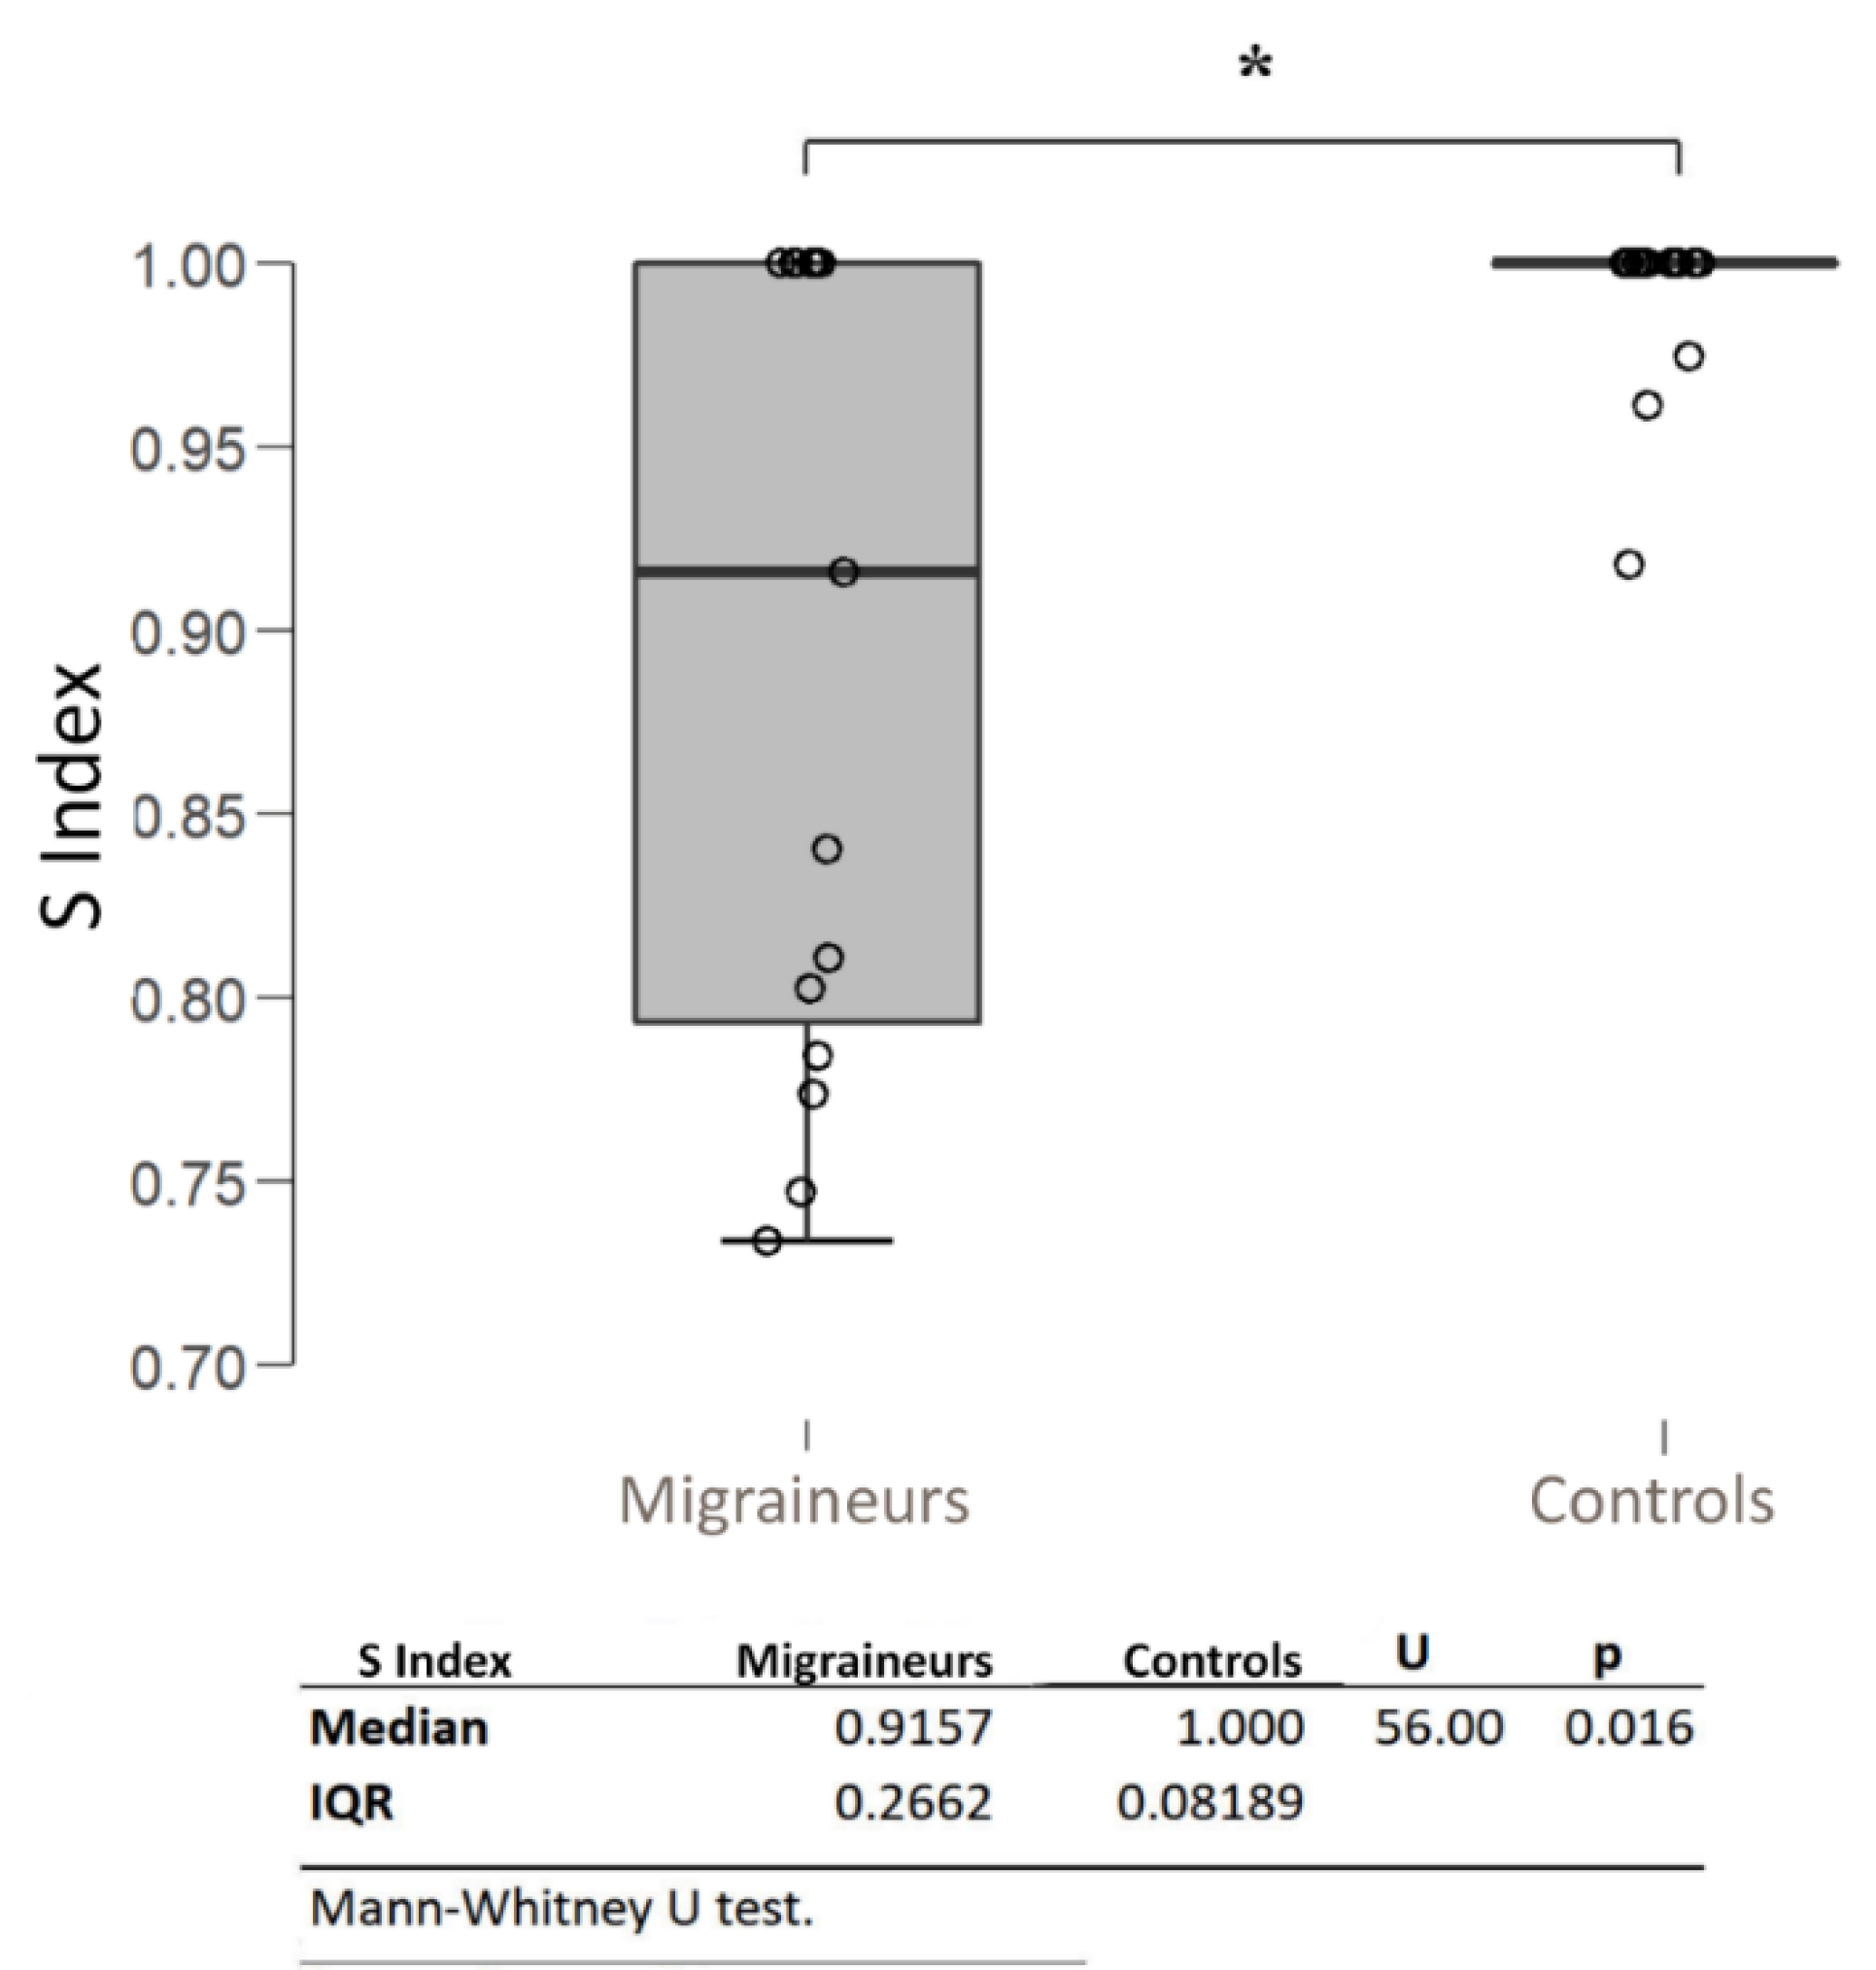
| Correlation | Median (IQR) | Spearman’s Rho | p | ||
|---|---|---|---|---|---|
| S Index | – | 0.9157 (0.2662) | – | – | |
| – | Frequency (days/months) | 8 (5) | −0.315 | 0.252 | |
| – | Days to the next attack | 3 (11) | −0.915 | <0.001 *** | |
| – | Years of disease | 20 (38) | −0.030 | 0.915 | |
| – | Attack mean duration (h) | 24 (64) | 0.437 | 0.103 | |
| – | HIT-6 | 67 (27) | 0.023 | 0.936 | |
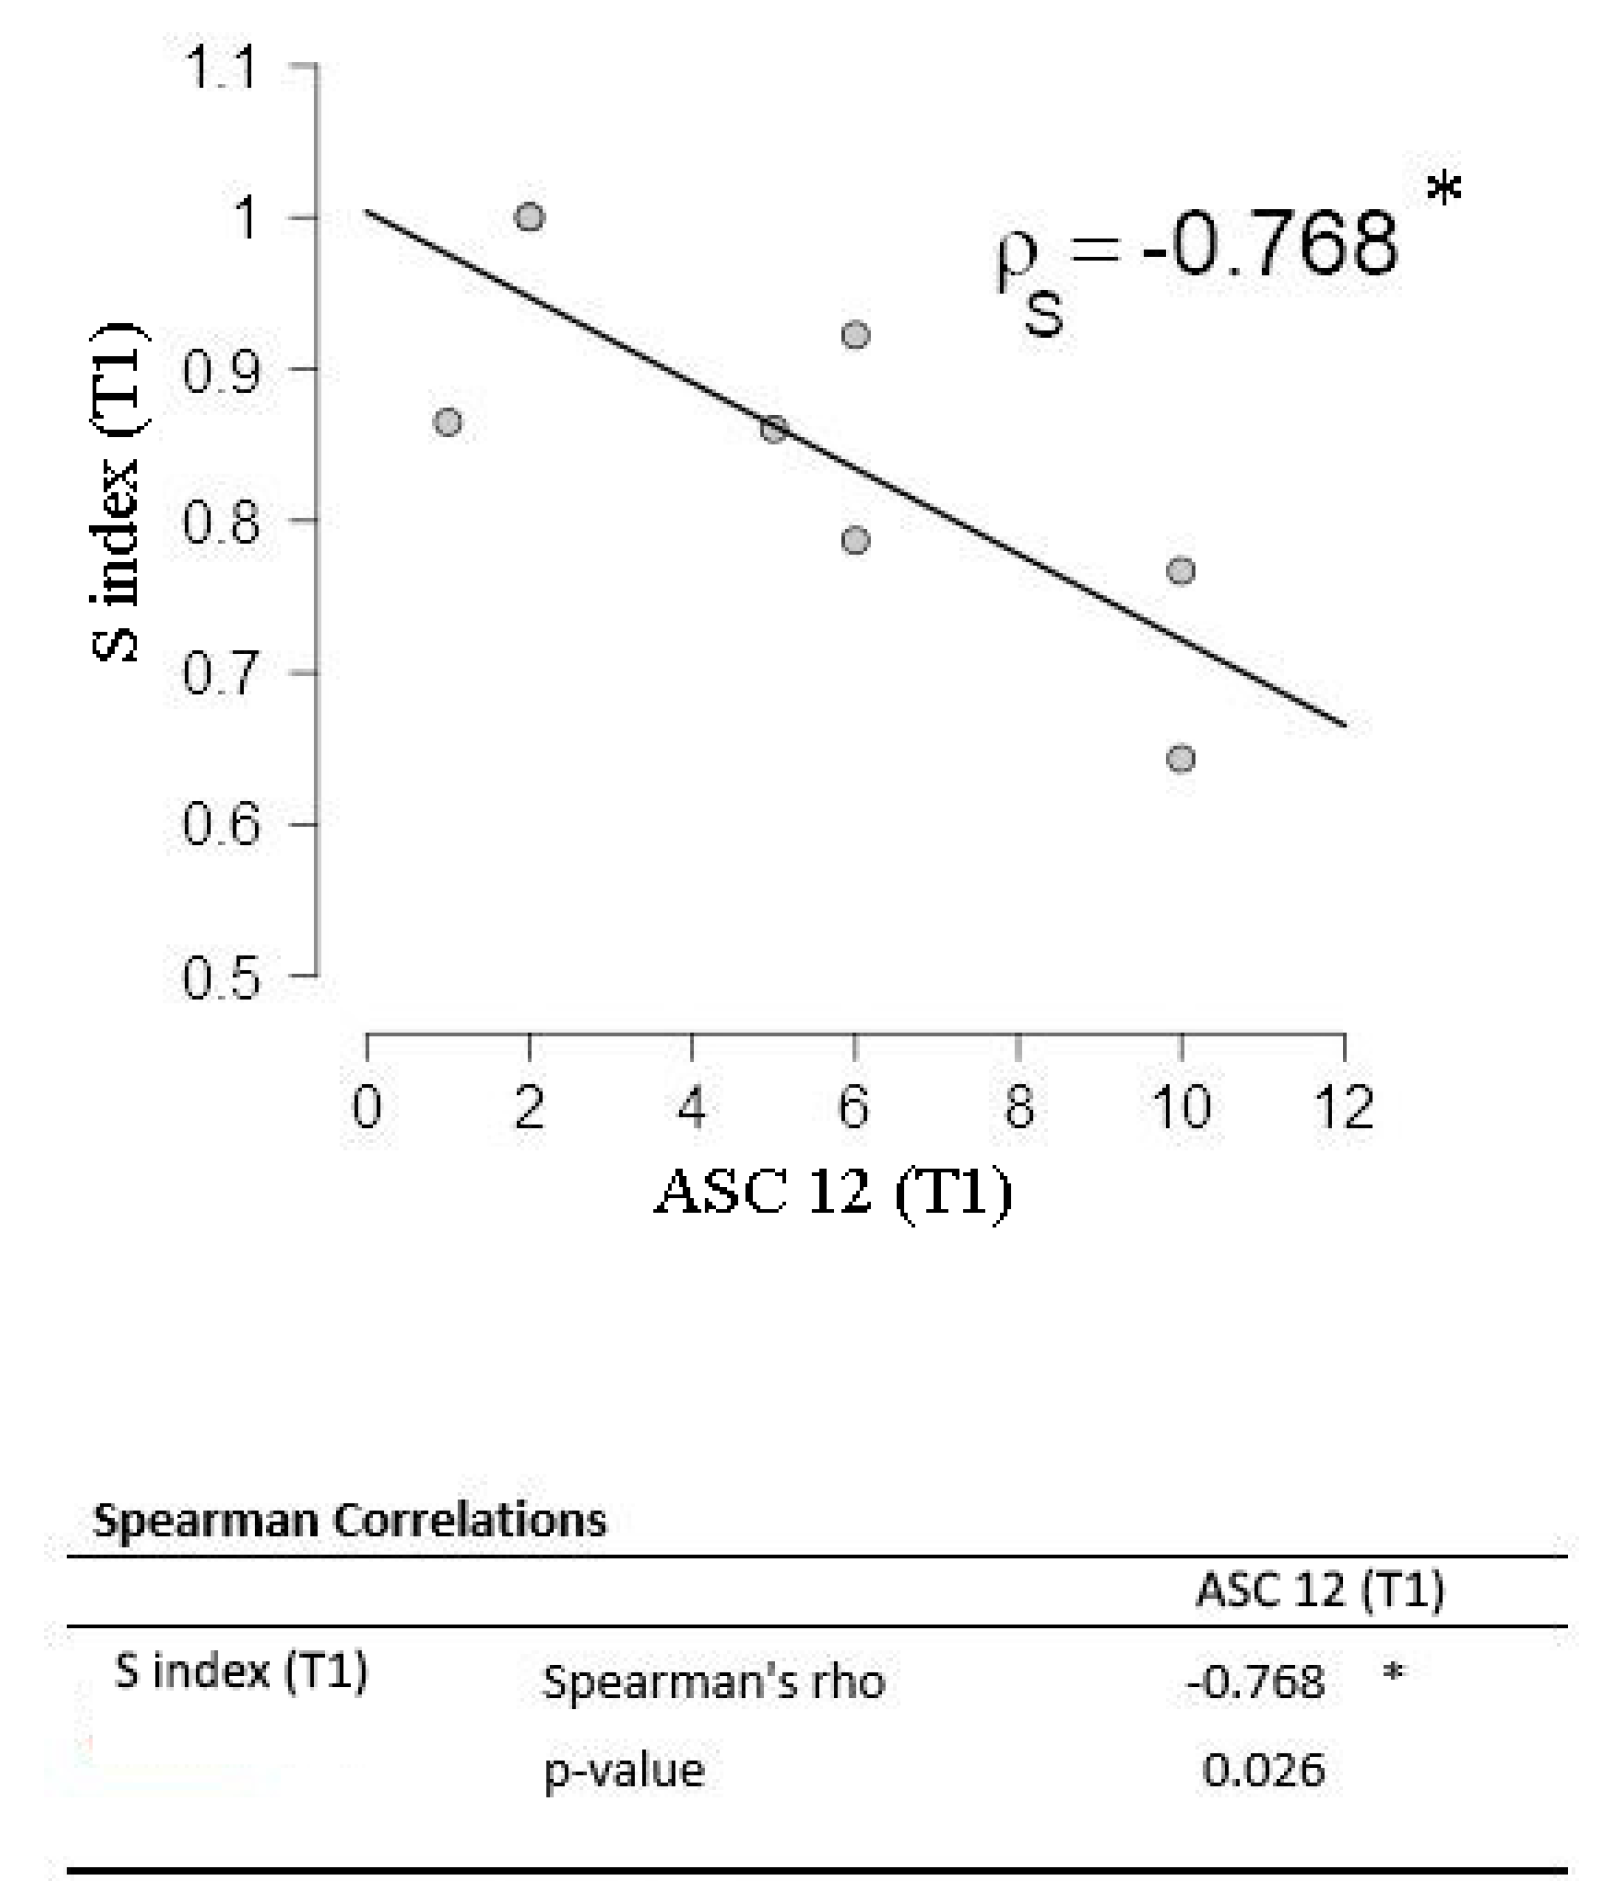
| – | ASC-12 | 4 (11) | −0.736 | 0.002 ** | |
| – | ESS | 5 (10) | 0.229 | 0.411 | |
| – | PSQI | 8 (9) | 0.419 | 0.120 | |
| – | rMEQ | 16 (12) | −0.281 | 0.310 | |
| – | FSS | 32 (40) | 0.000 | 1.000 | |
| – | GAD-7 | 13 (20) | −0.074 | 0.795 | |
| – | PHQ-9 | 12 (16) | −0.241 | 0.386 | |
| – | MIDAS | 8 (44) | −0.463 | 0.082 | |
| – | VNS | 7 (3) | 0.138 | 0.623 | |
| Normalized VEP Amplitude (An%) Median (IQR) | ||||
|---|---|---|---|---|
| Contrast | Controls | Migraineurs (Intercritical) | U | P |
| 6% | 53% (52) | 58.5% (59) | 64.50 | 0.479 |
| 10% | 60% (64) | 69% (92) | 58.00 | 0.288 |
| 20% | 69% (39) | 93% (76) | 35.00 | 0.021 * |
| 50% | 78% (46) | 86% (38) | 61.50 | 0.384 |
| 75% | 91% (28) | 99% (55) | 55.00 | 0.221 |
| Median (IQR) | ||||
|---|---|---|---|---|
| T0 | T1 | W | p | |
| S index | 0.83 (0.27) | 0.86 (0.36) | 16.000 | 0.800 |
| Frequency (days/month) | 9 (4) | 4 (9) | 21.000 | 0.036 * |
| VNS | 7 (2) | 7 (2) | 1.500 | 1.000 |
| Attack mean duration (h) | 36 (64) | 12 (64) | 6.000 | 0.181 |
| HIT-6 | 67.5 (27) | 62.5 (51) | 28.000 | 0.022 * |
| MIDAS | 11 (44) | 10 (40) | 21.000 | 0.036 * |
| ESS | 5 (10) | 5 (14) | 0.000 | 0.095 |
| PSQI | 7 (9) | 7 (5) | 3.000 | 1.000 |
| rMEQ | 15 (8) | 16 (7) | 0.000 | 0.371 |
| ASC-12 | 5.5 (11) | 5.5 (9) | 9.000 | 0.786 |
| GAD-7 | 7.5 (15) | 6 (19) | 17.000 | 0.670 |
| PHQ-9 | 10 (16) | 11 (17) | 15.000 | 0.932 |
| FSS | 33.5 (40) | 37 (34) | 20.500 | 0.779 |
Publisher’s Note: MDPI stays neutral with regard to jurisdictional claims in published maps and institutional affiliations. |
© 2021 by the authors. Licensee MDPI, Basel, Switzerland. This article is an open access article distributed under the terms and conditions of the Creative Commons Attribution (CC BY) license (http://creativecommons.org/licenses/by/4.0/).
Share and Cite
De Luca, C.; Gori, S.; Mazzucchi, S.; Dini, E.; Cafalli, M.; Siciliano, G.; Papa, M.; Baldacci, F. Supersaturation of VEP in Migraine without Aura Patients Treated with Topiramate: An Anatomo-Functional Biomarker of the Disease. J. Clin. Med. 2021, 10, 769. https://doi.org/10.3390/jcm10040769
De Luca C, Gori S, Mazzucchi S, Dini E, Cafalli M, Siciliano G, Papa M, Baldacci F. Supersaturation of VEP in Migraine without Aura Patients Treated with Topiramate: An Anatomo-Functional Biomarker of the Disease. Journal of Clinical Medicine. 2021; 10(4):769. https://doi.org/10.3390/jcm10040769
Chicago/Turabian StyleDe Luca, Ciro, Sara Gori, Sonia Mazzucchi, Elisa Dini, Martina Cafalli, Gabriele Siciliano, Michele Papa, and Filippo Baldacci. 2021. "Supersaturation of VEP in Migraine without Aura Patients Treated with Topiramate: An Anatomo-Functional Biomarker of the Disease" Journal of Clinical Medicine 10, no. 4: 769. https://doi.org/10.3390/jcm10040769
APA StyleDe Luca, C., Gori, S., Mazzucchi, S., Dini, E., Cafalli, M., Siciliano, G., Papa, M., & Baldacci, F. (2021). Supersaturation of VEP in Migraine without Aura Patients Treated with Topiramate: An Anatomo-Functional Biomarker of the Disease. Journal of Clinical Medicine, 10(4), 769. https://doi.org/10.3390/jcm10040769