
Trajectories of Adherence to Biologic Disease-Modifying Anti-Rheumatic Drugs in Tuscan Administrative Databases: The Pathfinder Study

 , ,
, ,  , , , and
Abstract
:1. Introduction
2. Materials and Methods
2.1. Study Design and Participants
2.2. Measurement
2.3. Statistical Analysis
3. Results
4. Discussion
5. Conclusions
Supplementary Materials
Author Contributions
Funding
Institutional Review Board Statement
Informed Consent Statement
Data Availability Statement
Acknowledgments
Conflicts of Interest
References
- Aletaha, D.; Smolen, J.S. Diagnosis and Management of Rheumatoid Arthritis. JAMA 2018, 320, 1360–1372. [Google Scholar] [CrossRef] [PubMed]
- Gibofsky, A. Epidemiology, pathophysiology, and diagnosis of rheumatoid arthritis: A Synopsis. Am. J. Manag. Care 2014, 20, S128–S135. Available online: http://www.ncbi.nlm.nih.gov/pubmed/25180621 (accessed on 18 December 2018). [PubMed]
- Rossini, M.; Rossi, E.; Bernardi, D.; Viapiana, O.; Gatti, D.; Idolazzi, L.; Caimmi, C.; DeRosa, M.; Adami, S. Prevalence and incidence of rheumatoid arthritis in Italy. Rheumatol. Int. 2014, 34, 659–664. [Google Scholar] [CrossRef]
- Guo, Q.; Wang, Y.; Xu, D.; Nossent, J.; Pavlos, N.; Xu, J. Rheumatoid arthritis: Pathological mechanisms and modern pharmacologic therapies. Bone Res. 2018, 6, 15. [Google Scholar] [CrossRef] [PubMed]
- Solomon, D.H.; Karlson, E.W.; Rimm, E.B.; Cannuscio, C.C.; Mandl, L.A.; Manson, J.E.; Stampfer, M.J.; Curhan, G.C. Cardiovascular morbidity and mortality in women diagnosed with rheumatoid arthritis. Circulation 2003, 107, 1303–1307. [Google Scholar] [CrossRef] [Green Version]
- Pincus, T.; Callahan, L.F.; Sale, W.G.; Brooks, A.L.; Payne, L.E.; Vaughn, W.K. Severe functional declines, work disability, and increased mortality in seventy-five rheumatoid arthritis patients studied over nine years. Arthritis Rheum. 1984, 27, 864–872. [Google Scholar] [CrossRef]
- Listing, J.; Kekow, J.; Manger, B.; Burmester, G.-R.; Pattloch, D.; Zink, A.; Strangfeld, A. Mortality in rheumatoid arthritis: The impact of disease activity, treatment with glucocorticoids, TNFα inhibitors and rituximab. Ann. Rheum. Dis. 2015, 74, 415–421. [Google Scholar] [CrossRef] [Green Version]
- Khan, A.H.; Khan, R.; Saeed, M.; Javed, A. Rheumatoid Arthritis Therapies: Present and Future. Rheum. Arthritis Ther. Pak Armed Forces Med. J. 2017, 67, 483–487. [Google Scholar]
- Smolen, J.S.; Landewé, R.; Breedveld, F.C.; Buch, M.; Burmester, G.; Dougados, M.; Emery, P.; Gaujoux-Viala, C.; Gossec, L.; Nam, J.; et al. EULAR recommendations for the management of rheumatoid arthritis with synthetic and biological disease-modifying antirheumatic drugs: 2013 update. Ann. Rheum. Dis. 2014, 73, 492–509. [Google Scholar] [CrossRef]
- Smolen, J.S.; Landewé, R.; Bijlsma, J.W.J.; Burmester, G.R.; Chatzidionysiou, K.; Dougados, M.; Nam, J.L.; Ramiro, S.; Voshaar, M.; Van Vollenhoven, R.F.; et al. EULAR recommendations for the management of rheumatoid arthritis with synthetic and biological disease-modifying antirheumatic drugs: 2016 update. Ann. Rheum. Dis. 2017, 76, 960–977. [Google Scholar] [CrossRef]
- Ingrasciotta, Y.; Giorgianni, F.; Bolcato, J.; Chinellato, A.; Pirolo, R.; Tari, D.U.; Troncone, C.; Fontana, A.; Ientile, V.; Gini, R.; et al. How Much Are Biosimilars Used in Clinical Practice? A Retrospective Italian Population-Based Study of Erythropoiesis-Stimulating Agents in the Years 2009–2013. BioDrugs 2015, 294, 275–284. [Google Scholar] [CrossRef] [Green Version]
- Gini, R.; Schuemie, M.; Francesconi, P.; Lapi, F.; Cricelli, I.; Pasqua, A.; Gallina, P.; Donato, D.; Brugaletta, S.; Donatini, A.; et al. Can Italian Healthcare Administrative Databases Be Used to Compare Regions with Respect to Compliance with Standards of Care for Chronic Diseases? PLoS ONE 2014, 9, e95419. [Google Scholar] [CrossRef] [Green Version]
- Convertino, I.; Lucenteforte, E.; Gini, R.; Lorenzoni, V.; Cazzato, M.; Turchetti, G.; Trieste, L.; Ferraro, S.; Leonardi, L.; Roberto, G.; et al. Utilisation patterns and clinical impact of the introduction of infliximab-biosimilar in Tuscany, Italy: Real world evidence following the recommendation of switching for non-medical reasons. Clin. Exp. Rheumatol. 2021, 39, 753–762. Available online: https://pubmed.ncbi.nlm.nih.gov/32828145/ (accessed on 1 September 2021).
- Vrijens, B.; De Geest, S.; Hughes, D.; Przemyslaw, K.; Demonceau, J.; Ruppar, T.; Dobbels, F.; Fargher, E.; Morrison, V.; Lewek, P.; et al. A new taxonomy for describing and defining adherence to medications. Br. J. Clin. Pharmacol. 2012, 73, 691–705. [Google Scholar] [CrossRef] [PubMed]
- De Geest, S.; Zullig, L.L.; Dunbar-Jacob, J.; Helmy, R.; Hughes, D.; Wilson, I.B.; Vrijens, B. ESPACOMP Medication Adherence Reporting Guideline (EMERGE). Ann. Intern. Med. 2018, 169, 30–35. [Google Scholar] [CrossRef] [Green Version]
- Dima, A.L.; Allemann, S.S.; Dunbar-Jacob, J.; Hughes, D.A.; Vrijens, B.; Wilson, I.B. TEOS: A framework for constructing operational definitions of medication adherence based on Timelines-Events-Objectives-Sources. Br. J. Clin. Pharmacol. 2021, 87, 2521–2533. [Google Scholar] [CrossRef] [PubMed]
- Chu, L.-H.; Kawatkar, A.A.; Gabriel, S.E. Medication Adherence and Attrition to Biologic Treatment in Rheumatoid Arthritis Patients. Clin. Ther. 2015, 37, 660–666.e8. [Google Scholar] [CrossRef] [PubMed]
- Calip, G.S.; Adimadhyam, S.; Xing, S.; Rincon, J.C.; Lee, W.-J.; Anguiano, R.H. Medication adherence and persistence over time with self-administered TNF-alpha inhibitors among young adult, middle-aged, and older patients with rheumatologic conditions. Semin. Arthritis Rheum. 2017, 47, 157–164. [Google Scholar] [CrossRef] [PubMed]
- Leffondré, K.; Abrahamowicz, M.; Regeasse, A.; Hawker, G.A.; Badley, E.M.; McCusker, J.; Belzile, E. Statistical measures were proposed for identifying longitudinal patterns of change in quantitative health indicators. J. Clin. Epidemiol. 2004, 57, 1049–1062. [Google Scholar] [CrossRef]
- Sylvestre, M.-P.; McCusker, J.; Cole, M.; Regeasse, A.; Belzile, E.; Abrahamowicz, M. Classification of patterns of delirium severity scores over time in an elderly population. Int. Psychogeriatr. 2006, 18, 667–680. [Google Scholar] [CrossRef]
- Li, Y.; Zhou, H.; Cai, B.; Kahler, K.H.; Tian, H.; Gabriel, S.; Arcona, S. Group-based trajectory modeling to assess adherence to biologics among patients with psoriasis. Clin. Outcomes Res. 2014, 6, 197–208. [Google Scholar] [CrossRef] [Green Version]
- Franklin, J.M.; Shrank, W.H.; Pakes, J.; Sanfélix-Gimeno, G.; Matlin, O.S.; Brennan, T.A.; Choudhry, N.K. Group-based Trajectory Models A New Approach to Classifying and Predicting Long-Term Medication Adherence. 2013. Available online: www.lww-medicalcare.com (accessed on 22 November 2018).
- Exploring Efficacy, Safety, and Adherence of Disease-Modifying Antirheumatic DRUGS through Trajectory Model: The PATHFINDER Study. ENCEPP. EU PASS Register #29263. 2019. Available online: http://www.encepp.eu/encepp/viewResource.htm?id=37113 (accessed on 5 December 2021).
- Wang, S.V.; Schneeweiss, S.; Berger, M.L.; Brown, J.; de Vries, F.; Douglas, I.; Gagne, J.J.; Gini, R.; Klungel, O.; Mullins, C.D.; et al. Reporting to Improve Reproducibility and Facilitate Validity Assessment for Healthcare Database Studies V1.0. Pharmacoepidemiol. Drug Saf. 2017, 26, 1018–1032. [Google Scholar] [CrossRef] [Green Version]
- Convertino, I.; Cazzato, M.; Giometto, S.; Gini, R.; Valdiserra, G.; Cappello, E.; Ferraro, S.; Tillati, S.; Bartolini, C.; Paoletti, O.; et al. Validation of algorithms for selecting rheumatoid arthritis patients in the Tuscan healthcare administrative databases. Sci. Rep. 2021, 11, 20314. [Google Scholar] [CrossRef] [PubMed]
- WHO. WHOCC-ATC/DDD Index. Available online: https://www.whocc.no/atc_ddd_index/ (accessed on 30 August 2021).
- Dima, A.L.; Dediu, D. Computation of adherence to medication and visualization of medication histories in R with AdhereR: Towards transparent and reproducible use of electronic healthcare data. PLoS ONE 2017, 12, e0174426. [Google Scholar] [CrossRef]
- Dima, A.; Allemann, S.; Dediu, D. AdhereR: An Open Science Approach to Estimating Adherence to Medications Using Electronic Healthcare Databases. Stud. Health Technol. Inf. 2019, 264, 1451–1452. [Google Scholar] [CrossRef]
- Charrad, M.; Ghazzali, N.; Boiteau, V.; Niknafs, A. Nbclust: An R package for determining the relevant number of clusters in a data set. J. Stat. Softw. 2014, 61, 1–36. [Google Scholar] [CrossRef] [Green Version]
- Sylvestre, M.-P.; Vatnik, D. Using traj Package to Identify Clusters of Longitudinal Trajectories. CRAN Packag. Traj. 2014, 593, 15. [Google Scholar]
- Package ‘Hrbrthemes’ Type Package Title Additional Themes, Theme Components and Utilities for ‘ggplot2’. 2020. Available online: https://orcid.org/0000-0001-5670-2640 (accessed on 5 December 2021).
- Pan, Y.; Norton, S.; Gwinnutt, J.M.; Kearsley-Fleet, L.; Symmons, D.P.M.; Lunt, M.; Young, A.; Hyrich, K.L.; Verstappen, S.M.M. Not all moderate disease is the same–Identification of disability trajectories among patients with rheumatoid arthritis and moderate disease activity. PLoS ONE 2019, 14, e0215999. [Google Scholar] [CrossRef] [PubMed]
- Druce, K.L.; Jones, G.T.; Macfarlane, G.; Verstappen, S.; Basu, N. The Longitudinal Course of Fatigue in Rheumatoid Arthritis: Results from the Norfolk Arthritis Register. J. Rheumatol. 2015, 42, 2059–2065. [Google Scholar] [CrossRef] [PubMed]
- Wabe, N.; Wojciechowski, J.; Wechalekar, M.D.; Cleland, L.G.; McWilliams, L.; Lee, A.; Proudman, S.; Wiese, M.D. Disease activity trajectories in early rheumatoid arthritis following intensive DMARD therapy over 3 years: Association with persistence to therapy. Int. J. Rheum. Dis. 2017, 20, 1447–1456. [Google Scholar] [CrossRef] [PubMed]
- Alhazami, M.; Pontinha, V.M.; Patterson, J.A.; Holdford, D.A. Medication Adherence Trajectories: A Systematic Literature Review. J. Manag. Care Spec. Pharm. 2020, 26, 1138–1152. [Google Scholar] [CrossRef] [PubMed]
- Nørgaard, M.; Ehrenstein, V.; Vandenbroucke, J.P. Confounding in observational studies based on large health care databases: Problems and potential solutions–A primer for the clinician. Clin. Epidemiol. 2017, 9, 185–193. [Google Scholar] [CrossRef] [PubMed] [Green Version]
- Greenberg, J.D.; Reed, G.; Decktor, D.; Harrold, L.; Furst, D.; Gibofsky, A.; DeHoratius, R.; Kishimoto, M.; Kremer, J.M. A comparative effectiveness study of adalimumab, etanercept and infliximab in biologically naive and switched rheumatoid arthritis patients: Results from the US CORRONA registry. Ann. Rheum. Dis. 2012, 71, 1134–1142. [Google Scholar] [CrossRef] [PubMed]
- Hetland, M.L.; Christensen, I.J.; Tarp, U.; Dreyer, L.; Hansen, A.; Hansen, I.T.; Kollerup, G.; Linde, L.; Lindegaard, H.M.; Poulsen, U.E.; et al. Direct comparison of treatment responses, remission rates, and drug adherence in patients with rheumatoid arthritis treated with adalimumab, etanercept, or infliximab: Results from eight years of surveillance of clinical practice in the nationwide Danish. Arthritis Rheum. 2010, 62, 22–32. [Google Scholar] [CrossRef]
- Stolshek, B.S.; Wade, S.; Mutebi, A.; De, A.P.; Wade, R.L.; Yeaw, J. Two-year adherence and costs for biologic therapy for rheumatoid arthritis. Am. J. Manag. Care 2018, 24, 315–321. [Google Scholar]
- van den Bemt, B.J.; Zwikker, H.E.; van den Ende, C.H. Medication adherence in patients with rheumatoid arthritis: A critical appraisal of the existing literature. Expert Rev. Clin. Immunol. 2012, 8, 337–351. [Google Scholar] [CrossRef] [PubMed] [Green Version]
- Leffers, H.C.; Østergaard, M.; Glintborg, B.; Krogh, N.S.; Foged, H.; Tarp, U.; Lorenzen, T.; Hansen, A.; Hansen, M.S.; Jacobsen, M.S.; et al. Efficacy of abatacept and tocilizumab in patients with rheumatoid arthritis treated in clinical practice: Results from the nationwide Danish DANBIO registry. Ann. Rheum. Dis. 2011, 70, 1216–1222. [Google Scholar] [CrossRef]
- Rubbert-Roth, A. Assessing the safety of biologic agents in patients with rheumatoid arthritis. Rheumatology 2012, 51, 38–47. [Google Scholar] [CrossRef] [Green Version]
- Capogrosso Sansone, A.; Mantarro, S.; Tuccori, M.; Ruggiero, E.; Montagnani, S.; Convertino, I.; Marino, A.; Fornai, M.; Antonioli, L.; Corona, T.; et al. Safety Profile of Certolizumab Pegol in Patients with Immune-Mediated Inflammatory Diseases: A Systematic Review and Meta-Analysis. Drug Saf. 2015, 38, 869–888. [Google Scholar] [CrossRef]
- Smolen, J.S.; Landewé, R.; Breedveld, F.C.; Dougados, M.; Emery, P.; Gaujoux-Viala, C.; Gorter, S.; Knevel, R.; Nam, J.; Schoels, M.; et al. EULAR recommendations for the management of rheumatoid arthritis with synthetic and biological disease-modifying antirheumatic drugs. Ann. Rheum. Dis. 2010, 69, 964–975. [Google Scholar] [CrossRef] [PubMed] [Green Version]
- Monti, S.; Klersy, C.; Gorla, R.; Sarzi-Puttini, P.; Atzeni, F.; Pellerito, R.; Fusaro, E.; Paolazzi, G.; Rocchetta, P.A.; Favalli, E.G.; et al. Factors influencing the choice of first- and second-line biologic therapy for the treatment of rheumatoid arthritis: Real-life data from the Italian LORHEN Registry. Clin. Rheumatol. 2017, 36, 753–761. [Google Scholar] [CrossRef] [PubMed] [Green Version]
- Iannone, F.; Santo, L.; Anelli, M.G.; Bucci, R.; Semeraro, A.; Quarta, L.; D’Onofrio, F.; Marsico, A.; Carlino, G.; Casilli, O.; et al. Golimumab in real-life settings: 2 Years drug survival and predictors of clinical outcomes in rheumatoid arthritis, spondyloarthritis, and psoriatic arthritis. Semin Arthritis Rheum. 2017, 47, 108–114. [Google Scholar] [CrossRef] [PubMed]
- Pombo-Suarez, M.; Sanchez-Piedra, C.; Garcia-Magallón, B.; Pérez-Gómez, A.; Manrique-Arija, S.; Martín-Doménech, R.; Colazo, M.; Campos, C.; Campos, J.; del Pino-Montes, J.; et al. Factors associated with long-term retention of treatment with golimumab in rheumatoid arthritis, axial spondyloarthritis, and psoriatic arthritis: An analysis of the Spanish BIOBADASER registry. Clin. Rheumatol. 2021, 40, 3979–3988. [Google Scholar] [CrossRef] [PubMed]
- Aifa. National Report on Medicines Use in Italy—Year 2015. 2015. Available online: www.agenziafarmaco.gov.it (accessed on 7 September 2021).
- Aifa. National Report on Medicines Use in Italy—Year 2014. 2014. Available online: www.agenziafarmaco.gov.it (accessed on 7 September 2021).


| Baseline Characteristics | n (%) |
|---|---|
| Overall sample | 952 |
| Gender | |
| Female | 712 (74.8) |
| Age, years | |
| mean (SD) | 52.7 (18.8) |
| Categories | |
| 0–20 | 90 (9.5) |
| 21–40 | 117 (12.3) |
| 41–50 | 143 (15.0) |
| 51–60 | 227 (23.8) |
| 61–70 | 218 (22.9) |
| 71–80 | 136 (14.3) |
| 81–100 | 21 (2.2) |
| Comorbidities | |
| Lung disease | 17 (1.8) |
| Myocardial infarction | 3 (0.3) |
| Stroke | 6 (0.6) |
| Hypertension | 27 (2.8) |
| Other CV diseases | 35 (3.7) |
| Diabetes | 29 (3.0) |
| Fractures | 12 (1.3) |
| Depression | 1 (0.1) |
| Gastrointestinal ulcer | 0 (0.0) |
| Other gastrointestinal disorders | 8 (0.8) |
| Sjögren’s syndrome | 5 (0.5) |
| Rheumatoid nodules | 0 (0.0) |
| Myopathies | 1 (0.1) |
| Polyneuropathy | 2 (0.2) |
| Cancer | 13 (1.4) |
| Additional immune-mediated disorders | 62 (6.5) |
| Concomitant therapies | |
| Glucocorticoid for systemic use | 757 (79.5) |
| Non-Steroidal Anti-Inflammatory Drugs | 628 (66.0) |
| Opioid analgesics | 289 (30.4) |
| Conventional synthetic DMARDs | 837 (87.9) |
| Index drug | |
| Abatacept | 86 (9.0) |
| Etanercept | 387 (40.7) |
| Infliximab | 37 (3.9) |
| Adalimumab | 233 (24.5) |
| Certolizumab pegol | 79 (8.3) |
| Golimumab | 66 (6.9) |
| Tocilizumab | 64 (6.7) |
| Baseline Characteristics | Trajectories | |||
|---|---|---|---|---|
| Fully-Adherent Users | Continuous Users | Early-Discontinuing Users | p-Value | |
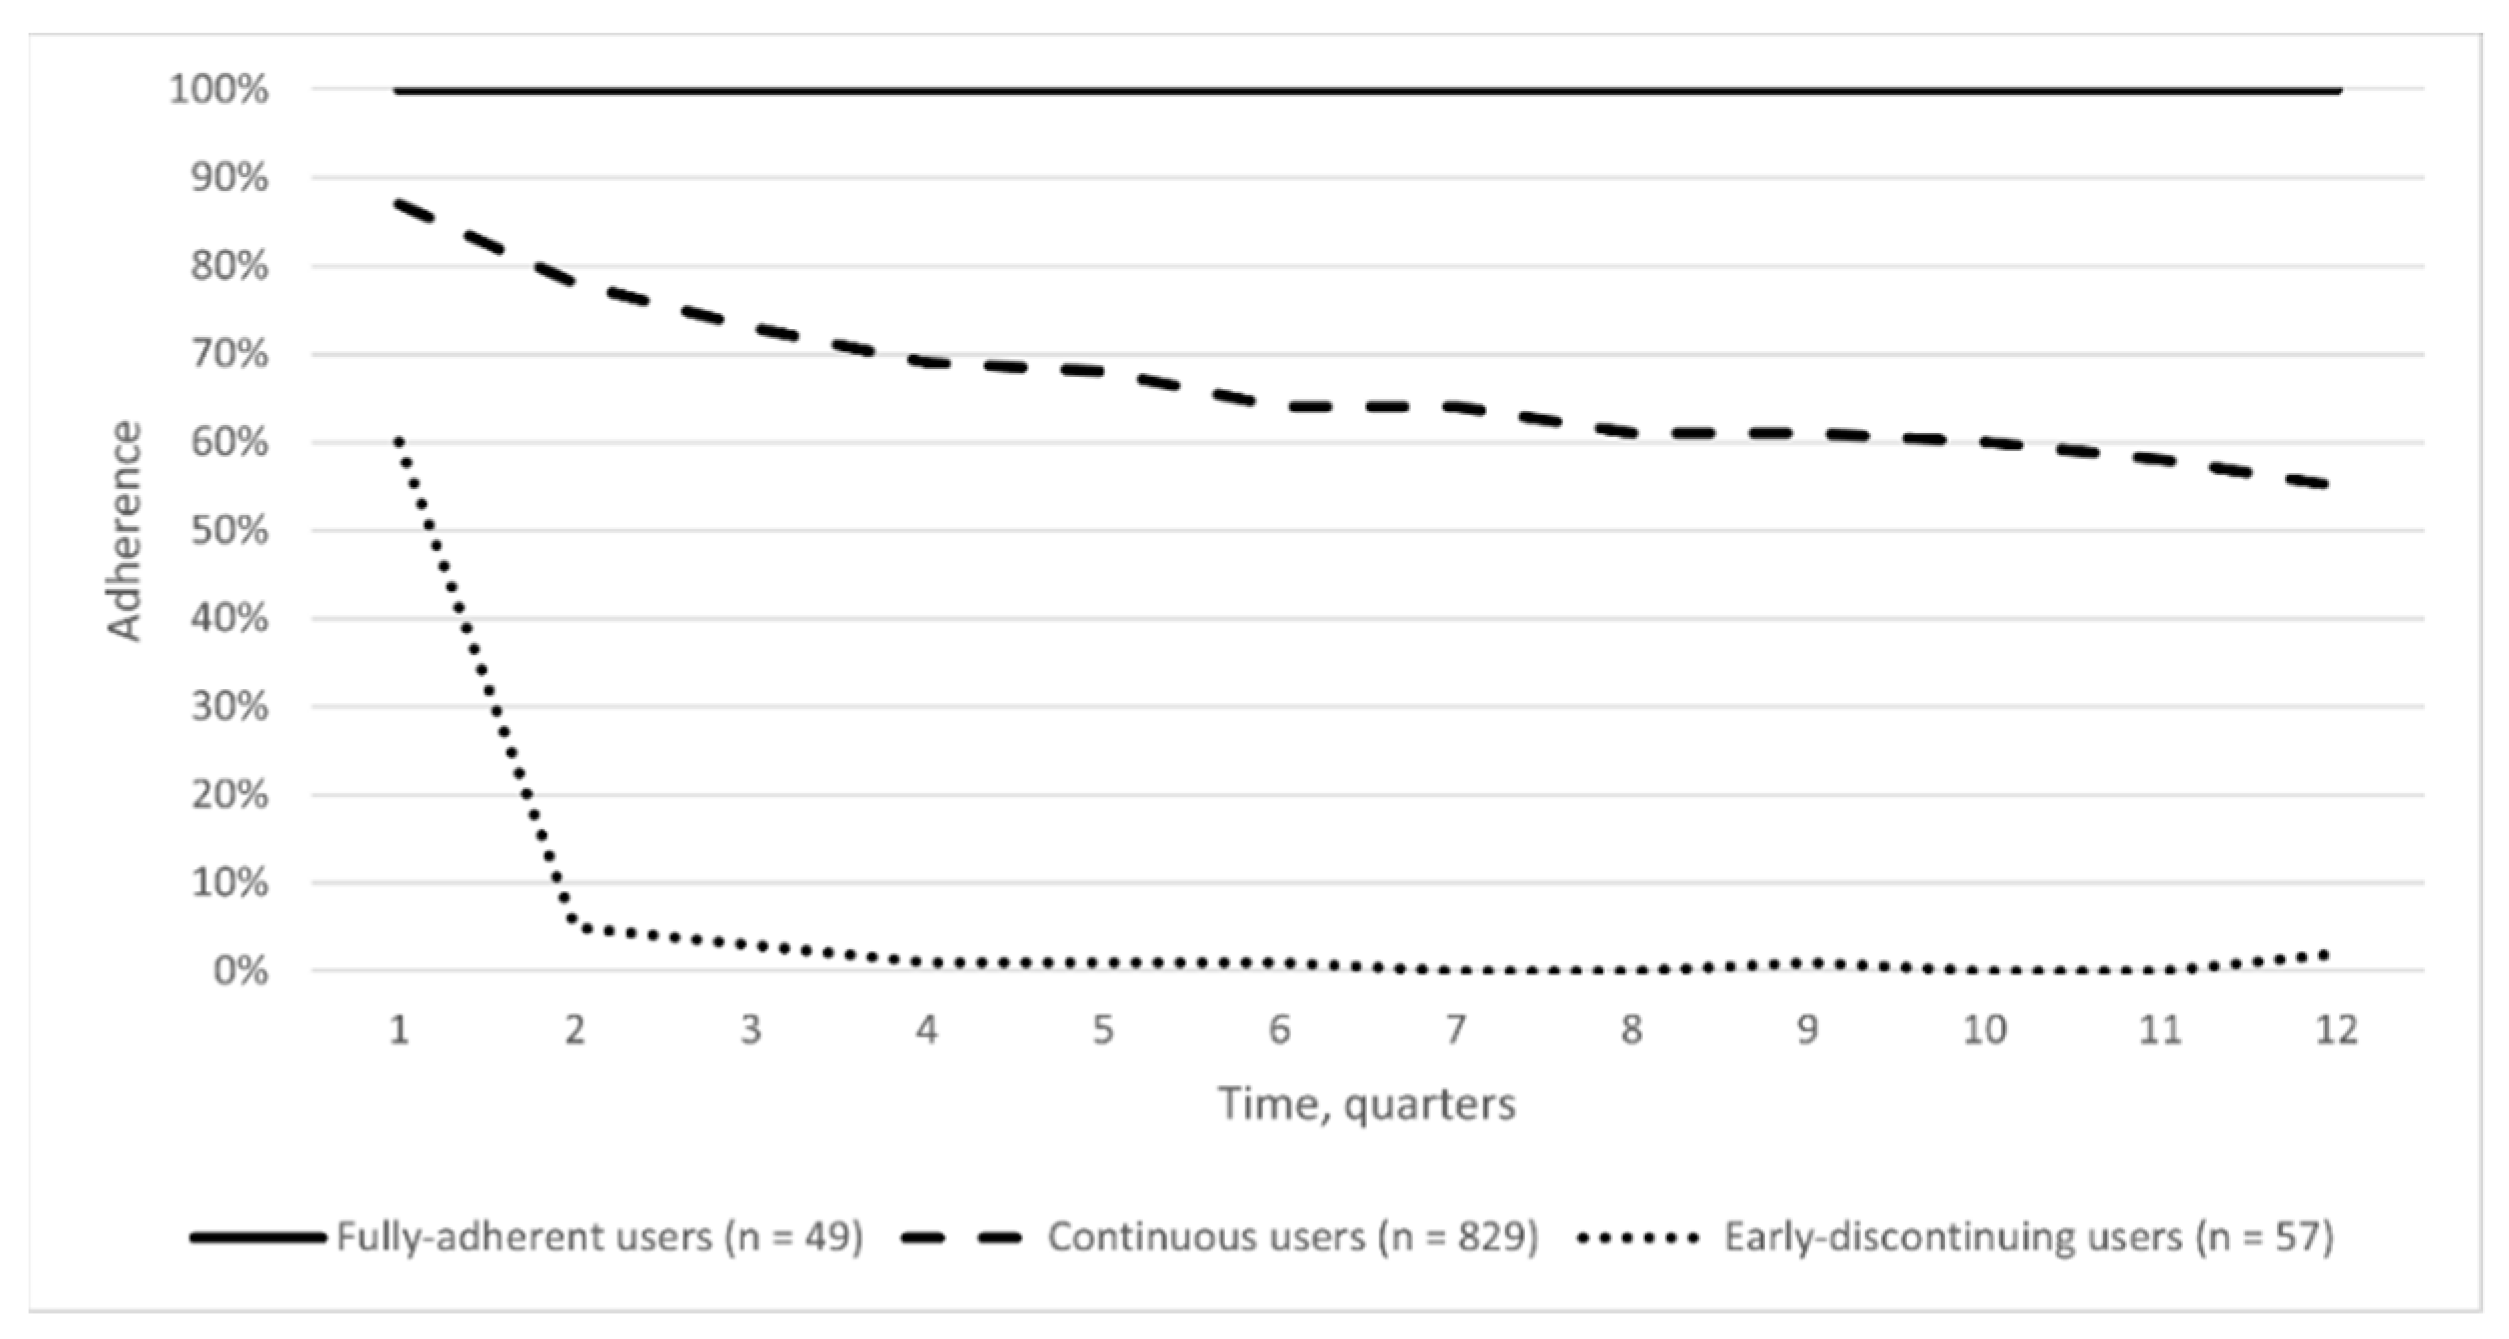
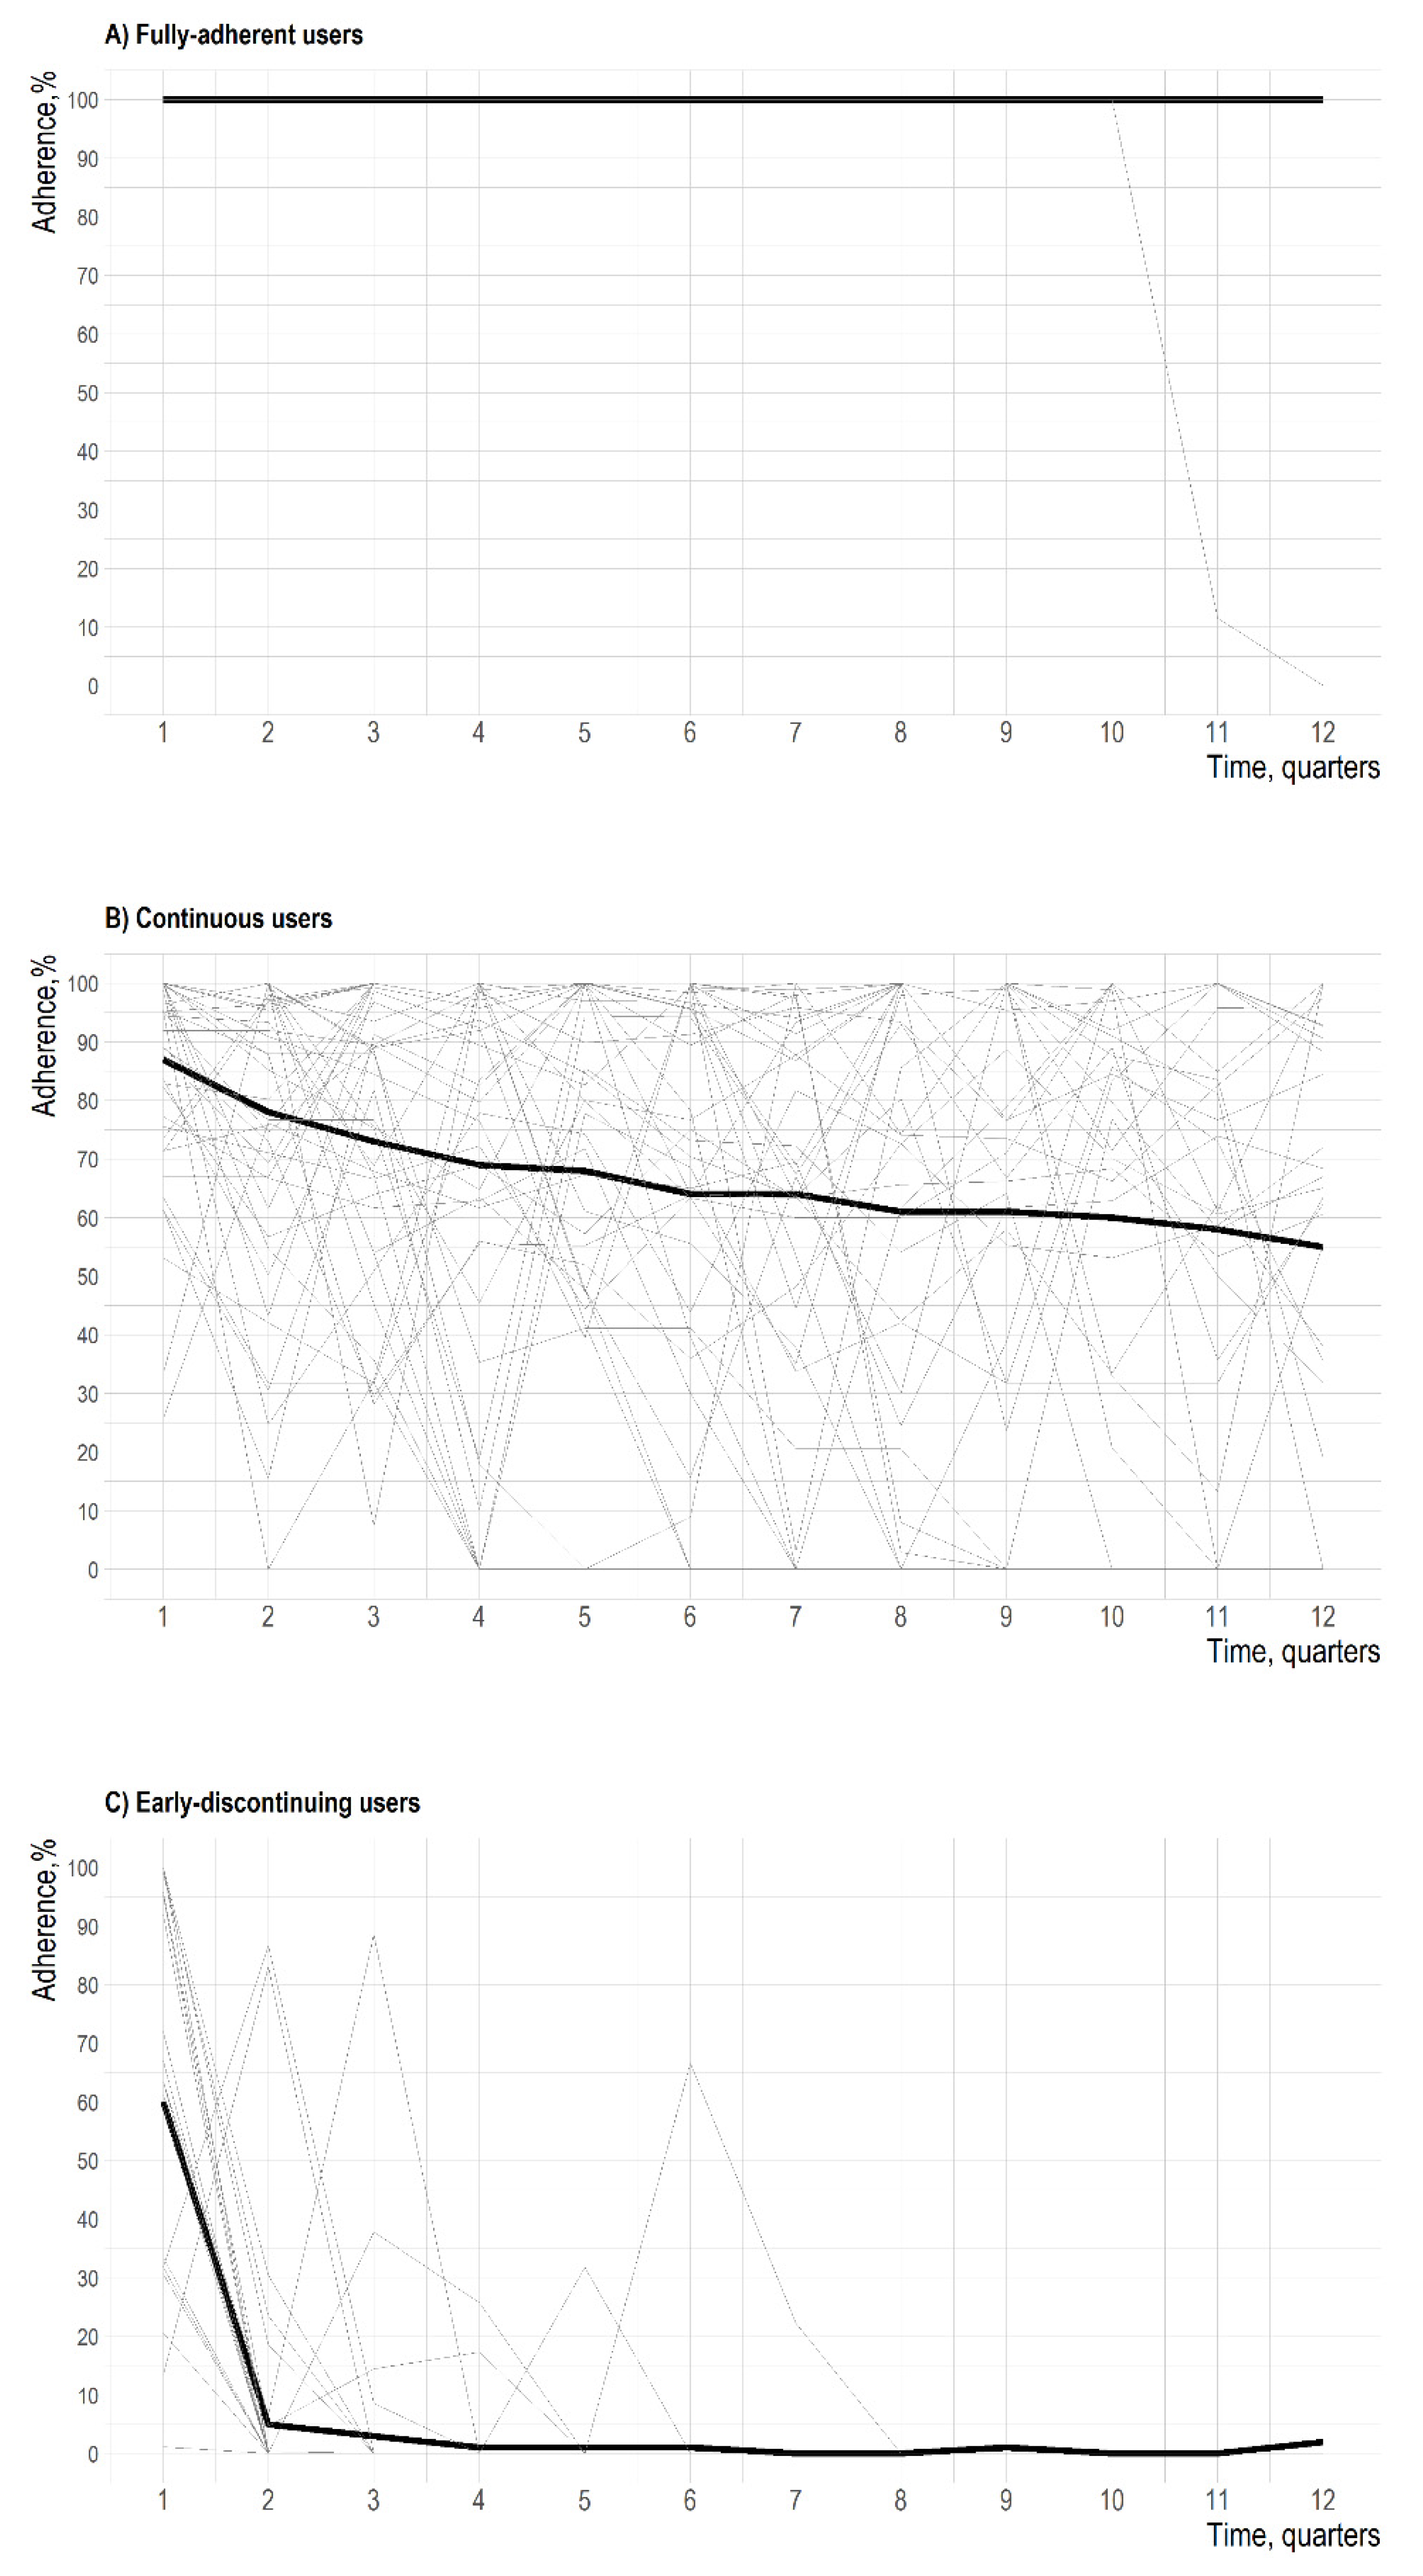
| Overall sample. n (%) | 49 | 829 | 57 | |
| Gender. n (%) | ||||
| Female | 35 (71.4) | 620 (74.8) | 45 (78.9) | 0.665 |
| Age. years | ||||
| mean (SD) | 51.8 (17.5) | 52.3 (18.8) | 57.5 (17.0) | 0.114 |
| Categories. n (%) | 0.166 | |||
| 0–20 | 3 (6.1) | 84 (10.1) | 3 (5.3) | |
| 21–40 | 9 (18.4) | 100 (12.1) | 5 (8.8) | |
| 41–50 | 8 (16.3) | 123 (14.8) | 11 (19.3) | |
| 51–60 | 14 (28.6) | 200 (24.1) | 10 (17.5) | |
| 61–70 | 7 (14.3) | 195 (23.5) | 15 (26.3) | |
| 71–80 | 7 (14.3) | 114 (13.8) | 9 (15.8) | |
| 81–100 | 1 (2.0) | 13 (1.6) | 4 (7.0) | |
| Index date year. n (%) | 0.660 | |||
| 2010 | 7 (14.3) | 109 (13.1) | 11 (19.3) | |
| 2011 | 7 (14.3) | 138 (16.6) | 8 (14.0) | |
| 2012 | 6 (12.2) | 142 (17.1) | 11 (19.3) | |
| 2013 | 11 (22.4) | 126 (15.2) | 8 (14.0) | |
| 2014 | 9 (18.4) | 167 (20.1) | 6 (10.5) | |
| 2015 | 9 (18.4) | 147 (17.7) | 13 (22.8) | |
| Comorbidities. n (%) | ||||
| Lung disease | 0 (0.0) | 16 (1.9) | 1 (1.8) | 0.617 |
| Myocardial infarction | 0 (0.0) | 2 (0.2) | 0 (0.0) | 0.880 |
| Other CV diseases | 2 (4.1) | 28 (3.4) | 3 (5.3) | 0.740 |
| Stroke | 0 (0.0) | 6 (0.7) | 0 (0.0) | 0.680 |
| Hypertension | 0 (0.0) | 25 (3.0) | 0 (0.0) | 0.194 |
| Diabetes | 4 (8.2) | 24 (2.9) | 0 (0.0) | 0.043 |
| Fractures | 0 (0.0) | 10 (1.2) | 0 (0.0) | 0.524 |
| Depression | 0 (0.0) | 1 (0.1) | 0 (0.0) | 0.938 |
| Gastrointestinal ulcer | 0 (0.0) | 0 (0.0) | 0 (0.0) | NA |
| Other gastrointestinal disorders | 0 (0.0) | 6 (0.7) | 2 (3.5) | 0.070 |
| Sjögren’s syndrome | 0 (0.0) | 5 (0.6) | 0 (0.0) | 0.725 |
| Rheumatoid nodules | 0 (0.0) | 0 (0.0) | 0 (0.0) | NA |
| Myopathies | 0 (0.0) | 1 (0.1) | 0 (0.0) | 0.938 |
| Polyneuropathy | 0 (0.0) | 2 (0.2) | 0 (0.0) | 0.880 |
| Additional immune-mediated disorders | 4 (8.2) | 54 (6.5) | 2 (3.5) | 0.587 |
| Cancer | 1 (2.0) | 11 (1.3) | 1 (1.8) | 0.891 |
| Concomitant therapies. n (%) | ||||
| Glucocorticoid | 42 (85.7) | 657 (79.3) | 43 (75.4) | 0.417 |
| Non-steroidal anti-inflammatory drugs | 29 (59.2) | 546 (65.9) | 42 (73.7) | 0.284 |
| Opioid analgesic | 18 (36.7) | 246 (29.7) | 15 (26.3) | 0.482 |
| Conventional synthetic DMARDs | 43 (87.8) | 728 (87.8) | 50 (87.7) | 1.000 |
| Index drug. n (%) | ||||
| Abatacept | 0 (0.0) | 83 (10.0) | 2 (3.5) | 0.019 |
| Etanercept | 11 (22.4) | 348 (42.0) | 24 (42.1) | 0.026 |
| Infliximab | 13 (26.5) | 19 (2.3) | 5 (8.8) | <0.001 |
| Adalimumab | 8 (16.3) | 206 (24.8) | 12 (21.1) | 0.340 |
| Certolizumab pegol | 12 (24.5) | 62 (7.5) | 2 (3.5) | <0.001 |
| Golimumab | 1 (2.0) | 56 (6.8) | 8 (14.0) | 0.043 |
| Tocilizumab | 4 (8.2) | 55 (6.6) | 4 (7.0) | 0.914 |
Publisher’s Note: MDPI stays neutral with regard to jurisdictional claims in published maps and institutional affiliations. |
© 2021 by the authors. Licensee MDPI, Basel, Switzerland. This article is an open access article distributed under the terms and conditions of the Creative Commons Attribution (CC BY) license (https://creativecommons.org/licenses/by/4.0/).
Share and Cite
Convertino, I.; Giometto, S.; Gini, R.; Cazzato, M.; Fornili, M.; Valdiserra, G.; Cappello, E.; Ferraro, S.; Bartolini, C.; Paoletti, O.; et al. Trajectories of Adherence to Biologic Disease-Modifying Anti-Rheumatic Drugs in Tuscan Administrative Databases: The Pathfinder Study. J. Clin. Med. 2021, 10, 5743. https://doi.org/10.3390/jcm10245743
Convertino I, Giometto S, Gini R, Cazzato M, Fornili M, Valdiserra G, Cappello E, Ferraro S, Bartolini C, Paoletti O, et al. Trajectories of Adherence to Biologic Disease-Modifying Anti-Rheumatic Drugs in Tuscan Administrative Databases: The Pathfinder Study. Journal of Clinical Medicine. 2021; 10(24):5743. https://doi.org/10.3390/jcm10245743
Chicago/Turabian StyleConvertino, Irma, Sabrina Giometto, Rosa Gini, Massimiliano Cazzato, Marco Fornili, Giulia Valdiserra, Emiliano Cappello, Sara Ferraro, Claudia Bartolini, Olga Paoletti, and et al. 2021. "Trajectories of Adherence to Biologic Disease-Modifying Anti-Rheumatic Drugs in Tuscan Administrative Databases: The Pathfinder Study" Journal of Clinical Medicine 10, no. 24: 5743. https://doi.org/10.3390/jcm10245743
APA StyleConvertino, I., Giometto, S., Gini, R., Cazzato, M., Fornili, M., Valdiserra, G., Cappello, E., Ferraro, S., Bartolini, C., Paoletti, O., Tillati, S., Baglietto, L., Turchetti, G., Trieste, L., Lorenzoni, V., Blandizzi, C., Mosca, M., Tuccori, M., & Lucenteforte, E. (2021). Trajectories of Adherence to Biologic Disease-Modifying Anti-Rheumatic Drugs in Tuscan Administrative Databases: The Pathfinder Study. Journal of Clinical Medicine, 10(24), 5743. https://doi.org/10.3390/jcm10245743