
Early Identification of Resuscitated Patients with a Significant Coronary Disease in Out-of-Hospital Cardiac Arrest Survivors without ST-Segment Elevation

 ,
,  ,
,  ,
,  and
and
Abstract
:1. Introduction
2. Materials and Methods
2.1. Study Design
2.2. Population and Variables
2.3. ML Algorithms
2.4. Statistical Methods
3. Results
3.1. Baseline Statistics
3.2. Model Performance and Validation
4. Discussion
5. Conclusions
Supplementary Materials
Author Contributions
Funding
Institutional Review Board Statement
Informed Consent Statement
Data Availability Statement
Acknowledgments
Conflicts of Interest
References
- Spaulding, C.M.; Joly, L.-M.; Rosenberg, A.; Monchi, M.; Weber, S.N.; Dhainaut, J.-F.A.; Carli, P. Immediate coronary angiography in survivors of out-of-hospital cardiac arrest. N. Engl. J. Med. 1997, 336, 1629–1633. [Google Scholar] [CrossRef]
- Yannopoulos, D.; Bartos, J.A.; Aufderheide, T.P.; Callaway, C.W.; Deo, R.; Garcia, S.; Halperin, H.R.; Kern, K.B.; Kudenchuk, P.J.; Neumar, R.W.; et al. The Evolving Role of the Cardiac Catheterization Laboratory in the Management of Patients with Out-of-Hospital Cardiac Arrest: A Scientific Statement from the American Heart Association. Circulation 2019, 139, e530–e552. [Google Scholar] [CrossRef]
- Panchal, A.R.; Bartos, J.A.; Cabañas, J.G.; Donnino, M.W.; Drennan, I.R.; Hirsch, K.G.; Kudenchuk, P.J.; Kurz, M.C.; Lavonas, E.J.; Morley, P.T.; et al. Part 3: Adult Basic and Advanced Life Support: 2020 American Heart Association Guidelines for Cardiopulmonary Resuscitation and Emergency Cardiovascular Care. Circulation 2020, 142, S366–S468. [Google Scholar] [CrossRef]
- Nolan, J.P.; Soar, J.; Cariou, A.; Cronberg, T.; Moulaert, V.R.; Deakin, C.D.; Bottiger, B.W.; Friberg, H.; Sunde, K.; Sandroni, C. European resuscitation council and European society of intensive care medicine 2015 guidelines for post-resuscitation care. Intensive Care Med. 2015, 41, 2039–2056. [Google Scholar] [CrossRef]
- Liu, R.; Greenstein, J.L.; Granite, S.J.; Fackler, J.C.; Bembea, M.M.; Sarma, S.V.; Winslow, R.L. Data-driven discovery of a novel sepsis pre-shock state predicts impending septic shock in the ICU. Sci. Rep. 2019, 9, 1–9. [Google Scholar]
- Seo, D.-W.; Yi, H.; Park, B.; Kim, Y.-J.; Jung, D.H.; Woo, I.; Sohn, C.H.; Ko, B.S.; Kim, N.; Kim, W.Y. Prediction of Adverse Events in Stable Non-Variceal Gastrointestinal Bleeding Using Machine Learning. J. Clin. Med. 2020, 9, 2603. [Google Scholar] [CrossRef]
- Seo, D.-W.; Yi, H.; Bae, H.-J.; Kim, Y.-J.; Sohn, C.-H.; Ahn, S.; Lim, K.-S.; Kim, N.; Kim, W.-Y. Prediction of Neurologically Intact Survival in Cardiac Arrest Patients without Pre-Hospital Return of Spontaneous Circulation: Machine Learning Approach. J. Clin. Med. 2021, 10, 1089. [Google Scholar] [CrossRef]
- Salehi, F.; Abbasi, E.; Hassibi, B. The Impact of Regularization on High-dimensional Logistic Regression. arXiv 2019, arXiv:1906.03761. [Google Scholar]
- Breiman, L. Random forests. Mach. Learn. 2001, 45, 5–32. [Google Scholar] [CrossRef] [Green Version]
- Prokhorenkova, L.; Gusev, G.; Vorobev, A.; Dorogush, A.V.; Gulin, A. CatBoost: Unbiased boosting with categorical features. In Proceedings of the Advances in Neural Information Processing Systems, Montreal Convention Centre, Montreal, QC, Canada, 3 December 2018; pp. 6639–6649. [Google Scholar]
- Maclin, R.; Opitz, D. Popular Ensemble Methods: An Empirical Study. arXiv 2011, arXiv:1106.0257. Available online: https://ui.adsabs.harvard.edu/abs/2011arXiv1106.0257M (accessed on 29 November 2021).
- Kursa, M.B.; Rudnicki, W.R. Feature selection with the Boruta package. J. Stat. Softw. 2010, 36, 1–13. [Google Scholar] [CrossRef] [Green Version]
- Cadima, J.F.; Jolliffe, I.T. Variable selection and the interpretation of principal subspaces. J. Agric. Biol. Environ. Stat. 2001, 6, 62–79. [Google Scholar] [CrossRef]
- McInnes, L.; Healy, J.; Melville, J. Umap: Uniform manifold approximation and projection for dimension reduction. arXiv 2018, arXiv:1802.03426. Available online: https://arxiv.org/abs/1802.03426 (accessed on 29 November 2021).
- Bergstra, J.; Bengio, Y. Random search for hyper-parameter optimization. J. Mach. Learn. Res. 2012, 13, 281–305. [Google Scholar]
- Van Rossum, G.; Drake, F.L., Jr. Python Tutorial; Centrum voor Wiskunde en Informatica: Amsterdam, The Netherlands, 1995; Volume 620. [Google Scholar]
- Oliphant, T.E. A Guide to NumPy; Trelgol Publishing: New York, NY, USA, 2006; Volume 1. [Google Scholar]
- Pedregosa, F.; Varoquaux, G.; Gramfort, A.; Michel, V.; Thirion, B.; Grisel, O.; Blondel, M.; Prettenhofer, P.; Weiss, R.; Dubourg, V. Scikit-learn: Machine learning in Python. J. Mach. Learn. Res. 2011, 12, 2825–2830. [Google Scholar]
- McKinney, W. Pandas: A foundational Python library for data analysis and statistics. Python High Perform. Sci. Comput. 2011, 14, 1–9. [Google Scholar]
- Virtanen, P.; Gommers, R.; Oliphant, T.E.; Haberland, M.; Reddy, T.; Cournapeau, D.; Burovski, E.; Peterson, P.; Weckesser, W.; Bright, J. SciPy 1.0: Fundamental algorithms for scientific computing in Python. Nat. Methods 2020, 17, 261–272. [Google Scholar] [CrossRef] [PubMed] [Green Version]
- Hunter, J.D. Matplotlib: A 2D graphics environment. Comput. Sci. Eng. 2007, 9, 90–95. [Google Scholar] [CrossRef]
- Lundberg, S.M.; Lee, S.-I. A unified approach to interpreting model predictions. In Proceedings of the 31st International Conference on Neural Information Processing Systems, Long Beach, CA, USA, 4 December 2017; pp. 4768–4777. [Google Scholar]
- Olson, R.S.; Moore, J.H. TPOT: A tree-based pipeline optimization tool for automating machine learning. In Proceedings of the Workshop on Automatic Machine Learning, New York, NY, USA, 24 June 2016; Volume 64, pp. 66–74. [Google Scholar]
- Moez, A. PyCaret: An Open Source, Low-Code Machine Learning Library in Python. Available online: https://www.pycaret.org (accessed on 1 May 2021).
- Little, R.J. A test of missing completely at random for multivariate data with missing values. J. Am. Stat. Assoc. 1988, 83, 1198–1202. [Google Scholar] [CrossRef]
- Van Buuren, S.; Groothuis-Oudshoorn, K. mice: Multivariate imputation by chained equations in R. J. Stat. Softw. 2011, 45, 1–67. [Google Scholar] [CrossRef] [Green Version]
- R Core Team. R: A Language and Environment for Statistical Computing; R Foundation for Statistical Computing: Vienna, Austria, 2013. [Google Scholar]
- What’s Considered a Good Log Loss? Available online: https://stats.stackexchange.com/questions/276067/whats-considered-a-good-log-loss (accessed on 1 May 2021).
- Kerr, K.F.; Wang, Z.; Janes, H.; McClelland, R.L.; Psaty, B.M.; Pepe, M.S. Net reclassification indices for evaluating risk-prediction instruments: A critical review. Epidemiology 2014, 25, 114. [Google Scholar] [CrossRef] [Green Version]
- Dumas, F.; Cariou, A.; Manzo-Silberman, S.; Grimaldi, D.; Vivien, B.; Rosencher, J.; Empana, J.-P.; Carli, P.; Mira, J.-P.; Jouven, X. Immediate percutaneous coronary intervention is associated with better survival after out-of-hospital cardiac arrest: Insights from the PROCAT (Parisian Region Out of hospital Cardiac ArresT) registry. Circ. Cardiovasc. Interv. 2010, 3, 200–207. [Google Scholar] [CrossRef] [Green Version]
- Kern, K.B.; Lotun, K.; Patel, N.; Mooney, M.R.; Hollenbeck, R.D.; McPherson, J.A.; McMullan, P.W.; Unger, B.; Hsu, C.-H.; Seder, D.B. Outcomes of comatose cardiac arrest survivors with and without ST-segment elevation myocardial infarction: Importance of coronary angiography. JACC Cardiovasc. Interv. 2015, 8, 1031–1040. [Google Scholar] [CrossRef] [Green Version]
- Garcia, S.; Drexel, T.; Bekwelem, W.; Raveendran, G.; Caldwell, E.; Hodgson, L.; Wang, Q.; Adabag, S.; Mahoney, B.; Frascone, R. Early access to the cardiac catheterization laboratory for patients resuscitated from cardiac arrest due to a shockable rhythm: The Minnesota Resuscitation Consortium Twin Cities Unified Protocol. J. Am. Heart Assoc. 2016, 5, e002670. [Google Scholar] [CrossRef] [Green Version]
- Patel, N.; Patel, N.J.; Macon, C.J.; Thakkar, B.; Desai, M.; Rengifo-Moreno, P.; Alfonso, C.E.; Myerburg, R.J.; Bhatt, D.L.; Cohen, M.G. Trends and outcomes of coronary angiography and percutaneous coronary intervention after out-of-hospital cardiac arrest associated with ventricular fibrillation or pulseless ventricular tachycardia. JAMA Cardiol. 2016, 1, 890–899. [Google Scholar] [CrossRef] [PubMed]
- Kim, Y.-J.; Kim, Y.H.; Lee, B.K.; Park, Y.S.; Sim, M.S.; Kim, S.J.; Oh, S.H.; Lee, D.H.; Kim, W.Y. Immediate versus early coronary angiography with targeted temperature management in out-of-hospital cardiac arrest survivors without ST-segment elevation: A propensity score-matched analysis from a multicenter registry. Resuscitation 2019, 135, 30–36. [Google Scholar] [CrossRef] [PubMed]
- Waldo, S.W.; Chang, L.; Strom, J.B.; O’Brien, C.; Pomerantsev, E.; Yeh, R.W. Predicting the presence of an acute coronary lesion among patients resuscitated from cardiac arrest. Circ. Cardiovasc. Interv. 2015, 8, e002198. [Google Scholar] [CrossRef]
- Harhash, A.A.; May, T.L.; Hsu, C.-H.; Agarwal, S.; Seder, D.B.; Mooney, M.R.; Patel, N.; McPherson, J.; McMullan, P.; Riker, R. Risk stratification among survivors of cardiac arrest considered for coronary angiography. J. Am. Coll. Cardiol. 2021, 77, 360–371. [Google Scholar] [CrossRef]
- Hosmane, V.R.; Mustafa, N.G.; Reddy, V.K.; Reese, C.L.; DiSabatino, A.; Kolm, P.; Hopkins, J.T.; Weintraub, W.S.; Rahman, E. Survival and neurologic recovery in patients with ST-segment elevation myocardial infarction resuscitated from cardiac arrest. J. Am. Coll. Cardiol. 2009, 53, 409–415. [Google Scholar] [CrossRef] [Green Version]
- Khan, M.S.; Shah, S.M.M.; Mubashir, A.; Khan, A.R.; Fatima, K.; Schenone, A.L.; Khosa, F.; Samady, H.; Menon, V. Early coronary angiography in patients resuscitated from out of hospital cardiac arrest without ST-segment elevation: A systematic review and meta-analysis. Resuscitation 2017, 121, 127–134. [Google Scholar] [CrossRef]
- Callaway, C.W.; Donnino, M.W.; Fink, E.L.; Geocadin, R.G.; Golan, E.; Kern, K.B.; Leary, M.; Meurer, W.J.; Peberdy, M.A.; Thompson, T.M. Part 8: Post–cardiac arrest care: 2015 American Heart Association guidelines update for cardiopulmonary resuscitation and emergency cardiovascular care. Circulation 2015, 132, S465–S482. [Google Scholar] [CrossRef] [Green Version]
- Lemkes, J.S.; Janssens, G.N.; van der Hoeven, N.W.; Jewbali, L.S.D.; Dubois, E.A.; Meuwissen, M.; Rijpstra, T.A.; Bosker, H.A.; Blans, M.J.; Bleeker, G.B.; et al. Coronary Angiography after Cardiac Arrest without ST-Segment Elevation. N. Engl. J. Med. 2019, 380, 1397–1407. [Google Scholar] [CrossRef]
- Desch, S.; Freund, A.; Akin, I.; Behnes, M.; Preusch, M.R.; Zelniker, T.A.; Skurk, C.; Landmesser, U.; Graf, T.; Eitel, I.; et al. Angiography after Out-of-Hospital Cardiac Arrest without ST-Segment Elevation. N. Engl. J. Med. 2021. Epub ahead of print. [Google Scholar] [CrossRef]
- Bascom, K.E.; Dziodzio, J.; Vasaiwala, S.; Mooney, M.; Patel, N.; McPherson, J.; McMullan, P.; Unger, B.; Nielsen, N.; Friberg, H. Derivation and validation of the CREST model for very early prediction of circulatory etiology death in patients without ST-segment–elevation myocardial infarction after cardiac arrest. Circulation 2018, 137, 273–282. [Google Scholar] [CrossRef]
- Rab, T.; Kern, K.B.; Tamis-Holland, J.E.; Henry, T.D.; McDaniel, M.; Dickert, N.W.; Cigarroa, J.E.; Keadey, M.; Ramee, S.; Interventional Council, American College of Cardiology. Cardiac arrest: A treatment algorithm for emergent invasive cardiac procedures in the resuscitated comatose patient. J. Am. Coll. Cardiol. 2015, 66, 62–73. [Google Scholar] [CrossRef] [Green Version]
- Noh, Y.-K.; Park, J.Y.; Choi, B.G.; Kim, K.-E.; Rha, S.-W. A machine learning-based approach for the prediction of acute coronary syndrome requiring revascularization. J. Med. Syst. 2019, 43, 1–8. [Google Scholar] [CrossRef]
- Zheng, A.; Casari, A. Feature Engineering for Machine Learning: Principles and Techniques for Data Scientists; O’Reilly Media, Inc.: Newton, MA, USA, 2018. [Google Scholar]

| Variables | Significant Lesion (n = 127) | No Significant Lesion (n = 204) | p-Value | Missing Value Ratio (%) |
|---|---|---|---|---|
| Age, years | 63.4 ± 11.93 | 52.7 ± 14.27 | <0.001 | 0 |
| Male sex | 107 (84.3%) | 149 (73.0%) | 0.03 | 0 |
| Comorbid disease | ||||
| Previous arrest | 1 (0.79%) | 3 (1.47%) | 0.97 | 0 |
| Previous acute myocardial infarction | 20 (15.8%) | 11 (5.39%) | 0.003 | 0 |
| Previous angina | 11 (8.66%) | 20 (9.80%) | 0.88 | 0 |
| Previous arrhythmia | 7 (5.51%) | 11 (5.39%) | 0.84 | 0 |
| Chronic heart failure | 3 (2.36%) | 7 (3.43%) | 0.82 | 0 |
| Previous transient ischemic attack (TIA) or stroke | 8 (6.30%) | 5 (2.45%) | 0.14 | 0 |
| Hypertension | 55 (43.3%) | 66 (32.4%) | 0.06 | 0 |
| Diabetes mellitus | 36 (28.4%) | 36 (17.7%) | 0.03 | 0 |
| Pulmonary disease | 0 (0%) | 2 (0.98%) | 0.70 | 0 |
| Neurologic disease other than cerebrovascular accident (CVA) | 4 (3.15%) | 3 (1.47%) | 0.52 | 0 |
| Chronic kidney disease | 11 (8.66%) | 4 (1.96%) | 0.01 | 0 |
| Malignancy | 3 (2.36%) | 13 (6.37%) | 0.16 | 0 |
| Previous percutaneous coronary intervention (PCI) | 9 (7.09%) | 7 (3.43%) | 0.21 | 0 |
| Previous coronary artery bypass grafting (CABG) | 5 (3.94%) | 2 (0.98%) | 0.15 | 0 |
| Previous ischemic heart disease | 24 (18.9%) | 17 (8.33%) | 0.008 | 0 |
| Family history of | ||||
| cardiac arrest | 1 (0.790%) | 4 (1.96%) | 0.70 | 0 |
| Angina or acute myocardial infarction (AMI) | 5 (3.94%) | 6 (2.94%) | 0.86 | 0 |
| CVA | 1 (0.790%) | 5 (2.45%) | 0.50 | 0 |
| Arrhythmia | 0 (0%) | 3 (1.47%) | 0.44 | 0 |
| Unknown | 110 (86.6%) | 169 (82.8%) | 0.45 | 0 |
| arrest characteristics | ||||
| Initial shockable rhythm | 91 (71.7%) | 148 (72.6%) | 0.87 | 6.0 |
| Witnessed | 107 (84.3%) | 165 (80.9%) | 0.43 | 0.3 |
| Bystander cardiopulmonary resuscitation (CPR) | 83 (65.4%) | 138 (67.7%) | 0.94 | 1.2 |
| Total collapse duration, min | 21.0 (13.0–35.0) | 23.0 (15.0–36.3) | 0.38 | 0 |
| Total doses of epinephrine, mg | 2.44 ± 3.91 | 2.13 ± 4.00 | 0.52 | 10.6 |
| Immediate electrocardiogram (ECG) findings | ||||
| ST-segment depression | 69 (54.3%) | 141 (69.1%) | 0.009 | 0 |
| Right bundle branch block | 95 (74.8%) | 170 (83.3%) | 0.08 | 0 |
| Non-specific ST-segment or T wave changes | 93 (73.2%) | 129 (63.2%) | 0.08 | 0 |
| Normal ST-segment and T wave | 112 (88.2%) | 164 (80.4%) | 0.09 | 0 |
| Immediate laboratory findings | ||||
| Artery blood gas analysis, pH | 7.13 ± 0.181 | 7.17 ± 0.184 | 0.07 | 4.5 |
| Lactate, mg/dL | 8.66 ± 4.830 | 8.41 ± 4.781 | 0.65 | 4.5 |
| Glucose, mg/dL | 286.0 ± 107.39 | 258.8 ± 93.18 | 0.02 | 1.2 |
| Creatinine, mg/dL | 1.83 ± 1.734 | 1.37 ± 0.887 | 0.006 | 0.3 |
| Glycated hemoglobin (HbA1c, %) | 6.14 ± 0.894 | 5.91 ± 1.094 | 0.11 | 41.4 |
| Extracorporeal life support | 17 (13.4%) | 11 (5.39%) | 0.02 | 0 |
| Model | Actual | RLR (95% CI) | RF (95% CI) | CBC (95% CI) | VC (95% CI) |
|---|---|---|---|---|---|
| Predicted | 0.383 | 0.439 (0.430–0.448) | 0.540 (0.526–0.554) | 0.295 (0.289–0.301) | 0.437 (0.403–0.470) |
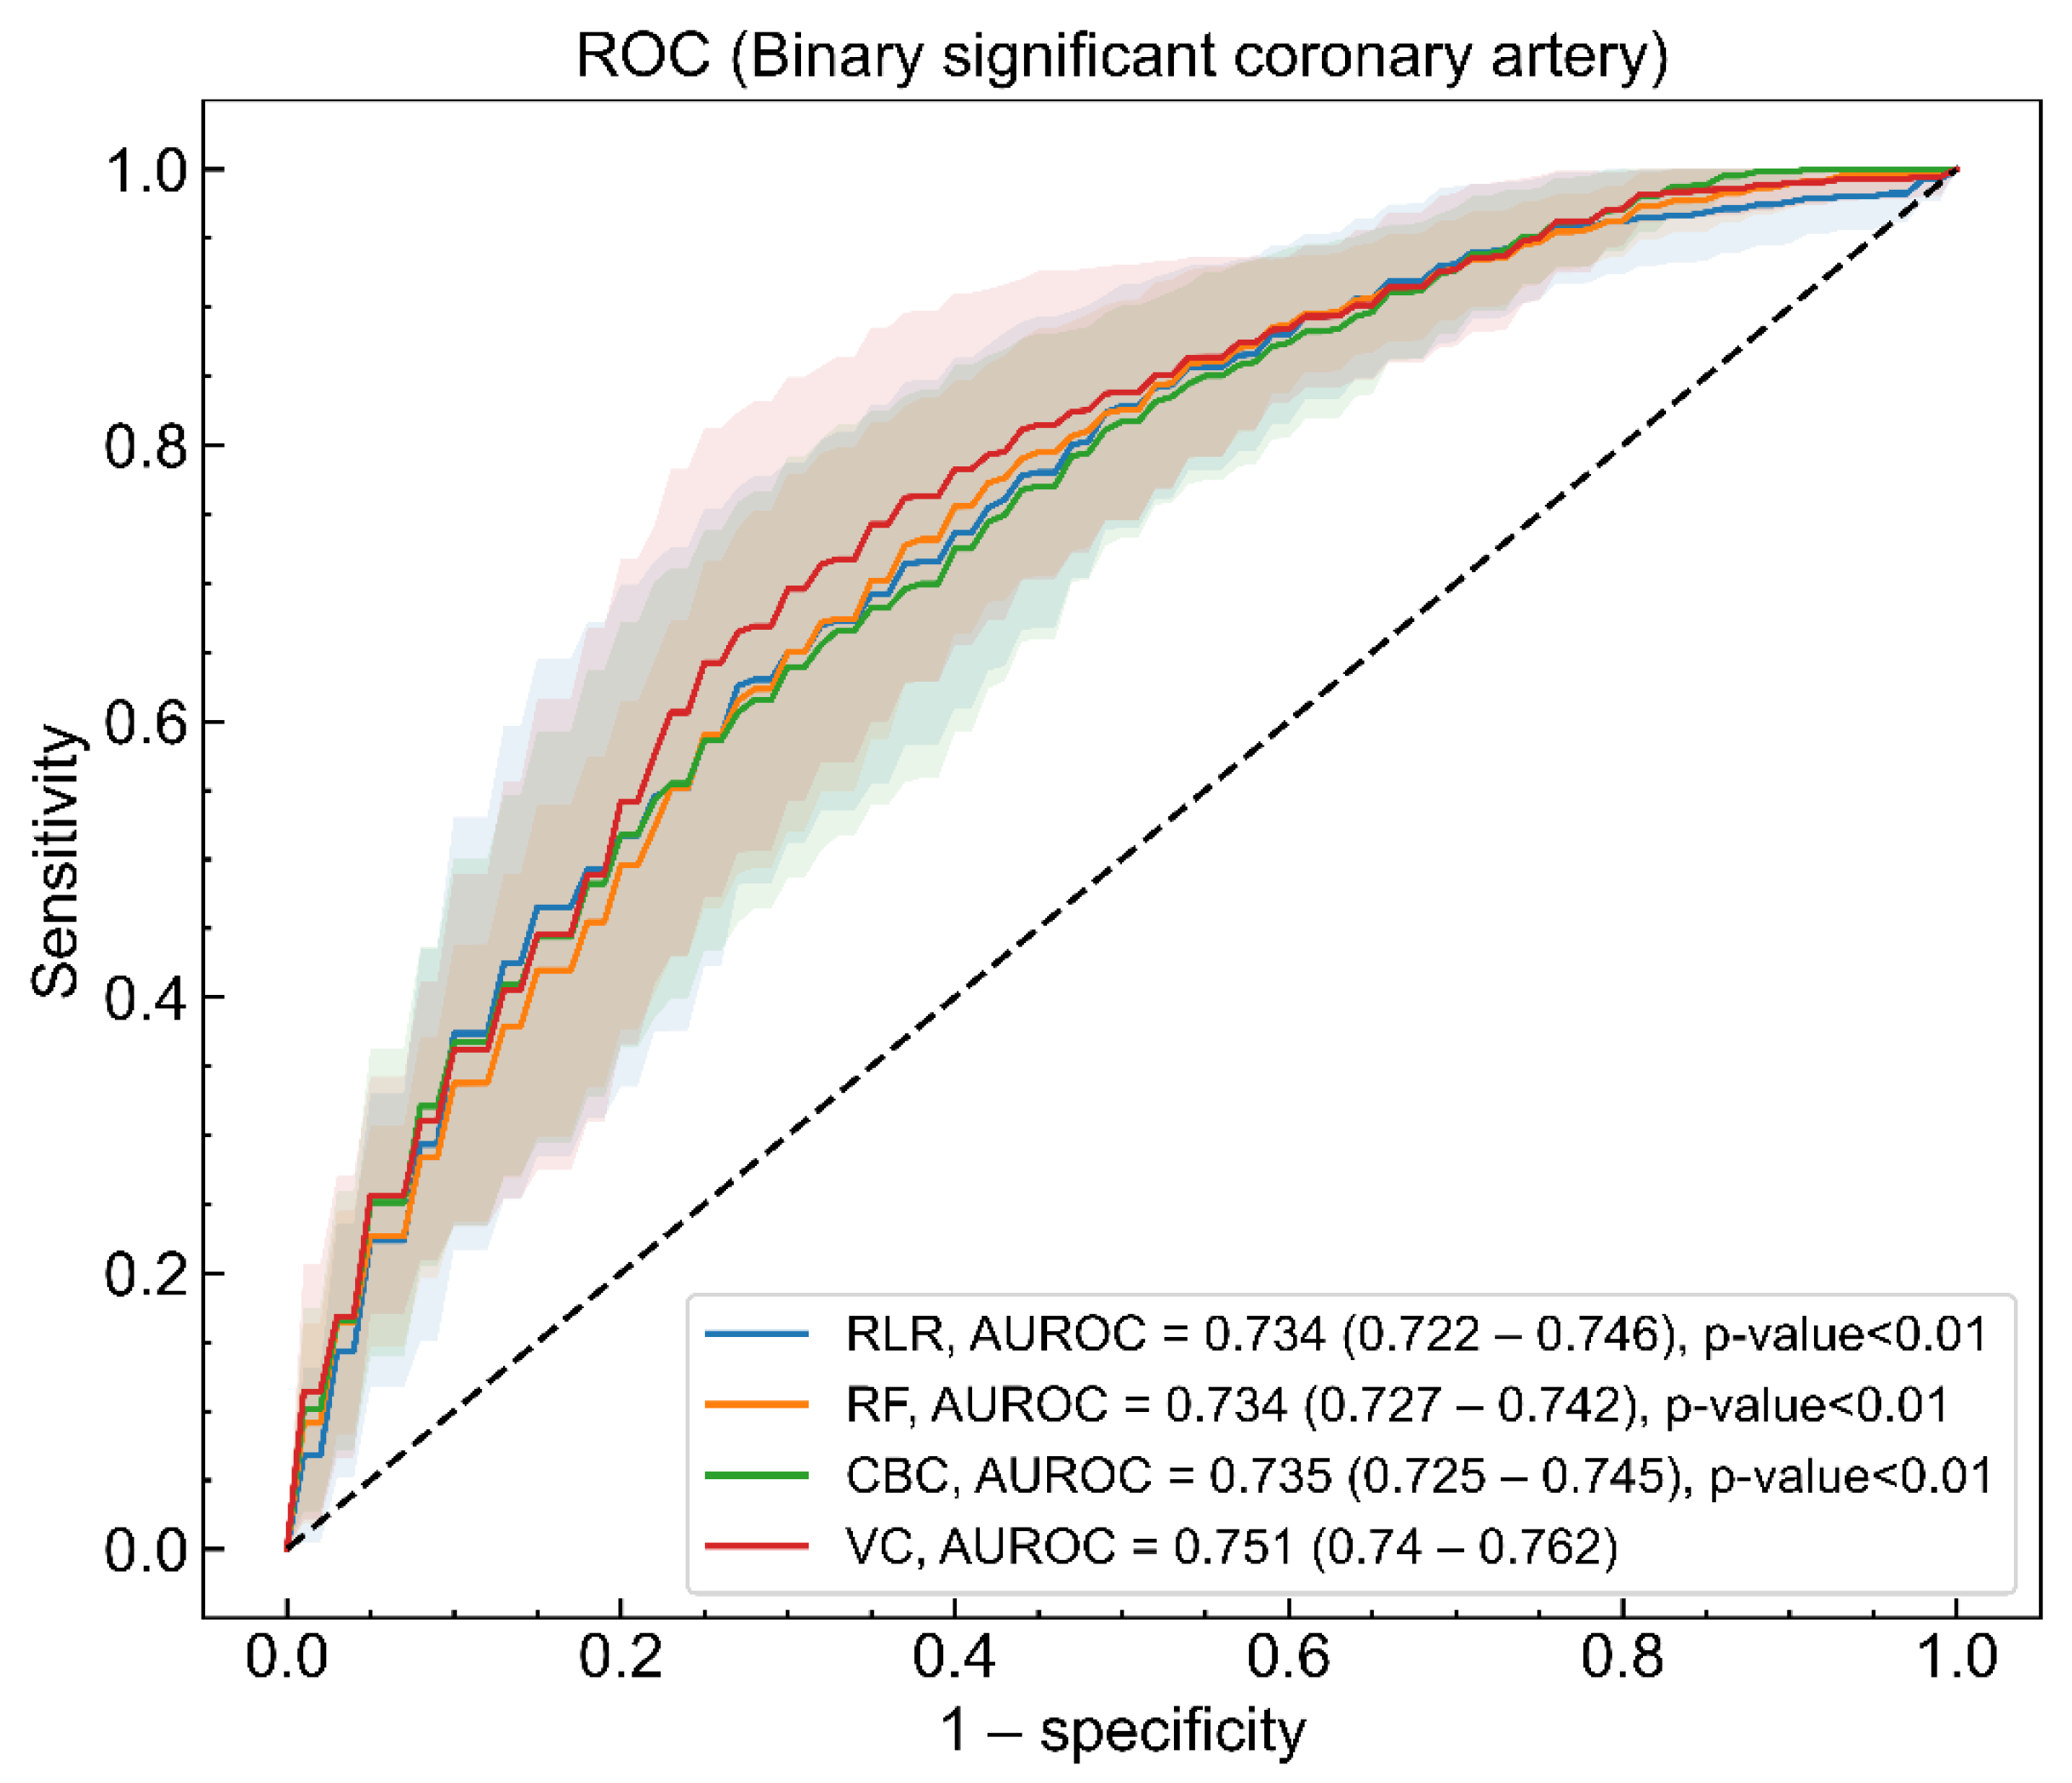
| AUROC | - | 0.731 (0.719–0.744) | 0.737 (0.729–0.746) | 0.734 (0.724–0.744) | 0.751 (0.740–0.762) |
| Log loss | - | 0.206 (0.202–0.211) | 0.207 (0.205–0.208) | 0.229 (0.227–0.232) | 0.204 (0.202–0.207) |
| Sensitivity | - | 0.758 (0.738–0.779) | 0.777 (0.760–0.793) | 0.797 (0.778–0.817) | 0.788 (0.767–0.809) |
| Specificity | - | 0.672 (0.646–0.698) | 0.661 (0.638–0.683) | 0.630 (0.605–0.655) | 0.682 (0.660–0.705) |
| Positive predictive value (PPV) | - | 0.610 (0.595–0.626) | 0.604 (0.590–0.618) | 0.590 (0.575–0.606) | 0.620 (0.607–0.633) |
| Negative predictive value (NPV) | - | 0.829 (0.819–0.839) | 0.832 (0.825–0.840) | 0.843 (0.833–0.853) | 0.850 (0.840–0.861) |
| F1-score | - | 0.685 (0.671–0.700) | 0.696 (0.685–0.707) | 0.681 (0.666–0.696) | 0.710 (0.697–0.724) |
| Kappa | - | 0.412 (0.393–0.432) | 0.416 (0.399–0.434) | 0.402 (0.381–0.423) | 0.448 (0.428–0.467) |
| Net reclassification improvement (NRI) | - | - | 0.007 (−0.005–0.019) | −0.003 (−0.020–0.014) | 0.040 (0.032–0.048) |
Publisher’s Note: MDPI stays neutral with regard to jurisdictional claims in published maps and institutional affiliations. |
© 2021 by the authors. Licensee MDPI, Basel, Switzerland. This article is an open access article distributed under the terms and conditions of the Creative Commons Attribution (CC BY) license (https://creativecommons.org/licenses/by/4.0/).
Share and Cite
Youn, C.-S.; Yi, H.; Kim, Y.-J.; Song, H.; Kim, N.; Kim, W.-Y. Early Identification of Resuscitated Patients with a Significant Coronary Disease in Out-of-Hospital Cardiac Arrest Survivors without ST-Segment Elevation. J. Clin. Med. 2021, 10, 5688. https://doi.org/10.3390/jcm10235688
Youn C-S, Yi H, Kim Y-J, Song H, Kim N, Kim W-Y. Early Identification of Resuscitated Patients with a Significant Coronary Disease in Out-of-Hospital Cardiac Arrest Survivors without ST-Segment Elevation. Journal of Clinical Medicine. 2021; 10(23):5688. https://doi.org/10.3390/jcm10235688
Chicago/Turabian StyleYoun, Chun-Song, Hahn Yi, Youn-Jung Kim, Hwan Song, Namkug Kim, and Won-Young Kim. 2021. "Early Identification of Resuscitated Patients with a Significant Coronary Disease in Out-of-Hospital Cardiac Arrest Survivors without ST-Segment Elevation" Journal of Clinical Medicine 10, no. 23: 5688. https://doi.org/10.3390/jcm10235688
APA StyleYoun, C.-S., Yi, H., Kim, Y.-J., Song, H., Kim, N., & Kim, W.-Y. (2021). Early Identification of Resuscitated Patients with a Significant Coronary Disease in Out-of-Hospital Cardiac Arrest Survivors without ST-Segment Elevation. Journal of Clinical Medicine, 10(23), 5688. https://doi.org/10.3390/jcm10235688