
The Potential Role of the Fat–Glandular Interface (FGI) in Breast Carcinogenesis: Results from an Ultrasound Tomography (UST) Study


Abstract
:1. Introduction
2. Material and Methods
2.1. Subjects and Masses
2.2. Segmentation of Images
2.3. Surface Area to Volume Ratio as a Metric for FGI Exposure Extent
3. Results
3.1. Subjects and Masses
3.2. Breast Density Distribution by Category
3.3. Distribution of α Parameter by Mass Type
4. Discussion
4.1. Trends in the α Distributions
4.2. Implication for Breast Cancer Risk
4.3. Implication for Carcinogenesis
4.4. Weaknesses
5. Conclusions
Author Contributions
Funding
Institutional Review Board Statement
Informed Consent Statement
Data Availability Statement
Acknowledgments
Conflicts of Interest
References
- Kim, W.H.; Li, M.; Han, W.; Ryu, H.S.; Moon, W.K. The spatial relationship of malignant and benign breast lesions with respect to the fat-gland interface on magnetic resonance imaging. Nat. Sci. Rep. 2016, 6, 39085. [Google Scholar]
- Zhu, W.; Harvey, S.; Macura, K.J.; Euhus, D.M.; Artemov, D. Invasive breast cancer preferably and predominantly occurs at the interface between fibroglandular and adipose tissue. Clin. Breast Cancer 2017, 17, e11–e18. [Google Scholar] [CrossRef] [Green Version]
- Littrup, P.J.; Duric, N.; Sak, M.; Li, C.; Roy, O.; Brem, R.F.; Yamashita, M. The fat-glandular interface and breast tumor locations: Appearances on ultrasound tomography are supported by quantitative peritumoral analysis. J. Breast Imaging 2021. [Google Scholar] [CrossRef]
- Duric, N.; Littrup, P.; Poulo, L.; Babkin, A.; Pevzner, R.; Holsapple, E.; Rama, O.; Glide, C. Detection of breast cancer with ultrasound tomography: First results with the Computed Ultrasound Risk Evaluation (CURE) prototype. Med. Phys. 2007, 34, 773–785. [Google Scholar] [CrossRef]
- Duric, N.; Boyd, N.; Littrup, P.; Sak, M.; Myc, L.; Li, C.; West, E.; Minkin, S.; Martin, L.; Yaffe, M.; et al. Breast density measurements with ultrasound tomography: A comparison with film and digital mammography. Med. Phys. 2013, 40, 013501. [Google Scholar] [CrossRef] [PubMed] [Green Version]
- Duric, N.; Littrup, P.; Li, C.; Roy, O.; Schmidt, S.; Seamans, J.; Wallen, A.; Bey-Knight, L. Whole breast tissue characterization with ultrasound tomography. In Medical Imaging: Ultrasonic Imaging and Tomography 2015; International Society for Optics and Photonics: Bellingham, WA, USA, 2015; Volume 9419, p. 94190G. [Google Scholar]
- Malik, B.; Klock, J.; Wiskin, J.; Lenox, M. Objective breast tissue image classification using quantitative transmission ultrasound tomography. Sci. Rep. 2016, 6, 38857. [Google Scholar] [CrossRef] [PubMed] [Green Version]
- Iuanow, E.; Smith, K.; Obuchowski, N.A.; Bullen, J.; Klock, J. Accuracy of cyst versus solid diagnosis in the breast using quantitative transmission (QT) ultrasound. Acad. Radiol. 2017, 24, 1148–1153. [Google Scholar] [CrossRef] [Green Version]
- Wiskin, J.; Malik, B.; Natesan, R.; Lenox, M. Quantitative assessment of breast density using transmission ultrasound tomography. Med. Phys. 2019, 46, 2610–2620. [Google Scholar] [CrossRef] [Green Version]
- Malik, B.; Klock, J. Breast cyst fluid analysis correlations with speed of sound using transmission ultrasound. Acad. Radiol. 2019, 26, 76–85. [Google Scholar] [CrossRef] [Green Version]
- Duric, N.; Sak, M.; Fan, S.; Pfeiffer, R.M.; Littrup, P.J.; Simon, M.S.; Gorski, D.H.; Ali, H.; Purrington, K.S.; Brem, R.F.; et al. Using whole breast ultrasound tomography to improve breast cancer risk assessment: A novel risk factor based on the quantitative tissue property of sound speed. J. Clin. Med. 2020, 9, 367. [Google Scholar] [CrossRef] [PubMed] [Green Version]
- Duric, N.; Littrup, P.; Sak, M.; Li, C.; Chen, D.; Roy, O.; Brem, R. A novel marker, based on ultrasound tomography, for monitoring early response to neoadjuvant chemotherapy. J. Breast Imaging 2020, 2, 569–576. [Google Scholar] [CrossRef] [PubMed]
- Ranger, B.; Littrup, P.J.; Duric, N.; Chandiwala-Mody, P.; Li, C.; Schmidt, S.; Lupinacci, J. Breast ultrasound tomography versus MRI for clinical display of anatomy and tumor rendering: Preliminary results. AJR Am. J. Roentgenol. 2012, 198, 233–239. [Google Scholar] [CrossRef] [PubMed] [Green Version]
- O’Flynn, E.A.; Fromageau, J.; Ledger, A.E.; Messa, A.; D’Aquino, A.; Schoemaker, M.J.; Schmidt, M.; Duric, N.; Swerdlow, A.J.; Bamber, J.C. Ultrasound tomography evaluation of breast density: A comparison with non-contrast magnetic resonance imaging. Invest. Radiol. 2017, 52, 343–348. [Google Scholar] [CrossRef] [PubMed] [Green Version]
- Sak, M.; Duric, N.; Littrup, P.; Bey-Knight, L.; Ali, H.; Vallieres, P.; Sherman, M.E.; Gierach, G.L. Using speed of sound imaging to characterize breast density. Ultrasound Med. Biol. 2017, 43, 91–103. [Google Scholar] [CrossRef] [Green Version]
- Sak, M.; Duric, N.; Littrup, P.; Sherman, M.; Gierach, G. Ultrasound tomography imaging with waveform sound speed: Parenchymal changes in women undergoing tamoxifen therapy. In Medical Imaging 2017: Ultrasonic Imaging and Tomography; International Society for Optics and Photonics: Bellingham, WA, USA, 2017; Volume 10139. [Google Scholar]
- Sandhu, G.Y.; Li, C.; Roy, O.; Schmidt, S.; Duric, N. Frequency domain ultrasound waveform tomography: Breast imaging using a ring transducer. Phys. Med. Biol. 2015, 60, 5381. [Google Scholar] [CrossRef]
- Wolfe, J.N. Risk for breast cancer development determined by mammographic parenchymal pattern. Cancer 1976, 37, 2486–2492. [Google Scholar] [CrossRef]
- ImageJ. Available online: https://imagej.nih.gov/ij/ (accessed on 22 November 2021).
- Yamaguchi, J.; Ohtani, H.; Nakamura, K.; Shimokawa, I.; Kanematsu, T. Prognostic impact of marginal adipose tissue invasion in ductal carcinoma of the breast. Am. J. Clin. Pathol. 2008, 130, 382–388. [Google Scholar] [CrossRef]
- Wang, Y.Y.; Attané, C.; Milhas, D.; Dirat, B.; Dauvillier, S.; Guerard, A.; Gilhodes, J.; Lazar, I.; Alet, N.; Laurent, V.; et al. Mammary adipocytes stimulate breast cancer invasion through metabolic remodeling of tumor cells. JCI Insight 2017, 2, e87489. [Google Scholar] [CrossRef] [PubMed] [Green Version]
- Mancuso, P. The role of adipokines in chronic inflammation. ImmunoTargets Ther. 2016, 5, 47–56. [Google Scholar] [CrossRef] [PubMed] [Green Version]
- Dirat, B.; Bochet, L.; Dabek, M.; Daviaud, D.; Dauvillier, S.; Majed, B.; Wang, Y.Y.; Meulle, A.; Salles, B.; Le Gonidec, S.; et al. Cancer-associated adipocytes exhibit an activated phenotype and contribute to breast cancer invasion. Cancer Res. 2011, 71, 2455–2465. [Google Scholar] [CrossRef] [Green Version]
- Bochet, L.; Lehuédé, C.; Dauvillier, S.; Wang, Y.Y.; Dirat, B.; Laurent, V.; Dray, C.; Guiet, R.; Maridonneau-Parini, I.; Le Gonidec, S.; et al. Adipocyte-derived fibroblasts promote tumor progression and contribute to the desmoplastic reaction in breast cancer. Cancer Res. 2013, 73, 5657–5668. [Google Scholar] [CrossRef] [PubMed] [Green Version]
- McLaughlin, R.L.; Newitt, D.C.; Wilmes, L.J.; Jones, E.F.; Wisner, D.J.; Kornak, J.; Proctor, E.; Joe, B.N.; Hylton, N.M. High-resolution in vivo characterization of apparent diffusion coefficient at the tumor-stromal boundary of breast carcinomas: A pilot study to assess treatment response using proximity-dependent diffusion-weighted imaging. J. Magn. Reson. Imaging 2014, 39, 1308–1313. [Google Scholar] [CrossRef] [PubMed] [Green Version]
- Kettunen, T.; Okuma, H.; Auvinen, P.; Sudah, M.; Tiainen, S.; Sutela, A.; Masarwah, A.; Tammi, M.; Tammi, R.; Oikari, S.; et al. Peritumoral ADC values in breast cancer: Region of interest selection, associations with hyaluronan intensity, and prognostic significance. Eur. Radiol. 2020, 30, 38–46. [Google Scholar] [CrossRef] [PubMed] [Green Version]
- Zhou, J.; Zhan, W.; Chang, C.; Zhang, X.; Jia, Y.; Dong, Y.; Zhou, C.; Sun, J.; Grant, E.G. Breast lesions: Evaluation with shear wave elastography, with special emphasis on the “stiff rim” sign. Radiology 2014, 272, 63–72. [Google Scholar] [CrossRef]
- Park, H.S.; Shin, H.J.; Shin, K.C.; Cha, J.H.; Chae, E.Y.; Choi, W.J.; Kim, H.H. Comparison of peritumoral stromal tissue stiffness obtained by shear wave elastography between benign and malignant breast lesions. Acta Radiol. 2018, 59, 1168–1175. [Google Scholar] [CrossRef]


| Mass Histology | Count (N) |
|---|---|
| Cancer | 80 |
| Fibroadenoma | 105 |
| Cyst | 91 |
| Other benign | 24 |
| Subtypes: Containing fibrosis | |
| Fibrocystic change | |
| Granulomatous Mastitis | |
| Total | 300 |
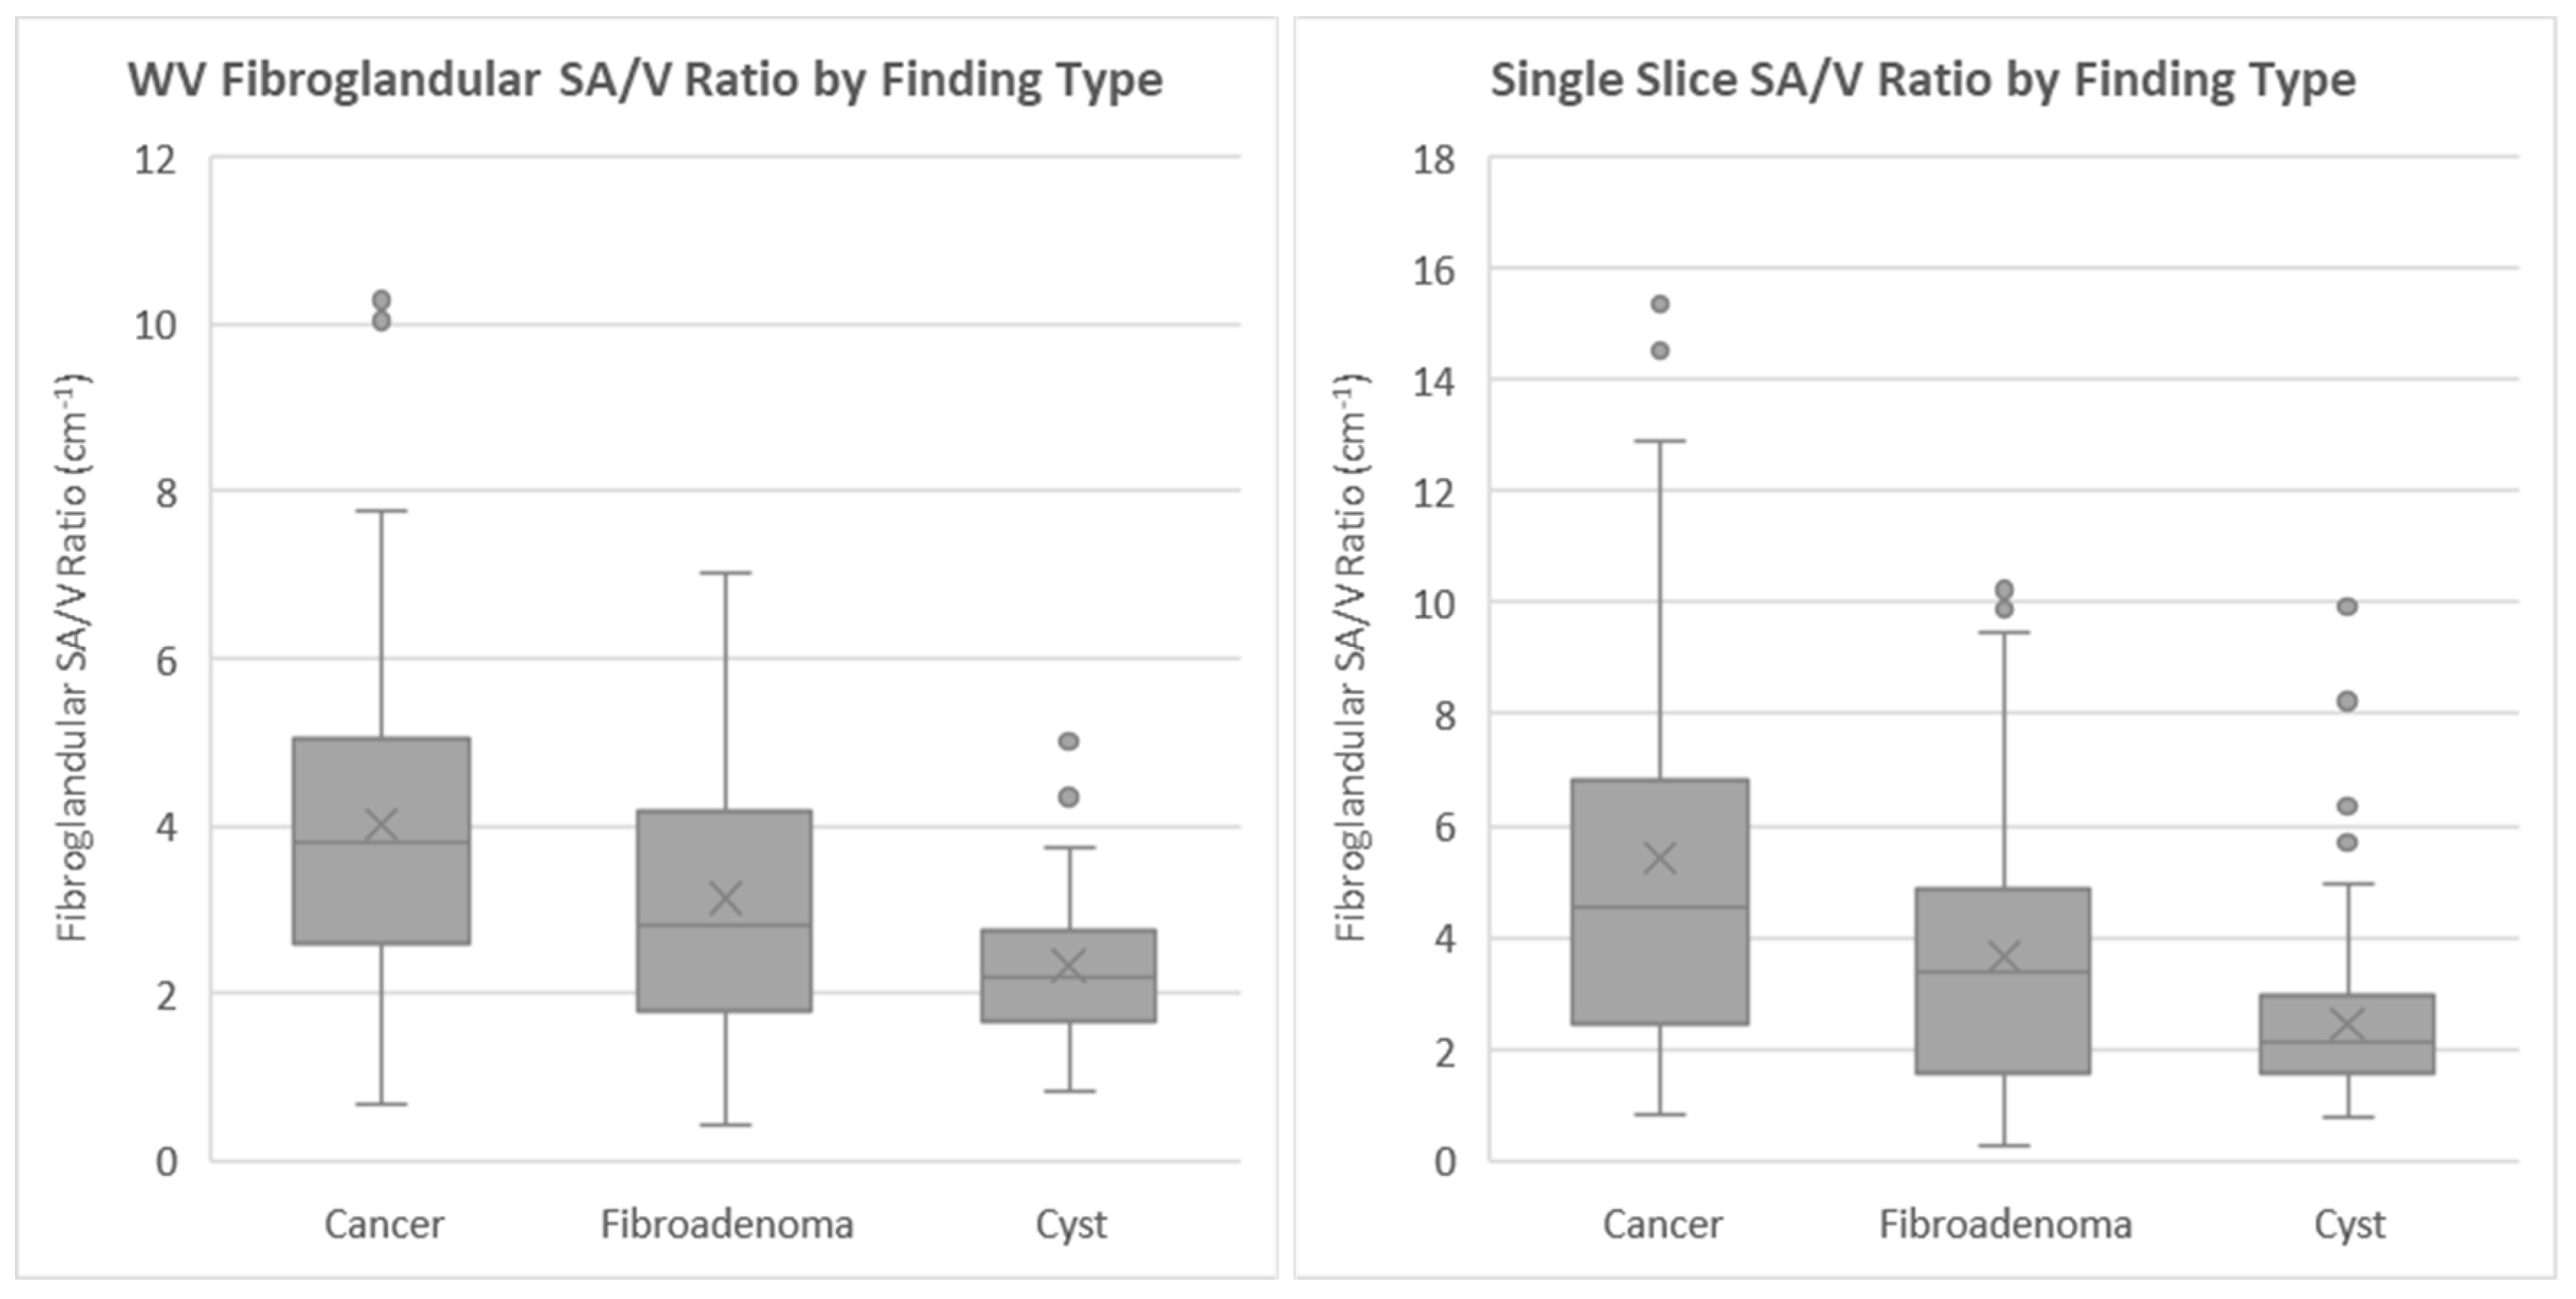
| Mass Type | Whole Volume Mean α (cm−1) | St. Dev | Single Slice α (cm−1) | St. Dev |
|---|---|---|---|---|
| Cancer | 4.0 | 2.0 | 5.4 | 3.6 |
| Fibroadenoma | 3.1 | 1.7 | 3.7 | 2.3 |
| Cyst | 2.3 | 0.9 | 2.4 | 1.5 |
| ANOVA test | p < 0.001 | p < 0.001 | ||
| KW test | p < 0.001 | p < 0.001 |
| Comparison | Whole Volume Measurements | Single Slice Measurements |
|---|---|---|
| Cancer–Cyst | p < 0.001 | p < 0.001 |
| Cancer–Fibroadenoma | p < 0.001 | p < 0.001 |
| Fibroadenoma–Cyst | p = 0.001 | p = 0.003 |
Publisher’s Note: MDPI stays neutral with regard to jurisdictional claims in published maps and institutional affiliations. |
© 2021 by the authors. Licensee MDPI, Basel, Switzerland. This article is an open access article distributed under the terms and conditions of the Creative Commons Attribution (CC BY) license (https://creativecommons.org/licenses/by/4.0/).
Share and Cite
Duric, N.; Sak, M.; Littrup, P.J. The Potential Role of the Fat–Glandular Interface (FGI) in Breast Carcinogenesis: Results from an Ultrasound Tomography (UST) Study. J. Clin. Med. 2021, 10, 5615. https://doi.org/10.3390/jcm10235615
Duric N, Sak M, Littrup PJ. The Potential Role of the Fat–Glandular Interface (FGI) in Breast Carcinogenesis: Results from an Ultrasound Tomography (UST) Study. Journal of Clinical Medicine. 2021; 10(23):5615. https://doi.org/10.3390/jcm10235615
Chicago/Turabian StyleDuric, Nebojsa, Mark Sak, and Peter J. Littrup. 2021. "The Potential Role of the Fat–Glandular Interface (FGI) in Breast Carcinogenesis: Results from an Ultrasound Tomography (UST) Study" Journal of Clinical Medicine 10, no. 23: 5615. https://doi.org/10.3390/jcm10235615
APA StyleDuric, N., Sak, M., & Littrup, P. J. (2021). The Potential Role of the Fat–Glandular Interface (FGI) in Breast Carcinogenesis: Results from an Ultrasound Tomography (UST) Study. Journal of Clinical Medicine, 10(23), 5615. https://doi.org/10.3390/jcm10235615