
Circulating Soluble Lectin-like Oxidized Low-Density Lipoprotein Receptor-1 (sLOX-1): A Diagnostic Indicator across the Spectrum of Acute Coronary Syndrome

 , ,
, , 
Abstract
:1. Introduction
2. Materials and Methods
2.1. Study Population
2.2. Sample Collection and Serum Isolation
2.3. Biochemical Examination
2.4. ELISA for sLOX-1
2.5. Follow-Up
2.6. Statistical Analysis
3. Results
3.1. Pre-Treatment Level of Serological Parameters in Study Groups
3.2. Post-Interventional Serological Parameters
3.3. Diagnostic Value of Pre-Treatment sLOX-1
3.4. Recurrence of Coronary Artery Disease in Follow-Up Cases
4. Discussion
5. Conclusions and Limitations
Author Contributions
Funding
Institutional Review Board Statement
Informed Consent Statement
Data Availability Statement
Conflicts of Interest
References
- Tscharre, M.; Herman, R.; Rohla, M.; Hauser, C.; Farhan, S.; Freynhofer, M.K.; Huber, K.; Weiss, T.W. Uric acid is associated with long-term adverse cardiovascular outcomes in patients with acute coronary syndrome undergoing percutaneous coronary intervention. Atherosclerosis 2018, 270, 173–179. [Google Scholar] [CrossRef] [PubMed]
- Benjamin, E.J.; Blaha, M.J.; Chiuve, S.E.; Cushman, M.; Das, S.R.; Deo, R. Heart disease and stroke statistics—2017 update. Heart Dis. Stroke Stat. 2017, 135, 146–603. [Google Scholar] [CrossRef]
- Minamia, M.; Kume, N.; Kataoka, H.; Morimotoa, M.; Hayashidaa, K.; Sawamurab, T.; Masakib, T.; Kitaa, T. Transforming growth factor-β1 increases the expression of lectin-like oxidized low-density lipoprotein receptor-1. Biochem. Biophys. Res. Commun. 2000, 272, 357–361. [Google Scholar] [CrossRef] [PubMed]
- Kume, N.; Moriwaki, H.; Kataoka, H.; Minami, M.; Murase, T.; Sawamura, T.; Masaki, T.; Kita, T. Inducible expression of LOX-1, a novel receptor for oxidized LDL, in macrophages and vascular smooth muscle cells. Ann. N. Y. Acad. Sci. 2000, 902, 323–327. [Google Scholar] [CrossRef]
- Misaka, T.; Suzuki, S.; Sakamoto, N.; Yamaki, T.; Sugimoto, K.; Kunii, H.; Nakazato, K.; Saitoh, S.-I.; Sawamura, T.; Ishibashi, T.; et al. Significance of soluble lectin-like oxidized LDL receptor-1 levels in systemic and coronary circulation in acute coronary syndrome. Biomed. Res. Int. 2014, 2014, 649185. [Google Scholar] [CrossRef]
- Inoue, N.; Okamura, T.; Kokubo, Y.; Fujita, Y.; Sato, Y.; Nakanishi, M.; Yanagida, K.; Kakino, A.; Iwamoto, S.; Watanabe, M.; et al. LOX index, a novel predictive biochemical marker for coronary heart disease and stroke. Clin. Chem. 2010, 56, 550–558. [Google Scholar] [CrossRef] [PubMed]
- Pirillo, A.; Catapano, A.L. Soluble lectin-like oxidized low density lipoprotein receptor-1 as a biochemical marker for atherosclerosis-related diseases. Dis. Mark. 2013, 35, 413–418. [Google Scholar] [CrossRef] [Green Version]
- Sigmund, C.D.; Okuyama, K.; Ingelfinger, J.; Jones, C.A.; Mullins, J.J.; Kane, C.; Kim, U.; Wu, C.Z.; Kenny, L.; Rustum, Y. Isolation and characterization of renin-expressing cell lines from transgenic mice containing a renin-promoter viral oncogene fusion construct. J. Biol. Chem. 1990, 265, 19916–19922. [Google Scholar] [CrossRef]
- Hayashida, K.; Kume, N.; Murase, T.; Minami, M.; Nakagawa, D.; Inada, T.; Tanaka, M.; Ueda, A.; Kominami, G.; Kambara, H.; et al. Serum soluble lectin-like oxidized low-density lipoprotein receptor-1 levels are elevated in acute coronary syndrome: A novel marker for early diagnosis. Circulation 2005, 112, 812–818. [Google Scholar] [CrossRef]
- Li, B.; Zhang, L.H.; Yang, X.G.; Liu, X.T.; Ren, Y.G. Serum sLOX-1 levels are associated with the presence and severity of angiographic coronary artery disease in patients with metabolic syndrome. Clin. Investig. Med. 2010, 33, 398–404. [Google Scholar] [CrossRef] [Green Version]
- Zhao, Z.W.; Zhu, X.L.; Luo, Y.K.; Lin, C.G.; Chen, L.L. Circulating soluble lectin-like oxidized low-density lipoprotein receptor-1 levels are associated with angiographic coronary lesion complexity in patients with coronary artery disease. Clin. Cardiol. 2011, 34, 172–177. [Google Scholar] [CrossRef] [PubMed]
- Li, B.; Zhang, L.-H.; Yang, X.-G.; Liu, Y.; Liu, X.-T.; Ren, Y.-G. Post procedural serum sLOX-1 levels are associated with coronary in-stent restenosis in patients with stable coronary artery disease. Coron. Artery Dis. 2011, 22, 259–263. [Google Scholar] [CrossRef] [PubMed]
- Kume, N.; Mitsuoka, H.; Hayashida, K.; Tanaka, M.; Kita, T. Soluble lectin-like oxidized low-density lipoprotein receptor-1 predicts prognosis after acute coronary syndrome. Circ. J. 2010, 74, 1399–1404. [Google Scholar] [CrossRef] [Green Version]
- Ullah, N.; Qureshi, A.I.; Chaudhry, F.A. Correlation of Cardiac Biomarkers and Post-PCI Clinical Outcome done in Cath. Lab of Rehmatul lil Alameen Institute of Cardiology. J. Saidu Med. Coll. Swat 2019, 9. [Google Scholar] [CrossRef]
- Rajabi, M.R.; Razzaghof, M.R.; Kashani, H.H. Hyperhomocysteinemia and increased risk of coronary artery disease. Comp. Clin. Pathol. 2019, 29, 223–230. [Google Scholar] [CrossRef]
- Kurtul, A.; Murat, S.N.; Yarlioglues, M.; Duran, M.; Ergun, G.; Açıkgöz, S.K.; Demircelik, M.B.; Cetin, M.; Akyel, A.; Kasapkara, H.A.; et al. Association of platelet-to-lymphocyte ratio with severity and complexity of coronary artery disease in patients with acute coronary syndromes. Am. J. Cardiol. 2014, 114, 972–978. [Google Scholar] [CrossRef]
- Arbel, Y.; Finkelstein, A.; Halkin, A.; Birati, E.Y.; Revivo, M.; Zuzut, M.; Shevach, A.; Berliner, S.; Herz, I.; Keren, G.; et al. Neutrophil/lymphocyte ratio is related to the severity of coronary artery disease and clinical outcome in patients undergoing angiography. Atherosclerosis 2012, 225, 456–460. [Google Scholar] [CrossRef]
- Qin, X.; Qin, L.; Luo, J.; Liu, B.; Zhao, J.; Li, H.; Wei, Y. Correlation analysis between 25-hydroxyvitamin D3, vitamin B12 and vitamin C and endothelial function of patients with CHD. Exp. Ther. Med. 2019, 17, 418–422. [Google Scholar] [CrossRef] [PubMed] [Green Version]
- Kim, H.N.; Eun, Y.M.; Song, S.W. Serum folate and vitamin B12 levels are not associated with the incidence risk of atherosclerotic events over 12 years: The Korean Genome and Epidemiology Study. Nutr. Res. 2019, 63, 34–41. [Google Scholar] [CrossRef]
- Akyürek, Ö.; Akbal, E.; Güneş, F. Increase in the risk of ST elevation myocardial infarction is associated with homocysteine level. Arch. Med. Res. 2014, 45, 501–506. [Google Scholar] [CrossRef]
- Perrone, M.A.; Gualtieri, P.; Gratteri, S.; Ali, W.; Sergi, D.; Muscoli, S.; Cammarano, A.; Bernardini, S.; Di Renzo, L.; Romeo, F. Effects of postprandial hydroxytyrosol and derivates on oxidation of LDL, cardiometabolic state and gene expression: A nutrigenomic approach for cardiovascular prevention. J. Cardiovasc. Med. 2019, 20, 419–426. [Google Scholar] [CrossRef] [PubMed]
- Perrone, M.A.; Donatucci, B.; Salvati, A.; Gualtieri, P.; De Lorenzo, A.; Romeo, F.; Bernardini, S. Inflammation, oxidative stress and gene expression: The postprandial approach in professional soccer players to reduce the risk of muscle injuries and early atherosclerosis. Med. Sport 2019, 72, 234–243. [Google Scholar] [CrossRef]
- Pitti, E.; Petrella, G.; Di Marino, S.; Summa, V.; Perrone, M.; D’Ottavio, S.; Bernardini, A.; Cicero, D.O. Salivary Metabolome and Soccer Match: Challenges for Understanding Exercise induced Changes. Metabolites 2019, 11, 141. [Google Scholar] [CrossRef] [PubMed] [Green Version]

| Group I (n = 18) | Group II (n = 50) | Group III (n = 64) | Group IV (n = 28) | ANOVA | ||
|---|---|---|---|---|---|---|
| Mean ± SD | Mean ± SD | Mean ± SD | Mean ± SD | F Value | p Value | |
| Neutrophil–Lymphocyte Ratio | 1.22 ± 0.677 | 1.90± 1.428 | 1.88 ± 1.377 | 1.45 ± 0.86 | 2.029 | 0.112 |
| Platelet–Lymphocyte Ratio | 48.57 ± 24.33 | 52.60 ± 25.20 | 52.13 ± 24.89 | 30.38 ± 13.67 | 6.614 | <0.001 |
| Vitamin D | 10.76 ± 5.08 | 16.29 ± 3.99 | 10.16 ± 4.52 | 31.84 ± 6.44 | 139.232 | <0.001 |
| Magnesium | 1.45 ± 0.303 | 1.344 ± 0.369 | 1.52 ± 0.339 | 1.56 ± 0.516 | 2.753 | 0.045 |
| Creatinine Kinase-MB | 17.39 ± 26.35 | 67.78 ± 73.22 | 14.78 ± 19.97 | 14.96 ± 3.82 | 16.456 | <0.001 |
| Homocysteine | 5.31 ± 2.77 | 41.75 ± 45.10 | 9.51 ± 12.15 | 9.92 ± 2.50 | 17.762 | <0.001 |
| Vitamin B12 | 323.61 ± 230.48 | 282.60 ± 207.82 | 306.56 ± 453.74 | 340.29 ± 260.14 | 0.192 | 0.902 |
| Thyroid Stimulating Hormone | 3.83 ± 4.76 | 3.73 ± 4.15 | 3.08 ± 4.22 | 2.68 ± 0.99 | 0.612 | 0.608 |
| Folate | 13.62 ± 5.44 | 14.72 ± 5.78 | 10.73 ± 9.02 | 23.70 ± 10.27 | 16.948 | <0.001 |
| sLOX-1 | 44.43 ± 42.86 | 815.04 ± 683.38 | 995.16 ± 611.77 | 28.68 ± 9.97 | 29.492 | <0.001 |
| Serological Parameters | Group I vs. Group II | Group I vs. Group III | Group II vs. Group III | Group I vs. Group IV | Group II vs. Group IV | ||||||||||
|---|---|---|---|---|---|---|---|---|---|---|---|---|---|---|---|
| Mn Diff. | SE | p Value | Mn Diff. | SE | p Value | Mn Diff. | SE | p Value | Mn Diff. | SE | p Value | Mn Diff. | SE | p Value | |
| Neutrophil–Lymphocyte Ratio | −0.67 | 0.35 | 0.214 | −0.66 | 0.34 | 0.206 | 0.01 | 0.24 | 1.000 | −0.23 | 0.38 | 0.931 | 0.44 | 0.30 | 0.445 |
| Platelet–Lymphocyte Ratio | −4.02 | 6.43 | 0.924 | −3.55 | 6.24 | 0.941 | 0.47 | 4.41 | 1.000 | 18.19 | 7.06 | 0.053 | 22.22 | 5.52 | 0.001 |
| Vitamin D | −5.53 | 1.32 | <0.001 | 0.60 | 1.29 | 0.966 | 6.13 | 0.91 | <0.001 | −21.08 | 1.46 | <0.001 | −15.55 | 1.14 | <0.001 |
| Magnesium | 0.11 | 0.10 | 0.695 | −0.06 | 0.10 | 0.923 | −0.18 | 0.07 | 0.067 | −0.10 | 0.12 | 0.811 | −0.22 | 0.09 | 0.079 |
| Creatinine Kinase-MB | −50.39 | 12.05 | <0.001 | 2.61 | 11.70 | 0.996 | 53.00 | 8.28 | < 0.001 | 2.42 | 13.25 | 0.998 | 52.82 | 10.35 | <0.001 |
| Homocysteine | −36.44 | 7.28 | <0.001 | −4.20 | 7.06 | 0.934 | 32.24 | 5.00 | <0.001 | −4.61 | 8.00 | 0.939 | 31.83 | 6.25 | <0.001 |
| Vitamin B12 | 41.01 | 92.89 | 0.971 | 17.05 | 90.16 | 0.998 | −23.96 | 63.79 | 0.982 | −16.67 | 102.10 | 0.998 | −57.69 | 79.77 | 0.888 |
| Thyroid Stimulating Hormone | 0.09 | 1.07 | 1.000 | 0.74 | 1.04 | 0.893 | 0.65 | 0.74 | 0.815 | 1.14 | 1.18 | 0.768 | 1.05 | 0.92 | 0.666 |
| Folate | −1.10 | 2.21 | 0.959 | 2.88 | 2.15 | 0.537 | 3.99 | 1.52 | 0.047 | −10.09 | 2.43 | <0.001 | −8.98 | 1.90 | <0.001 |
| sLOX-1 | −770.61 | 150.06 | <0.001 | −950.72 | 145.65 | <0.001 | −180.12 | 103.04 | 0.303 | 15.75 | 164.93 | 1.000 | 786.36 | 128.86 | <0.001 |
| Group I (n = 18) | Group II (n = 50) | Group III (n = 64) | ANOVA | ||
|---|---|---|---|---|---|
| Mean ± SD | Mean ± SD | Mean ± SD | F Value | p Value | |
| Neutrophil–Lymphocyte Ratio | 1.565 ± 0.63 | 2.588 ± 1.78 | 2.53 ± 1.67 | 2.915 | 0.058 |
| Platelet–Lymphocyte Ratio | 56.95 ± 28.26 | 65.95 ± 27.10 | 65.66 ± 27.06 | 0.821 | 0.442 |
| Vitamin D | 10.82 ± 5.16 | 16.25 ± 4.03 | 10.13 ± 4.53 | 28.262 | <0.001 |
| Magnesium | 1.358 ± 0.570 | 1.494 ± 0.654 | 1.546 ± 0.641 | 0.616 | 0.542 |
| CK-MB | 34.00 ± 32.47 | 99.32 ± 84.80 | 30.25 ± 26.79 | 22.490 | <0.001 |
| Homocysteine | 15.14 ± 5.48 | 61.18 ± 52.23 | 18.73 ± 16.49 | 24.825 | <0.001 |
| Vitamin B12 | 321.50 ± 230.74 | 282.96 ± 207.86 | 307.67 ± 453.61 | 0.107 | 0.898 |
| Thyroid Stimulating Hormone | 3.83 ± 4.77 | 3.74 ± 4.15 | 3.08 ± 4.22 | 0.428 | 0.653 |
| Folate | 13.85 ± 5.69 | 14.73 ± 5.84 | 10.87 ± 8.93 | 3.957 | 0.021 |
| sLOX-1 | 74.01 ± 58.35 | 1137.36 ± 772.59 | 1945.50 ± 843.90 | 47.053 | <0.001 |
| Group I vs. Group II | Group I vs. Group III | Group II vs. Group III | |||||||
|---|---|---|---|---|---|---|---|---|---|
| Mn Diff. | SE | p Value | Mn Diff. | SE | p Value | Mn Diff. | SE | p Value | |
| Neutrophil–Lymphocyte Ratio | −1.02 | 0.45 | 0.060 | −0.97 | 0.43 | 0.070 | 0.06 | 0.31 | 0.981 |
| Platelet–Lymphocyte Ratio | −9.00 | 7.49 | 0.454 | −8.71 | 7.27 | 0.456 | 0.29 | 5.14 | 0.998 |
| Vitamin D | −5.43 | 1.22 | <0.001 | 0.69 | 1.18 | 0.828 | 6.12 | 0.84 | <0.001 |
| Magnesium | −0.14 | 0.18 | 0.719 | −0.19 | 0.17 | 0.512 | −0.05 | 0.12 | 0.901 |
| CK-MB | −65.32 | 15.60 | <0.001 | 3.75 | 15.14 | 0.967 | 69.07 | 10.71 | <0.001 |
| Homocysteine | −46.04 | 9.41 | <0.001 | −3.59 | 9.14 | 0.918 | 42.45 | 6.46 | <0.001 |
| Vitamin B12 | 38.54 | 96.76 | 0.916 | 13.83 | 93.92 | 0.988 | −24.71 | 66.44 | 0.927 |
| Thyroid Stimulating Hormone | 0.09 | 1.17 | 0.997 | 0.75 | 1.14 | 0.786 | 0.66 | 0.81 | 0.691 |
| Folate | −0.87 | 2.06 | 0.906 | 2.99 | 2.00 | 0.297 | 3.86 | 1.41 | 0.020 |
| sLOX-1 | −1063.35 | 208.43 | <0.001 | −1871.49 | 202.31 | <0.001 | −808.14 | 143.12 | <0.001 |
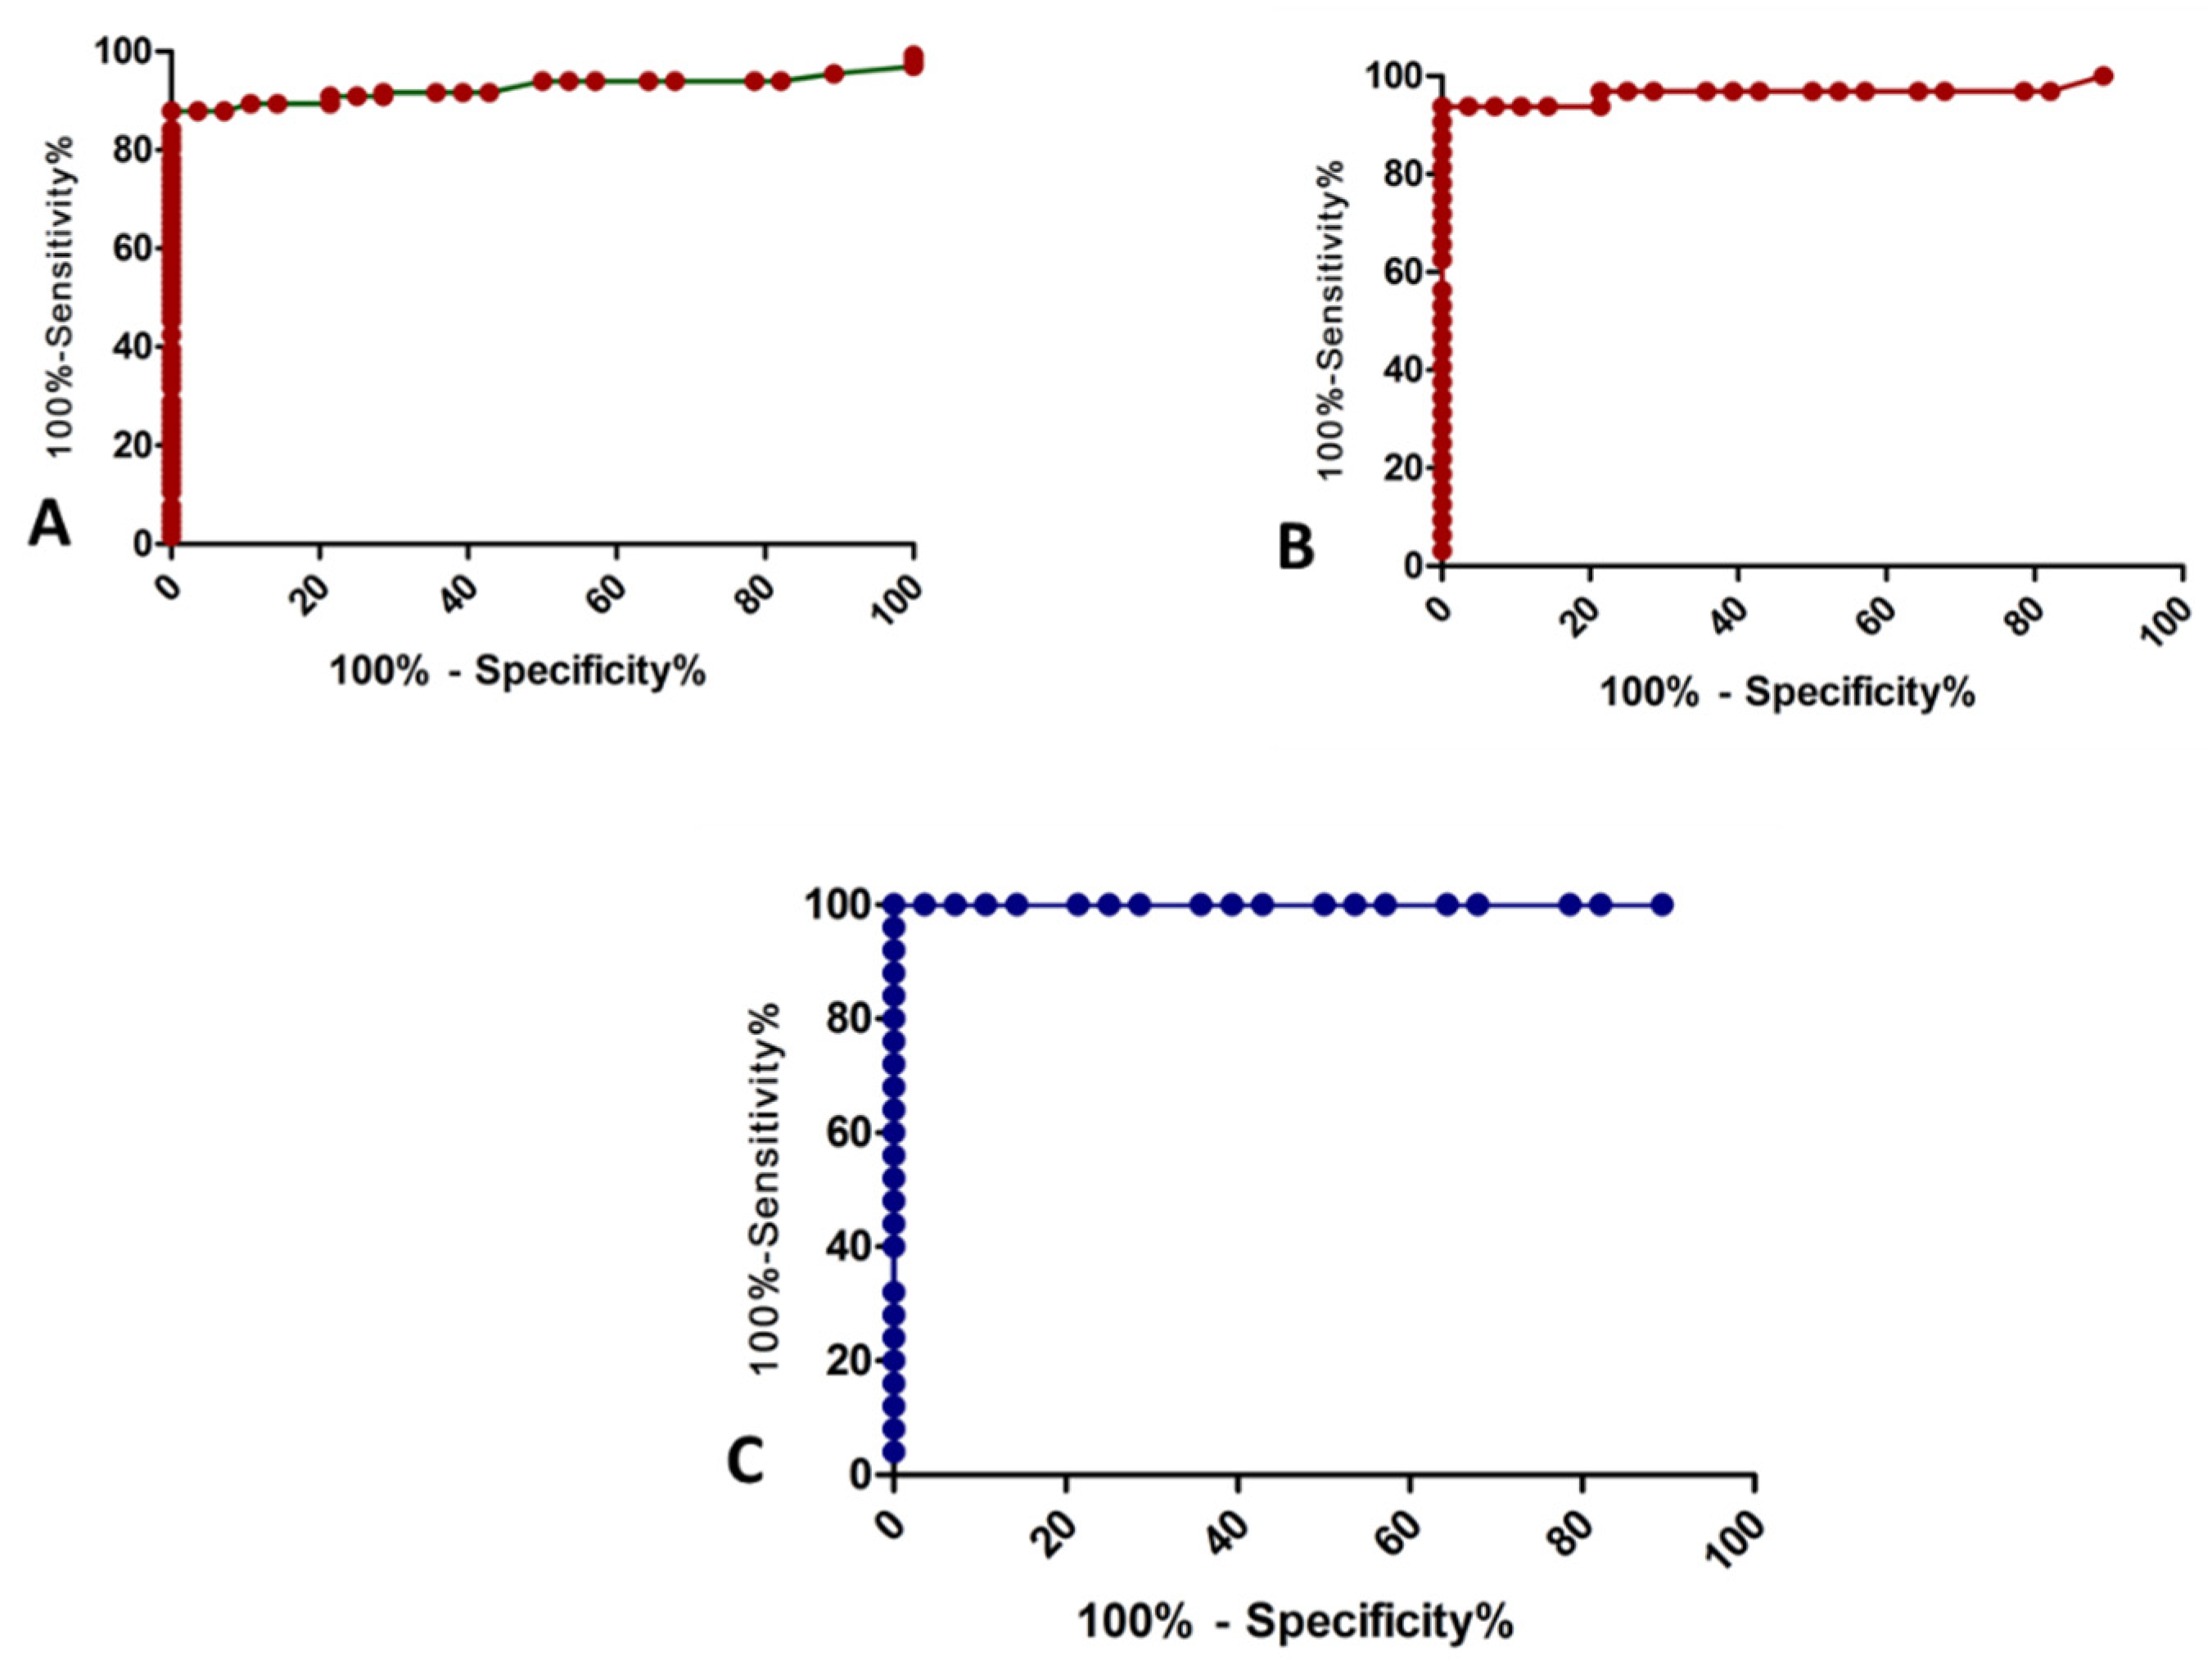
| Diagnostic | Cut-Off Value | AUC | p-Value | Sensitivity (95% CI) | Specificity (95% CI) |
|---|---|---|---|---|---|
| Cases (groups I + II + III) vs. control | ≥47.15 | 0.925 | <0.0001 | 87.88 (81.06–92.91) | 100.00 (87.66–100.0) |
| ACS vs. control | ≥48.50 | 0.966 | 0.01 | 93.75 (84.76–98.27) | 100.00 (87.66–100.0) |
| Stable CAD that underwent PCI vs. control | ≤47.50 | 1.00 | <0.0001 | 100.00 (87.66–100.0) | 100.00 (92.89–100.0) |
| Recurrence | Total (N = 132) | Group I (n = 18) | Group II (n = 50) | Group III (n = 64) | |||
|---|---|---|---|---|---|---|---|
| No recurrence | 123 | 18 | 100 | 48 | 96 | 57 | 89.10 |
| Recurrence | 9 | 00 | 0.0 | 02 | 4.0 | 07 | 10.90 |
| No Recurrence (n = 123) | Recurrence (n = 9) | |||
|---|---|---|---|---|
| Mean ± SD | Mean ± SD | ‘t’ | p-Value | |
| (a) Pre-treatment | ||||
| Neutrophil–Lymphocyte Ratio | 1.83 ± 1.37 | 1.47 ± 0.59 | 0.776 | 0.439 |
| Platelet–Lymphocyte Ratio | 52.77 ± 25.13 | 38.77 ± 14.68 | 1.647 | 0.102 |
| Vitamin D | 12.63 ± 5.20 | 11.68 ± 6.37 | 0.522 | 0.603 |
| Magnesium | 1.43 ± 0.36 | 1.65 ± 0.16 | −1.839 | 0.068 |
| Creatinine Kinase-MB | 36.59 ± 55.71 | 16.33 ± 19.39 | 1.083 | 0.281 |
| Homocysteine | 21.90 ± 34.05 | 10.84 ± 11.51 | 0.968 | 0.335 |
| Vitamin B12 | 300.81 ± 351.39 | 286.11 ± 344.92 | 0.121 | 0.904 |
| Thyroid Stimulating Hormone | 3.45 ± 4.18 | 3.23 ± 5.40 | 0.147 | 0.884 |
| Folate | 12.50 ± 7.72 | 14.50 ± 7.28 | −0.754 | 0.452 |
| sLOX-1 | 790.18 ± 670.93 | 894.44 ± 725.25 | −0.448 | 0.655 |
| (b) Post-interventional | ||||
| Neutrophil–Lymphocyte Ratio | 2.45 ± 1.70 | 1.97 ± 0.58 | 0.853 | 0.395 |
| Platelet–Lymphocyte Ratio | 65.76 ± 27.48 | 48.46 ± 16.80 | 1.860 | 0.065 |
| Vitamin D | 12.60 ± 5.22 | 11.80 ± 6.32 | 0.436 | 0.664 |
| Magnesium | 1.47 ± 0.63 | 1.87 ± 0.60 | −1.822 | 0.071 |
| CK-MB | 58.69 ± 67.09 | 32.78 ± 26.29 | 1.149 | 0.253 |
| Homocysteine | 35.35 ± 41.05 | 20.34 ± 16.24 | 1.087 | 0.279 |
| Vitamin B12 | 301.07 ± 351.29 | 288.22 ± 345.58 | 0.106 | 0.916 |
| Thyroid Stimulating Hormone | 3.45 ± 4.18 | 3.19 ± 5.39 | 0.170 | 0.865 |
| Folate | 12.58 ± 7.69 | 14.81 ± 7.45 | −0.841 | 0.402 |
| sLOX-1 | 1332.81 ± 967.50 | 2086.22 ± 1079.43 | −2.238 | 0.027 |
Publisher’s Note: MDPI stays neutral with regard to jurisdictional claims in published maps and institutional affiliations. |
© 2021 by the authors. Licensee MDPI, Basel, Switzerland. This article is an open access article distributed under the terms and conditions of the Creative Commons Attribution (CC BY) license (https://creativecommons.org/licenses/by/4.0/).
Share and Cite
Kumar, S.; Ali, W.; Mishra, S.; Pradhan, A.; Sethi, R.; Kushwaha, R.; Singh, U.S.; Perrone, M.A. Circulating Soluble Lectin-like Oxidized Low-Density Lipoprotein Receptor-1 (sLOX-1): A Diagnostic Indicator across the Spectrum of Acute Coronary Syndrome. J. Clin. Med. 2021, 10, 5567. https://doi.org/10.3390/jcm10235567
Kumar S, Ali W, Mishra S, Pradhan A, Sethi R, Kushwaha R, Singh US, Perrone MA. Circulating Soluble Lectin-like Oxidized Low-Density Lipoprotein Receptor-1 (sLOX-1): A Diagnostic Indicator across the Spectrum of Acute Coronary Syndrome. Journal of Clinical Medicine. 2021; 10(23):5567. https://doi.org/10.3390/jcm10235567
Chicago/Turabian StyleKumar, Sandeep, Wahid Ali, Sridhar Mishra, Akshyaya Pradhan, Rishi Sethi, Rashmi Kushwaha, Uma Shankar Singh, and Marco Alfonso Perrone. 2021. "Circulating Soluble Lectin-like Oxidized Low-Density Lipoprotein Receptor-1 (sLOX-1): A Diagnostic Indicator across the Spectrum of Acute Coronary Syndrome" Journal of Clinical Medicine 10, no. 23: 5567. https://doi.org/10.3390/jcm10235567
APA StyleKumar, S., Ali, W., Mishra, S., Pradhan, A., Sethi, R., Kushwaha, R., Singh, U. S., & Perrone, M. A. (2021). Circulating Soluble Lectin-like Oxidized Low-Density Lipoprotein Receptor-1 (sLOX-1): A Diagnostic Indicator across the Spectrum of Acute Coronary Syndrome. Journal of Clinical Medicine, 10(23), 5567. https://doi.org/10.3390/jcm10235567