Abstract
Background: Lactic acidosis is the most common cause of anion gap metabolic acidosis in the intensive care unit (ICU), associated with poor outcomes including mortality. We sought to compare machine learning (ML) approaches versus logistic regression analysis for prediction of mortality in lactic acidosis patients admitted to the ICU. Methods: We used the Medical Information Mart for Intensive Care (MIMIC-III) database to identify ICU adult patients with lactic acidosis (serum lactate ≥4 mmol/L). The outcome of interest was hospital mortality. We developed prediction models using four ML approaches consisting of random forest (RF), decision tree (DT), extreme gradient boosting (XGBoost), artificial neural network (ANN), and statistical modeling with forward stepwise logistic regression using the testing dataset. We then assessed model performance using area under the receiver operating characteristic curve (AUROC), accuracy, precision, error rate, Matthews correlation coefficient (MCC), F1 score, and assessed model calibration using the Brier score, in the independent testing dataset. Results: Of 1919 lactic acidosis ICU patients, 1535 and 384 were included in the training and testing dataset, respectively. Hospital mortality was 30%. RF had the highest AUROC at 0.83, followed by logistic regression 0.81, XGBoost 0.81, ANN 0.79, and DT 0.71. In addition, RF also had the highest accuracy (0.79), MCC (0.45), F1 score (0.56), and lowest error rate (21.4%). The RF model was the most well-calibrated. The Brier score for RF, DT, XGBoost, ANN, and multivariable logistic regression was 0.15, 0.19, 0.18, 0.19, and 0.16, respectively. The RF model outperformed multivariable logistic regression model, SOFA score (AUROC 0.74), SAP II score (AUROC 0.77), and Charlson score (AUROC 0.69). Conclusion: The ML prediction model using RF algorithm provided the highest predictive performance for hospital mortality among ICU patient with lactic acidosis.
1. Introduction
Lactic acidosis is the most common cause of anion gap metabolic acidosis in the intensive care unit (ICU) [1,2], and it is associated with poor clinical outcomes [1,3,4,5,6]. While ICU patients with lactic acidosis typically have classic type A lactic acidosis due to tissue hypoperfusion, certain patients with liver disease, cancer, or predisposing drug use (such as metformin, salicylate) can also have coexisting type B lactic acidosis [7,8]. Lactic acidosis (serum lactate ≥4 mmol/L) is associated with high mortality in various ICU settings, including sepsis, trauma, or cardiac surgeries [3,4,9,10,11,12,13,14,15,16,17,18,19,20,21,22,23,24,25]. Hence, the incorporation of ICU admission lactate levels in illness severity scores has been proven to improve predictive performance for in-hospital mortality [26,27].
Recently, artificial intelligence (AI) and machine learning (ML) have been increasingly utilized for precision medicine [28,29], including prediction of clinical outcomes among critically ill patients [30,31,32,33,34]. Due to the ability of ML to cope with nonlinear, complex, and multidimensional data [31,35], recent studies have demonstrated that ML approaches using ICU data provided high predictive performances that outperformed traditional analysis [32,33]. While the use of lactate levels in mortality prediction among critically ill patients has been investigated [26,27], data on mortality risk prediction among the subgroup of ICU patients with lactic acidosis are limited. Given the heterogeneity of impacts of lactic acidosis on clinical outcomes in a variety of different patient characteristics and ICU settings (such as lactic acidosis in patients with trauma, cardiac surgery, and septic shock) [9,10,11,12,13,14,15,16,17,18,19,20], an ML-based mortality prediction model for ICU patients with lactic acidosis can provide a novel individualized approach to clinical decision making for critically ill patients.
In this study, we aimed to develop and then assess various ML-based prediction model performances in predicting mortality of ICU patients with lactic acidosis in comparison to the traditional statistical model.
2. Methods
2.1. Patient Population
The Mayo Clinic Institutional Review Board approved this observational study (IRB number-21-009222). We used the Medical Information Mart for Intensive Care III (MIMIC III) database to conduct this study. MIMIC-III provides deidentified comprehensive clinical data from ICU patients at Beth Israel Deaconess Medical Center in Boston, Massachusetts, United States between 2001 and 2012 [36]. The database is widely accessible to researchers internationally under a data use agreement. If patients had multiple ICU admissions, we analyzed only the first admission.
Inclusion criteria were (1) age ≥18 years and (2) presence of lactic acidosis at ICU admission, defined as the first serum lactate measured within 48 h of ICU admission of ≥4.0 mmol/L. The exclusion criteria were (1) no serum lactate measurements within 48 h of ICU admission or (2) being admitted to the ICU for ≤24 h.
2.2. Data Collection
We abstracted data on patient characteristics, comorbidities, vital signs, organ support, and laboratory results for prediction model development. As our goal was to develop and assess a prediction model for mortality in lactic acidosis patients based on the available data at the time of ICU admission, we only used data that were present within 48 h of ICU admission for analysis. When multiple values existed, we selected the closest vital sign or laboratory value to lactic acidosis occurrence. We excluded laboratory results with more than 10% missing data. Otherwise, we imputed missing data through multiple imputation using Random Forest (RF).
2.3. Model Development
In order to utilize ML models to predict the risk of in-hospital mortality in ICU patients with lactic acidosis, we followed the TRIPOD to build these ML models (Online Supplementary) [37]. Spearman’s rank correlation was applied to assess the separate correlation of variables in the dataset and demonstrate no significant correlations (Supplementary Figure S1). Numeric data were normalized to have a standard deviation of 1 and a mean of 0 [38]. The overall study cohort was randomized into a training (80%) and testing dataset (20%) as per the Pareto principle [39]. We used the training dataset to develop ML models. The testing cohort was blinded to all methods until the final evaluation. As a reference model, we used multivariable logistic regression analysis. We conducted forward stepwise variable selection using criteria of p < 0.20 for entry cut-off.
ML models include decision tree (DT), RF, extreme gradient boosting (XGBoost), and deep learning. RF and XGBoost are both DT ensemble algorithms [40,41]. However, RF forests rely on bagging, which is a democratic process to “elect” the best decision among the subgroups of trees [40]. XGBoost is based on a gradient descent–boosting process, which is an ensemble of weak learners that is reinforced depending on the quality of the assessment [41]. We used deep learning based on a multi-layer feedforward artificial neural network (ANN) that is trained with stochastic gradient descent using back-propagation.
For DT analysis, the number of terminal nodes was determined considering the scree plot showing the relationship between the tree size and coefficient of variance. The decision tree was pruned based on cross-validated error results using the complexity parameter associated with the minimal error (Supplementary Figure S2). For the RF model, the number of trees was 500, which yielded the lowest error rate (Supplementary Figure S3), and mtry value was calculated by the square root of the number of variables [42]. For XGBoost and ANN, we created a hyperparameter tuning grid to identify the best combination of hyperparameters using cross-validation methods [43]. Detailed hyperparameters are provided in the Online Supplementary data.
2.4. Model Evaluation and Calibration
Model performance was assessed with area under the receiver operating characteristic curve (AUROC), accuracy, precision, error rate (ERR), Matthews correlation coefficient (MCC), and F1 score in the testing dataset [44,45,46]. The formula for each measure is provided in the Online Supplementary data. The Brier score was used to evaluate model calibration [47].
2.5. Explanations of the Features in the ML-Based Prediction Model That Drive Patient-Specific Predictions of Mortality
After we identified ML model with highest predictive performances, we applied the Shapley additive explanations (SHAP) values to explain which features initiate patient-specific estimates. In addition, we also applied the local interpretable model-agnostic explanations (LIME) approach to approximate a complex nonlinear model to a linear model near variables of interest.
2.6. Statistical Analysis
All analyses were performed using R, version 4.0.3 (RStudio, Inc., Boston, MA, USA; http://www.rstudio.com/ (accessed on 15 January 2021)). We used the “rpart” package for DT, “randomForest” and “randomForestExplainer” for RF, “caret” package for XGBoost and grid search, “h2o” package for ANN and SHAP, “LIME” for LIME, and the “missForest” package for missing data imputation [48].
3. Results
A total of 1919 ICU patients with lactic acidosis were eligible for analysis. Of these, 1535 and 384 were included in the training and testing dataset, respectively. Table 1 shows the clinical characteristics of patients in the training and testing datasets. Clinical characteristics between the training and testing datasets were comparable. Hospital mortality was also similar between training and testing datasets (29.8% vs. 29.7%; p = 0.97).

Table 1.
Patient characteristics in the training and testing datasets.
The ERRs and AUROCs of all ML models and the multivariable logistic regression model for mortality prediction in the test data set are shown in Table 2 and Figure 1. RF showed the lowest ERR (21.4%) and the highest accuracy (0.79), precision (0.72), MCC score (0.45), F1 score (0.56), and AUROC (0.83, 95% confidence interval (CI) 0.79–0.87). While the decision tree demonstrated a simple algorithm to follow (Figure 2), it had the highest ERR (26.7%) and lowest accuracy (0.73), precision (0.59), MCC score (0.30), F1 score (0.44), and AUROC (0.71, 95%CI 0.66–0.77) among all ML models (Figure 1).
Table 2.
Comparison of evaluation and calibration among the different models.
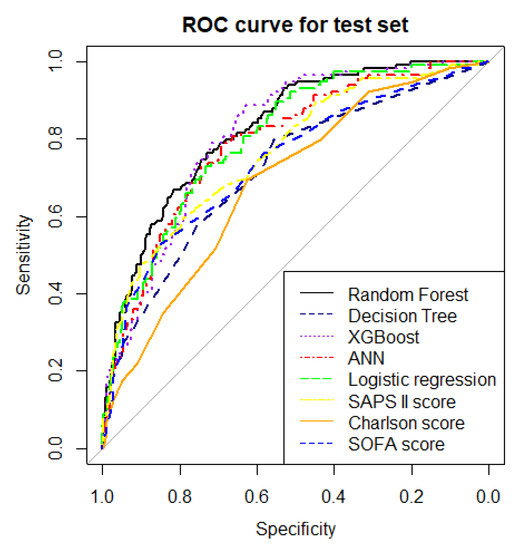
Figure 1.
Comparison of AUROC among the different ML models, logistic regression model, SAPS II score, Charlson score, and SOFA score. ROC, operating characteristic.
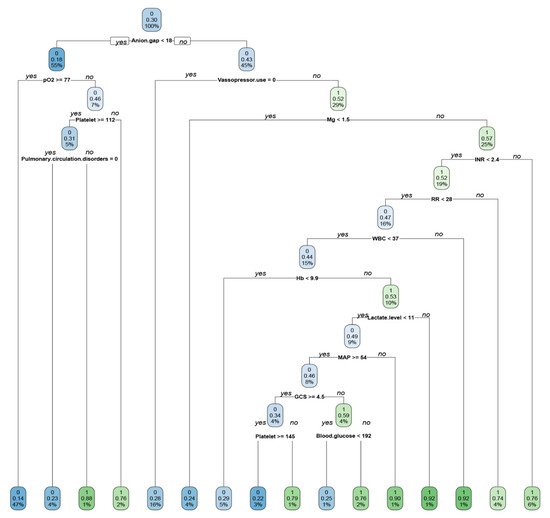
Figure 2.
Simple decision tree model showing the classification of ICU patients with lactic acidosis who died (1) and did not (0) die during hospitalization. The numbers with two decimals in each cell mean the probability of mortality in each classification tree. The blue or green color becomes dense when it is more likely to die or not. The % number in the boxes denotes the percentage of patients with each discriminating variable from CART (Classification and Regression Tree) analysis. WBC, White Blood Cell; INR, International Normalized Ratio; RR, Respiratory Rate; MAP, Mean Arterial Pressure; GCS, Glasgow Coma Scale.
The results of multivariable logistic regression analysis with stepwise variable selection are shown in Table 3. The AUROC of the multivariable logistic prediction model with forward stepwise variable selection was 0.81 (95%CI 0.79–0.83). We also compared our predictive models with Sequential Organ Failure Assessment (SOFA) score, Simplified Acute Physiology Score (SAPS II) score (acute severity score) and Charlson score (comorbidity score). The RF model outperformed the multivariable logistic regression model, SOFA score (AUROC 0.74), SAP II score (AUROC 0.77), and Charlson score (AUROC 0.69) (Table 2).
Table 3.
Development of multivariable logistic regression model to predict mortality using stepwise variable selection in the training dataset.
The RF model was the most well-calibrated among all models (Supplementary Figures S4–S10). The Brier score for RF, DT, XGBoost, ANN, and multivariable logistic regression was 0.15, 0.19, 0.18, 0.19 and 0.16, respectively (Table 2). Variable importance analysis of RF, the best model, was performed. The top important variables of RF combined the mean decrease in Gini (how much each variable decreases the node impurity), decrease in accuracy, and p values of the clinical indices include BUN, anion gap, lactate level, INR, pO2, phosphate level, PTT, platelet count, pH, and baseline eGFR (Figure 3).
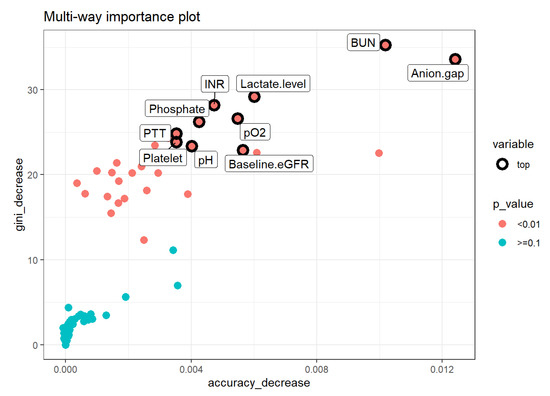
Figure 3.
Multiway feature importance analysis of RF model combining the mean decrease in Gini, decrease in accuracy, and p values of the features (pink circle; p < 0.01). Abbreviations: BUN, blood urea nitrogen; eGFR, estimated glomerular filtration rate; pH, potential hydrogen; pO2, partial pressure of oxygen; PTT, partial thromboplastin time.
To identify the features that influenced the prediction model the most, we depicted the SHAP summary plot of RF model (Figure 4) and the top 20 features of the prediction model. This plot depicts how high and low features’ values were in relation to SHAP values in the testing dataset. According to the prediction model, the higher the SHAP value of a feature, the higher probability of mortality occurring. Additionally, we applied LIME into RF model to illustrate the impact of key features at the individual level (Figure 5).
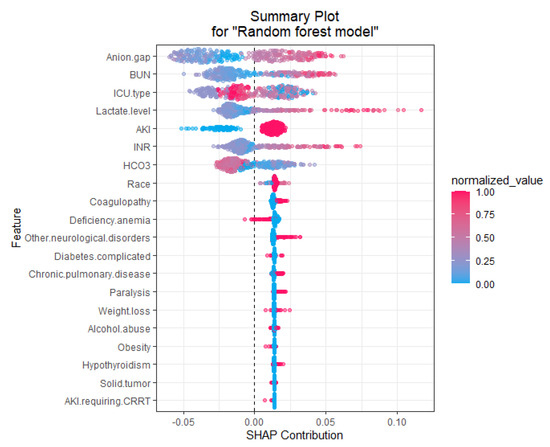
Figure 4.
SHAP summary plot of the top 20 features of the RF model. The higher the SHAP value of a feature, the higher the probability of mortality. A dot is created for each feature attribution value for the model of individual patient. Each patient is allocated one dot on the line for each feature. Dots are colored according to the values of features for the respective patient and accumulate vertically to depict density. Red represents higher feature values, and blue represents lower feature values. Abbreviations: AKI, acute kidney injury; BUN, blood urea nitrogen; CRRT, continuous renal replacement therapy; HCO3, bicarbonate; ICU, intensive care unit; INR, international normalized ratio.
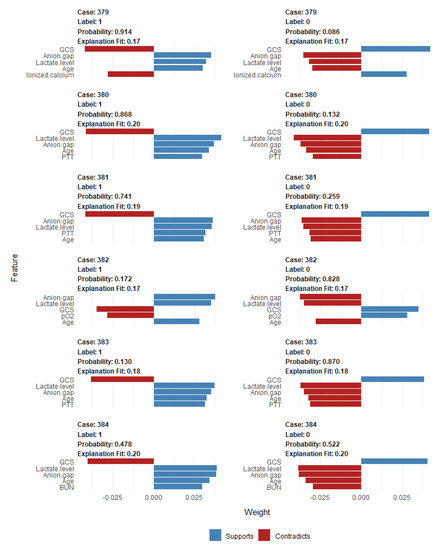
Figure 5.
Local interpretable model explainer (LIME) for 6 individual cases (case# 379 to 384) from the testing dataset. Label “1” means prediction of mortality and label “0” means prediction of no mortality (survival). Probability shows the probability of the observation belong to the label “1” or “0”. The five most influential variables that best explain the linear model in that observation’s local region are provided and whether the variable causes an increase in the probability (supports/blue bar) or a decrease in the probability (contradicts/red bar). The x-axis shows how much each feature added or subtracted to the final probability value for the patient. Abbreviations: BUN, blood urea nitrogen; GCS, Glasgow Coma Scale; PTT, partial thromboplastin time; pO2, partial pressure of oxygen.
4. Discussion
Significant efforts have been invested into the development of predictive risk models of mortality for ICU patients. Traditional statistical models such as logistic regression analysis have been previously utilized to construct such prognostication tools [49,50,51,52]. In recent years, ML predictive algorithms have emerged as a method to handle high-dimensional, unstructured, and complex structure data [28,29,30,31,32,33,34]. In this study, we compared ML models and a conventional multivariable logistic regression model to assess the best-performing model for in-hospital mortality among ICU patients with lactic acidosis. The findings from our study suggest that the RF algorithm demonstrated superior performance in prediction of mortality among critically ill patients with lactic acidosis compared to other predictive tools.
Modern ICUs and advances in electronic health records (EHRs) generate vast amounts of complex and multidimensional data that provide valuable information on patient outcomes. This has led to considerable advances in precision medicine [53]. While elevated serum lactate levels have been shown to be associated with increased mortality [54,55,56] and its incorporation improves predictive performance in traditional logistic regression models among critically ill patients [26,27], mortality risk prediction among the subgroup of ICU patients with lactic acidosis [54,55,56] is limited, especially utilizing ML approaches. Furthermore, patients with lactic acidosis are heterogenous and the impact of lactic acidosis on ICU mortality varies based on the clinical ICU setting, such as trauma, cardiac surgery, and sepsis [54,55,56]. Given the heterogeneity of ICU patients with lactic acidosis and the lack of adequate tools for patient-level prognostication, clinicians may often resort to subjective gestalt judgment, which is prone to bias [57]. Thus, we investigated whether ML methods improved mortality prognostication for ICU lactic acidosis in this study to improve precision medicine. Our best model was reached using the RF algorithm, which was associated with the highest AUROC and lowest ERR compared to all other models. We acknowledged that AUROC has several flaws [58], and thus, we also investigated other evaluation metrics including accuracy, precision, MCC, and F1 score. These confirmed the robustness of our RF prediction model. Finally, the findings that the predicted probabilities are close to the expected probability distribution supports that our RF model for mortality predication among ICU patients with lactic acidosis is well-calibrated.
RF is a widely used ML approach that can effectively predict outcomes [40]. It does this by utilizing additive combinations of trees that are built using different subsets of data and variables [42,59]. This nonparametric and nonlinear machine learning RF method can resist noise, and thus, it is expected to build accurate prediction models using aggregated data [40,60]. As a type of robust nonparametric model, RF can simulate complex relationships and it does not depend on data distribution, such as in logistic regression [40]. In addition, RF works well on large datasets, particularly when there are many categorical independent variables and unbalanced data [42]. On the other hand, the logistic regression analysis approach uses a generalized linear equation and the stepwise variable selection method is based on the likelihood ratio test to describe the directed dependencies among a set of variables. These approaches require that a number of statistical assumptions must be met. Thus, logistic regression analysis possesses inherent bias and, consequently, low variance due to the rigid nature from the shape of the line. Our RF prediction model also outperformed acute severity scores (SOFA and SAPS II scores) and comorbidities score (Charlson score) for prediction of ICU patients with lactic acidosis hospital mortality. In addition, this study provided important information on variables in our RF model including BUN, anion gap, lactate level, INR, pO2, phosphate level, PTT, platelet count, pH, and baseline eGFR. These variables in the RF model for critically ill patients with lactic acidosis using a MIMICIII database will help each institution develop their individualized RF model to better prognosticate mortality risk. Additionally, we applied model-agnostic approaches including feature relevant explanation through SHAP and local explanations through the LIME approach [61], which demonstrated how our RF model can be used to explain how each feature contributes to mortality prediction among patients with lactic acidosis.
Although our study includes a large sample size of ICU patients with lactic acidosis and ICU admission data, there are several important limitations. First, our models utilized data obtained during the time of ICU admission in order to prognosticate mortality risk in the early ICU course. Thus, events that markedly altered the prognosis for an individual patient were not included. In addition, our study is retrospective and based on the MIMIC III database, a large single-center tertiary care hospital in the United States. Hence, the model might have been influenced by the specific clinical guidelines, practice, and treatment decisions for that institution. A future validation study with the updated MIMIC-IV database and external validation studies of ML prediction models are needed.
5. Conclusions
In conclusion, an ML prediction model using the RF algorithm (available online as a shiny app at https://wisitc.shinyapps.io/RandomForestLacticAcid/ created on 15 September 2021)) provided the highest predictive performance for hospital mortality among ICU patients with lactic acidosis. While future external validation studies are required, the findings of our study provide support towards the utilization of RF algorithms to improve risk stratification among critically patients with lactic acidosis.
Supplementary Materials
The following are available online at https://www.mdpi.com/article/10.3390/jcm10215021/s1, Figure S1: Correlation of variables in the dataset; Figure S2: Pruned DT based on cross-validated error results using the complexity parameter associated with the minimal error; Figure S3: Error rate of RF model by number of trees; Figures S4–S10: Calibration plot of among all models; Supplementary method: detailed model development and TRIPOD checklist.
Author Contributions
Conceptualization, P.P., C.T., W.K., F.Q. (Fawad Qureshi), F.Q. (Fahad Qureshi), T.P., N.S., G.G., O.A.O., S.C., S.V., P.K.G., M.A.M., V.D.G., J.J.D. and W.C.; Data curation, P.P., C.T. and W.C.; Formal analysis, P.P., C.T. and W.C.; Investigation, P.P., C.T., W.K. and W.C.; Methodology, P.P., C.T., W.K. and W.C.; Project administration, P.P., C.T., W.K., F.Q. (Fawad Qureshi) and W.C.; Resources, P.P., F.Q. (Fawad Qureshi) and W.C.; Software, P.P. and W.C.; Supervision, P.P., F.Q. (Fawad Qureshi), N.S., G.G., O.A.O., V.D.G., J.J.D. and W.C.; Validation, P.P., C.T., W.K., T.P. and W.C.; Visualization, P.P., C.T. and W.C.; Writing—original draft, P.P., C.T. and F.Q. (Fahad Qureshi); Writing—review and editing, P.P., C.T., W.K., F.Q. (Fawad Qureshi), F.Q. (Fahad Qureshi), T.P., N.S., G.G., O.A.O., S.C., S.V., P.K.G., M.A.M., V.D.G. and J.J.D. All authors have read and agreed to the published version of the manuscript.
Funding
This research received no external funding.
Institutional Review Board Statement
The study was conducted according to the guidelines of the Declaration of Helsinki, and approved by the Institutional Review Board of Mayo Clinic (IRB number-21-009222).
Informed Consent Statement
Patient consent was waived due to the minimal risk nature of observational chart review studies.
Data Availability Statement
Data are available upon reasonable request to the corresponding author.
Conflicts of Interest
The authors declare no conflict of interest.
References
- Vernon, C.; LeTourneau, J.L. Lactic Acidosis: Recognition, Kinetics, and Associated Prognosis. Crit. Care Clin. 2010, 26, 255–283. [Google Scholar] [CrossRef] [PubMed]
- Levy, B. Lactate and shock state: The metabolic view. Curr. Opin. Crit. Care 2006, 12, 315–321. [Google Scholar] [CrossRef] [PubMed]
- Trzeciak, S.; Dellinger, R.P.; Chansky, M.E.; Arnold, R.C.; Schorr, C.; Milcarek, B.; Hollenberg, S.M.; Parrillo, J.E. Serum lactate as a predictor of mortality in patients with infection. Intensiv. Care Med. 2007, 33, 970–977. [Google Scholar] [CrossRef] [PubMed]
- Jansen, T.C.; van Bommel, J.; Woodward, R.; Mulder, P.G.H.; Bakker, J. Association between blood lactate levels, Sequential Organ Failure Assessment subscores, and 28-day mortality during early and late intensive care unit stay: A retrospective observational study. Crit. Care Med. 2009, 37, 2369–2374. [Google Scholar] [CrossRef]
- Levraut, J.; Ciebiera, J.-P.; Chave, S.; Rabary, O.; Jambou, P.; Carles, M.; Grimaud, D. Mild Hyperlactatemia in Stable Septic Patients Is Due to Impaired Lactate Clearance Rather Than Overproduction. Am. J. Respir. Crit. Care Med. 1998, 157, 1021–1026. [Google Scholar] [CrossRef]
- Filho, R.R.; Rocha, L.L.; Corrêa, T.D.; Pessoa, C.M.S.; Colombo, G.; Assuncao, M.S.C. Blood Lactate Levels Cutoff and Mortality Prediction in Sepsis—Time for a Reappraisal? A Retrospective Cohort Study. Shock 2016, 46, 480–485. [Google Scholar] [CrossRef]
- Cheungpasitporn, W.; Zand, L.; Dillon, J.J.; Qian, Q.; Leung, N. Lactate clearance and metabolic aspects of continuous high-volume hemofiltration. Clin Kidney J 2015, 8, 374–377. [Google Scholar] [CrossRef]
- Kreisberg, R.A. Lactate Homeostasis and Lactic Acidosis. Ann. Intern. Med. 1980, 92, 227–237. [Google Scholar] [CrossRef]
- Bakker, J.; Gris, P.; Coffernils, M.; Kahn, R.J.; Vincent, J.-L. Serial blood lactate levels can predict the development of multiple organ failure following septic shock. Am. J. Surg. 1996, 171, 221–226. [Google Scholar] [CrossRef]
- Sammour, T.; Kahokehr, A.; Caldwell, S.; Hill, A.G. Venous glucose and arterial lactate as biochemical predictors of mortality in clinically severely injured trauma patients—A comparison with ISS and TRISS. Injury 2009, 40, 104–108. [Google Scholar] [CrossRef]
- Lavery, R.F.; Livingston, D.H.; Tortella, B.J.; Sambol, J.T.; Slomovitz, B.M.; Siegel, J.H. The utility of venous lactate to triage injured patients in the trauma center. J. Am. Coll. Surg. 2000, 190, 656–664. [Google Scholar] [CrossRef]
- O’Connor, E.; Fraser, J.F. The Interpretation of Perioperative Lactate Abnormalities in Patients Undergoing Cardiac Surgery. Anaesth. Intensiv. Care 2012, 40, 598–603. [Google Scholar] [CrossRef]
- Ranucci, M.; De Toffol, B.; Isgrò, G.; Romitti, F.; Conti, D.; Vicentini, M. Hyperlactatemia during cardiopulmonary bypass: Determinants and impact on postoperative outcome. Crit. Care 2006, 10, R167. [Google Scholar] [CrossRef]
- Toraman, F.; Evrenkaya, S.; Yuce, M.; Aksoy, N.; Karabulut, H.; Bozkulak, Y.; Alhan, C. Lactic Acidosis after Cardiac Surgery Is Associated with Adverse Outcome. Hear. Surg. Forum 2004, 7, E155–E159. [Google Scholar] [CrossRef]
- Renew, J.R.; Barbara, D.W.; Hyder, J.A.; Dearani, J.A.; Rivera, M.; Pulido, J.N. Frequency and outcomes of severe hyperlactatemia after elective cardiac surgery. J. Thorac. Cardiovasc. Surg. 2016, 151, 825–830. [Google Scholar] [CrossRef]
- Maillet, J.-M.; Le Besnerais, P.; Cantoni, M.; Nataf, P.; Ruffenach, A.; Lessana, A.; Brodaty, D. Frequency, Risk Factors, and Outcome of Hyperlactatemia After Cardiac Surgery. Chest 2003, 123, 1361–1366. [Google Scholar] [CrossRef]
- Demers, P.; Elkouri, S.; Martineau, R.; Couturier, A.; Cartier, R. Outcome with high blood lactate levels during cardiopulmonary bypass in adult cardiac operation. Ann. Thorac. Surg. 2000, 70, 2082–2086. [Google Scholar] [CrossRef]
- Ranucci, M.; Ballotta, A.; Castelvecchio, S.; Baryshnikova, E.; Brozzi, S.; Boncilli, A. Intensive Care Unit Admission Parameters Improve the Accuracy of Operative Mortality Predictive Models in Cardiac Surgery. PLoS ONE 2010, 5, e13551. [Google Scholar] [CrossRef]
- Peters, N.; Jay, N.; Barraud, D.; Cravoisy, A.; Nace, L.; Bollaert, P.-E.; Gibot, S. Metformin-associated lactic acidosis in an intensive care unit. Crit. Care 2008, 12, R149. [Google Scholar] [CrossRef]
- Biradar, V.; Moran, J.L.; Peake, S.L.; Peter, J.V. Metformin-associated lactic acidosis (MALA): Clinical profile and outcomes in patients admitted to the intensive care unit. Crit. Care Resusc. 2010, 12, 191–195. [Google Scholar]
- Dellinger, R.P.; Levy, M.M.; Carlet, J.M.; Bion, J.; Parker, M.M.; Jaeschke, R.; Reinhart, K.; Angus, D.C.; Brun-Buisson, C.; Beale, R.; et al. Surviving Sepsis Campaign: International guidelines for management of severe sepsis and septic shock: 2008. Intensive Care Med. 2008, 36, 296–327. [Google Scholar] [CrossRef]
- Weil, M.H.; Afifi, A.A. Experimental and Clinical Studies on Lactate and Pyruvate as Indicators of the Severity of Acute Circulatory Failure (Shock). Circulation 1970, 41, 989–1001. [Google Scholar] [CrossRef]
- Baysan, M.; Baroni, G.D.; van Boekel, A.M.; Steyerberg, E.W.; Arbous, M.S.; van der Bom, J.G. The Added Value of Lactate and Lactate Clearance in Prediction of In-Hospital Mortality in Critically Ill Patients With Sepsis. Crit. Care Explor. 2020, 2, e0087. [Google Scholar] [CrossRef] [PubMed]
- Zhang, Z.; Chen, K.; Ni, H.; Fan, H. Predictive value of lactate in unselected critically ill patients: An analysis using fractional polynomials. J. Thorac. Dis. 2014, 6, 995–1003. [Google Scholar] [CrossRef]
- Yang, C.-C.; Chan, K.-S.; Tseng, K.-L.; Weng, S.-F. Prognosis of alcohol-associated lactic acidosis in critically ill patients: An 8-year study. Sci. Rep. 2016, 6, 35368. [Google Scholar] [CrossRef]
- Drolz, A.; Horvatits, T.; Rutter, K.; Landahl, F.; Roedl, K.; Meersseman, P.; Wilmer, A.; Kluwe, J.; Lohse, A.W.; Kluge, S.; et al. Lactate Improves Prediction of Short-Term Mortality in Critically Ill Patients With Cirrhosis: A Multinational Study. Hepatology 2019, 69, 258–269. [Google Scholar] [CrossRef]
- Hayashi, Y.; Endoh, H.; Kamimura, N.; Tamakawa, T.; Nitta, M. Lactate indices as predictors of in-hospital mortality or 90-day survival after admission to an intensive care unit in unselected critically ill patients. PLoS ONE 2020, 15, e0229135. [Google Scholar] [CrossRef] [PubMed]
- Fröhlich, H.; Balling, R.; Beerenwinkel, N.; Kohlbacher, O.; Kumar, S.; Lengauer, T.; Maathuis, M.H.; Moreau, Y.; Murphy, S.A.; Przytycka, T.M.; et al. From hype to reality: Data science enabling personalized medicine. BMC Med. 2018, 16, 1–15. [Google Scholar] [CrossRef]
- Sohail, A.; Arif, F. Supervised and unsupervised algorithms for bioinformatics and data science. Prog. Biophys. Mol. Biol. 2020, 151, 14–22. [Google Scholar] [CrossRef]
- Lin, K.; Hu, Y.; Kong, G. Predicting in-hospital mortality of patients with acute kidney injury in the ICU using random forest model. Int. J. Med. Inform. 2019, 125, 55–61. [Google Scholar] [CrossRef]
- Raita, Y.; Goto, T.; Faridi, M.K.; Brown, D.F.M.; Camargo, C.A., Jr.; Hasegawa, K. Emergency department triage prediction of clinical outcomes using machine learning models. Crit. Care 2019, 23, 64. [Google Scholar] [CrossRef] [PubMed]
- Johnson, A.E.W.; Ghassemi, M.M.; Nemati, S.; Niehaus, K.E.; Clifton, D.A.; Clifford, G. Machine Learning and Decision Support in Critical Care. Proc. IEEE 2016, 104, 444–466. [Google Scholar] [CrossRef] [PubMed]
- Nielsen, A.B.; Thorsen-Meyer, H.-C.; Belling, K.; Nielsen, A.P.; Thomas, C.E.; Chmura, P.; Lademann, M.; Moseley, P.L.; Heimann, M.; Dybdahl, L.; et al. Survival prediction in intensive-care units based on aggregation of long-term disease history and acute physiology: A retrospective study of the Danish National Patient Registry and electronic patient records. Lancet Digit. Health 2019, 1, e78–e89. [Google Scholar] [CrossRef]
- Hsieh, M.H.; Chen, C.-M.; Hsieh, C.-C.; Chao, C.-M.; Lai, C.-C. Comparison of machine learning models for the prediction of mortality of patients with unplanned extubation in intensive care units. Sci. Rep. 2018, 8, 17116. [Google Scholar] [CrossRef]
- Manz, C.R.; Chen, J.; Liu, M.; Chivers, C.; Regli, S.H.; Braun, J.; Draugelis, M.; Hanson, C.W.; Shulman, L.N.; Schuchter, L.M.; et al. Validation of a Machine Learning Algorithm to Predict 180-Day Mortality for Outpatients With Cancer. JAMA Oncol. 2020, 6, 1723. [Google Scholar] [CrossRef]
- Johnson, A.E.W.; Pollard, T.J.; Shen, L.; Lehman, L.-W.H.; Feng, M.; Ghassemi, M.; Moody, B.; Szolovits, P.; Anthony Celi, L.; Mark, R.G. MIMIC-III, a freely accessible critical care database. Sci. Data 2016, 3, 160035. [Google Scholar] [CrossRef]
- Collins, G.S.; Reitsma, J.B.; Altman, D.G.; Moons, K.G.M. Transparent Reporting of a multivariable prediction model for Individual Prognosis or Diagnosis (TRIPOD): The TRIPOD Statement. J. Br. Surg. 2015, 102, 148–158. [Google Scholar] [CrossRef]
- Singh, D.; Singh, B. Investigating the impact of data normalization on classification performance. Appl. Soft Comput. 2020, 97, 105524. [Google Scholar] [CrossRef]
- Harvey, H.B.; Sotardi, S.T. The Pareto Principle. J. Am. Coll. Radiol. 2018, 15, 931. [Google Scholar] [CrossRef]
- Breiman, L. Random forests. Mach. Learn. 2001, 45, 5–32. [Google Scholar] [CrossRef]
- Huang, J.-C.; Tsai, Y.-C.; Wu, P.-Y.; Lien, Y.-H.; Chien, C.-Y.; Kuo, C.-F.; Hung, J.-F.; Chen, S.-C.; Kuo, C.-H. Predictive modeling of blood pressure during hemodialysis: A comparison of linear model, random forest, support vector regression, XGBoost, LASSO regression and ensemble method. Comput. Methods Programs Biomed. 2020, 195, 105536. [Google Scholar] [CrossRef] [PubMed]
- Muchlinski, D.; Siroky, D.; He, J.; Kocher, M. Comparing Random Forest with Logistic Regression for Predicting Class-Imbalanced Civil War Onset Data. Political Anal. 2016, 24, 87–103. [Google Scholar] [CrossRef]
- Bergstra, J.; Bardenet, R.; Bengio, Y.; Kégl, B. Algorithms for hyper-parameter optimization. Adv. Neural Inf. Process. Syst. 2011, 24, 2546–2554. [Google Scholar]
- McGee, S. Simplifying likelihood ratios. J. Gen. Intern. Med. 2002, 17, 647–650. [Google Scholar] [CrossRef]
- Zou, K.H.; O’Malley, A.J.; Mauri, L. Receiver-Operating Characteristic Analysis for Evaluating Diagnostic Tests and Predictive Models. Circulation 2007, 115, 654–657. [Google Scholar] [CrossRef]
- Hanley, J.A.; McNeil, B.J. The meaning and use of the area under a receiver operating characteristic (ROC) curve. Radiology 1982, 143, 29–36. [Google Scholar] [CrossRef]
- Huang, Y.; Li, W.; Macheret, F.; Gabriel, R.A.; Ohno-Machado, L. A tutorial on calibration measurements and calibration models for clinical prediction models. J. Am. Med. Inform. Assoc. 2020, 27, 621–633. [Google Scholar] [CrossRef]
- Stekhoven, D.J.; Bühlmann, P. MissForest—Non-parametric missing value imputation for mixed-type data. Bioinformatics 2012, 28, 112–118. [Google Scholar] [CrossRef]
- Moreno, R.P.; Metnitz, P.G.H.; Almeida, E.; Jordan, B.; Bauer, P.; Campos, R.A.; Iapichino, G.; Edbrooke, D.; Capuzzo, M.; Le Gall, J.-R. SAPS 3—From evaluation of the patient to evaluation of the intensive care unit. Part 2: Development of a prognostic model for hospital mortality at ICU admission. Intensive Care Med. 2005, 31, 1345–1355. [Google Scholar] [CrossRef]
- Iwashyna, T.J.; Ma, C.; Wang, X.Q.; Seelye, S.; Zhu, J.; Waljee, A.K. Variation in model performance by data cleanliness and classification methods in the prediction of 30-day ICU mortality, a US nationwide retrospective cohort and simulation study. BMJ Open 2020, 10, e041421. [Google Scholar] [CrossRef]
- Fika, S.; Nanas, S.; Baltopoulos, G.; Charitidou, E.; Myrianthefs, P. A novel mortality prediction model for the current population in an adult intensive care unit. Heart Lung 2018, 47, 10–15. [Google Scholar] [CrossRef] [PubMed]
- Loreto, M.; Lisboa, T.; Moreira, V.P. Early prediction of ICU readmissions using classification algorithms. Comput. Biol. Med. 2020, 118, 103636. [Google Scholar] [CrossRef] [PubMed]
- Handelman, G.S.; Kok, H.K.; Chandra, R.V.; Razavi, A.H.; Lee, M.J.; Asadi, H. eDoctor: Machine learning and the future of medicine. J. Intern. Med. 2018, 284, 603–619. [Google Scholar] [CrossRef] [PubMed]
- Chik, C.; Hayes, G.M.; Menard, J. Development of a veterinary trauma score (VetCOT) in canine trauma patients with per-formance evaluation and comparison to the animal trauma triage score: A VetCOT registry study. J. Vet. Emerg. Crit. Care 2021. [Google Scholar] [CrossRef]
- Kasapoğlu, U.S.; Kaçmaz, O.; Gök, A.; Yildiz Eglen, M.; Şayan, H.; Çolak, F. Prognostic factors for 30-days mortality in eighty years aged and older critically ill patients: A single center retrospec-tive cohort study. Turk. J. Med. Sci. 2021. [Google Scholar] [CrossRef]
- Lim, J.-H.; Jeon, Y.; Ahn, J.-S.; Kim, S.; Kim, D.K.; Lee, J.P.; Ryu, D.-R.; Seong, E.Y.; Ahn, S.Y.; Baek, S.H.; et al. GDF-15 Predicts In-Hospital Mortality of Critically Ill Patients with Acute Kidney Injury Requiring Continuous Renal Replacement Therapy: A Multicenter Prospective Study. J. Clin. Med. 2021, 10, 3660. [Google Scholar] [CrossRef]
- Kahneman, D.; Lovallo, D.; Sibony, O. Before you make that big decision. Harv. Bus. Rev. 2011, 89, 50. [Google Scholar]
- Lobo, J.M.; Jiménez-Valverde, A.; Real, R. AUC: A misleading measure of the performance of predictive distribution models. Glob. Ecol. Biogeogr. 2008, 17, 145–151. [Google Scholar] [CrossRef]
- Rashidi, H.H.; Tran, N.K.; Betts, E.V.; Howell, L.P.; Green, R. Artificial Intelligence and Machine Learning in Pathology: The Present Landscape of Supervised Methods. Acad. Pathol. 2019, 6, 2374289519873088. [Google Scholar] [CrossRef]
- Wasserman, L.; Roeder, K. High-dimensional variable selection. Ann. Stat. 2009, 37, 2178–2201. [Google Scholar] [CrossRef]
- Lundberg, S.M.; Nair, B.; Vavilala, M.S.; Horibe, M.; Eisses, M.J.; Adams, T.; Liston, D.E.; Low, D.K.-W.; Newman, S.-F.; Kim, J.; et al. Explainable machine-learning predictions for the prevention of hypoxaemia during surgery. Nat. Biomed. Eng. 2018, 2, 749–760. [Google Scholar] [CrossRef]


Publisher’s Note: MDPI stays neutral with regard to jurisdictional claims in published maps and institutional affiliations. |
© 2021 by the authors. Licensee MDPI, Basel, Switzerland. This article is an open access article distributed under the terms and conditions of the Creative Commons Attribution (CC BY) license (https://creativecommons.org/licenses/by/4.0/).