
The Index of Microcirculatory Resistance after Primary Percutaneous Coronary Intervention Predicts Long-Term Clinical Outcomes in Patients with ST-Segment Elevation Myocardial Infarction

 ,
,
Abstract
1. Introduction
2. Materials and Methods
2.1. Study Population
2.2. Coronary Physiologic Parameter
2.3. Left Ventricular Function Assessment
2.4. Clinical Outcomes
2.5. Statistical Analysis
3. Results
3.1. Baseline Characteristics
3.2. Angiographic Characteristics
3.3. Relationship between IMR and Echocardiographic Indices
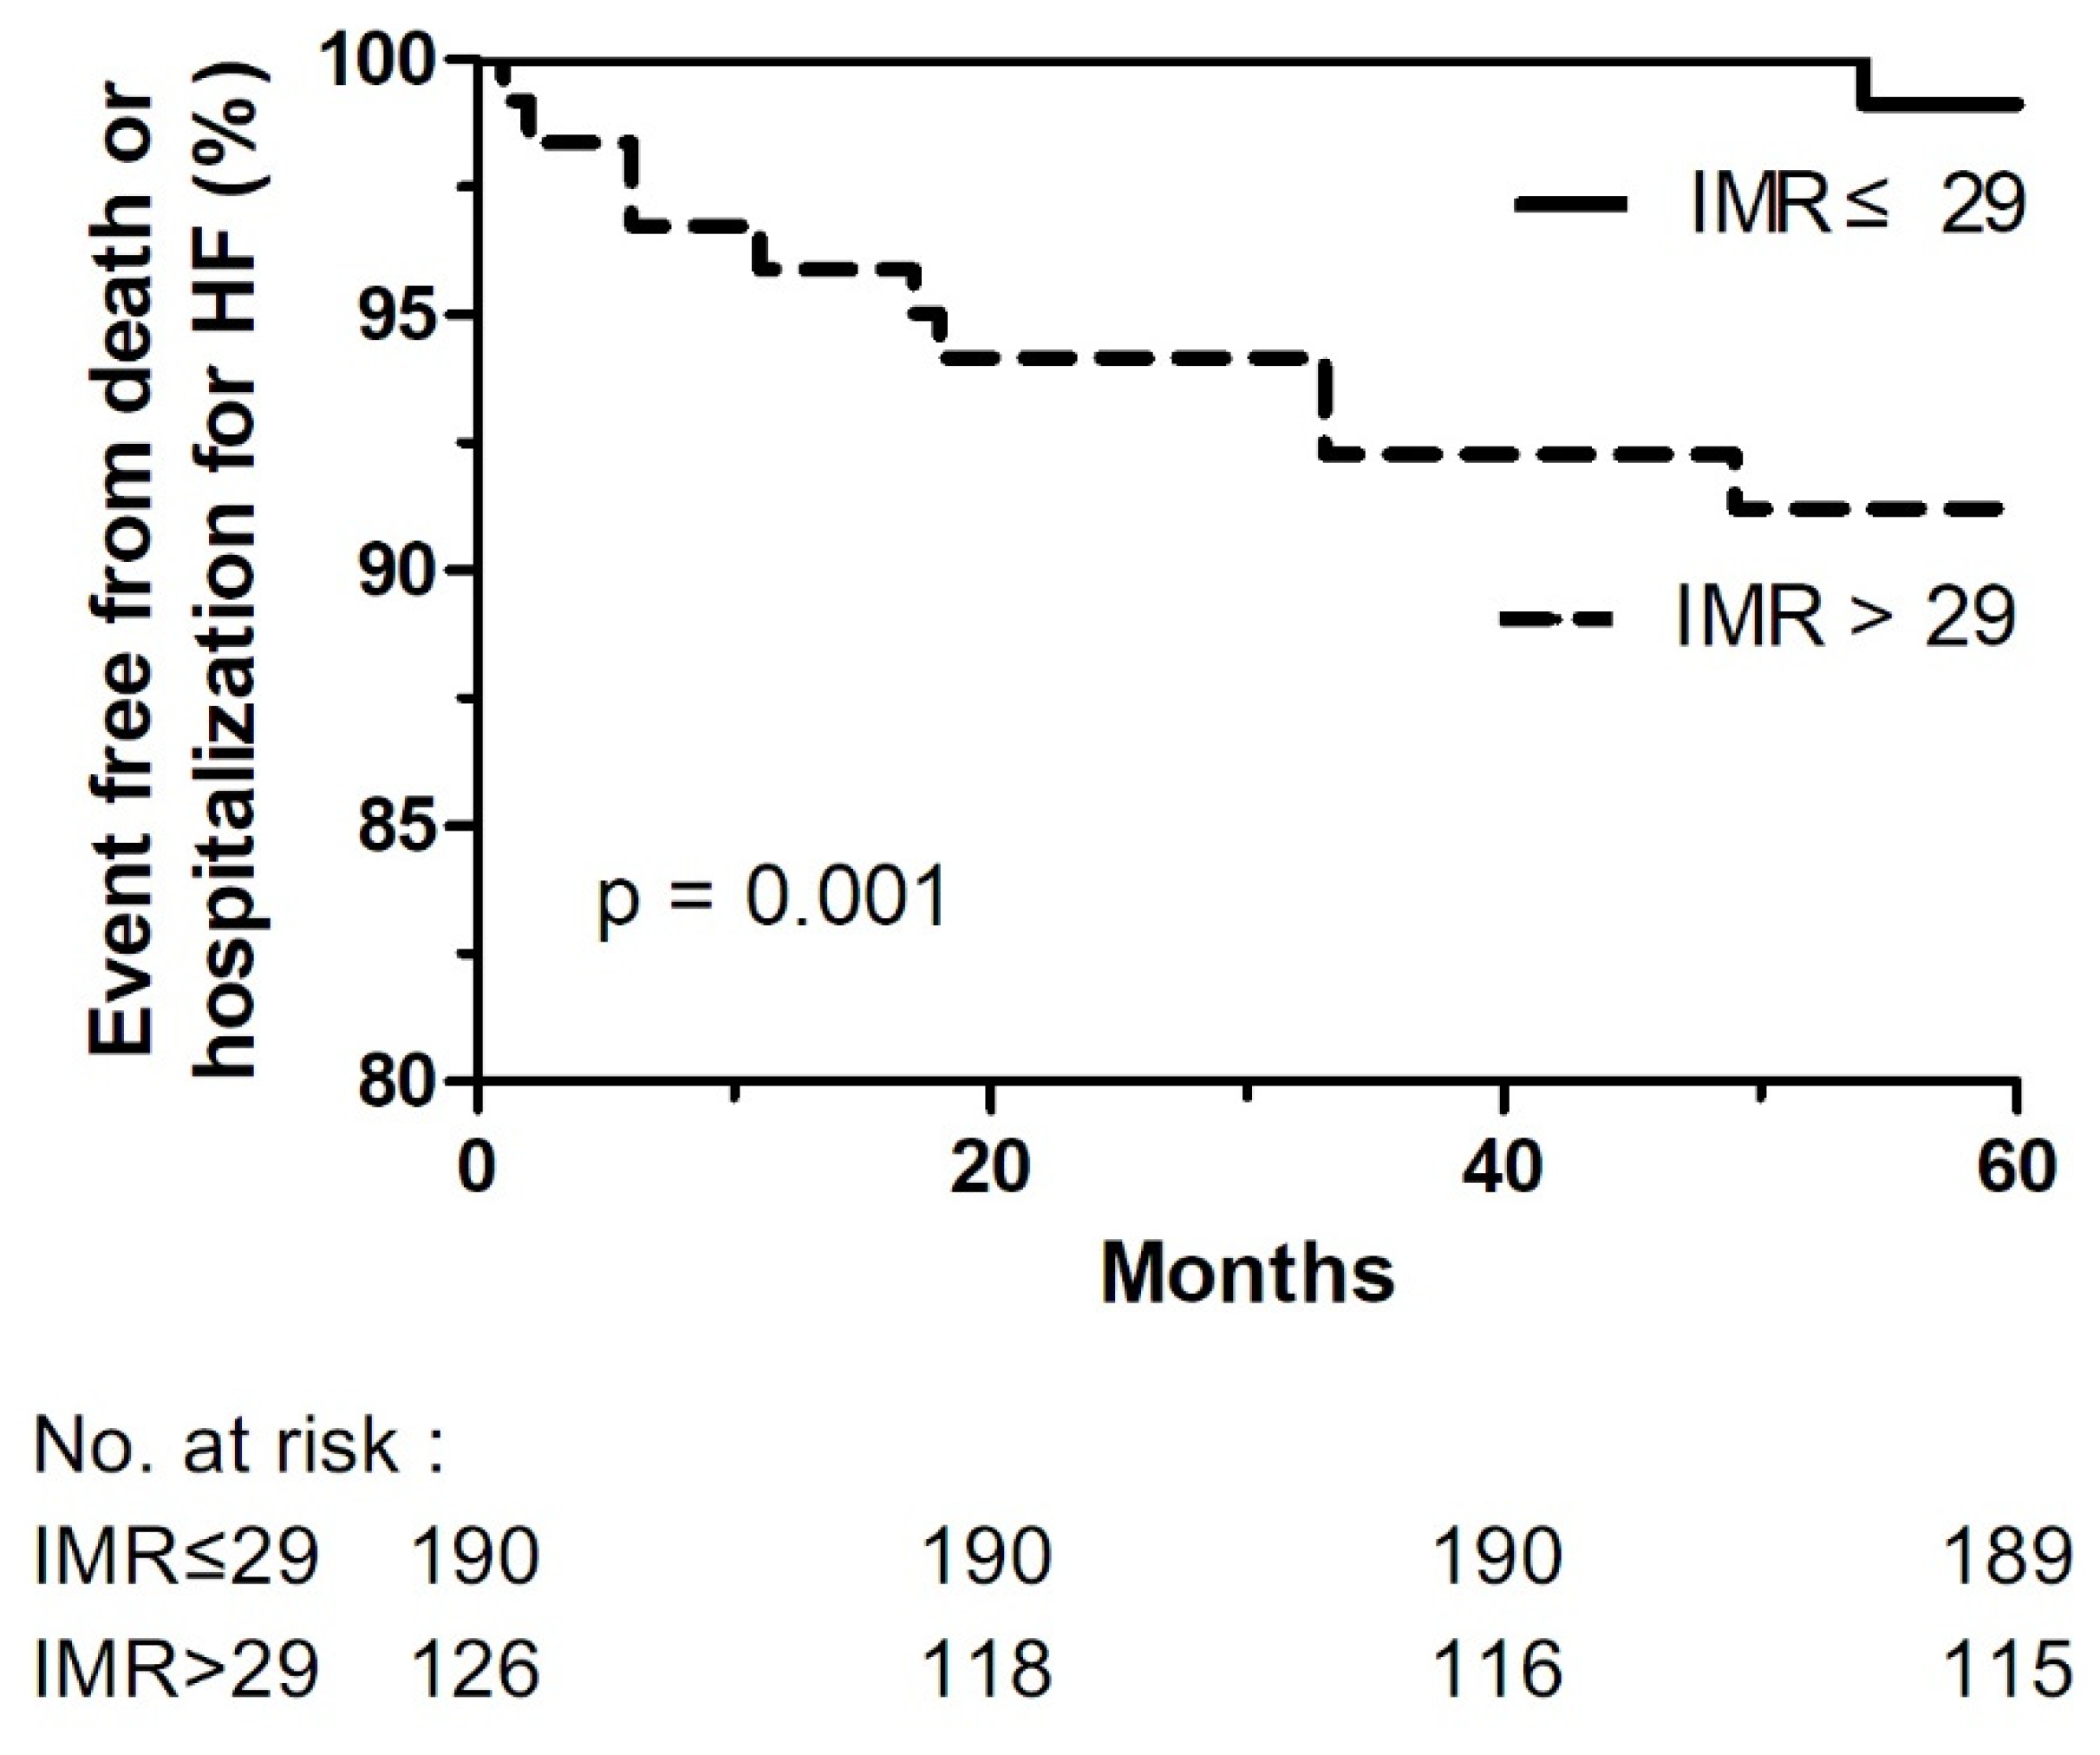
3.4. Clinical Outcomes
4. Discussion
5. Conclusions
Author Contributions
Funding
Institutional Review Board Statement
Informed Consent Statement
Data Availability Statement
Conflicts of Interest
References
- Weir, R.A.P.; Murphy, C.A.; Petrie, C.J.; Martin, T.N.; Balmain, S.; Clements, S.; Steedman, T.; Wagner, G.S.; Dargie, H.J.; McMurray, J.J.V. Microvascular obstruction remains a portent of adverse remodeling in optimally treated patients with left ventricular systolic dysfunction after acute myocardial infarction. Circ. Cardiovasc. Imaging 2010, 3, 360–367. [Google Scholar] [CrossRef] [PubMed]
- Hamirani, Y.S.; Wong, A.; Kramer, C.M.; Salerno, M. Effect of microvascular obstruction and intramyocardial hemorrhage by CMR on LV remodeling and outcomes after myocardial infarction: A systematic review and meta-analysis. JACC Cardiovasc. Imaging 2014, 7, 940–952. [Google Scholar] [CrossRef]
- Niccoli, G.; Burzotta, F.; Galiuto, L.; Crea, F. Myocardial no-reflow in humans. J. Am. Coll. Cardiol. 2009, 54, 281–292. [Google Scholar] [CrossRef] [PubMed]
- Gibson, C.M.; Cannon, C.P.; Murphy, S.A.; Ryan, K.A.; Mesley, R.; Marble, S.J.; McCabe, C.H.; Van de Werf, F.; Braunwald, E. Relationship of TIMI myocardial perfusion grade to mortality after administration of thrombolytic drugs. Circulation 2000, 101, 125–130. [Google Scholar] [CrossRef] [PubMed]
- Wu, K.C.; Zerhouni, E.A.; Judd, R.M.; Lugo-Olivieri, C.H.; Barouch, L.A.; Schulman, S.P.; Blumenthal, R.S.; Lima, J.A.C. Prognostic significance of microvascular obstruction by magnetic resonance imaging in patients with acute myocardial infarction. Circulation 1998, 97, 765–972. [Google Scholar] [CrossRef] [PubMed]
- Herzog, B.A.; Husmann, L.; Valenta, I.; Gaemperli, O.; Siegrist, P.T.; Tay, F.M.; Burkhard, N.; Wyss, C.A.; Kaufmann, P.A. Long-term prognostic value of 13N-ammonia myocardial perfusion positron emission tomography added value of coronary flow reserve. J. Am. Coll. Cardiol. 2009, 54, 150–156. [Google Scholar] [CrossRef]
- Fearon, W.F.; Balssm, L.B.; Farouque, H.M.O.; Robbins, R.C.; Fitzgerald, P.J.; Yock, P.G.; Yeung, A.C. Novel index for invasively assessing the coronary microcirculation. Circulation 2003, 107, 3129–3132. [Google Scholar] [CrossRef] [PubMed]
- Ng, M.K.C.; Yeung, A.C.; Fearon, W.F. Invasive assessment of the coronary microcirculation: Superior reproducibility and less hemodynamic dependence of index of microcirculatory resistance compared with coronary flow reserve. Circulation 2006, 113, 2054–2061. [Google Scholar] [CrossRef] [PubMed]
- Fearon, W.F.; Shah, M.; Martin, N.; Brinton, T.; Wilson, A.; Tremmel, J.A.; Schnittger, I.; Lee, D.P.; Vagelos, R.H.; Fitzgerald, P.J.; et al. Predictive value of the index of microcirculatory resistance in patients with ST-segment elevation myocardial infarction. J. Am. Coll. Cardiol. 2008, 51, 560–565. [Google Scholar] [CrossRef] [PubMed]
- Lim, H.S.; Yoon, M.H.; Tahk, S.J.; Yang, H.M.; Choi, B.J.; Choi, S.Y.; Sheen, S.S.; Hwang, G.S.; Kang, S.J.; Shin, J.H. Usefulness of the index of microcirculatory resistance for invasively assessing myocardial viability immediately after primary angioplasty for anterior myocardial infarction. Eur. Heart J. 2009, 30, 2854–2860. [Google Scholar] [CrossRef][Green Version]
- McGeoch, R.; Watkins, S.; Berry, C.; Steedman, T.; Davie, A.; Byrne, J.; Hillis, S.; Lindsay, M.; Robb, S.; Dargie, H.; et al. The index of microcirculatory resistance measured acutely predicts the extent and severity of myocardial infarction in patients with ST-segment elevation myocardial infarction. JACC Cardiovasc. Interv. 2010, 3, 715–722. [Google Scholar] [CrossRef] [PubMed]
- Windecker, S.; Kolh, P.; Alfonso, F.; Collet, J.P.; Cremer, J.; Falk, V.; Filippatos, G.; Hamm, C.; Head, S.J.; Juni, P.; et al. 2014 ESC/EACTS Guidelines on myocardial revascularization: The Task Force on Myocardial Revascularization of the European Society of Cardiology (ESC) and the European Association for Cardio-Thoracic Surgery (EACTS) Developed with the special contribution of the European Association of Percutaneous Cardiovascular Interventions (EAPCI). Eur. Heart J. 2014, 35, 2541–2619. [Google Scholar]
- Yong, A.S.; Layland, J.; Fearon, W.F.; Ho, M.; Shah, M.G.; Daniels, D.; Whitbourn, R.; MacIsaac, A.; Kritharides, L.; Wilson, A.; et al. Calculation of the index of microcirculatory resistance without coronary wedge pressure measurement in the presence of epicardial stenosis. JACC Cardiovasc. Interv. 2013, 6, 53–58. [Google Scholar] [CrossRef] [PubMed]
- Bulluck, H.; Foin, N.; Tan, J.W.; Low, A.F.; Sezer, M.; Hausenloy, D.J. Invasive Assessment of the Coronary Microcirculation in Reperfused ST-Segment-Elevation Myocardial Infarction Patients: Where Do We Stand? Circ. Cardiovasc. Interv. 2017, 10, e004373. [Google Scholar] [CrossRef]
- Ahn, S.G.; Hung, O.Y.; Lee, J.W.; Lee, J.H.; Youn, Y.J.; Ahn, M.S.; Kim, J.Y.; Yoo, B.S.; Lee, S.H.; Yoon, J.H.; et al. Combination of the Thermodilution-Derived Index of Microcirculatory Resistance and Coronary Flow Reserve Is Highly Predictive of Microvascular Obstruction on Cardiac Magnetic Resonance Imaging after ST-Segment Elevation Myocardial Infarction. JACC Cardiovasc. Interv. 2016, 9, 793–801. [Google Scholar] [CrossRef]
- Ahn, S.G.; Lee, S.H.; Lee, J.H.; Lee, J.W.; Youn, Y.J.; Ahn, M.S.; Kim, J.Y.; Yoo, B.S.; Youn, J.H.; Choe, K.H.; et al. Efficacy of combination treatment with intracoronary abciximab and aspiration thrombectomy on myocardial perfusion in patients with ST-segment elevation myocardial infarction undergoing primary coronary stenting. Yonsei Med. J. 2014, 55, 606–616. [Google Scholar] [CrossRef]
- Fukunaga, M.; Fujii, K.; Kawasaki, D.; Sawada, H.; Miki, K.; Tamaru, H.; Imanaka, T.; Iwasaku, T.; Nakata, T.; Shibuya, M.; et al. Thermodilution-derived coronary blood flow pattern immediately after coronary intervention as a predictor of microcirculatory damage and midterm clinical outcomes in patients with ST-segment-elevation myocardial infarction. Circ. Cardiovasc. Interv. 2014, 7, 149–155. [Google Scholar] [CrossRef] [PubMed][Green Version]
- Payne, A.R.; Berry, C.; Doolin, O.; McEntegart, M.; Petrie, M.C.; Lindsay, M.; Hood, S.; Carrick, D.; Tzemos, N.; Weale, P.; et al. Microvascular Resistance Predicts Myocardial Salvage and Infarct Characteristics in ST-Elevation Myocardial Infarction. J. Am. Heart Assoc. 2012, 14, e002246. [Google Scholar] [CrossRef] [PubMed]
- Fearon, W.F.; Low, A.F.; Yong, A.S.; McGeoch, R.; Berry, C.; Shah, M.G.; Ho, M.Y.; Kim, H.S.; Loh, J.P.; Oldroyd, K.G. Prognostic value of the Index of Microcirculatory Resistance measured after primary percutaneous coronary intervention. Circulation 2013, 127, 2436–2441. [Google Scholar] [CrossRef]
- Carrick, D.; Haig, C.; Ahmed, N.; Carberry, J.; May, V.T.Y.; McEntegart, M.; Petrie, M.C.; Eteiba, H.; Lindsay, M.; Hood, S.; et al. Comparative Prognostic Utility of Indexes of Microvascular Function Alone or in Combination in Patients with an Acute ST-Segment-Elevation Myocardial Infarction. Circulation 2016, 134, 1833–1847. [Google Scholar] [CrossRef]
- Lee, J.M.; Layland, J.; Jung, J.H.; Lee, H.J.; Echavarria-Pinto, M.; Watkins, S.; Yong, A.S.; Doh, J.H.; Nam, C.W.; Shin, E.S.; et al. Integrated physiologic assessment of ischemic heart disease in real-world practice using index of microcirculatory resistance and fractional flow reserve: Insights from the International Index of Microcirculatory Resistance Registry. Circ. Cardiovasc. Interv. 2015, 8, e002857. [Google Scholar] [CrossRef]
- Echavarria-Pinto, M.; van de Hoef, T.P.; Nijjer, S.; Gonzalo, N.; Nombela-Franco, L.; Ibanez, B.; Sen, S.; Petraco, R.; Jimenez-Quevedo, P.; Nunez-Gil, I.J.; et al. Influence of the amount of myocardium subtended to a coronary stenosis on the index of microcirculatory resistance. Implications for the invasive assessment of microcirculatory function in ischaemic heart disease. EuroIntervention 2017, 13, 944–952. [Google Scholar] [CrossRef] [PubMed]
- Cuculi, F.; Maria, G.L.D.; Meier, P.; Dall’Armellina, E.; de Caterina, A.R.; Channon, K.M.; Prendergast, B.D.; Choudhury, R.C.; Forfar, J.C.; Kharbanda, R.K.; et al. Impact of microvascular obstruction on the assessment of coronary flow reserve, index of microcirculatory resistance, and fractional flow reserve after ST-segment elevation myocardial infarction. J. Am. Coll. Cardiol. 2014, 64, 1894–1904. [Google Scholar] [CrossRef]
- Park, S.D.; Baek, Y.S.; Lee, M.J.; Kwon, S.W.; Shin, S.H.; Woo, S.I.; Kim, D.H.; Kwan, J.; Park, K.S. Comprehensive assessment of microcirculation after primary percutaneous intervention in ST-segment elevation myocardial infarction: Insight from thermodilution-derived index of microcirculatory resistance and coronary flow reserve. Coron. Artery Dis. 2016, 27, 34–39. [Google Scholar] [CrossRef] [PubMed]
- De Maria, G.L.; Alkhalil, M.; Wolfrum, M.; Fahrmi, G.; Borlotti, A.; Gaughran, L.; Dawkins, S.; Lnagrish, J.P.; Lucking, A.J.; Choudhury, R.P.; et al. Index of Microcirculatory Resistance as a Tool to Characterize Microvascular Obstruction and to Predict Infarct Size Regression in Patients with STEMI Undergoing Primary PCI. JACC Cardiovasc. Imaging 2019, 12, 837–848. [Google Scholar] [CrossRef]
- Ford, T.J.; Ong, P.; Sechtem, U.; Beltrame, J.; Camici, P.G.; Crea, F.; Kaski, J.C.; Bairey Merz, C.N.; Pepine, C.J.; Shimokawa, H.; et al. Assessment of Vascular Dysfunction in Patients Without Obstructive Coronary Artery Disease: Why, How, and When. JACC Cardiovasc. Interv. 2020, 13, 1847–1864. [Google Scholar] [CrossRef] [PubMed]
- Kunadian, V.; Chieffo, A.; Camici, P.G.; Berry, C.; Escaned, J.; Maas, A.; Prescott, E.; Karam, N.; Appelman, Y.; Fraccaro, C.; et al. An EAPCI Expert Consensus Document on Ischaemia with Non-Obstructive Coronary Arteries in Collaboration with European Society of Cardiology Working Group on Coronary Pathophysiology & Microcirculation Endorsed by Coronary Vasomotor Disorders International Study Group. Eur. Heart J. 2020, 41, 3504–3520. [Google Scholar]
- Lim, H.S.; Tahk, S.J.; Yoon, M.H.; Woo, S.I.; Choi, W.J.; Hwang, J.W.; Li, D.H.; Seo, K.W.; Park, J.S.; Kim, J.W.; et al. A Novel Index of Microcirculatory Resistance for Invasively Assessing Myocardial Viability after Primary Angioplasty for Treating Acute Myocardial Infarction: Comparison with FDG-PET Imaging. Korean Circ. J. 2007, 37, 318–326. [Google Scholar] [CrossRef]
- Barbato, E.; Aarnnoudse, W.; Aengevaeren, W.R.; Werner, G.; Klauss, W.; Bojara, W.; Herzfeld, I.; Oldroyd, K.G.; Pijls, N.H.J.; de Bruyne, B. Validation of coronary flow reserve measurements by thermodilution in clinical practice. Eur. Heart J. 2004, 25, 219–223. [Google Scholar] [CrossRef] [PubMed]


| Total | IMR ≤ 29 U | IMR > 29 U | ||
|---|---|---|---|---|
| (n = 190) | (n = 126) | |||
| Age, years | 56.3 ± 11.1 | 54.9 ± 10.6 | 58.3 ± 11.7 | 0.008 |
| Male, n (%) | 277 (87.9) | 171 (90.5) | 106 (84.1) | 0.090 |
| BMI, kg/m2 | 24.6 ± 3.1 | 24.5 ± 2.8 | 24.6 ± 3.5 | 0.805 |
| Comorbidities, n (%) | ||||
| Hypertension | 127 (40.2) | 71 (37.4) | 56 (44.4) | 0.209 |
| Diabetes | 83 (26.3) | 46 (24.2) | 37 (29.4) | 0.308 |
| Dyslipidemia | 139 (44.0) | 102 (53.7) | 37 (29.4) | 0.000 |
| Prior PCI | 5(2.4) | 2(1.7) | 3(3.3) | 0.451 |
| Smoking | 238 (75.3) | 145 (76.3) | 93 (73.8) | 0.613 |
| Systolic blood pressure, mmHg | 131.6 ± 23.5 | 131.1 ± 21.9 | 132.6 ± 26.2 | 0.614 |
| Diastolic blood pressure, mmHg | 81.7 ± 15.7 | 81.7 ± 14.3 | 81.6 ± 17.9 | 0.941 |
| Heart rate, bpm | 77.2 ± 15.4 | 77.9 ± 15.4 | 75.8 ± 15.4 | 0.292 |
| Symptom-to-balloon time, min | 276.1 ± 232.2 | 254.1 ± 225.6 | 308.2 ± 238.8 | 0.046 |
| Symptom-to-door time, min | 201.1 ± 212.4 | 170.6 ± 173.0 | 241.5 ± 250.7 | 0.025 |
| Door-to-balloon time, min | 80.3 ± 82.0 | 79.8 ± 87.1 | 81.0 ± 74.0 | 0.903 |
| Medications at discharge, n (%) | ||||
| Aspirin | 316 (100) | 190 (100) | 126 (100) | N/A |
| Clopidogrel | 263 (83.2) | 157 (82.6) | 106 (84.1) | 0.728 |
| Ticagrelor | 46 (31.5) | 29 (32.6) | 17 (29.8) | 0.726 |
| Prasugrel | 5 (2.4) | 4 (3.4) | 1 (1.1) | 0.284 |
| ARB or ACEi | 155 (91.2) | 92 (91.1) | 63 (91.3) | 0.961 |
| β-Blocker | 160 (94.1) | 98 (97.0) | 62 (89.9) | 0.051 |
| Statin | 166 (97.6) | 100 (99.0) | 66 (95.7) | 0.156 |
| Laboratory values | ||||
| WBC, ×109/L | 11.7 ± 3.8 | 11.7 ± 3.6 | 11.7 ± 3.9 | 0.888 |
| Hb, g/dL | 14.7 ± 1.8 | 14.8 ± 1.7 | 14.6 ± 1.9 | 0.350 |
| Plt, ×109/L | 252.9 ± 69.0 | 252.4 ± 68.5 | 253.6 ± 70.1 | 0.874 |
| NT-proBNP, pg/mL | 741.0 ± 3235.9 | 445.5 ± 2099.7 | 1223.1 ± 4512.5 | 0.245 |
| CRP, mg/dL | 0.52 ± 1.74 | 0.44 ± 0.92 | 0.65 ± 2.59 | 0.503 |
| Glucose, mg/dL | 163.0 ± 58.5 | 156.8 ± 52.8 | 172.4 ± 65.4 | 0.028 |
| HbA1c, % | 6.5 ± 1.4 | 6.4 ± 1.2 | 6.6 ± 1.6 | 0.374 |
| BUN, mg/dL | 15.6 ± 6.4 | 16.0 ± 6.3 | 15.5 ± 6.6 | 0.935 |
| Creatinine, mg/dL | 1.01 ± 0.28 | 1.02 ± 0.25 | 1.00 ± 0.32 | 0.515 |
| AST, IU/L | 59.3 ± 87.3 | 49.0 ± 64.2 | 77.6 ± 115.8 | 0.031 |
| ALT, IU/L | 37.3 ± 29.5 | 33.9 ± 20.1 | 43.4 ± 40.5 | 0.037 |
| Total cholesterol, mg/dL | 186.3 ± 40.9 | 185.1 ± 37.7 | 188.0 ± 45.5 | 0.541 |
| TG, mg/dL | 130.6 ± 98.9 | 130.7 ± 94.1 | 130.4 ± 106.1 | 0.978 |
| HDL, mg/dL | 43.4 ± 10.0 | 43.1 ± 9.9 | 43.7 ± 10.1 | 0.657 |
| LDL, mg/dL | 117.2 ± 37.3 | 116.4 ± 34.8 | 118.2 ± 40.9 | 0.677 |
| Peak CK, IU/L | 2636.1 ± 2489.3 | 1958.2 ± 2052.4 | 3842.9 ± 2741.5 | 0.000 |
| Peak CK-MB, mg/mL | 259.3 ± 184.8 | 214.7 ± 171.9 | 327.2 ± 183.9 | 0.000 |
| Peak Trop-I, ng/mL | 63.2 ± 69.5 | 56.3 ± 61.3 | 74.0 ± 79.6 | 0.046 |
| Echocardiographic measure | ||||
| End-diastolic dimension, mm | 50.2 ± 4.9 | 50.0 ± 4.7 | 50.5 ± 5.2 | 0.322 |
| End-systolic dimension, mm | 36.4 ± 5.4 | 36.1 ± 5.2 | 37.0 ± 5.8 | 0.157 |
| Left atrial dimension, mm | 38.1 ± 3.7 | 38.2 ± 3.6 | 38.1 ± 3.9 | 0.849 |
| Left ventricle mass index, g/m2 | 105.3 ± 21.6 | 102.8 ± 17.2 | 109.2 ± 26.9 | 0.115 |
| E/E′ ratio | 10.9 ± 3.3 | 10.2 ± 2.9 | 11.8 ± 3.6 | 0.001 |
| Ejection fraction, % | 47.3 ± 7.6 | 48.4 ± 7.8 | 45.6 ± 6.9 | 0.001 |
| Wall motion score index | 1.55 ± 0.29 | 1.50 ± 0.29 | 1.64 ± 0.27 | 0.000 |
| Values are mean ± SD or n (%). |
| Total | IMR ≤ 29 U | IMR > 29 U | p | |
|---|---|---|---|---|
| (n = 190) | (n = 126) | |||
| Pa hyperemia, mmHg | 88.8 ± 15.5 | 88.3 ± 14.3 | 89.7 ± 17.2 | 0.451 |
| Pd hyperemia, mmHg | 82.0 ± 15.5 | 80.7 ± 14.2 | 84.1 ± 17.0 | 0.056 |
| Tmn rest, sec | 0.60 ± 0.36 | 0.45 ± 0.26 | 0.84 ± 0.37 | 0.000 |
| Tmn hyperemia, sec | 0.36 ± 0.25 | 0.22 ± 0.07 | 0.59 ± 0.26 | 0.000 |
| FFR | 0.92 ± 0.07 | 0.91 ± 0.07 | 0.93 ± 0.07 | 0.063 |
| CFR | 1.94 ± 1.29 | 2.18 ± 1.47 | 1.56 ± 0.80 | 0.000 |
| IMR | 27.7 ± 17.6 | 16.7 ± 5.1 | 44.4 ± 16.6 | 0.000 |
| IMRc | 29.4 ± 20.0 | 17.1 ± 5.2 | 48.1 ± 19.5 | 0.000 |
| Total | IMR ≤ 29 U | IMR > 29 U | p | |
|---|---|---|---|---|
| (n = 190) | (n = 126) | |||
| Baseline characteristics | ||||
| culprit artery, n (%) | 0.338 | |||
| LAD | 248 (78.2) | 151 (79.1) | 97 (77.0) | |
| LCX | 20 (6.3) | 9 (4.7) | 11 (8.7) | |
| RCA | 49 (15.5) | 31 (16.2) | 18 (14.3) | |
| number of vessel, n (%) | 0.111 | |||
| 1 | 202 (64.1) | 130 (68.4) | 72 (57.6) | |
| 2 | 86 (27.3) | 44 (23.2) | 42 (33.6) | |
| 3 | 27 (8.6) | 16 (8.4) | 11 (8.8) | |
| ≥2 | 113 (35.9) | 62 (32.6) | 54 (40.8) | 0.139 |
| TIMI grade before PCI, n (%) | 0.000 | |||
| 0/1 | 201 (67.9) | 102 (58.6) | 99 (81.1) | 0.000 |
| 2 | 65 (22.0) | 46 (26.4) | 19 (15.6) | 0.026 |
| 3 | 30 (10.1) | 26 (14.9) | 4 (3.3) | 0.001 |
| Post-procedural characteristics | ||||
| Stent diameter, mm | 3.20 ± 0.36 | 3.19 ± 0.36 | 3.21 ± 0.38 | 0.502 |
| Stent length, mm | 25.9 ± 9.5 | 25.7 ± 9.7 | 26.2 ± 9.1 | 0.622 |
| TIMI grade after PCI, n (%) | 0.000 | |||
| 0/1 | 0 | 0 | 0 | N/A |
| 2 | 37 (13.3) | 6 (3.8) | 31 (26.1) | 0.000 |
| 3 | 242 (86.7) | 154 (96.3) | 88 (73.9) | 0.000 |
| TMP grade after PCI, n (%) | 0.000 | |||
| 0/1 | 32 (11.2) | 2 (1.2) | 30 (25.0) | |
| 2 | 119 (41.8) | 68 (41.2) | 51 (42.5) | 0.828 |
| 3 | 134 (47.0) | 95 (57.6) | 39 (32.5) | 0.000 |
| IMR | p-Value | |||
| Total (n = 316) | IMR ≤ 29 (n = 190) | IMR > 29 (n = 126) | ||
| Primary endpoint | ||||
| Death or hospitalization for HF | 17 (5.4) | 4 (2.1) | 13 (10.3) | 0.001 |
| Secondary endpoint | ||||
| All-death | 13 (4.1) | 4 (2.1) | 9 (7.1) | 0.028 |
| Cardiovascular death | 5 (1.6) | 0 (0) | 5 (4.0) | 0.006 |
| Hospitalization for HF | 6 (1.9) | 0 (0) | 6 (4.8) | 0.002 |
| Re-PCI | 24 (7.6) | 14 (7.4) | 10 (7.9) | 0.862 |
| TLR | 8 (2.5) | 4 (2.5) | 4 (4.3) | 0.425 |
| ST | 2 (0.6) | 1 (1.1) | 1 (1.8) | 0.749 |
| Non-fatal MI | 6 (1.9) | 2 (1.1) | 4 (3.2) | 0.178 |
| Stroke | 8 (2.5) | 5 (3.1) | 3 (3.2) | 0.958 |
| IMR & CFR | p-Value | |||
| Total (n = 314) | IMR ≤ 29 or CFR ≥ 2 (n = 213) | IMR > 29 and CFR < 2 (n = 101) | ||
| Primary endpoint | ||||
| Death or hospitalization for HF | 17 (5.4) | 4 (1.9) | 13 (12.9) | <0.001 |
| Secondary endpoint | ||||
| All-death | 13 (4.1) | 4 (1.9) | 9 (8.9) | 0.006 |
| Cardiovascular death | 5 (1.6) | 0 (0) | 5 (5.0) | 0.003 |
| Hospitalization for HF | 6 (1.9) | 0 (0) | 6 (5.9) | 0.001 |
| Re-PCI | 24 (7.6) | 16 (7.6) | 8 (7.9) | 1.000 |
| TLR | 8 (2.5) | 5 (2.8) | 3 (3.9) | 0.699 |
| ST | 2 (0.6) | 1 (1.0) | 1 (2.1) | 0.542 |
| Non-fatal MI | 6 (1.9) | 2 (0.9) | 4 (4.0) | 0.089 |
| Stroke | 8 (2.5) | 5 (2.8) | 3 (3.9) | 0.699 |
| Univariate Analysis | p-Value | Multivariable Analysis (Model A) | p-Value | Multivariable Analysis (Model B) | p-Value | |
|---|---|---|---|---|---|---|
| OR (95% CI) | OR (95% CI) | OR (95% CI) | ||||
| Age | 1.071 (1.024 to 1.120) | 0.003 | 1.048 (1.000 to 1.098) | 0.049 | 1.050 (1.002 to 1.100) | 0.040 |
| Female | 1.610 (0.441 to 5.884) | 0.471 | ||||
| Hypertension | 3.840 (1.319 to 11.184) | 0.014 | 3.056 (0.983 to 9.504) | 0.054 | 3.284 (1.045 to 10.323) | 0.042 |
| Diabetes | 2.655 (0.989 to 7.128) | 0.053 | ||||
| Smoking | 0.445 (0.163 to 1.121) | 0.113 | ||||
| Post-PCI TMP grade <3 | 1.287 (0.476 to 3.481) | 0.620 | ||||
| IMR > 29 | 5.378 (1.712 to 16.896) | 0.004 | 3.962 (1.217 to 12.904) | 0.022 | ||
| CFR < 2 | 3.923 (0.880 to 17.489) | 0.073 | ||||
| IMR > 29 & CFR < 2 | 7.719 (2.449 to 24.328) | 0.000 | 6.003 (1.831 to 19.678) | 0.003 | ||
| Symptom-to-balloon time | 1.002 (1.001 to 1.003) | 0.006 | 1.002 (1.000 to 1.003) | 0.049 | 1.002 (1.000 to 1.003) | 0.057 |
| Culprit artery | ||||||
| LAD | 0.899 (0.284–2.850) | 0.856 | ||||
| LCX | 0.924 (0.116–7.347) | 0.941 | ||||
| RCA | 1.183 (0.327–4.281) | 0.798 | ||||
| LVEF < 40% | 1.258 (0.583–2.715) | 0.558 | ||||
| Peak CK-MB | 1.000 (0.997 to 1.003) | 0.932 |
Publisher’s Note: MDPI stays neutral with regard to jurisdictional claims in published maps and institutional affiliations. |
© 2021 by the authors. Licensee MDPI, Basel, Switzerland. This article is an open access article distributed under the terms and conditions of the Creative Commons Attribution (CC BY) license (https://creativecommons.org/licenses/by/4.0/).
Share and Cite
Yoon, G.-S.; Ahn, S.G.; Woo, S.-I.; Yoon, M.H.; Lee, M.-J.; Choi, S.H.; Seo, J.-Y.; Kwon, S.W.; Park, S.-D.; Seo, K.-W. The Index of Microcirculatory Resistance after Primary Percutaneous Coronary Intervention Predicts Long-Term Clinical Outcomes in Patients with ST-Segment Elevation Myocardial Infarction. J. Clin. Med. 2021, 10, 4752. https://doi.org/10.3390/jcm10204752
Yoon G-S, Ahn SG, Woo S-I, Yoon MH, Lee M-J, Choi SH, Seo J-Y, Kwon SW, Park S-D, Seo K-W. The Index of Microcirculatory Resistance after Primary Percutaneous Coronary Intervention Predicts Long-Term Clinical Outcomes in Patients with ST-Segment Elevation Myocardial Infarction. Journal of Clinical Medicine. 2021; 10(20):4752. https://doi.org/10.3390/jcm10204752
Chicago/Turabian StyleYoon, Gwang-Seok, Sung Gyun Ahn, Seong-Ill Woo, Myeong Ho Yoon, Man-Jong Lee, Seong Huan Choi, Ji-Yeon Seo, Sung Woo Kwon, Sang-Don Park, and Kyoung-Woo Seo. 2021. "The Index of Microcirculatory Resistance after Primary Percutaneous Coronary Intervention Predicts Long-Term Clinical Outcomes in Patients with ST-Segment Elevation Myocardial Infarction" Journal of Clinical Medicine 10, no. 20: 4752. https://doi.org/10.3390/jcm10204752
APA StyleYoon, G.-S., Ahn, S. G., Woo, S.-I., Yoon, M. H., Lee, M.-J., Choi, S. H., Seo, J.-Y., Kwon, S. W., Park, S.-D., & Seo, K.-W. (2021). The Index of Microcirculatory Resistance after Primary Percutaneous Coronary Intervention Predicts Long-Term Clinical Outcomes in Patients with ST-Segment Elevation Myocardial Infarction. Journal of Clinical Medicine, 10(20), 4752. https://doi.org/10.3390/jcm10204752