Article

Proteomic Analysis of Maternal Urine for the Early Detection of Preeclampsia and Fetal Growth Restriction

1
CHU de Québec—Université Laval Research Center, Université Laval, Quebec City, QC G1V 4G2, Canada
2
Department of Obstetrics and Gynecology, Faculty of Medicine, CHU de Québec—Université Laval, Quebec City, QC G1V 4G2, Canada
3
Department of Molecular Biology, Medical Biochemistry and Pathology, Faculty of Medicine, CHU de Québec—Université Laval, Quebec City, QC G1V 4G2, Canada
4
Department of Obstetrics and Gynecology, Paule de Viguier Hospital, CHU de Toulouse—Université de Toulouse, 31059 Toulouse, France
*
Author to whom correspondence should be addressed.
J. Clin. Med. 2021, 10(20), 4679; https://doi.org/10.3390/jcm10204679
Submission received: 11 September 2021 / Revised: 5 October 2021 / Accepted: 6 October 2021 / Published: 13 October 2021
(This article belongs to the Special Issue Diagnostic or Therapeutic Strategies for Pregnancy Complications)

Abstract

:
Background: To explore the use of maternal urine proteome for the identification of preeclampsia biomarkers. Methods: Maternal urine samples from women with and without preeclampsia were used for protein discovery followed by a validation study. The targeted proteins of interest were then measured in urine samples collected at 20–24 and 30–34 weeks among nine women who developed preeclampsia, one woman with fetal growth restriction, and 20 women with uncomplicated pregnancies from a longitudinal study. Protein identification and quantification was obtained using liquid chromatography–tandem mass spectrometry (LC–MS/MS). Results: Among the 1108 urine proteins quantified in the discovery study, 21 were upregulated in preeclampsia and selected for validation. Nineteen (90%) proteins were confirmed as upregulated in preeclampsia cases. Among them, two proteins, ceruloplasmin and serpin A7, were upregulated at 20–24 weeks and 30–34 weeks of gestation (p < 0.05) in cases of preeclampsia, and could have served to identify 60% of women who subsequently developed preeclampsia and/or fetal growth restriction at 20–24 weeks of gestation, and 78% at 30–34 weeks, for a false-positive rate of 10%. Conclusions: Proteomic profiling of maternal urine can differentiate women with and without preeclampsia. Several proteins including ceruloplasmin and serpin A7 are upregulated in maternal urine before the diagnosis of preeclampsia and potentially fetal growth restriction.

1. Introduction

Preeclampsia (PE) affects about 2% to 5% of pregnant women in developed countries and up to 10% of pregnant women in developing countries [1,2,3]. PE is associated with short-term and long-term adverse outcomes in mothers and infants [4,5,6,7,8]. About 10% to 15% of maternal deaths and 25% of neonatal deaths are attributable to PE and its complications [8,9]. In the most severe cases, PE occurs before term and is typically associated with deep placentation disorders that can also lead to fetal growth restriction [10,11,12].
There is a growing body of evidence that the preterm PE, severe PE, and fetal growth restriction can be predicted in early pregnancy using a combination of biophysical, biochemical and ultrasound markers [13,14,15]. However, such screening tools require equipment and expertise that are not readily available throughout the world. There is evidence that urine biomarkers could also be used for the early diagnosis of PE [16,17].
Mass-spectrometry-based proteomics analysis has gained popularity in the past decades for its ability to cover a large proportion of cellular or biological fluid proteomes [18]. Indeed, bottom-up proteomics have allowed for the identification and quantification of hundreds of proteins. This strategy relies on the identification and quantification of peptides resulting from the trypsin digestion of protein extracts by liquid chromatography coupled with tandem mass spectrometry (LC–MS/MS). The acquired spectra are then searched against publicly available protein databases. Protein candidates can also be accurately quantified by targeted proteomics in which up to one hundred proteins can be specifically monitored by LC–MS/MS in a single analysis [19]. The urinary proteome, which can be collected non-invasively and which contains more than 1800 protein species, is an ideal source of biomarkers for both renal/urological tract and systemic diseases [20,21].
For preeclampsia, a recent review of proteomic studies reported that at least 132 urine proteins could be used for early diagnosis [22]. More importantly, Buhimschi et al. observed that a specific urine proteomic profile combining serpin A1 and albumin could have: (1) a high accuracy in the identification of women with severe PE that required immediate delivery; and (2) could identify women at high risk to develop severe PE up to 10 to 25 weeks before its diagnosis [16]. However, these observations were limited to a small number of participants; the experiments were performed using equipment developed many years ago, and should therefore be validated in larger studies.
In the current study, we aim to assess the urine proteomic profiles in PE and to identify biomarkers that could help in the early prediction of PE.

2. Materials and Methods

We performed a secondary analysis of the PEARL case-cohort study (PreEclampsia And growth Restriction: a Longitudinal study) that included both nulliparous women with PE (cases) and a cohort of nulliparous women at low risk of PE, recruited in early pregnancy and followed until delivery (controls) [23,24]. PE was defined according to the Society of Obstetricians and Gynecologists of Canada guidelines as de novo hypertension after 20 weeks of pregnancy (i.e., Systolic BP ≥ 140 mmHg and/or diastolic BP ≥ 90 mmHg) with proteinuria (≥300 mg per 24 h or ≥2 + protein on urine dipstick) or an adverse condition (thrombocytopenia, renal failure, liver injury, headache, seizures, vision problem or pulmonary edema) [25]. Fetal growth restriction was defined as a birth weight below the 10th percentile for gestational age based on a Canadian reference chart [26]. Urine samples were collected on the day of the diagnosis of PE for all cases and at several points during pregnancy for all controls. Urine samples were aliquoted and stored at −80 °C until analysis. All participants signed an informed consent form, and the study was approved by the ethics committee of the CHU de Québec—Université Laval (B14–07-2037).
For the purpose of the current study, we divided our population as follows: for the discovery study, 12 participants with PE (including 6 with fetal growth restriction) were matched to 12 controls without PE based on gestational age at urine collection, maternal age and maternal body mass index. For the validation study, another subset of 12 participants with PE (including 2 with fetal growth restriction) were matched to 12 controls also based on gestational age, maternal age and maternal body mass index. We used all samples available (n = 24) and divided by two for the discovery and validation study. For the longitudinal study, we used an independent cohort of women who were seen at each trimester of pregnancy: we selected 9 women who developed PE; 1 woman who developed fetal growth restriction without PE; and 20 women with uncomplicated pregnancies who provided urine samples at 20–24 and 30–34 weeks.

2.1. Mass Spectrometry Analyses

Each 500 µL sample of urine was concentrated on an Amicon Ultra-0.5 Centrifugal Filter device (Millipore, Burlington, MA, USA) by 10 min centrifugation 14,000× g, followed by a wash with 500 µL ammonium bicarbonate 50 mM and centrifugation in the same conditions. The protein concentration of the concentrated urine samples (volumes between 55 and 85 µL) was measured using Bradford assay. A total of 10 µg from each sample was then used for the subsequent steps. Briefly, the sample volume was adjusted to 50 µL with ammonium bicarbonate at 50 mM, and sodium deoxycholate was added to a final concentration of 1%. Protein denaturation was performed by heating at 95 °C for 5 min. The reduction and alkylation of cystein disulfide bridges was performed by the addition of 1,4 dithiothreitol (DTT) (final concentration 0.2 mM) and incubation at 37 °C for 30 min followed by the addition of iodoacetamide (final concentration 0.8 mM) and incubation at 37 °C for 30 min in the dark. An amount of 200 ng of tryspin enzyme was then added and samples were incubated at 37 °C overnight for proteolysis. Enzymatic digestion was stopped by acidification with 50% formic acid and the resulting peptides were purified on StageTip according to Rappsilber et al., using C18 Empore reverse phase (CDS) [27]. The samples were vacuum-dried and stored at −20 °C prior to mass spectrometry analysis. Each sample was resuspended at 0.2 µg/µL with 2% acetonitrile, 0.05% TFA. For validation and longitudinal studies only, iRT internal standard peptides (Biognosys, Schlieren, Switzerland) were added in each sample at 1X final concentration. An amount of 1µg from each sample was analyzed by liquid chromatography coupled with tandem mass spectrometry (LC–MS/MS) using a U3000 RSLCnano chromatographic system (Thermo Fisher Scientific, Waltham, MA, USA) and an Orbitrap Fusion mass spectrometer (Thermo Fisher Scientific). The chromatographic separation was performed on an Acclaim PepMap 100 C18 column (75 µm internal diameter, 3 µm particules and 500 mm length) using a 5–45% solvent B 90 min gradient (A: 5% acetonitrile, 0.1% formic acid; B: 80% acetonitrile, 0.1% formic acid).The mass spectrometer was operated in Data Dependent Acquisition mode for the discovery study, and Parallel Reaction Monitoring mode for the validation and longitudinal studies, using two peptide precursor masses for each protein selected from the discovery study.

2.2. Bioinformatics and Statistical Treatment

For the discovery study, MaxQuant software was used to obtain protein identification by searching a Uniprot human database (Human Reference Proteome UP000005640), and quantification was obtained by the Label-Free Quantification (LFQ) method [28]. LFQ intensity values of MaxQuant were used to calculate a protein fold change (FC) between the two groups of patients, and the values were then centered by the calculation of a z-score (z = (FC − FC average)/FC standard deviation). Statistical analyses were then performed using R software [29]. A Limma statistical test was applied to each protein between the two groups and the corresponding p-values were adjusted for multiple testing using the Benjamini–Hochberg method and thus obtained q-values [30]. A protein was considered as significantly regulated between the two groups if it met the following criteria: |z| > 1.96 and q < 0.05. For the validation and longitudinal studies, the data analysis was performed using the Skyline software [31]. The quantification value of each targeted peptide was obtained by integration of the corresponding chromatographic peak reconstructed from the best parent/fragment transition. Two normalizations of the quantification values were then applied. The first used the median of iRT internal standard peptides intensity to correct for LC–MS/MS variability, the second used the signal of peptides from the protein biotinidase (BTD) (Uniprot accession number P43251), which displayed no variation between the two groups in our discovery analysis, to correct for Bradford protein assay. For each sample, the intensities of the two peptides of each protein were summed to obtain a protein intensity value. A modified statistical Student’s test (Welch test) was performed between the two groups of patients. Statistical analyses were conducted using R software and IBM SPSS Statistics version 26.0. Interaction network analysis was performed using the STRING database [32].

3. Results

3.1. Discovery Study

The median gestational age of the 12 participants at diagnosis of PE (31.9; IQ: 28.5–34.3 weeks) was comparable to the median gestational age of the 12 participants used as controls (32.1; IQ: 29.0–35.3 weeks). Table 1 reports participant’s characteristics for the discovery, the validation and the longitudinal study.
Our proteomic analyses allowed us to quantify 1108 proteins from urine samples which were used in a Principal Component Analysis (PCA) to explore the variability of the urinary proteomic profiles of participants (Figure 1). The PCA showed two distinct groups for control and PE revealing distinct proteomic profiles.
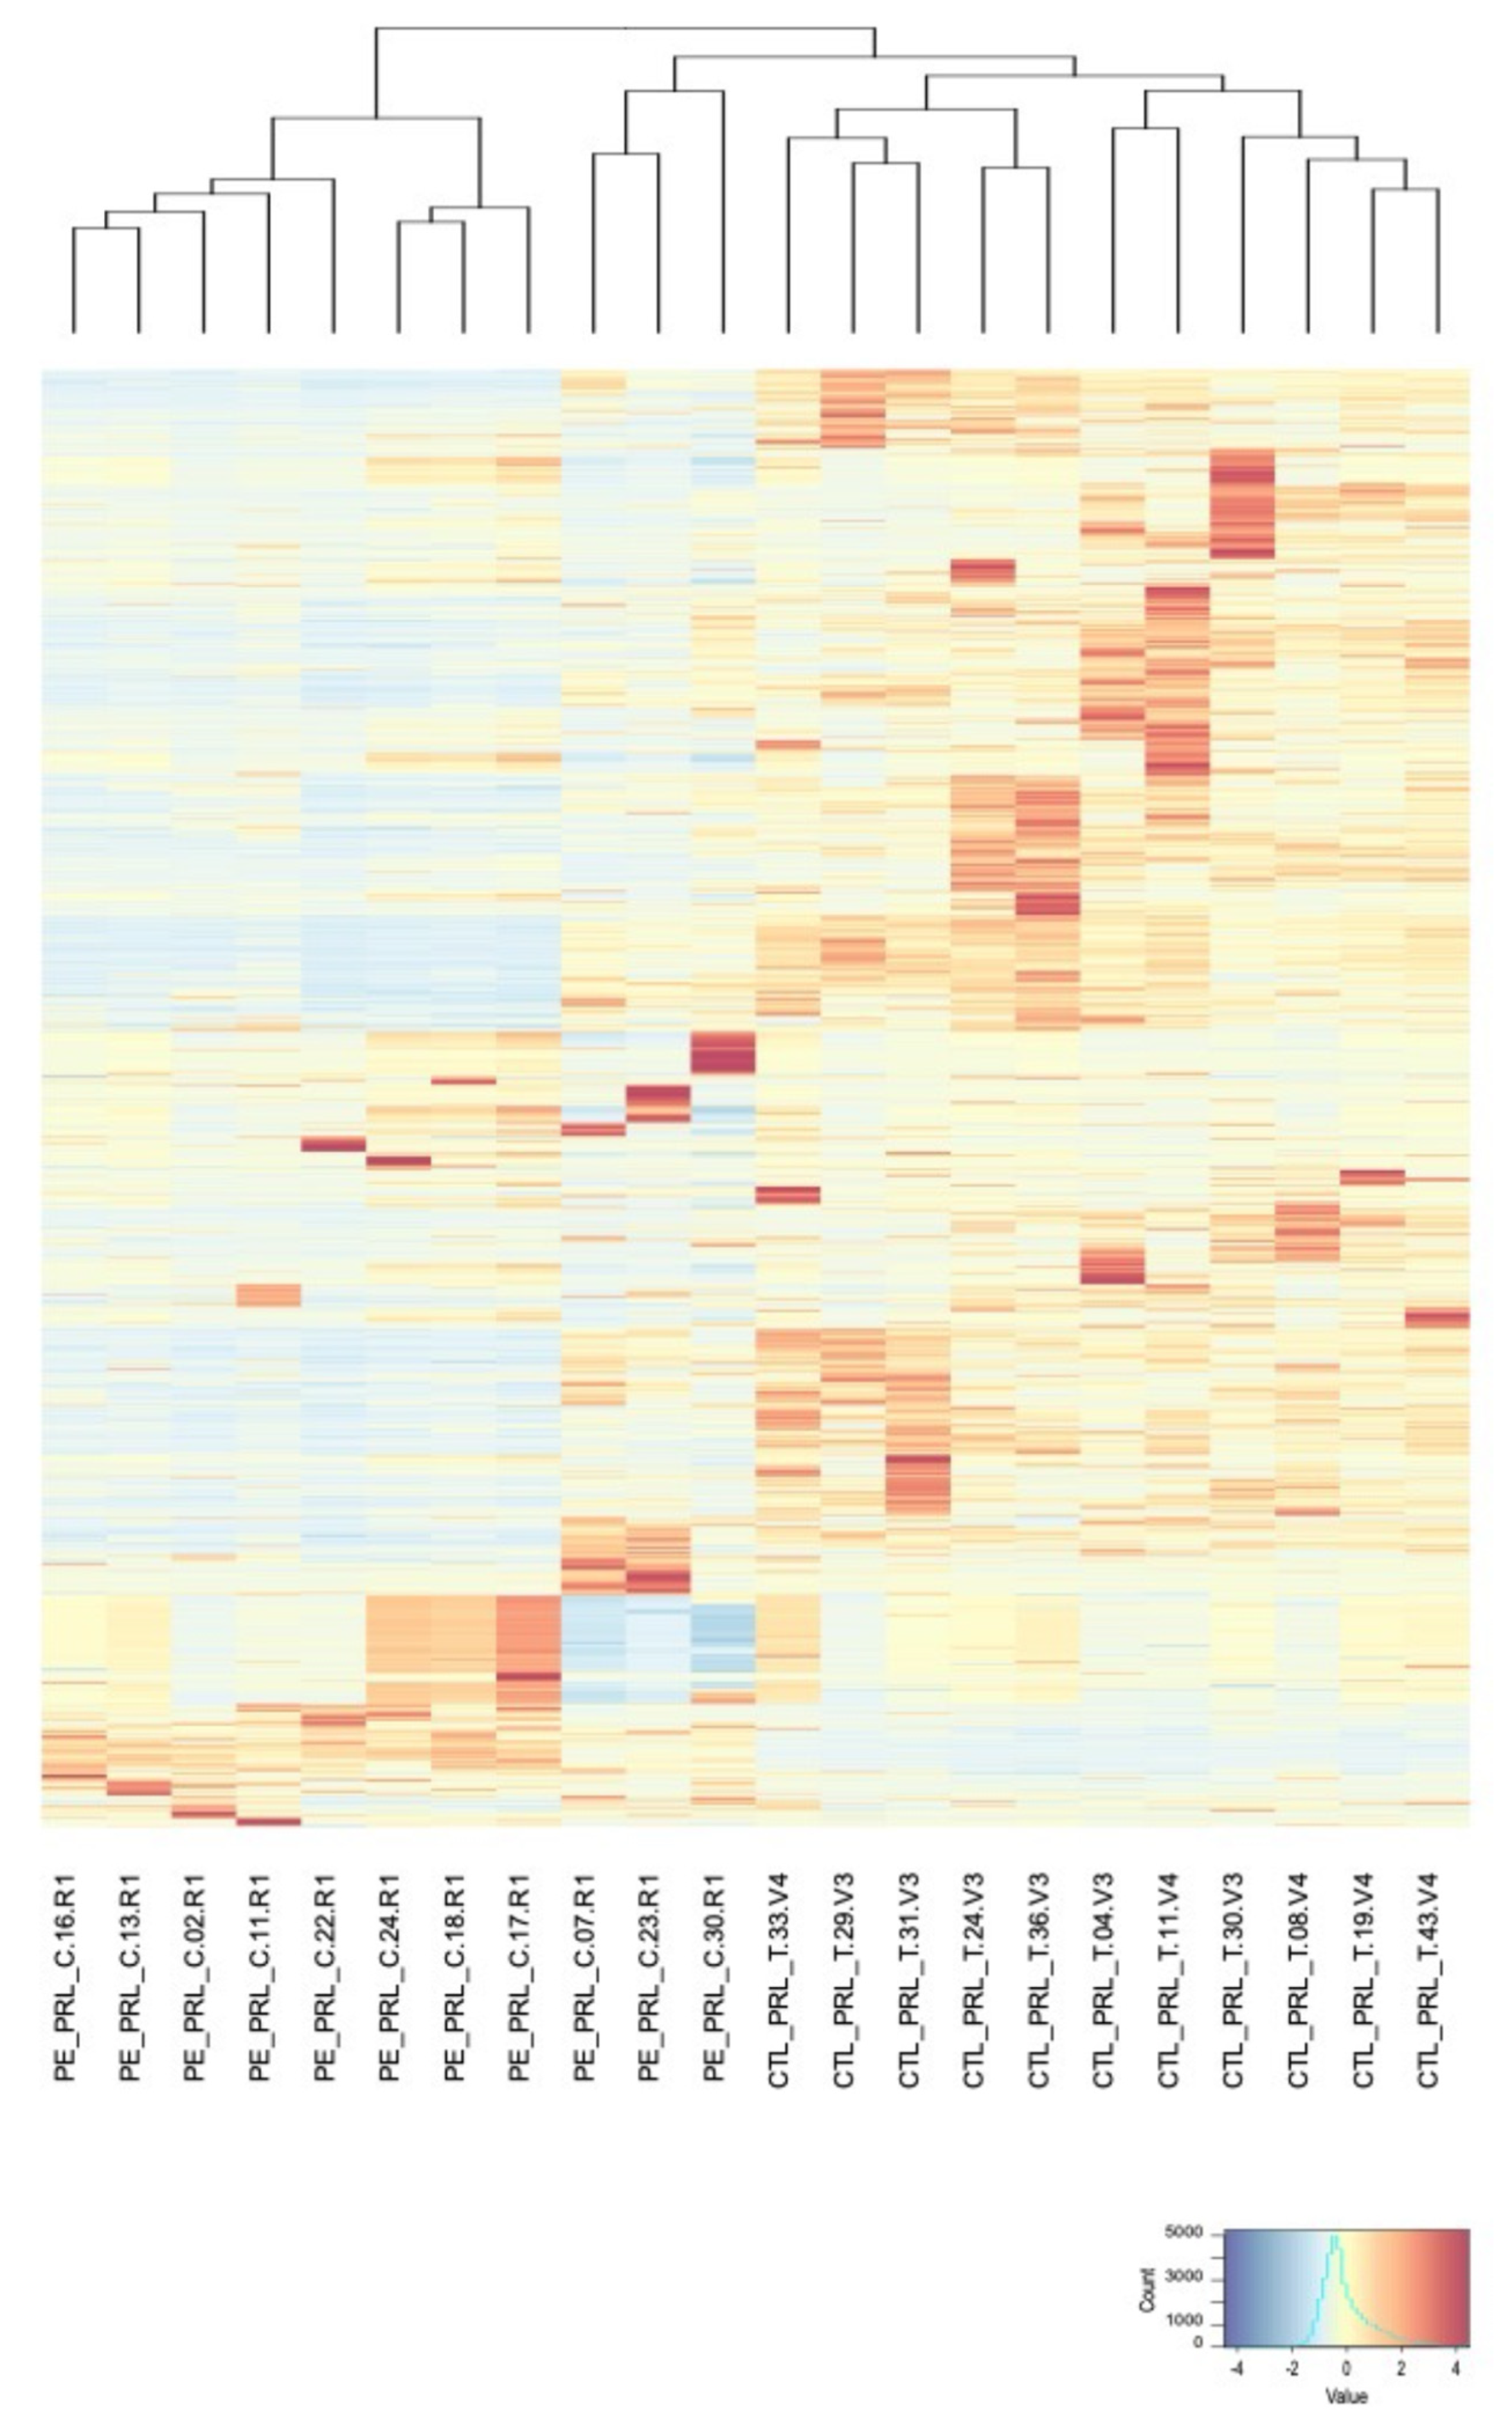
A heatmap of the intensity of the proteins quantified in this study was also generated and associated to a hierarchical clustering, which allowed us to group the most similar profiles among the urine proteomes (Figure 2).
Among all the quantified proteins, 62 (53 upregulated, 9 downregulated) were found statistically regulated between PE and control after filtering on z-score (obtained after centering of the protein fold change) and on the q-value associated to a Limma statistical test corrected for multiple testing (Figure 3). Twenty-one upregulated proteins were selected for further validation (A1BG; ALB; AFM; TTR; AZGP1; C3; CA1; CP; GC; HBA1; HBB; ITIH2; ORM1; ORM2; SERPINA1; SERPINA3; SERPINA6; SERPINA7; SERPINC1; SHBG; TF; see Table 2 for protein descriptions) based on their fold change, their total signal intensity and/or the sequence of their corresponding peptides (peptides carrying oxidized methionine and those containing missed trypsin cleavages were excluded). Using a STRING analysis, we found that most of them have known interactions, either direct protein interaction, gene co-expression, or are cited together in the literature (Supplementary Figure S1).

3.2. Validation Study

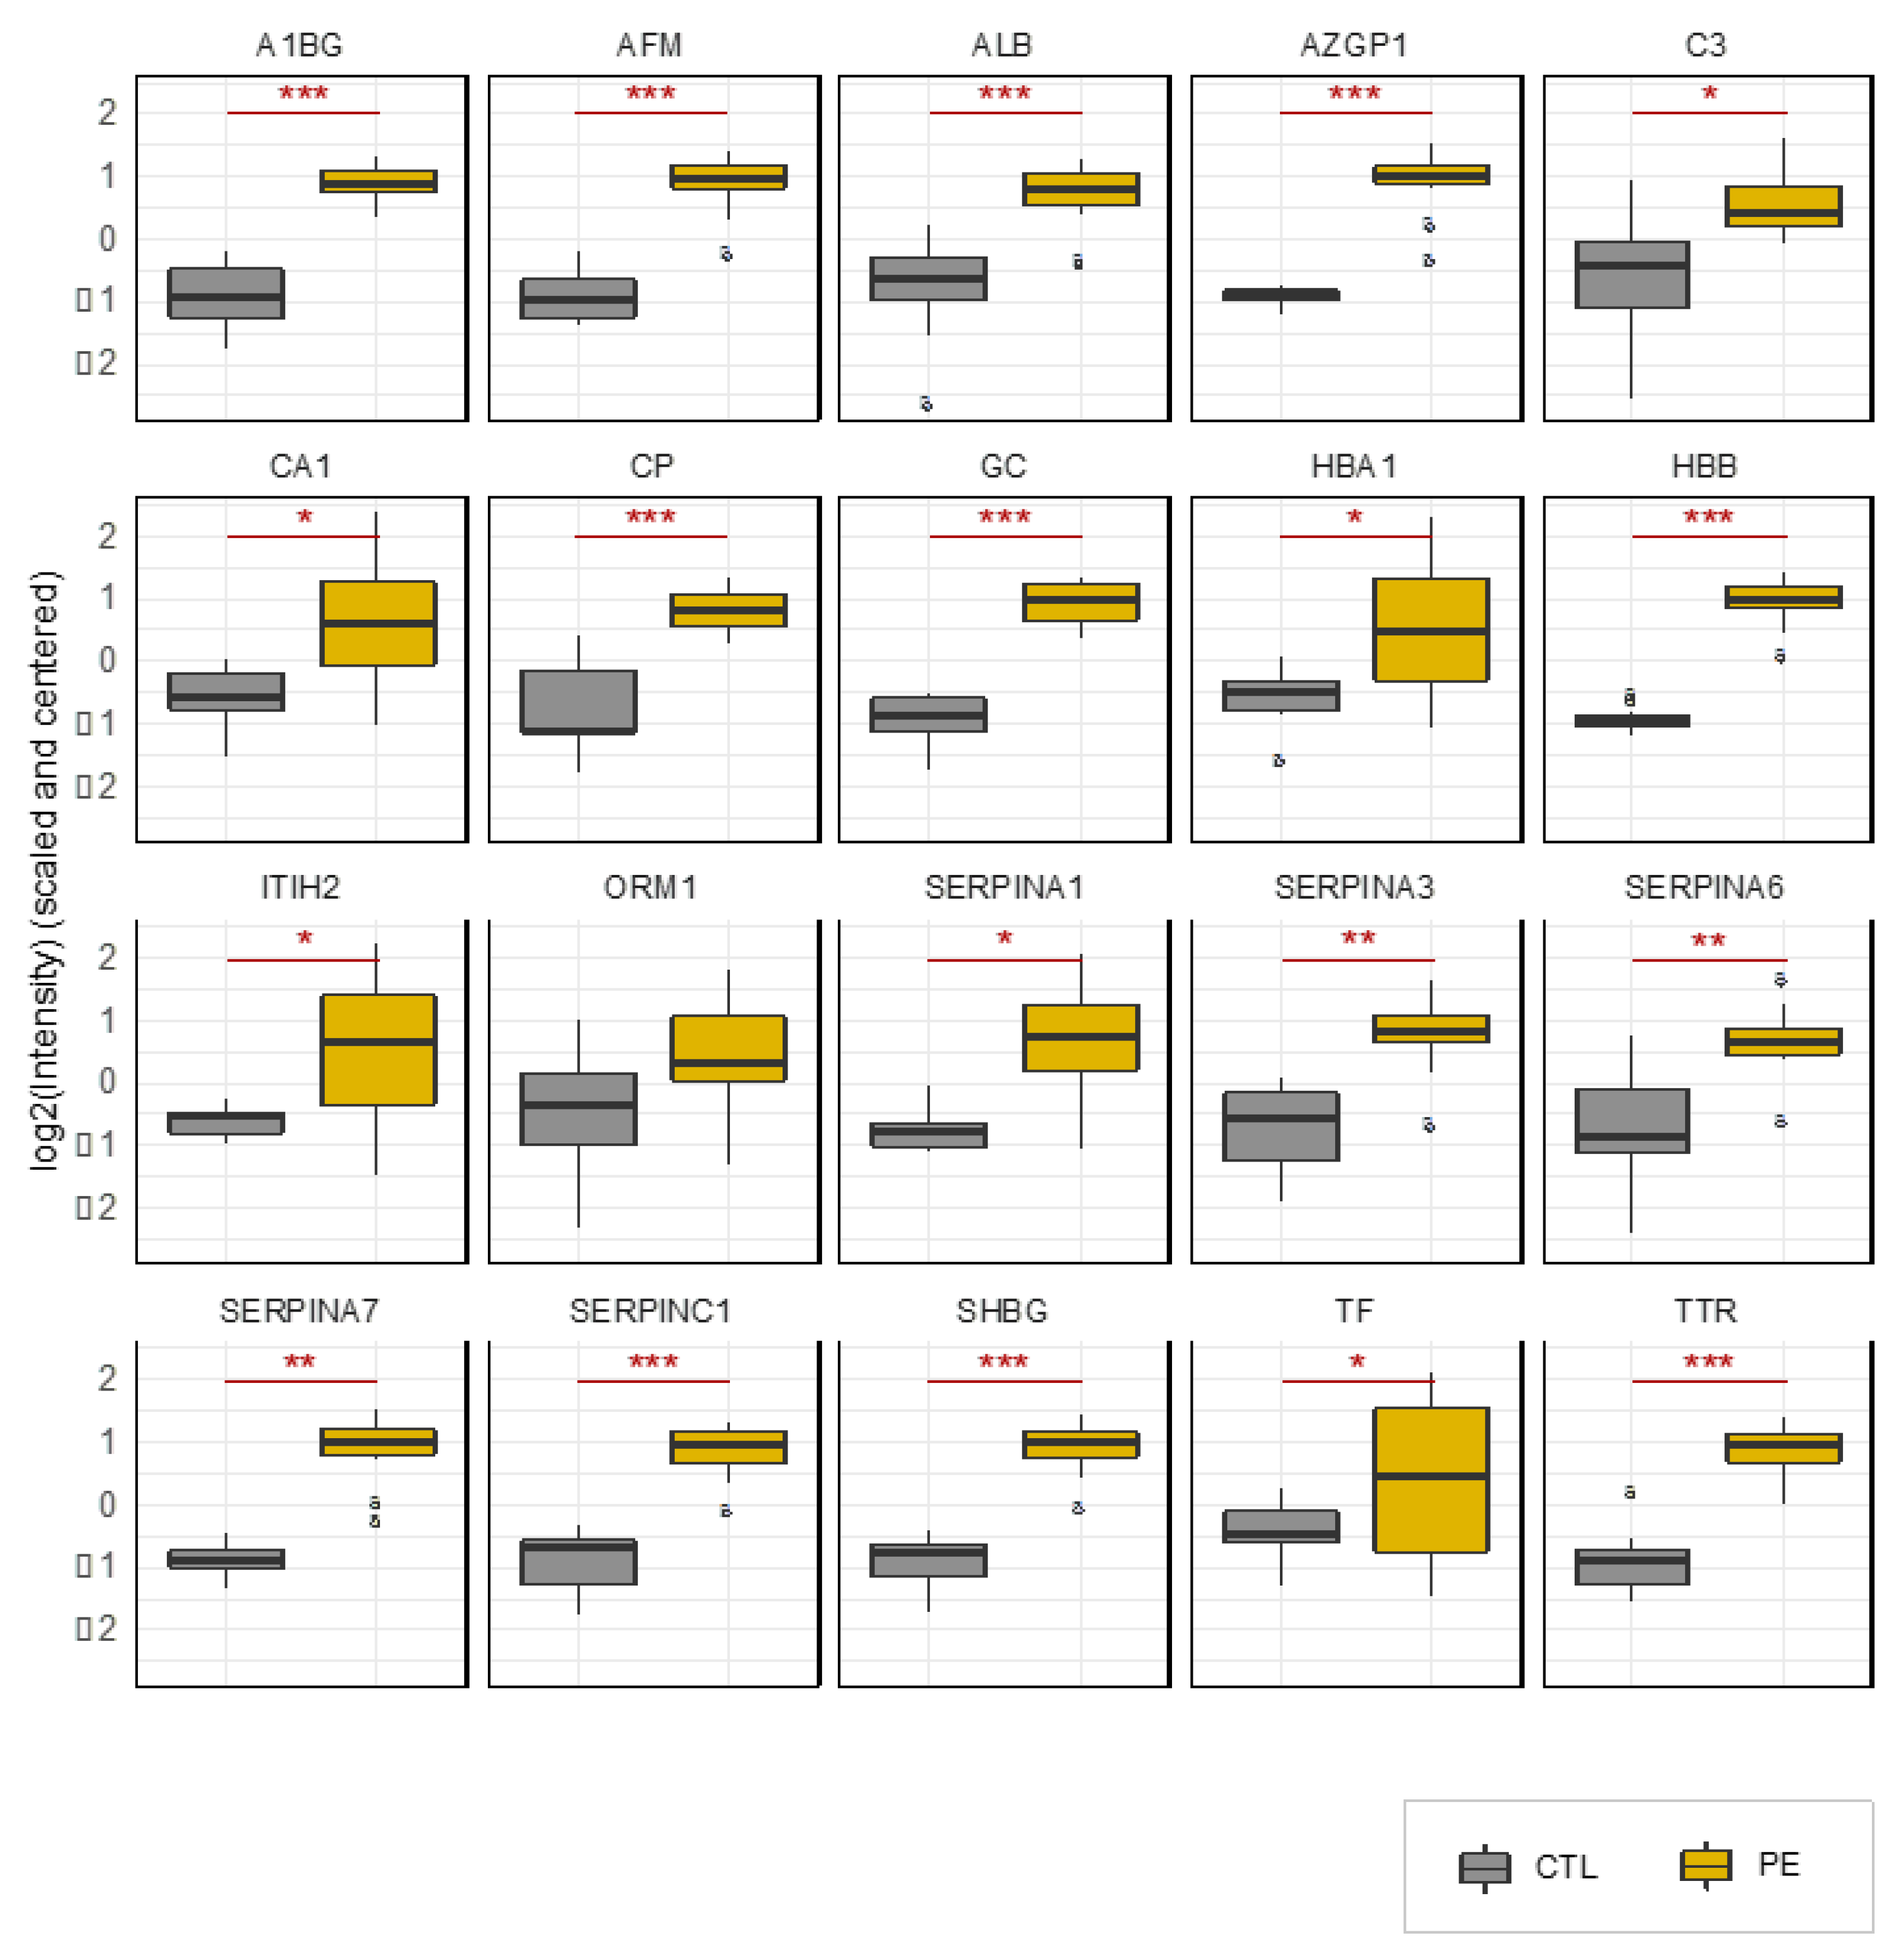
The median gestational age at urine collection of our PE cases and term uncomplicated delivery controls was 31.5 (IQ: 29.0–34.3) weeks and 32.5 weeks (IQ: 29.6–33.9) weeks, respectively (Table 1). The 21 proteins previously selected were monitored by targeted proteomics to obtain an accurate protein quantification. Table 2 and Figure 4 report the average and distribution of intensity values for each group, PE or control, of each of the selected 21 proteins monitored by targeted proteomics. We observed that 19 (90%) of the 21 proteins were significantly upregulated in the urine of PE patients when compared to controls with a p-value < 0.05. Among them, 13 have a p-value < 0.001.

3.3. Longitudinal Study

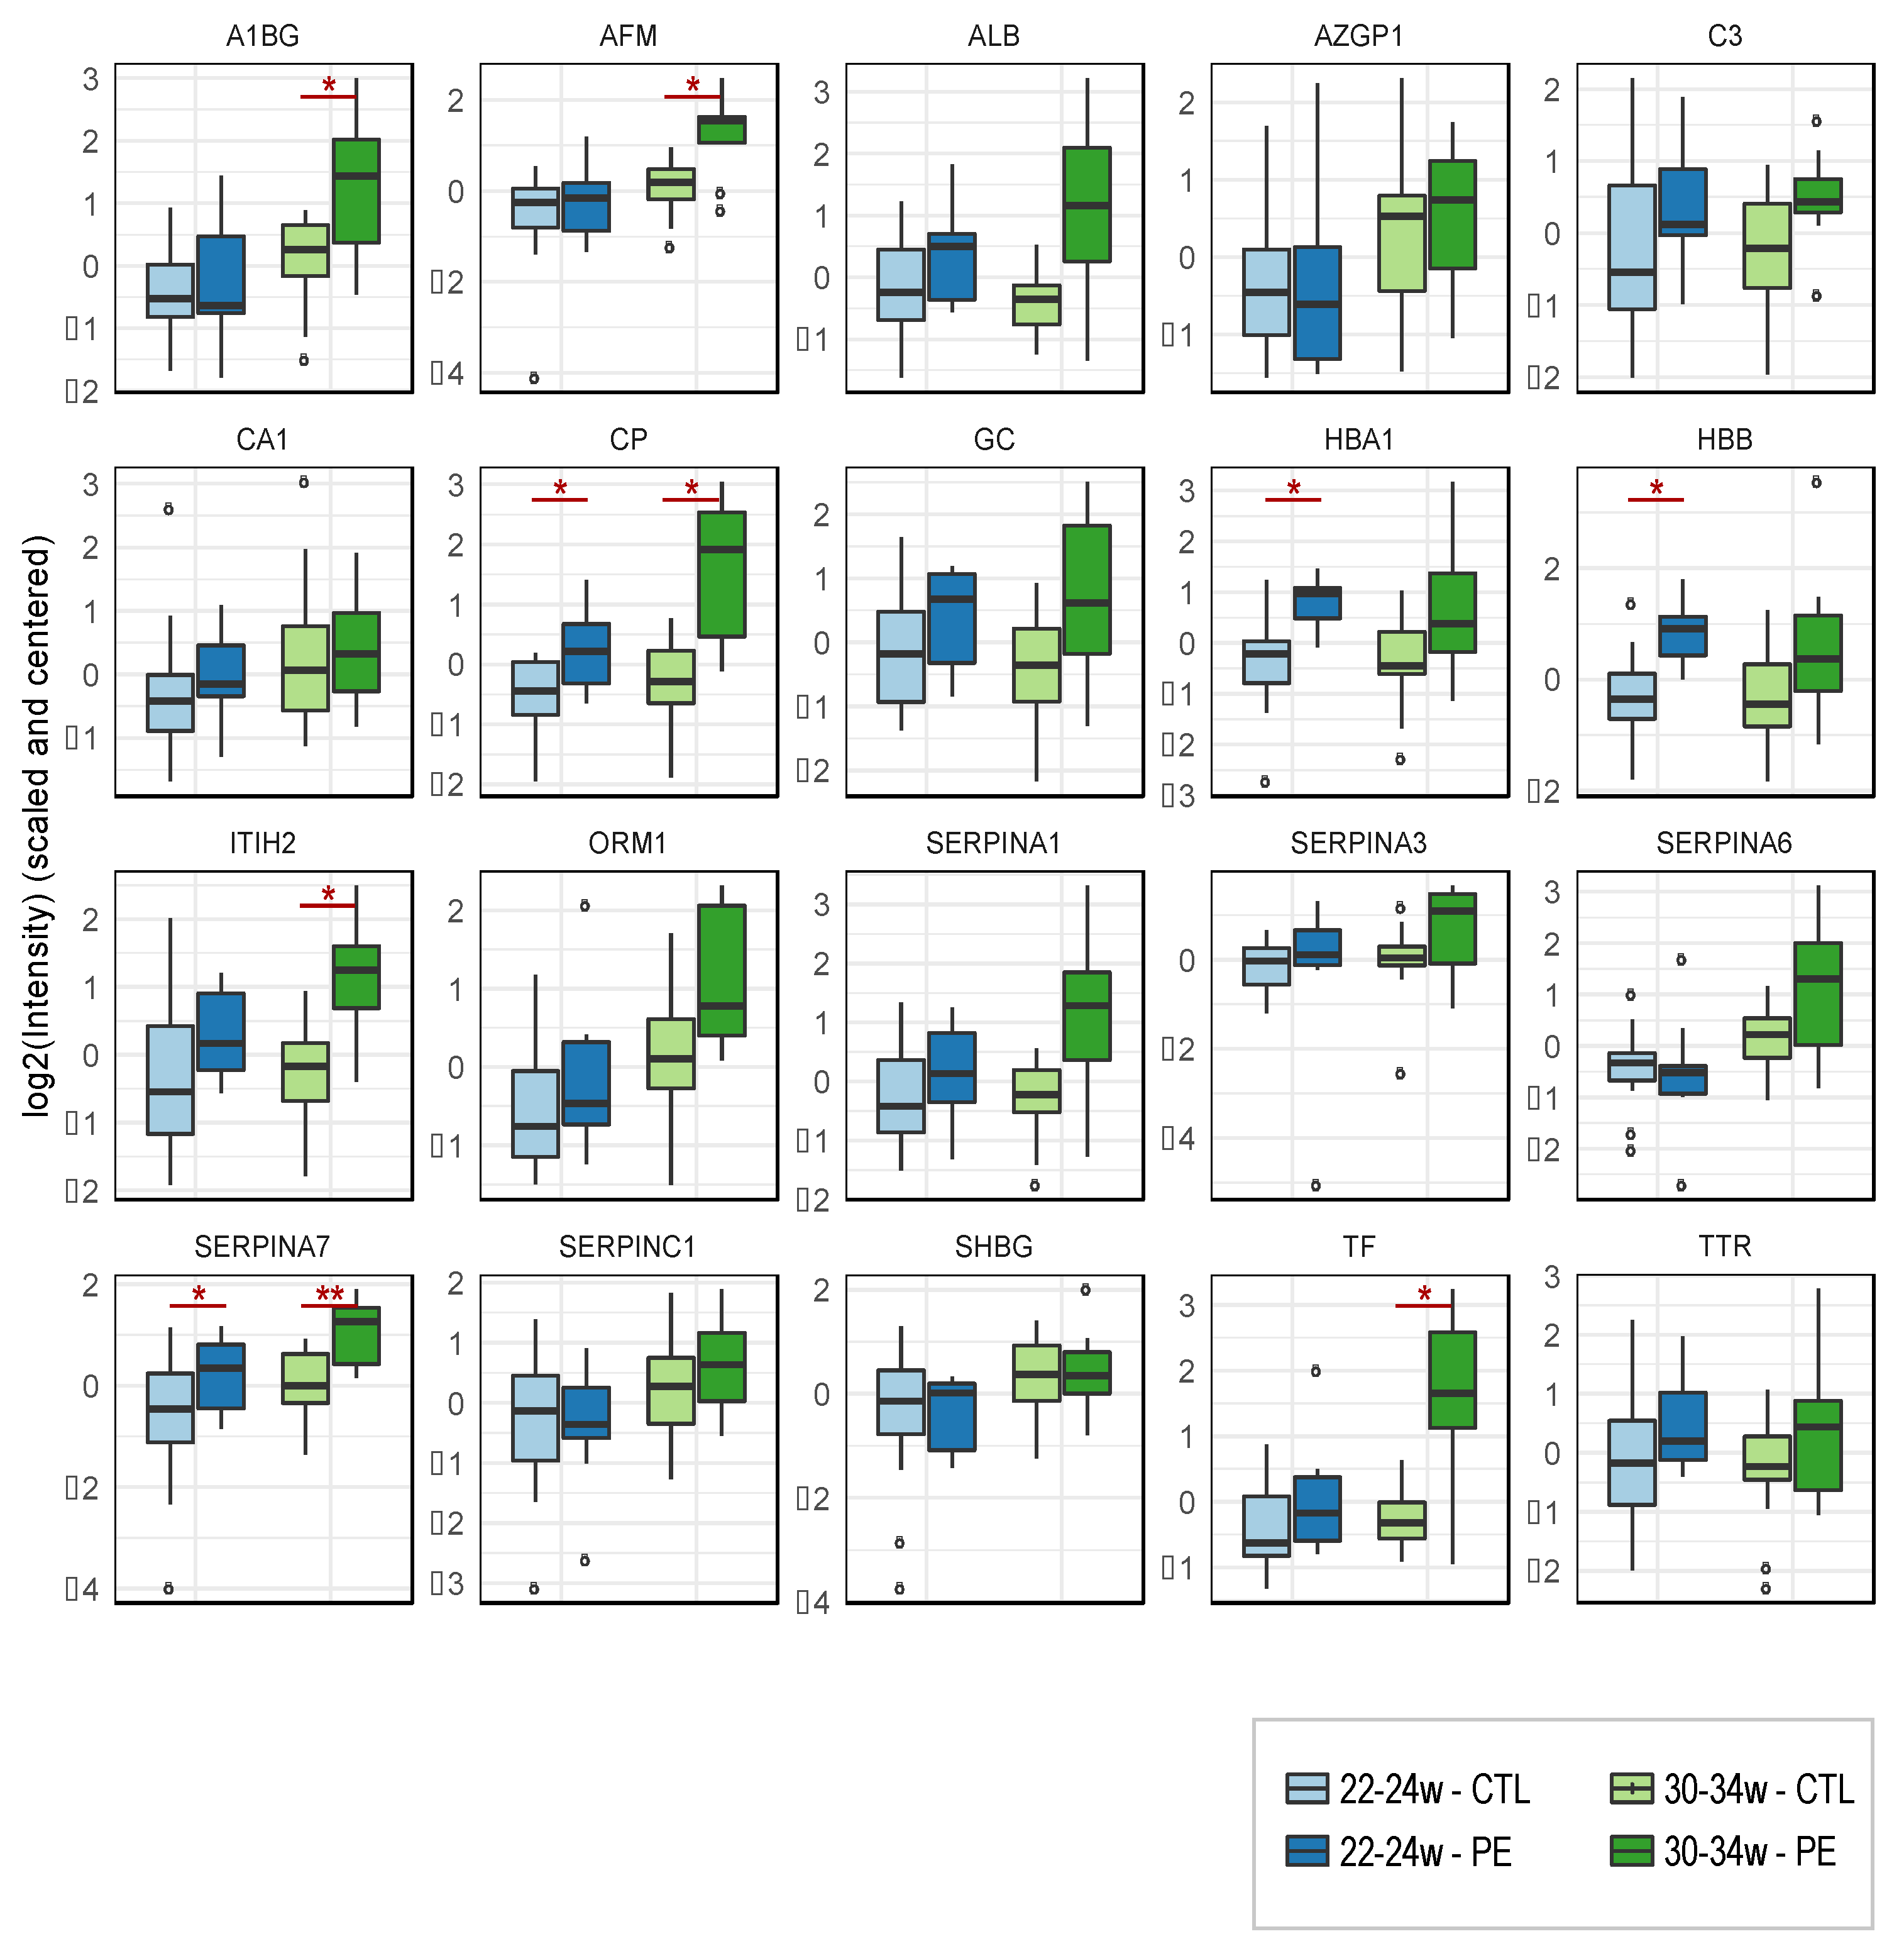
In the longitudinal study, we observed that 6 of the 21 proteins monitored by targeted proteomics were significantly upregulated at 30–34 weeks in women who subsequently developed PE in comparison to the control group (serpin A7; ceruloplasmin; afamin; inter-alpha-trypsin inhibitor heavy chain; transferrin; alpha-1B-glycoprotein). Two, serpin A7 and ceruloplasmin, were also found significantly upregulated at 20–24 weeks in women who subsequently developed PE in comparison to the control group (Table 3 and Figure 5).
Figure 6A,B reports the receiver operating characteristic (ROC) curves for the prediction of PE or fetal growth restriction using ceruloplasmin and serpin A7 protein concentrations in urine at 20–24 weeks and 30–34 weeks of gestation. At a false positive rate of 10%, ceruloplasmin could have predicted between 60% and 78% of the PE and/or fetal growth restriction cases at 20–24 weeks and 30–34 weeks of gestation, respectively. Interestingly, the case of fetal growth restriction without preeclampsia would have been detected with ceruloplasmin but not with serpin A7.

4. Discussion

We observed that women with preeclampsia have a different urine proteomic profile than women without preeclampsia and such differences can be present up to 12 weeks before the first signs and symptoms of preeclampsia. This observation, consistent with previous studies, suggests that women at high-risk of preeclampsia could be detected from urine biomarkers. Since fetal growth restriction shares a common mechanism of disease, it is possible that it could be detected in early pregnancy as well.
More specifically, the PCA performed on our dataset discriminates the two groups of patients (PE vs. controls). Moreover, the hierarchical clustering associated with the heatmap of protein intensities generates two main clusters containing either control or PE samples. To reveal the proteins dysregulated between PE and controls, we centered the control/PE ratios by calculating a z-score. Indeed, the proteinuria associated to PE strongly affects the protein content of the analyzed samples. Therefore, lower mass spectrometry signals obtained in PE cases, as can be observed on the heatmap of protein expressions, might result in a misinterpretation of the dysregulated proteins between the two groups. By applying a z-score correction and using a statistical test corrected for multiple testing (q-values), we could confidently identify 62 proteins with statistical differences in intensity between control and PE groups. Using targeted proteomics, known for their high accuracy in protein quantification, and another subset of patients from the same cohort, we confirmed our findings from the discovery study. The monitoring of these 21 proteins in our longitudinal study revealed that 6 of these proteins were significantly upregulated at 30–34 weeks of gestation and 2 of them (ceruloplasmin and serpin A7) were significantly upregulated at 20–24 weeks of gestation, up to 12 weeks before the clinical onset of PE. Ceruloplasmin is a copper-binding protein involved in iron transport across cellular membranes, and has antioxidant ferroxidase properties. It could be upregulated in PE as a response to placental ischemia [33,34]. As for serpin A7, also known as thyroxine-binding globulin (TBG), the major thyroid hormone transport protein in serum, studies have observed lower serum TBG in women with PE [35,36]. However, little is known about how and why serpin A7 is upregulated in the urine of PE cases.
Overall, our observations suggest that the urine proteomic profile could be used to predict preeclampsia several weeks before the first signs and symptoms manifest themselves. More specifically, we observed that at least two proteins, namely, ceruloplasmin and serpin A7, are increased in maternal urine at 20–24 and 30–34 weeks of gestation in most women who subsequently develop PE.
Our study is in agreement with the study of Buhimschi et al., who observed that serpin A1, another member of the serpin family, was significantly increased in PE cases [16]. Their study also reported misfolded proteins in the urine of women with preeclampsia bound to Congo Red dye (urine congophilia or affinity for the amyloidophilic dye Congo Red) [37]. Ultimately, their study reported promising results from a prototype point-of-care test for the detection of urine congophilia [38]. A review by Navajas et al. found nine publications from 2008 to 2020 that observed 132 proteins that were differently expressed in urine in PE cases compared to controls [22]. Nineteen of these showed high potential for PE prediction as they were consistently higher or lower in PE, including ceruloplasmin, serpin A1, serpin A5, C3, ALB, TF and HBB. Starodubtseva et al. reported that the estimation of serpin A1 peptides in urine was also related to the severity of PE [39]. Placental growth factor (PlGF), a proangiogenic protein commonly used for the prediction of PE and other placental-mediated outcomes of pregnancy is also predictive of PE and PE-related adverse outcomes when measured in urine [17,23,40]. Altogether, these studies, including ours, provide hope that rapid identification of PE and potentially early prediction of PE is possible using urine studies.
The small number of cases available at each step is a limit of our study. However, we used standardized methods for proteomic analysis and, using high-resolution LC–MS/MS, we obtained the largest urinary proteome coverage ever published on preeclampsia samples (1108 proteins quantified). One of the major strengths of the current study is the validation of our findings in an independent subset of patients and subsequent confirmation in a prospective study, which includes the collection of urine samples up to three months before the first signs and symptoms of PE.

5. Conclusions

PE is a major cause of perinatal morbidity and mortality around the world, primarily in developing countries. PE is commonly associated with fetal growth restriction, as they share a common mechanism of disease. Our study and current literature strongly suggest that PE, and potentially fetal growth restriction, are syndromes that are highly detectable in their early phases using the proteomic analysis of maternal urine. More efforts should be devoted to the development of rapid point-of-care tests on maternal urine that could help in the prevention of PE-related adverse outcomes of pregnancy.

Supplementary Materials

The following are available online at https://www.mdpi.com/article/10.3390/jcm10204679/s1, Figure S1: STRING interaction network of the 21 proteins selected for validation study.

Author Contributions

Conceptualization, E.B., A.D., F.R.-D.; methodology, E.B., P.G., F.R.-D., C.G.; software, F.R.-D., M.P.S.-B., C.G.; validation, E.B., F.R.-D., M.P.S.-B., C.G.; formal analysis, E.B., F.R.-D., C.G., G.L.; investigation, E.B., A.F., P.G.; resources, E.B.; data curation, F.R.-D.; writing—original draft preparation, E.B., F.R.-D.; writing—review and editing, E.B., A.F., G.L., P.G., Y.G., J.-C.F.; visualization, A.F.; supervision, A.D., E.B.; project administration, E.B., Y.G.; funding acquisition, E.B. All authors have read and agreed to the published version of the manuscript.

Funding

This research was funded by Jeanne et Jean-Louis Lévesque, Perinatal Research Chair—Université Laval.

Institutional Review Board Statement

The study was conducted according to the guidelines of the Declaration of Helsinki, and approved by the Institutional Review Board (or Ethics Committee) of Centre de recherché du CHU de Québec (protocol code B14-07-2037 on 7 August 2014).

Informed Consent Statement

Informed consent was obtained from all subjects involved in the study.

Data Availability Statement

The data presented in this study are available on request from the corresponding author.

Acknowledgments

We acknowledge the work of M. Michael Spanier, for the editing and review of the document.

Conflicts of Interest

The authors declare no conflict of interest. The funders had no role in the design of the study; in the collection, analyses, or interpretation of data; in the writing of the manuscript, or in the decision to publish the results.

References

  1. Mol, B.W.J.; Roberts, C.T.; Thangaratinam, S.; Magee, L.A.; de Groot, C.J.M.; Hofmeyr, G.J. Pre-eclampsia. Lancet 2016, 387, 999–1011. [Google Scholar] [CrossRef]
  2. Rana, S.; Lemoine, E.; Granger, J.P.; Karumanchi, S.A. Preeclampsia: Pathophysiology, Challenges, and Perspectives. Circ. Res. 2019, 124, 1094–1112. [Google Scholar] [CrossRef] [PubMed]
  3. Nakimuli, A.; Chazara, O.; Byamugisha, J.; Elliott, A.M.; Kaleebu, P.; Mirembe, F.; Moffett, A. Pregnancy, parturition and preeclampsia in women of African ancestry. Am. J. Obstet. Gynecol. 2014, 210, 510–520. [Google Scholar] [CrossRef] [PubMed] [Green Version]
  4. Murphy, M.S.; Smith, G.N. Pre-eclampsia and Cardiovascular Disease Risk Assessment in Women. Am. J. Perinatol. 2016, 33, 723–731. [Google Scholar] [CrossRef] [PubMed]
  5. Wu, P.; Haththotuwa, R.; Kwok, C.S.; Babu, A.; Kotronias, R.A.; Rushton, C.; Zaman, A.; Fryer, A.A.; Kadam, U.; Chew-Graham, C.A.; et al. Preeclampsia and Future Cardiovascular Health: A Systematic Review and Meta-Analysis. Circ. Cardiovasc. Qual. Outcomes 2017, 10, e003497. [Google Scholar] [CrossRef]
  6. Pinheiro, T.V.; Brunetto, S.; Ramos, J.G.; Bernardi, J.R.; Goldani, M.Z. Hypertensive disorders during pregnancy and health outcomes in the offspring: A systematic review. J. Dev. Orig. Health Dis. 2016, 7, 391–407. [Google Scholar] [CrossRef]
  7. Davis, E.F.; Lazdam, M.; Lewandowski, A.J.; Worton, S.A.; Kelly, B.; Kenworthy, Y.; Adwani, S.; Wilkinson, A.R.; McCormick, K.; Sargent, I.; et al. Cardiovascular risk factors in children and young adults born to preeclamptic pregnancies: A systematic review. Pediatrics 2012, 129, e1552–e1561. [Google Scholar] [CrossRef]
  8. Duley, L. The global impact of pre-eclampsia and eclampsia. Semin. Perinatol. 2009, 33, 130–137. [Google Scholar] [CrossRef]
  9. Steegers, E.A.; von Dadelszen, P.; Duvekot, J.J.; Pijnenborg, R. Pre-eclampsia. Lancet 2010, 376, 631–644. [Google Scholar] [CrossRef]
  10. Burton, G.J.; Redman, C.W.; Roberts, J.M.; Moffett, A. Pre-eclampsia: Pathophysiology and clinical implications. BMJ 2019, 366, l2381. [Google Scholar] [CrossRef] [Green Version]
  11. Phipps, E.A.; Thadhani, R.; Benzing, T.; Karumanchi, S.A. Pre-eclampsia: Pathogenesis, novel diagnostics and therapies. Nat. Rev. Nephrol. 2019, 15, 275–289. [Google Scholar] [CrossRef]
  12. Hod, T.; Cerdeira, A.S.; Karumanchi, S.A. Molecular Mechanisms of Preeclampsia. Cold Spring Harb. Perspect. Med. 2015, 5, a023473. [Google Scholar] [CrossRef] [Green Version]
  13. Boutin, A.; Gasse, C.; Guerby, P.; Giguere, Y.; Tetu, A.; Bujold, E. First-Trimester Preterm Preeclampsia Screening in Nulliparous Women: The Great Obstetrical Syndrome (GOS) Study. J. Obstet. Gynaecol. Can. 2021, 43, 43–49. [Google Scholar] [CrossRef]
  14. Rolnik, D.L.; Wright, D.; Poon, L.C.Y.; Syngelaki, A.; O’Gorman, N.; de Paco Matallana, C.; Akolekar, R.; Cicero, S.; Janga, D.; Singh, M.; et al. ASPRE trial: Performance of screening for preterm pre-eclampsia. Ultrasound Obstet. Gynecol. 2017, 50, 492–495. [Google Scholar] [CrossRef]
  15. Mosimann, B.; Amylidi-Mohr, S.K.; Surbek, D.; Raio, L. First Trimester Screening for Preeclampsia—A Systematic Review. Hypertens. Pregnancy 2020, 39, 1–11. [Google Scholar] [CrossRef] [PubMed]
  16. Buhimschi, I.A.; Zhao, G.; Funai, E.F.; Harris, N.; Sasson, I.E.; Bernstein, I.M.; Saade, G.R.; Buhimschi, C.S. Proteomic profiling of urine identifies specific fragments of SERPINA1 and albumin as biomarkers of preeclampsia. Am. J. Obstet. Gynecol. 2008, 199, 551.e1–551.e16. [Google Scholar] [CrossRef] [PubMed]
  17. Lecarpentier, E.; Gris, J.C.; Cochery-Nouvellon, E.; Mercier, E.; Abbas, H.; Thadhani, R.; Karumanchi, S.A.; Haddad, B. Urinary Placental Growth Factor for Prediction of Placental Adverse Outcomes in High-Risk Pregnancies. Obstet. Gynecol. 2019, 134, 1326–1332. [Google Scholar] [CrossRef] [PubMed]
  18. Parker, C.E.; Pearson, T.W.; Anderson, N.L.; Borchers, C.H. Mass-spectrometry-based clinical proteomics—A review and prospective. Analyst 2010, 135, 1830–1838. [Google Scholar] [CrossRef] [Green Version]
  19. Uzozie, A.C.; Aebersold, R. Advancing translational research and precision medicine with targeted proteomics. J. Proteom. 2018, 189, 1–10. [Google Scholar] [CrossRef]
  20. Beasley-Green, A. Urine Proteomics in the Era of Mass Spectrometry. Int. Neurourol. J. 2016, 20, S70–S75. [Google Scholar] [CrossRef] [Green Version]
  21. Marimuthu, A.; O’Meally, R.N.; Chaerkady, R.; Subbannayya, Y.; Nanjappa, V.; Kumar, P.; Kelkar, D.S.; Pinto, S.M.; Sharma, R.; Renuse, S.; et al. A comprehensive map of the human urinary proteome. J. Proteome Res. 2011, 10, 2734–2743. [Google Scholar] [CrossRef] [PubMed] [Green Version]
  22. Navajas, R.; Corrales, F.; Paradela, A. Quantitative proteomics-based analyses performed on pre-eclampsia samples in the 2004-2020 period: A systematic review. Clin. Proteom. 2021, 18, 6. [Google Scholar] [CrossRef] [PubMed]
  23. Fillion, A.; Guerby, P.; Lachance, C.; Comeau, M.-P.; Bussières, M.-C.; Doucet-Gingras, F.-A.; Zérounian, S.; Demers, S.; Laforest, G.; Menzies, D.; et al. Placental Growth Factor and soluble Fms-like tyrosine kinase-1 in Preeclampsia: A case-cohort (PEARL) study. J. Obstet. Gynaecol. Can. 2020, 42, 1235–1242. [Google Scholar] [CrossRef] [PubMed]
  24. Fillion, A.; Guerby, P.; Menzies, D.; Lachance, C.; Comeau, M.P.; Bussieres, M.C.; Doucet-Gingras, F.A.; Zerounian, S.; Bujold, E. Pathological investigation of placentas in preeclampsia (the PEARL study). Hypertens. Pregnancy 2021, 40, 56–62. [Google Scholar] [CrossRef] [PubMed]
  25. Magee, L.A.; Pels, A.; Helewa, M.; Rey, E.; von Dadelszen, P. Diagnostic, evaluation et prise en charge des troubles hypertensifs de la grossesse: Resume directif. J. Obstet. Gynaecol. Can. 2016, 38, S426–S452. [Google Scholar] [CrossRef]
  26. Kramer, M.S.; Platt, R.W.; Wen, S.W.; Joseph, K.S.; Allen, A.; Abrahamowicz, M.; Blondel, B.; Breart, G.; Fetal/Infant Health Study Group of the Canadian Perinatal Surveillance, S. A new and improved population-based Canadian reference for birth weight for gestational age. Pediatrics 2001, 108, E35. [Google Scholar] [CrossRef] [Green Version]
  27. Rappsilber, J.; Mann, M.; Ishihama, Y. Protocol for micro-purification, enrichment, pre-fractionation and storage of peptides for proteomics using StageTips. Nat. Protoc. 2007, 2, 1896–1906. [Google Scholar] [CrossRef]
  28. Tyanova, S.; Temu, T.; Cox, J. The MaxQuant computational platform for mass spectrometry-based shotgun proteomics. Nat. Protoc. 2016, 11, 2301–2319. [Google Scholar] [CrossRef]
  29. RCoreTeam. R: A Language and Environment for Statistical Computing; R Foundation for Statistical Computing: Vienna, Austria, 2020. [Google Scholar]
  30. Smyth, G. Limma: Linear Models for Microarray Data; Springer: New York, NY, USA, 2005; pp. 397–420. [Google Scholar]
  31. Pino, L.K.; Searle, B.C.; Bollinger, J.G.; Nunn, B.; MacLean, B.; MacCoss, M.J. The Skyline ecosystem: Informatics for quantitative mass spectrometry proteomics. Mass Spectrom. Rev. 2020, 39, 229–244. [Google Scholar] [CrossRef]
  32. Szklarczyk, D.; Gable, A.L.; Nastou, K.C.; Lyon, D.; Kirsch, R.; Pyysalo, S.; Doncheva, N.T.; Legeay, M.; Fang, T.; Bork, P.; et al. The STRING database in 2021: Customizable protein-protein networks, and functional characterization of user-uploaded gene/measurement sets. Nucleic Acids Res. 2021, 49, D605–D612. [Google Scholar] [CrossRef]
  33. Serdar, Z.; Gur, E.; Develioglu, O. Serum iron and copper status and oxidative stress in severe and mild preeclampsia. Cell Biochem. Funct. 2006, 24, 209–215. [Google Scholar] [CrossRef] [PubMed]
  34. Guller, S.; Buhimschi, C.S.; Ma, Y.Y.; Huang, S.T.; Yang, L.; Kuczynski, E.; Zambrano, E.; Lockwood, C.J.; Buhimschi, I.A. Placental expression of ceruloplasmin in pregnancies complicated by severe preeclampsia. Lab. Investig. 2008, 88, 1057–1067. [Google Scholar] [CrossRef] [PubMed] [Green Version]
  35. Alemu, A.; Terefe, B.; Abebe, M.; Biadgo, B. Thyroid hormone dysfunction during pregnancy: A review. Int. J. Reprod. Biomed. 2016, 14, 677–686. [Google Scholar] [CrossRef] [PubMed] [Green Version]
  36. Kaya, E.; Sahin, Y.; Ozkececi, Z.; Pasaoglu, H. Relation between birth weight and thyroid function in preeclampsia-eclampsia. Gynecol. Obstet. Investig. 1994, 37, 30–33. [Google Scholar] [CrossRef] [Green Version]
  37. Buhimschi, I.A.; Nayeri, U.A.; Zhao, G.; Shook, L.L.; Pensalfini, A.; Funai, E.F.; Bernstein, I.M.; Glabe, C.G.; Buhimschi, C.S. Protein misfolding, congophilia, oligomerization, and defective amyloid processing in preeclampsia. Sci. Transl. Med. 2014, 6, 245ra292. [Google Scholar] [CrossRef]
  38. Bracken, H.; Buhimschi, I.A.; Rahman, A.; Smith, P.R.S.; Pervin, J.; Rouf, S.; Bousieguez, M.; Lopez, L.G.; Buhimschi, C.S.; Easterling, T.; et al. Congo red test for identification of preeclampsia: Results of a prospective diagnostic case-control study in Bangladesh and Mexico. EClinicalMedicine 2021, 31, 100678. [Google Scholar] [CrossRef]
  39. Starodubtseva, N.; Nizyaeva, N.; Baev, O.; Bugrova, A.; Gapaeva, M.; Muminova, K.; Kononikhin, A.; Frankevich, V.; Nikolaev, E.; Sukhikh, G. SERPINA1 Peptides in Urine as A Potential Marker of Preeclampsia Severity. Int. J. Mol. Sci. 2020, 21, 914. [Google Scholar] [CrossRef] [Green Version]
  40. Levine, R.J.; Thadhani, R.; Qian, C.; Lam, C.; Lim, K.H.; Yu, K.F.; Blink, A.L.; Sachs, B.P.; Epstein, F.H.; Sibai, B.M.; et al. Urinary placental growth factor and risk of preeclampsia. JAMA 2005, 293, 77–85. [Google Scholar] [CrossRef] [Green Version]
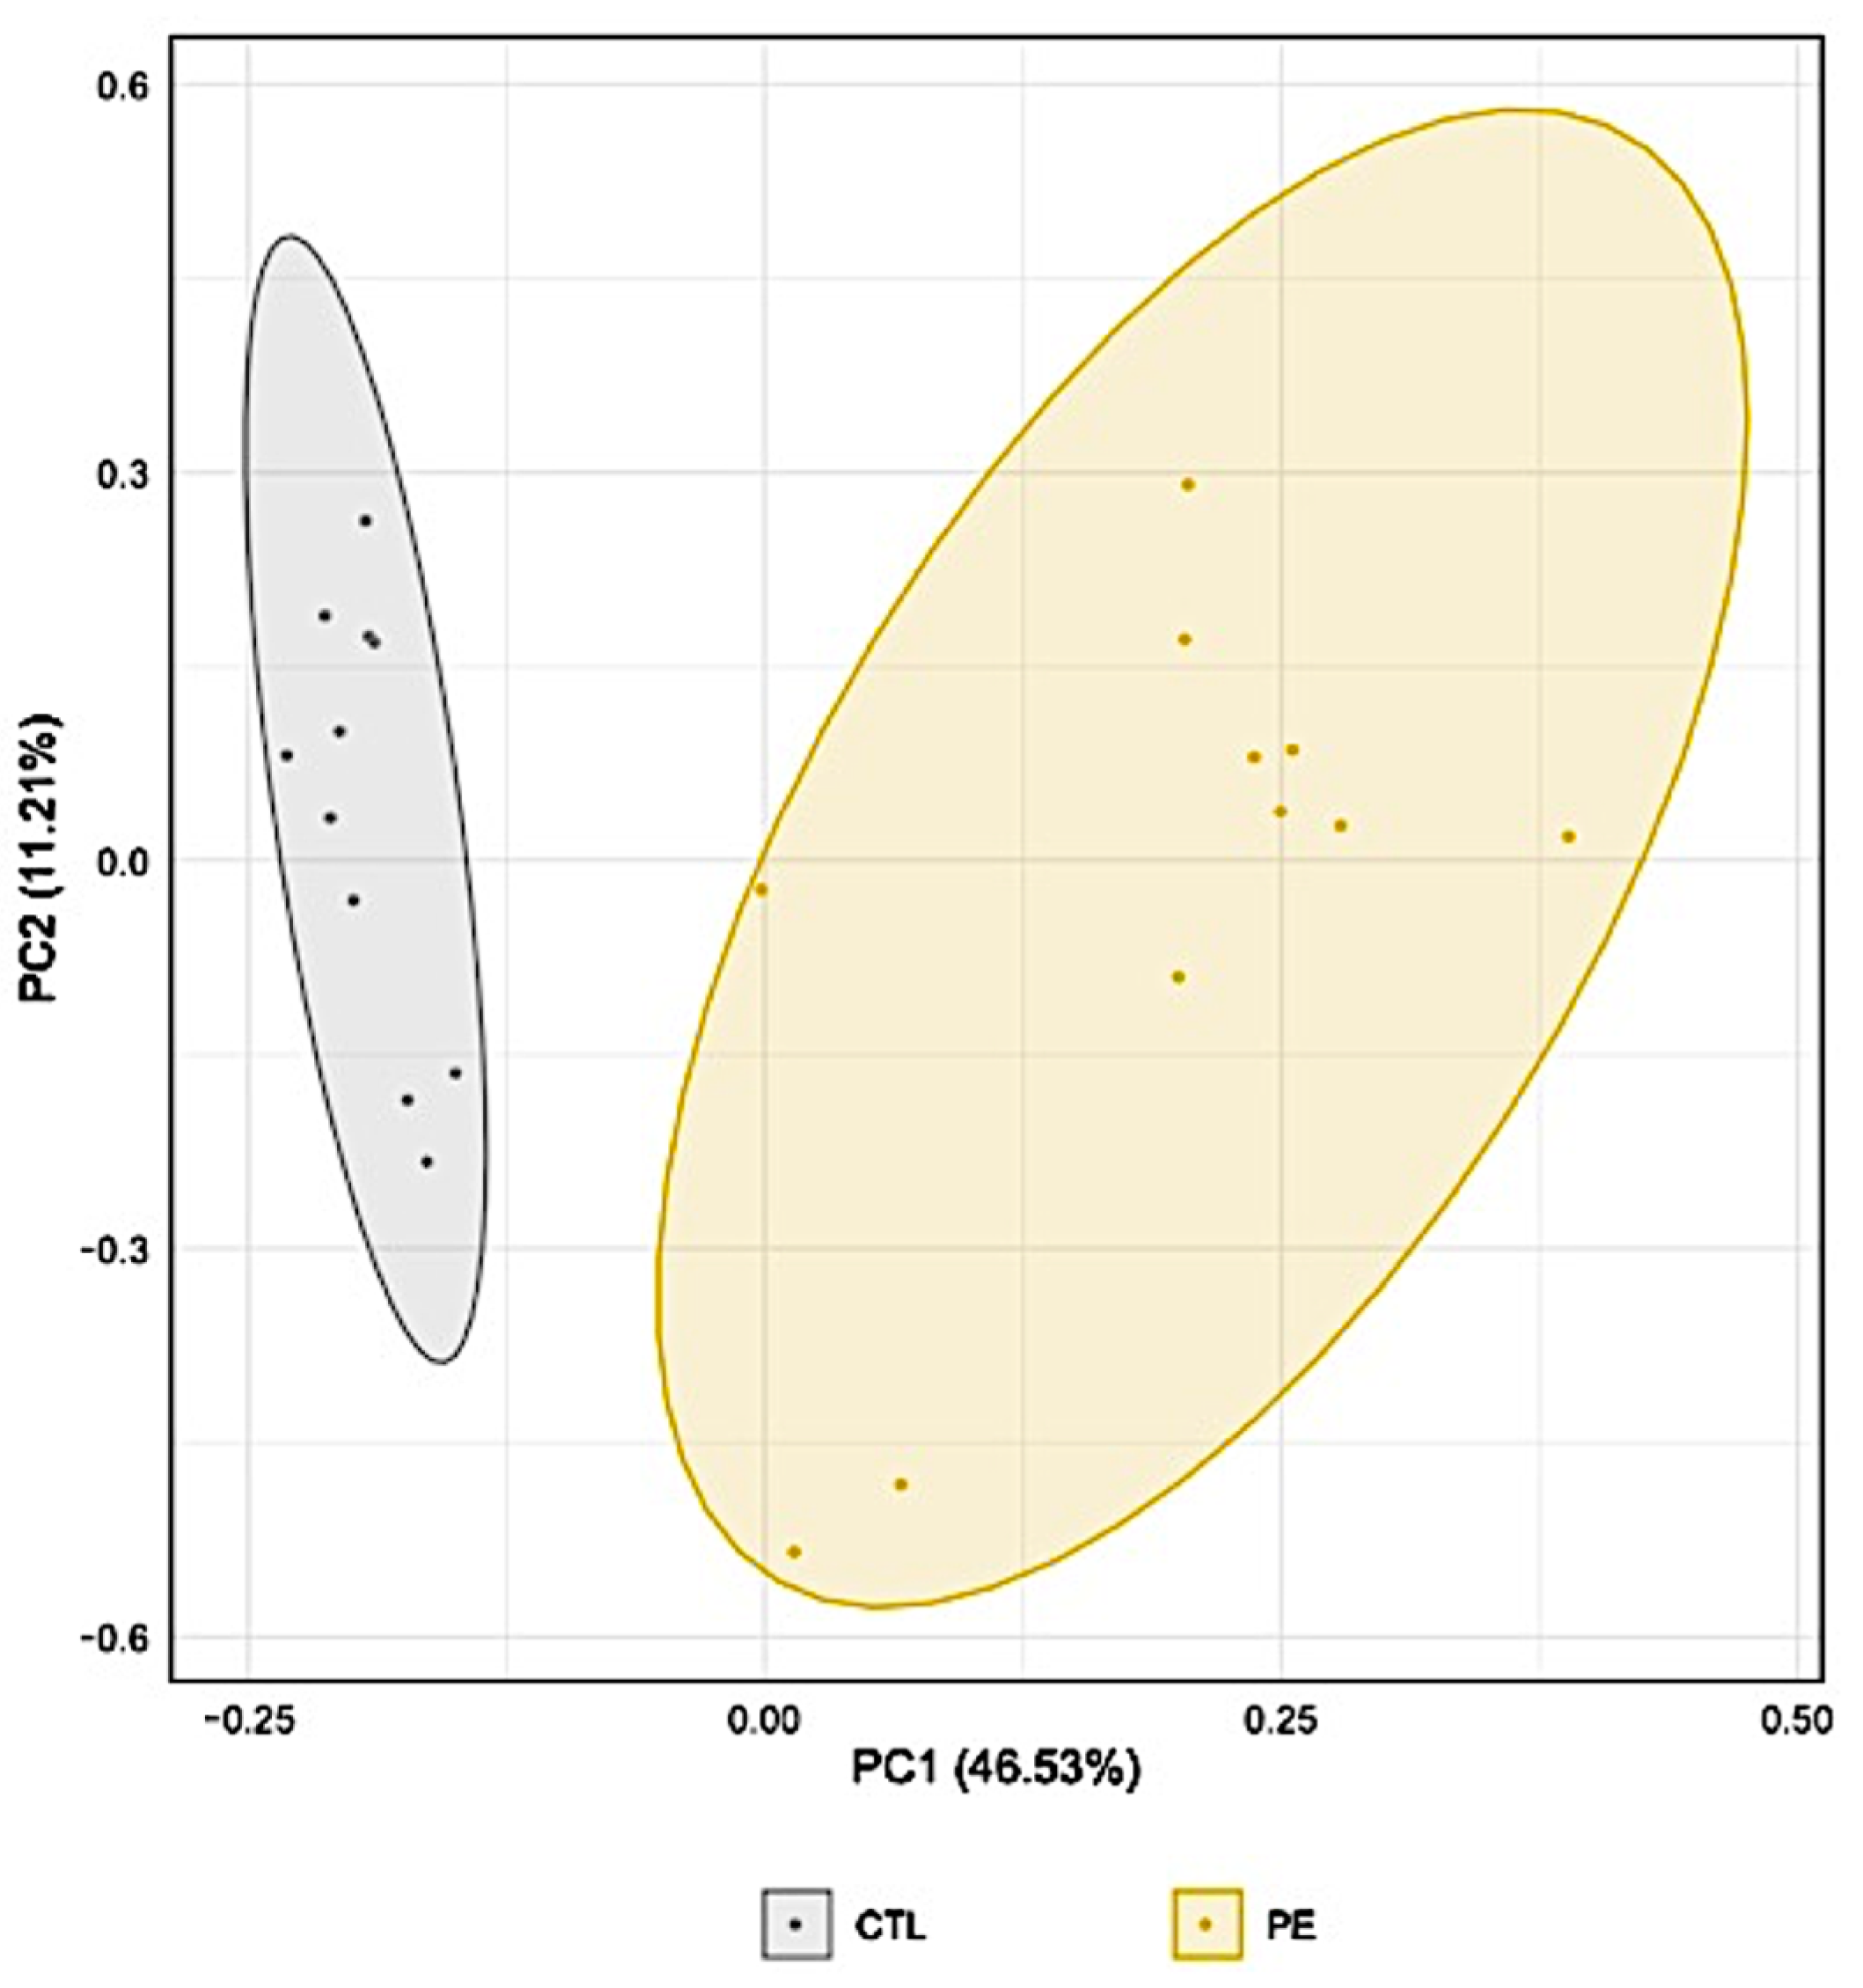
Figure 1. Principal Component Analysis (PCA) of the urinary proteomic profiles in participants with and without preeclampsia. Each point represents a participant. The axes correspond to artificial axes rebuilt by the PCA to display the maximum variability between the samples. CTL: Control; PE: Preeclampsia.
Jcm 10 04679 g001
Figure 2. Heatmap of the expression of the 1108 proteins extracted from the proteomic analysis. Colors correspond to the centered intensity values of each protein in each urine sample from blue (smallest intensity) to red (highest intensity). The proteins (in lines) and the samples (in columns) are presented as clustered according to a complete linkage clustering method; the corresponding dendro-gram is shown only for samples.
Jcm 10 04679 g002
Figure 3. Volcano plot of the 1108 proteins quantified in the proteomic analysis. The x-axis corresponds to the fold change (Log2 of PE/control protein intensity ratio), the y-axis corresponds to the statistical value (−Log10 (p-value)). Significantly regulated proteins are displayed in red (upregulated) or in blue (downregulated); non-significantly regulated proteins are displayed in grey.
Jcm 10 04679 g003
Figure 4. Validation study: Distribution of intensities measured by targeted proteomics of 21 urinary proteins in women with and without preeclampsia. The boxplots represent the distribution of intensities in each group (grey: control, yellow: PE) as well as the median (line), the interquartile (box) and the maximum and minimum values within 1.5 times the interquartile range (whisker) of 21 proteins monitored by targeted proteomics in urine samples of women with preeclampsia or women with uncomplicated pregnancies. Statistical significance is displayed above each graph: * p < 0.05; ** p < 0.01; *** p < 0.001.
Jcm 10 04679 g004
Figure 5. Longitudinal study: Distribution of intensities measured by targeted proteomics of 21 urinary proteins in women with and without preeclampsia at 20–24 or 30–34 weeks of gestation. The boxplots represent the distribution of intensities in each group as well as the median (line), the interquartile (box) and the maximum and minimum values within 1.5 times the interquartile range (whisker) of 21 proteins monitored by targeted proteomics in urine samples collected at 20–22 weeks (blue) and 30–32 weeks (green) of gestation in women with preeclampsia (n = 9) (dark color) or women with uncomplicated pregnancies (n = 20) (light color). Statistical significance is displayed above each graph: * p < 0.05; ** p < 0.01.
Jcm 10 04679 g005
Figure 6. Receiver operating characteristic (ROC) curves for the prediction of preeclampsia and/or fetal growth restriction based on ceruloplasmin and serpin A7 proteins measured by targeted proteomics in urine of women at 20–24 and 30–34 weeks of gestation. The ROC curves present the predictive values of ceruloplasmin and serpin A7 measurements using targeted proteomic on maternal urine samples collected at 20–24 weeks of gestation (A) and at 30–34 weeks of gestation (B). The area under the ROC curves (AUC) were significant for ceruloplasmin at 20–24 weeks (AUC: 0.78; 95%CI: 0.58–0.97, p = 0.016); serpin A7 at 20–24 weeks (AUC: 0.75; 95%CI: 0.57–0.92, p = 0.028); ceruloplasmin at 30–34 weeks (AUC: 0.92; 95%CI: 0.82–1.00, p < 0.001); serpin A7 at 30–34 weeks (AUC: 0.77; 95%CI: 0.56–0.98, p = 0.024).
Jcm 10 04679 g006
Table 1. Characteristics of our study populations.
Discovery StudyValidation StudyLongitudinal Study
Cases (n = 12)Controls (n = 12)Cases (n = 12)Controls (n = 12)Cases (n = 10)Controls (n = 20)
Maternal age (years)29 (27–31)29 (27–33)29 (27–31)30 (28–33)31 (27–35)30 (29–33)
BMI (kg/m2)33 (28–36)28 (26–33)30 (28–35)30 (25–34)31 (29–33)24 (22–26)
Caucasian12 (100%)12 (100%)11 (92%)12 (100%)9 (90%)20 (100%)
Gestational age at birth34 (29–36)39 (38–40)34 (30–35)40 (40–41)35 (33–36)40 (39–41)
Preeclampsia12 (100%)0 (0%)12 (100%)0 (0%)9 (90%)0 (0%)
Fetal growth restriction6 (50%)1 (8%)2 (17%)2 (17%)4 (40%)0 (0%)
Median (Interquartile range) or Number (percentage).
Table 2. Validation study by targeted proteomics of 21 urinary proteins in women with and without preeclampsia.
Protein AccessionGene NameProtein DescriptionRatiop-ValueSignificance
P04217A1BGAlpha-1B-glycoprotein4.850.00000***
P43652AFMAfamin6.890.00001***
P25311AZGP1Zinc-alpha-2-glycoprotein14.390.00005***
P01024C3Complement C31.920.01029*
P00915CA1Carbonic anydrase 16.200.03347*
P00450CPCeruloplasmin6.550.00005***
P02774GCVitamin D-binding protein11.310.00001***
P19823ITIH2Inter-alpha-trypsin inhibitor heavy chain 26.350.01660*
P02763ORM1Alpha-1-acid-glycoprotein 12.960.06649
P19652ORM2Alpha-1-acid-glycoprotein 21.660.28634
P01009SERPINA1Alpha-1-antitrypsin (serpin A1)9.500.01026*
P01011SERPINA3Alpha-1-antichymotrypsin (serpin A3)3.830.00011**
P08185SERPINA6Corticosteroid-binding globulin (serpin A6)2.270.00039**
P05543SERPINA7Thyroxine-binding globulin (serpin A7)16.420.00013**
P01008SERPINC1Antithrombin-III (serpin C1)4.380.00000***
I3L145SHBGSex-hormone-binding globulin4.350.00000***
P02766TTRTransthyretin4.320.00000***
P02768ALBAlbumin2.570.00001***
P69905HBA1Hemoglobin subunit alpha 13.740.02510*
P68871HBBHemoglobin subunit beta24.620.00004***
P02787TFSerotransferrin2.820.02372*
For each protein (Uniprot accession number given in the first column), average intensity ratio of PE over control groups (PE/CTL) is shown associated to its Student’s test statistical p-value and the corresponding significance. * p < 0.05; ** p < 0.001; *** p < 0.0001.
Table 3. Longitudinal study by targeted proteomics of 21 urinary proteins in women with and without preeclampsia.
20–24 Weeks30–34 Weeks
Gene NameRatio PE/CTLp-ValueSignificanceRatio PE/CTLp-ValueSignificance
SERPINA71.420.04247*1.620.00966**
CP1.810.04515*4.870.01784*
AFM1.290.33745 2.480.01821*
ITIH21.140.66046 3.670.02808*
TF1.860.27263 8.420.03446*
A1BG1.190.50528 2.220.04651*
SERPINA31.390.22978 1.950.05920
GC1.200.28638 1.970.06296
ALB1.490.20602 5.540.06954
SERPINA11.360.24731 4.110.07165
C31.070.85042 1.630.07776
ORM11.690.42028 2.520.07781
SERPINA61.050.84649 1.970.08995
ORM21.350.49657 1.520.19926
TTR1.230.29396 1.480.21370
HBA15.270.01524*55.400.30338
HBB5.430.02956*30.910.33029
SERPINC10.990.97216 1.280.34586
AZGP11.440.59655 1.190.61454
CA10.620.55159 0.700.63019
SHBG0.920.58530 1.070.72452
For each protein (Uniprot accession number given in the first column) at two-time points (20–24 or 30–34 weeks of gestation), average intensity of PE over control groups (PE/CTL) is shown associated to its Student’s test statistical p-value and the corresponding significance. * p < 0.05; ** p < 0.01.
Publisher’s Note: MDPI stays neutral with regard to jurisdictional claims in published maps and institutional affiliations.