
Structure–Function Relationship and Vision-Related Quality of Life in Glaucoma Secondary to Anterior Uveitis: Comparison with Open Angle Glaucoma

Abstract
1. Introduction
2. Patients and Methods
3. VF Examination
4. Optical Coherence Tomography
5. Visual Function Questionnaire-25 (VFQ-25)
6. Data Analysis
7. Results
8. Discussion
Author Contributions
Funding
Institutional Review Board Statement
Informed Consent Statement
Conflicts of Interest
References
- Chang, J.H.; Wakefield, D. Uveitis: A global perspective. Ocul. Immunol. Inflamm. 2002, 10, 263–279. [Google Scholar] [CrossRef] [PubMed]
- Tsirouki, T.; Dastiridou, A.; Symeonidis, C.; Tounakaki, O.; Brazitikou, I.; Kalogeropoulos, C.; Androudi, S. A Focus on the Epidemiology of Uveitis. Ocul. Immunol. Inflamm. 2018, 26, 2–16. [Google Scholar] [CrossRef] [PubMed]
- Al-Ani, H.H.; Sims, J.L.; Tomkins-Netzer, O.; Lightman, S.; Niederer, R.L. Vision loss in anterior uveitis. Br. J. Ophthalmol. 2020, 104, 1652–1657. [Google Scholar] [CrossRef]
- Quigley, H.A. Glaucoma. Lancet 2011, 377, 1367–1377. [Google Scholar] [CrossRef]
- Moorthy, R.S.; Mermoud, A.; Baerveldt, G.; Minckler, D.S.; Lee, P.P.; Rao, N.A. Glaucoma associated with uveitis. Surv. Ophthalmol. 1997, 41, 361–394. [Google Scholar] [CrossRef]
- Kalogeropoulos, D.; Sung, V.C. Pathogenesis of Uveitic Glaucoma. J. Curr. Glaucoma Pract. 2018, 12, 125–138. [Google Scholar] [CrossRef]
- Munoz-Negrete, F.J.; Moreno-Montanes, J.; Hernandez-Martinez, P.; Rebolleda, G. Current Approach in the Diagnosis and Management of Uveitic Glaucoma. Biomed. Res. Int. 2015, 2015, 742792. [Google Scholar] [CrossRef]
- Durrani, O.M.; Tehrani, N.N.; Marr, J.E.; Moradi, P.; Stavrou, P.; Murray, P.I. Degree, duration, and causes of visual loss in uveitis. Br. J. Ophthalmol. 2004, 88, 1159–1162. [Google Scholar] [CrossRef]
- Hoeksema, L.; Los, L.I. Vision-Related Quality of Life in Patients with Inactive HLA-B27-Associated-Spectrum Anterior Uveitis. PLoS ONE 2016, 11, e0146956. [Google Scholar] [CrossRef]
- McKean-Cowdin, R.; Wang, Y.; Wu, J.; Azen, S.P.; Varma, R. Impact of visual field loss on health-related quality of life in glaucoma: The Los Angeles Latino Eye Study. Ophthalmology 2008, 115, 941–948.e941. [Google Scholar] [CrossRef]
- Sung, K.R.; Chun, Y.S.; Park, C.K.; Kim, H.K.; Yoo, C.; Kim, Y.Y.; Park, K.H.; Kim, C.Y.; Choi, K.R.; Lee, K.W.; et al. Vision-related Quality of Life in Korean Glaucoma Patients. J. Glaucoma 2017, 26, 159–165. [Google Scholar] [CrossRef]
- Sawada, H.; Yoshino, T.; Fukuchi, T.; Abe, H. Assessment of the vision-specific quality of life using clustered visual field in glaucoma patients. J. Glaucoma 2014, 23, 81–87. [Google Scholar] [CrossRef] [PubMed]
- Okamoto, M.; Sugisaki, K.; Murata, H.; Hirasawa, H.; Mayama, C.; Asaoka, R. Impact of better and worse eye damage on quality of life in advanced glaucoma. Sci. Rep. 2014, 4, 4144. [Google Scholar] [CrossRef]
- Chun, Y.S.; Lee, D.I.; Kwon, J.; Park, I.K. Comparison of Impact of Monocular and Integrated Binocular Visual Fields on Vision-related Quality of Life. J. Glaucoma 2017, 26, 283–291. [Google Scholar] [CrossRef] [PubMed]
- Chun, Y.S.; Sung, K.R.; Park, C.K.; Kim, H.K.; Yoo, C.; Kim, Y.Y.; Park, K.H.; Kim, C.Y.; Choi, K.R.; Lee, K.W.; et al. Vision-related quality of life according to location of visual field loss in patients with glaucoma. Acta Ophthalmol. 2019, 97, e772–e779. [Google Scholar] [CrossRef]
- Frick, K.D.; Drye, L.T.; Kempen, J.H.; Dunn, J.P.; Holland, G.N.; Latkany, P.; Rao, N.A.; Sen, H.N.; Sugar, E.A.; Thorne, J.E.; et al. Associations among visual acuity and vision- and health-related quality of life among patients in the multicenter uveitis steroid treatment trial. Investig. Ophthalmol. Vis. Sci. 2012, 53, 1169–1176. [Google Scholar] [CrossRef]
- Arriola-Villalobos, P.; Abasolo, L.; Garcia-Feijoo, J.; Fernandez-Gutierrez, B.; Mendez-Fernandez, R.; Pato, E.; Diaz-Valle, D.; Rodriguez-Rodriguez, L. Vision-related Quality of Life in Patients with Non-infectious Uveitis: A Cross-sectional Study. Ocul. Immunol. Inflamm. 2018, 26, 717–725. [Google Scholar] [CrossRef]
- Li, J.; Ang, M.; Cheung, C.M.; Vania, M.; Chan, A.S.; Waduthantri, S.; Yang, H.; Chee, S.P. Aqueous cytokine changes associated with Posner-Schlossman syndrome with and without human cytomegalovirus. PLoS ONE 2012, 7, e44453. [Google Scholar] [CrossRef]
- Ohira, S.; Inoue, T.; Iwao, K.; Takahashi, E.; Tanihara, H. Factors Influencing Aqueous Proinflammatory Cytokines and Growth Factors in Uveitic Glaucoma. PLoS ONE 2016, 11, e0147080. [Google Scholar] [CrossRef] [PubMed]
- Siddique, S.S.; Suelves, A.M.; Baheti, U.; Foster, C.S. Glaucoma and uveitis. Surv. Ophthalmol. 2013, 58, 1–10. [Google Scholar] [CrossRef] [PubMed]
- Liu, X.; Kelly, S.R.; Montesano, G.; Bryan, S.R.; Barry, R.J.; Keane, P.A.; Denniston, A.K.; Crabb, D.P. Evaluating the Impact of Uveitis on Visual Field Progression Using Large-Scale Real-World Data. Am. J. Ophthalmol. 2019, 207, 144–150. [Google Scholar] [CrossRef]
- Kim, J.A.; Lee, E.J.; Kim, H.; Kim, T.W. Steeper structure-function relationship in eyes with than without a parapapillary deep-layer microvasculature dropout. Sci. Rep. 2018, 8, 14182. [Google Scholar] [CrossRef]
- Brusini, P. Ageing and visual field data. Br. J. Ophthalmol. 2007, 91, 1257–1258. [Google Scholar] [CrossRef] [PubMed]
- Din, N.M.; Taylor, S.R.; Isa, H.; Tomkins-Netzer, O.; Bar, A.; Talat, L.; Lightman, S. Evaluation of retinal nerve fiber layer thickness in eyes with hypertensive uveitis. JAMA Ophthalmol. 2014, 132, 859–865. [Google Scholar] [CrossRef]
- Alaghband, P.; Baneke, A.J.; Galvis, E.; Madekurozwa, M.; Chu, B.; Stanford, M.; Overby, D.; Lim, K.S. Aqueous Humor Dynamics in Uveitic Eyes. Am. J. Ophthalmol. 2019, 208, 347–355. [Google Scholar] [CrossRef] [PubMed]
- Nelson-Quigg, J.M.; Cello, K.; Johnson, C.A. Predicting binocular visual field sensitivity from monocular visual field results. Investig. Ophthalmol. Vis. Sci. 2000, 41, 2212–2221. [Google Scholar]
- Arora, K.S.; Boland, M.V.; Friedman, D.S.; Jefferys, J.L.; West, S.K.; Ramulu, P.Y. The relationship between better-eye and integrated visual field mean deviation and visual disability. Ophthalmology 2013, 120, 2476–2484. [Google Scholar] [CrossRef]
- Choi, J.A.; Jung, I.Y.; Jee, D. The Relationship between the Sighting Eye and Functional and Structural Asymmetries in Glaucoma. Investig. Ophthalmol. Vis. Sci. 2018, 59, 5447–5454. [Google Scholar] [CrossRef]
- Mwanza, J.-C.; Durbin, M.K.; Budenz, D.L.; Girkin, C.A.; Leung, C.K.; Liebmann, J.M.; Peace, J.H.; Werner, J.S.; Wollstein, G. Profile and predictors of normal ganglion cell–inner plexiform layer thickness measured with frequency-domain optical coherence tomography. Investig. Ophthalmol. Vis. Sci. 2011, 52, 7872–7879. [Google Scholar] [CrossRef]
- Mwanza, J.-C.; Oakley, J.D.; Budenz, D.L.; Chang, R.T.; O’Rese, J.K.; Feuer, W.J. Macular ganglion cell–inner plexiform layer: Automated detection and thickness reproducibility with spectral domain–optical coherence tomography in glaucoma. Investig. Ophthalmol. Vis. Sci. 2011, 52, 8323–8329. [Google Scholar] [CrossRef]
- Lee, J.R.; Jeoung, J.W.; Choi, J.; Choi, J.Y.; Park, K.H.; Kim, Y.D. Structure-function relationships in normal and glaucomatous eyes determined by time- and spectral-domain optical coherence tomography. Investig. Ophthalmol. Vis. Sci. 2010, 51, 6424–6430. [Google Scholar] [CrossRef]
- Heo, J.W.; Yoon, H.S.; Shin, J.P.; Moon, S.W.; Chin, H.S.; Kwak, H.W. A validation and reliability study of the Korean version of national eye institute visual function questionnaire 25. J. Korean Ophthalmol. Soc. 2010, 51, 1354–1367. [Google Scholar] [CrossRef]
- Hirneiss, C.; Reznicek, L.; Vogel, M.; Pesudovs, K. The impact of structural and functional parameters in glaucoma patients on patient-reported visual functioning. PLoS ONE 2013, 8, e80757. [Google Scholar] [CrossRef]
- Murphy, C.C.; Hughes, E.H.; Frost, N.A.; Dick, A.D. Quality of life and visual function in patients with intermediate uveitis. Br. J. Ophthalmol. 2005, 89, 1161–1165. [Google Scholar] [CrossRef] [PubMed]
- Crabb, D.P.; Viswanathan, A.C. Integrated visual fields: A new approach to measuring the binocular field of view and visual disability. Graefe’s Arch. Clin. Exp. Ophthalmol. 2005, 243, 210–216. [Google Scholar] [CrossRef] [PubMed]
- Cheng, H.C.; Guo, C.Y.; Chen, M.J.; Ko, Y.C.; Huang, N.; Liu, C.J. Patient-reported vision-related quality of life differences between superior and inferior hemifield visual field defects in primary open-angle glaucoma. JAMA Ophthalmol. 2015, 133, 269–275. [Google Scholar] [CrossRef] [PubMed]
- Moore, D.B.; Jaffe, G.J.; Asrani, S. Retinal nerve fiber layer thickness measurements: Uveitis, a major confounding factor. Ophthalmology 2015, 122, 511–517. [Google Scholar] [CrossRef]
- Asrani, S.; Moore, D.B.; Jaffe, G.J. Paradoxical changes of retinal nerve fiber layer thickness in uveitic glaucoma. JAMA Ophthalmol. 2014, 132, 877–880. [Google Scholar] [CrossRef] [PubMed]
- Kim, C.S.; Seong, G.J.; Lee, N.H.; Song, K.C. Prevalence of primary open-angle glaucoma in central South Korea the Namil study. Ophthalmology 2011, 118, 1024–1030. [Google Scholar] [CrossRef] [PubMed]
- Iwase, A.; Suzuki, Y.; Araie, M.; Yamamoto, T.; Abe, H.; Shirato, S.; Kuwayama, Y.; Mishima, H.K.; Shimizu, H.; Tomita, G.; et al. The prevalence of primary open-angle glaucoma in Japanese: The Tajimi Study. Ophthalmology 2004, 111, 1641–1648. [Google Scholar] [CrossRef]


| OAG | UG | p-Value * | |
|---|---|---|---|
| Number of subjects | 138 | 69 | |
| Age (years) | 55.16 ± 14.27 | 52.96 ± 15.80 | 0.314 * |
| Gender(M:F) | 80:58 | 47:22 | 0.175 † |
| Visual acuity (LogMAR) | 0.13 ± 0.18 | 0.29 ± 0.34 | <0.001 * |
| Average IOP (mmHg) | 12.49 ± 3.12 | 17.25 ± 8.27 | <0.001* |
| Peak IOP (mmHg) | 17.8 ± 13.8 | 34.7 ± 12.7 | <0.001* |
| No. of anti-glaucoma medication (Number) | 1.57 ± 0.61 | 1.67 ± 1.00 | 0.403 * |
| Binocular IVF | |||
| Whole IVF (dB) | −3.30 ± 4.36 | −2.60 ± 4.87 | 0.341 * |
| Superior IVF (dB) | −3.76 ± 5.25 | −3.00 ±5.20 | 0.364 * |
| Inferior IVF (dB) | −2.83 ± 4.16 | −2.21 ± 4.89 | 0.381 * |
| Affected eye | |||
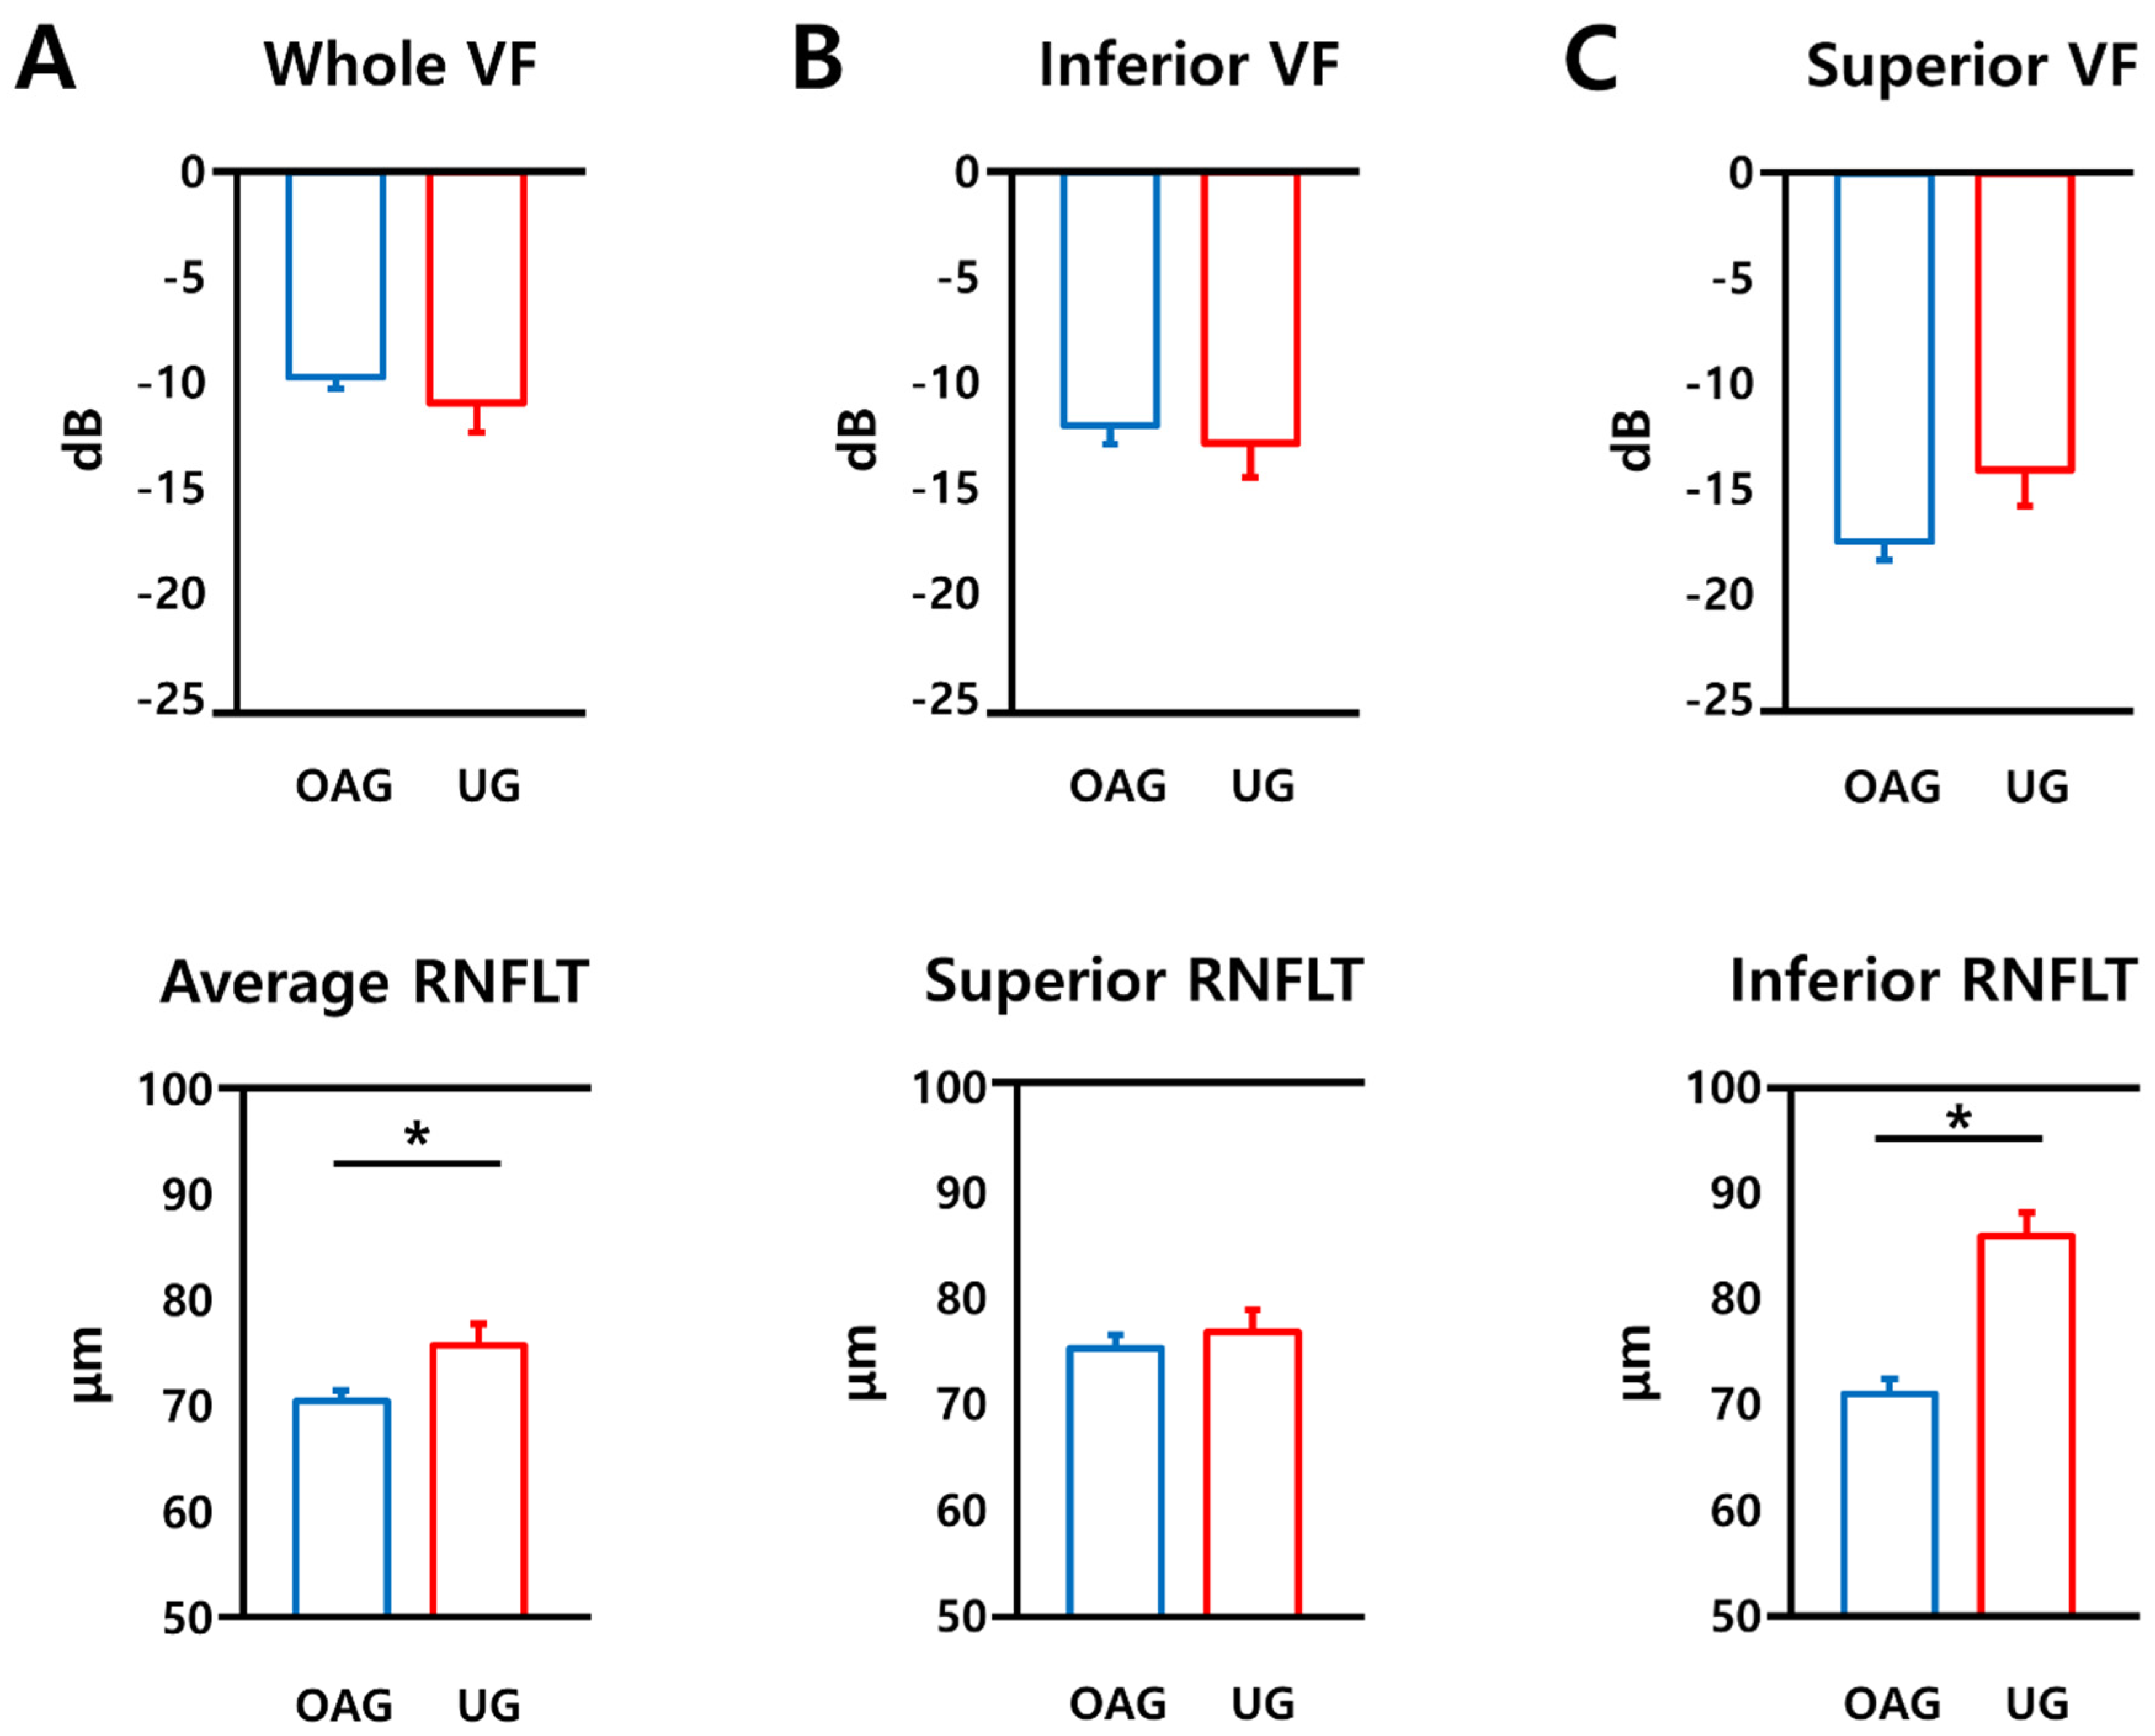
| MD (dB) | −9.72 ± 6.33 | −10.97 ± 10.32 | 0.310 * |
| Superior VF (dB) | −17.49 ± 10.62 | −14.11 ± 12.25 | 0.060 * |
| Inferior VF (dB) | −12.00 ± 10.62 | −12.86 ± 11.81 | 0.623 * |
| The other eye MD (dB) | −4.18 ± 4.90 | −2.84 ± 4.62 | 0.075 * |
| Average RNFLT (μm) | 70.54 ± 11.28 | 75.81 ± 16.58 | 0.008 * |
| Superior RNFLT (μm) | 75.35 ± 14.82 | 76.86 ± 17.54 | 0.518 * |
| Inferior RNFLT (μm) | 70.98 ± 16.93 | 85.96 ± 18.08 | <0.001 * |
| Average GCIPLT (μm) | 63.53 ± 17.18 | 67.06 ± 15.53 | 0.154 * |
| OAG | UG | p-Value * | |
|---|---|---|---|
| General health | 38.32 ± 20.57 | 38.95 ± 23.34 | 0.591 |
| General vision | 64.71 ± 15.25 | 61.40 ± 18.20 | 0.291 |
| Ocular pain | 82.57 ± 16.97 | 77.91 ± 17.22 | 0.185 |
| Near vision | 81.57 ± 18.78 | 80.39 ± 20.66 | 0.330 |
| Distance vision | 87.17 ± 14.33 | 78.29 ± 21.30 | 0.021 |
| Vision specific social function | 94.53 ± 12.39 | 88.66 ± 18.86 | 0.021 |
| Vision specific mental health | 78.54 ± 17.96 | 72.14 ± 30.09 | 0.073 |
| Vision specific role difficulties | 81.67 ± 22.07 | 67.56 ± 25.91 | 0.001 |
| Vision specific dependency | 92.29 ± 17.30 | 89.09 ± 20.03 | 0.785 |
| Driving | 84.56 ± 22.83 | 80.90 ± 21.63 | 0.461 |
| Color vision | 95.80 ± 13.06 | 89.53 ± 17.45 | 0.001 |
| Peripheral vision | 92.70 ± 13.27 | 84.88 ± 20.51 | 0.026 |
| Composite score | 80.98 ± 11.56 | 75.52 ± 15.58 | 0.026 |
| OAG | UG | |||||
|---|---|---|---|---|---|---|
| Regression Coefficient | CI | p Value | Regression Coefficient | CI | p Value | |
| Age | −0.147 | −0.283, −0.012 | 0.033 | −0.240 | −0.515, 0.034 | 0.085 |
| Visual Acuity * | −8.820 | −19.630, 1.991 | 0.109 | −11.187 | −25.862, 3.488 | 0.131 |
| Average IOP * | 0.019 | −0.609, 0.648 | 0.951 | −0.027 | −0.559, 0.505 | 0.918 |
| No of medication * | −1.663 | −4.850, 1.525 | 0.304 | −5.118 | −9.748, −0.487 | 0.031 |
| Binocular whole IVF | 1.287 | 0.895, 1.680 | <0.001 | 0.778 | −1.484, 3.040 | 0.486 |
| Binocular superior IVF | 0.946 | 0.609, 1.284 | <0.001 | 0.227 | −2.016, 2.470 | 0.837 |
| Binocular inferior IVF | 1.324 | 0.910, 1.738 | <0.001 | 1.091 | −0.943, 3.125 | 0.280 |
| MD * | 0.679 | 0.390, 0.967 | <0.001 | 0.550 | −0.029, 1.130 | 0.062 |
| Superior VF * | 0.203 | 0.022, 0.384 | 0.029 | 0.337 | −0.192, 0.865 | 0.202 |
| Inferior VF * | 0.226 | 0.045, 0.408 | 0.015 | 0.677 | 0.216,1.138 | 0.006 |
| Average RNFLT * | 0.160 | −0.013, 0.333 | 0.070 | 0.377 | 0.079, 0.676 | 0.014 |
| Superior RNFLT * | 0.071 | −0.062, 0.204 | 0.293 | 0.392 | 0.101, 0.683 | 0.010 |
| Inferior RNFLT * | 0.113 | −0.002, 0.227 | 0.054 | 0.218 | −0.066, 0.503 | 0.129 |
| Average GCIPLT * | 0.096 | −0.017, 0.209 | 0.095 | 0.242 | −0.117, 0.600 | 0.181 |
| Model 1 | Model 2 | |||||||
|---|---|---|---|---|---|---|---|---|
| Adjusted R2 | Regression Coefficient | CI | p Value | Adjusted R2 | Regression Coefficient | CI | p Value | |
| OAG | ||||||||
| Binocular whole IVF | 0.238 | 1.242 | 0.846, 1.639 | <0.001 | 0.226 | 1.240 | 0.825, 1.655 | <0.001 |
| Binocular superior IVF | 0.188 | 0.907 | 0.567, 1.247 | <0.001 | 0.176 | 0.898 | 0.541, 1.254 | <0.001 |
| Binocular inferior IVF | 0.231 | 1.278 | 0.862, 1.694 | <0.001 | 0.221 | 1.259 | 0.831, 1.688 | <0.001 |
| MD * | 0.138 | 0.638 | 0.345, 0.931 | <0.001 | 0.125 | 0.641 | 0.321, 0.962 | <0.001 |
| Superior VF * | 0.052 | 0.195 | 0.016, 0.374 | 0.033 | 0.046 | 0.175 | −0.011, 0.361 | 0.065 |
| Inferior VF * | 0.053 | 0.203 | 0.021, 0.385 | 0.029 | 0.045 | 0.177 | −0.015, 0.369 | 0.071 |
| UG | ||||||||
| MD * | 0.135 | 0.586 | 0.016, 1.155 | 0.044 | 0.116 | 0.389 | −0.386, 1.164 | 0.310 |
| Inferior VF * | 0.272 | 0.692 | 0.242,1.242 | 0.004 | 0.236 | 0.596 | 0.037, 1.156 | 0.038 |
Publisher’s Note: MDPI stays neutral with regard to jurisdictional claims in published maps and institutional affiliations. |
© 2021 by the authors. Licensee MDPI, Basel, Switzerland. This article is an open access article distributed under the terms and conditions of the Creative Commons Attribution (CC BY) license (https://creativecommons.org/licenses/by/4.0/).
Share and Cite
Lee, J.-Y.; Kim, J.-H.; La, T.-Y.; Choi, J.-A. Structure–Function Relationship and Vision-Related Quality of Life in Glaucoma Secondary to Anterior Uveitis: Comparison with Open Angle Glaucoma. J. Clin. Med. 2021, 10, 4231. https://doi.org/10.3390/jcm10184231
Lee J-Y, Kim J-H, La T-Y, Choi J-A. Structure–Function Relationship and Vision-Related Quality of Life in Glaucoma Secondary to Anterior Uveitis: Comparison with Open Angle Glaucoma. Journal of Clinical Medicine. 2021; 10(18):4231. https://doi.org/10.3390/jcm10184231
Chicago/Turabian StyleLee, Ji-Young, Jin-Ho Kim, Tae-Yoon La, and Jin-A Choi. 2021. "Structure–Function Relationship and Vision-Related Quality of Life in Glaucoma Secondary to Anterior Uveitis: Comparison with Open Angle Glaucoma" Journal of Clinical Medicine 10, no. 18: 4231. https://doi.org/10.3390/jcm10184231
APA StyleLee, J.-Y., Kim, J.-H., La, T.-Y., & Choi, J.-A. (2021). Structure–Function Relationship and Vision-Related Quality of Life in Glaucoma Secondary to Anterior Uveitis: Comparison with Open Angle Glaucoma. Journal of Clinical Medicine, 10(18), 4231. https://doi.org/10.3390/jcm10184231