Abstract
Degenerative cervical myelopathy (DCM) is a progressive condition characterized by degeneration of osseocartilaginous structures within the cervical spine resulting in compression of the spinal cord and presentation of clinical symptoms. Compared to healthy controls (HCs), studies have shown DCM patients experience structural and functional reorganization in the brain; however, sex-dependent cortical differences in DCM patients remains largely unexplored. In the present study, we investigate the role of sex differences on the structure of the cerebral cortex in DCM and determine how structural differences may relate to clinical measures of neurological function. T1-weighted structural MRI scans were acquired in 85 symptomatic and asymptomatic patients with DCM and 90 age-matched HCs. Modified Japanese Orthopedic Association (mJOA) scores were obtained for patients. A general linear model was used to determine vertex-level significant differences in gray matter volume (GMV) between the following groups (1) male HCs and female HCs, (2) male patients and female patients, (3) male patients and male HCs, and (4) female patients and female HCs. Within patients, males exhibited larger GMV in motor, language, and vision related brain regions compared to female DCM patients. Males demonstrated a significant positive correlation between GMV and mJOA score, in which patients with worsening neurological symptoms exhibited decreasing GMV primarily across somatosensory and motor related cortical regions. Females exhibited a similar association, albeit across a broader range of cortical areas including those involved in pain processing. In sensorimotor regions, female patients consistently showed smaller GMV compared with male patients, independent of mJOA score. Results from the current study suggest strong sex-related differences in cortical volume in patients with DCM, which may reflect hormonal influence or differing compensation mechanisms.
1. Introduction
Degenerative cervical myelopathy (DCM) is a chronic condition involving the progressive deterioration of osseocartilaginous structures within the cervical spine resulting in compression of the spinal cord [1,2]. DCM often occurs as a consequence of age-related degeneration of the spine and is the most common spinal cord impairment in people over the age of 55 [3]. Spinal cord compression can lead to weakness in the upper limbs, loss of fine motor skills, and/or limb dyscoordination [1,4].
Chronic narrowing of the spinal canal from cervical spondylosis not only induces structural and functional alterations within the spinal cord, but also leads to changes within the brain as well [1]. Studies have shown that, when compared to healthy subjects, DCM patients exhibit significant reductions in cortical volume in somatosensory, motor, and cerebellar cortices [5,6,7]. Furthermore, patients demonstrate increased anatomical and functional connectivity within sensorimotor and pain related brain regions associated with patient symptom severity [8,9], possibly due to compensatory mechanisms resulting from spinal cord neuronal atrophy [5,6,8,9,10,11]. Although these previous studies have identified unique anatomic features associated with DCM, the potential of sex as a biological variable in this disease remains largely unexplored.
Numerous studies suggest sex hormones influence neuroprotective and inflammatory responses to neurotrauma. Following brain injury, damaged neurons release glutamate resulting in excess intracellular calcium, thus triggering several pathological events including loss of dendritic spines, axonal myelin damage, mitochondrial dysfunction, and neuronal cell death, further leading to glial cell activation and neuroinflammation [12]. Sex hormone receptors are expressed in neurons, glia, and immune cells; and directly influence cellular responses to central nervous system (CNS) injury [13]. Preclinical studies have demonstrated neuroprotective effects of testosterone, estrogen, and progesterone [12,13,14,15,16,17,18]. In traumatic brain injury (TBI), investigators reported significant sex-specific differences in overall brain damage, sex hormone receptor gene expression, and proinflammatory responses to hormone treatment [19,20,21]. A clinical study found serum sex hormone levels were altered after TBI; furthermore higher levels of testosterone were correlated with a higher probability of recovery [22]. Differences in sex hormones may influence a patient’s response to neurotrauma within the spinal cord [23], consequently affecting compensatory changes within the brain.
The investigation of sex as a biological variable has become a priority of the National Institutes of Health and other federal funding sources due to its potential impact on disease pathogenesis and treatment. In the present study, we sought to investigate the role of sex differences on brain structure in degenerative cervical myelopathy and to determine how those structural differences are related to measures of neurological function as measured using the modified Japanese Orthopedic Association (mJOA) score. We tested the hypotheses that (1) sex-dependent differences in GMV exist between patients and healthy controls in sensorimotor and pain related brain regions, and (2) there is a sex-dependent association between GMV and mJOA within sensorimotor cortices in patients with DCM.
2. Materials and Methods
2.1. Patient Population
A total of 85 patients were prospectively enrolled from 2016 to 2021 in a cross-sectional study including brain and spinal cord imaging as well as a neurological examination. Patients were recruited from an outpatient neurosurgery clinic and exhibited spinal cord compression with evidence of spinal cord deformation, mass effect, and no visible cerebrospinal fluid signal around the spinal cord at the site of maximal compression on MRI. Patients and healthy controls were excluded if they had neurological or neurocognitive impairment or significant psychiatric comorbidities. All patients signed Institutional Review Board-approved consent forms, and all analyses were performed in compliance with the Health Insurance Portability and Accountability Act (HIPAA). The patient cohort consisted of 52 males and 33 females ranging in age from 31 to 81 years with a mean age of 58.5 years for males and 58 years for females. All patients underwent brain and spinal cord imaging at UCLA. The modified Japanese Orthopedic Association (mJOA) score was used as a measure of neurological function [24]. The mJOA scoring scale ranges from 0 to 18, where lower scores represent a worse neurological impairment and an mJOA score of 18 represents no impairment of neurological function. Patient demographic data is summarized in Table 1.

Table 1.
Cohort demographics. Age is provided in mean years ± the standard deviation, minimum and maximum years, and p-value of Wilcoxon-Mann-Whitney test between age of males and females. The modified Japanese Orthopedic Association (mJOA) score is provided in mean score ± the standard deviation, minimum and maximum scores, and p-value of Wilcoxon-Mann-Whitney test between scores of males and females. * = HCs were categorized with an mJOA score of 18 due to their healthy neurological status.
2.2. Healthy Control Population
A total of 90 age-matched healthy control (HC) volunteers were included from the Parkinson’s Progression Markers Initiative (PPMI) data repository (www.ppmiinfo.org/data, access date 5 February 2021 [25]. (For up-to-date information on this database, visit www.ppmiinfo.org. PPMI—a public-private partnership—is funded by the Michael J. Fox Foundation for Parkinson’s Research and funding partners, including (list the full names of all of the PPMI funding partners found at www.ppmiinfo.org/fundingpartners) (access date 5 February 2021). Study investigators completed the PPMI Data Use and Biospecimen Use Agreements. The HC cohort used consisted of 53 males and 37 females ranging in age from 45 to 70 years with a mean age of 59.1 years. Male or female HCs between the ages of 45 and 70 with T1-weighted brain images were included. Exclusion criteria implemented by the PPMI investigators consisted of (1) significant neurological or psychiatric disorder at the time of study participation, (2) first degree relative with idiopathic Parkinson’s Disease, (3) a Montreal Cognitive Assessment (MoCA) score of 26 or less, (4) women who are pregnant, planning to become pregnant, or lactating at time of study, (5) use of medication that may interfere with dopamine transporter SPECT imaging, and (6) use of investigational drug or device within 60 days prior to study participation [25]. Due to the above exclusion criteria, the healthy control subjects included in this study were categorized as neurologically asymptotic and assigned an mJOA score of 18. HC demographic data was also summarized in Table 1.
2.3. MR Imaging Acquisition
For the patient cohort, high-resolution 1 mm 3-dimensional (3D) T1-weighted structural MRIs were acquired on a 3T MR scanner (Siemens Prisma or Trio; Siemens Healthcare, Erlangen, Germany) using a 3D magnetization-prepared rapid gradient-echo (MPRAGE) sequence in either the coronal, sagittal, or axial orientation, with a repetition time (TR) of 2300 to 2500 ms, a minimum echo time (TE), an inversion time (TI) of 900 to 945 ms, a flip angle of 9° to 15°, FOV = 240 × 320 mm and matrix size of 240 × 320, slice thickness = 1 mm. For the HC cohort, high-resolution 3-dimensional (3D) T1-weighted structural MRIs were acquired on a 3T MR scanner using a 3D T1-weighted sequence (e.g., MPRAGE or SPGR) with a slice thickness = 1.5 mm or less with no interslice gap. All other parameters including repetition (TR) and echo (TE) time were specific to site scanner manufacturer recommendations for a T1-weighted, 3D sequence.
2.4. Image Processing and Analysis
Cortical segmentation and computation of GMV were performed using FreeSurfer (https://surfer.nmr.mgh.harvard.edu/fswiki, access date 1 May 2021 on the T1-weighted images described above [26]. Processed brain surfaces were smoothed with a full-width half-maximum of 10 mm, then registered to a standard space defined by the Desikan-Killiany-Tourville (DKT) atlas [27]. Whole-brain cortical volume analysis was completed using FreeSurfer. A general linear model (GLM) was used to determine vertex-level significant differences in GMV between the following groups: (1) male HCs and female HCs, (2) male patients and female patients, (3) male patients and male HCs, and (4) female patients and female HCs. To control for the influence of age on GMV, age was included as a covariate in morphometric analyses [28,29]. When comparing GMV between male patients and female patients, both age and mJOA score were included as covariates. To evaluate the association between sex, cortical volume, and neurological deficit, a GLM was used to determine vertex-level significant correlations between GMV and mJOA score in (A) male patients and HCs, and (B) female patients and HCs. Following the overlapping of significant clusters observed in the male group and significant clusters observed in the female group, we identified common cortical regions showing significant correlations between GMV and mJOA in both male and female groups. Additionally, average GMVs for each individual subject were extracted from the mutually significant clusters and corrected for subject age. In the male patient group and the female patient group, linear regression analyses were performed between age corrected average GMV and mJOA score within sensorimotor and pain related brain regions. In addition, linear regression analyses were used to identify differences in GMV and mJOA slope and intercept between male and female patients. Healthy controls were excluded in regression analyses. Regression analyses were performed using MATLAB (Release 2018a, MathWorks, Natick, MA, USA) and GraphPad Prism software (Version 7.0c GraphPad Software, San Diego, CA, USA). The vertex-wise level of significance was set at p < 0.05, with multiple comparisons correction performed by using Monte Carlo permutations with a significance level of p < 0.05.
3. Results
3.1. Subject Characteristics
As summarized in Table 1, the patient cohort consisted of 52 males with a mean age of 58.5 ± 11.6 years and 33 females with a mean age of 58.0 ± 10.7 years. There was no significant difference in age between male patients and female patients (Wilcoxon-Mann-Whitney test, p = 0.8068). The mJOA scores within the cohort ranged from 9 to 18 with a mean score of 15.0 ± 2.7 for male patients and 15.6 ± 2.4 for female patients. Of the 85 total study patients, 19 had asymptomatic spinal cord compression (mJOA = 18), 38 presented with mild myelopathy (15 mJOA 17), 19 exhibited moderate myelopathy (12 mJOA 14), and 9 patients were categorized with severe myelopathy (mJOA 11). No significant difference in mJOA score was observed between male and female patients (Wilcoxon-Mann-Whitney test, p = 0.3885).
The HC cohort consisted of 53 males with a mean age of 58.7 ± 6.4 years and 37 females with a mean age of 59.8 ± 6.3 years. There was no significant difference in age between male and female HCs (Wilcoxon-Mann-Whitney test, p = 0.4076). Additionally, no significant difference in age was found between the patient cohort and the HC cohort (Mann-Whitney test, p = 0.9206). Due to lack of neurological impairment, all HC participants had an mJOA score of 18.
3.2. Sex-Dependent Cortical Volumetric Differences
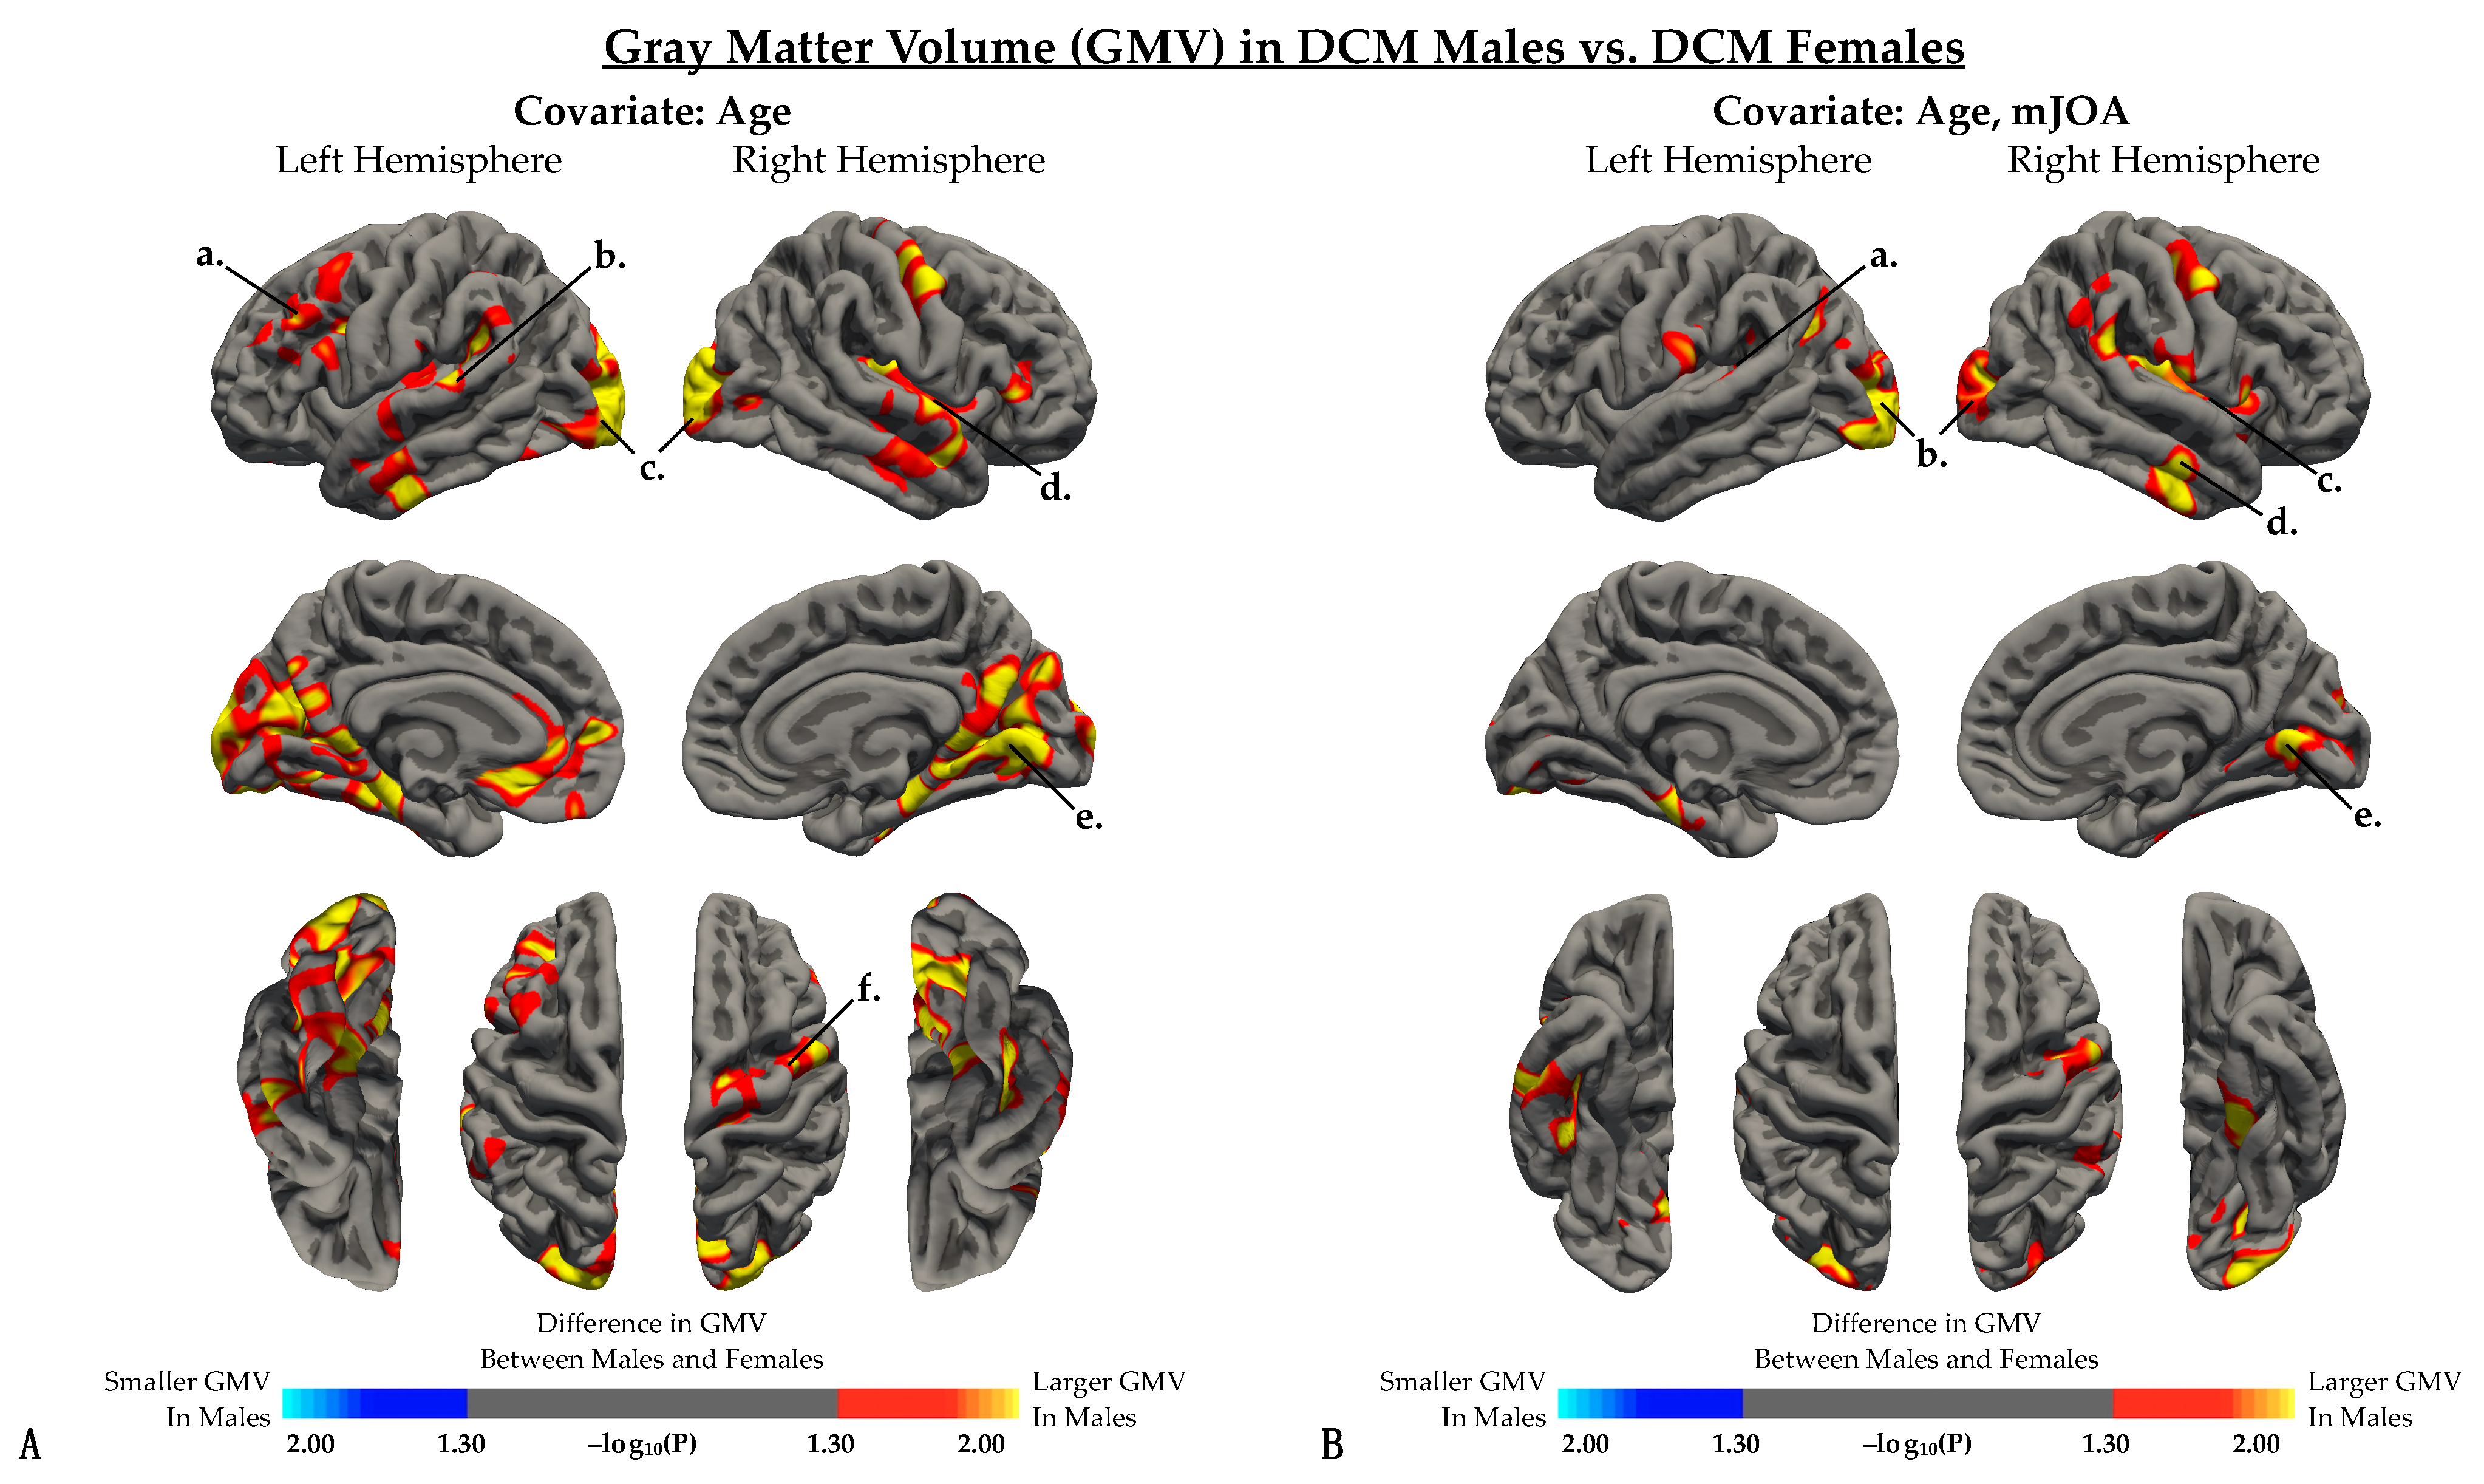
Results from the whole-brain cortical volume analysis revealed no significant difference in GMV between males and females within the HC cohort, but significant differences in GMV between male and female within patients with DCM. We observed that male DCM patients compared to female patients (Figure 1A, Table 2) exhibited significantly larger GMV in the caudal middle frontal, superior temporal, transverse temporal, and lingual gyrus of the left hemisphere, as well as in the precentral gyrus, insula, and lingual gyrus of the right hemisphere. Additionally, when controlling for mJOA, male DCM patients demonstrated significantly larger GMV than female patients in the bilateral lateral occipital gyri, left superior temporal gyrus, right insula, right middle temporal gyrus, and right lingual gyrus (Figure 1B, Table 2).

Figure 1.
Whole brain analysis comparing gray matter volume (GMV) between DCM males and DCM females after regressing out the effects of (A) age and (B) both age and mJOA score. (A,B) Red-yellow color denotes larger GMV in males, while blue-light blue color denotes smaller GMV in males compared to females. (A) When controlling for age, regions with significant differences in GMV were identified in the a, left rostral middle frontal gyrus; b, left superior temporal gyrus; c, bilateral lateral occipital cortex; d, right insular cortex; e, right lingual gyrus; and f, right precentral gyrus. (B) When controlling for both age and mJOA, regions with significant differences in GMV were identified in the a, left superior temporal gyrus; b, bilateral lateral occipital cortex; c, right insular cortex; d, right middle temporal gyrus; and e, right lingual gyrus. Significant clusters were determined by thresholding based on statistical significance (p < 0.05).
Table 2.
Summary of regions showing significant difference in gray matter volume (GMV) between DCM males and DCM females.
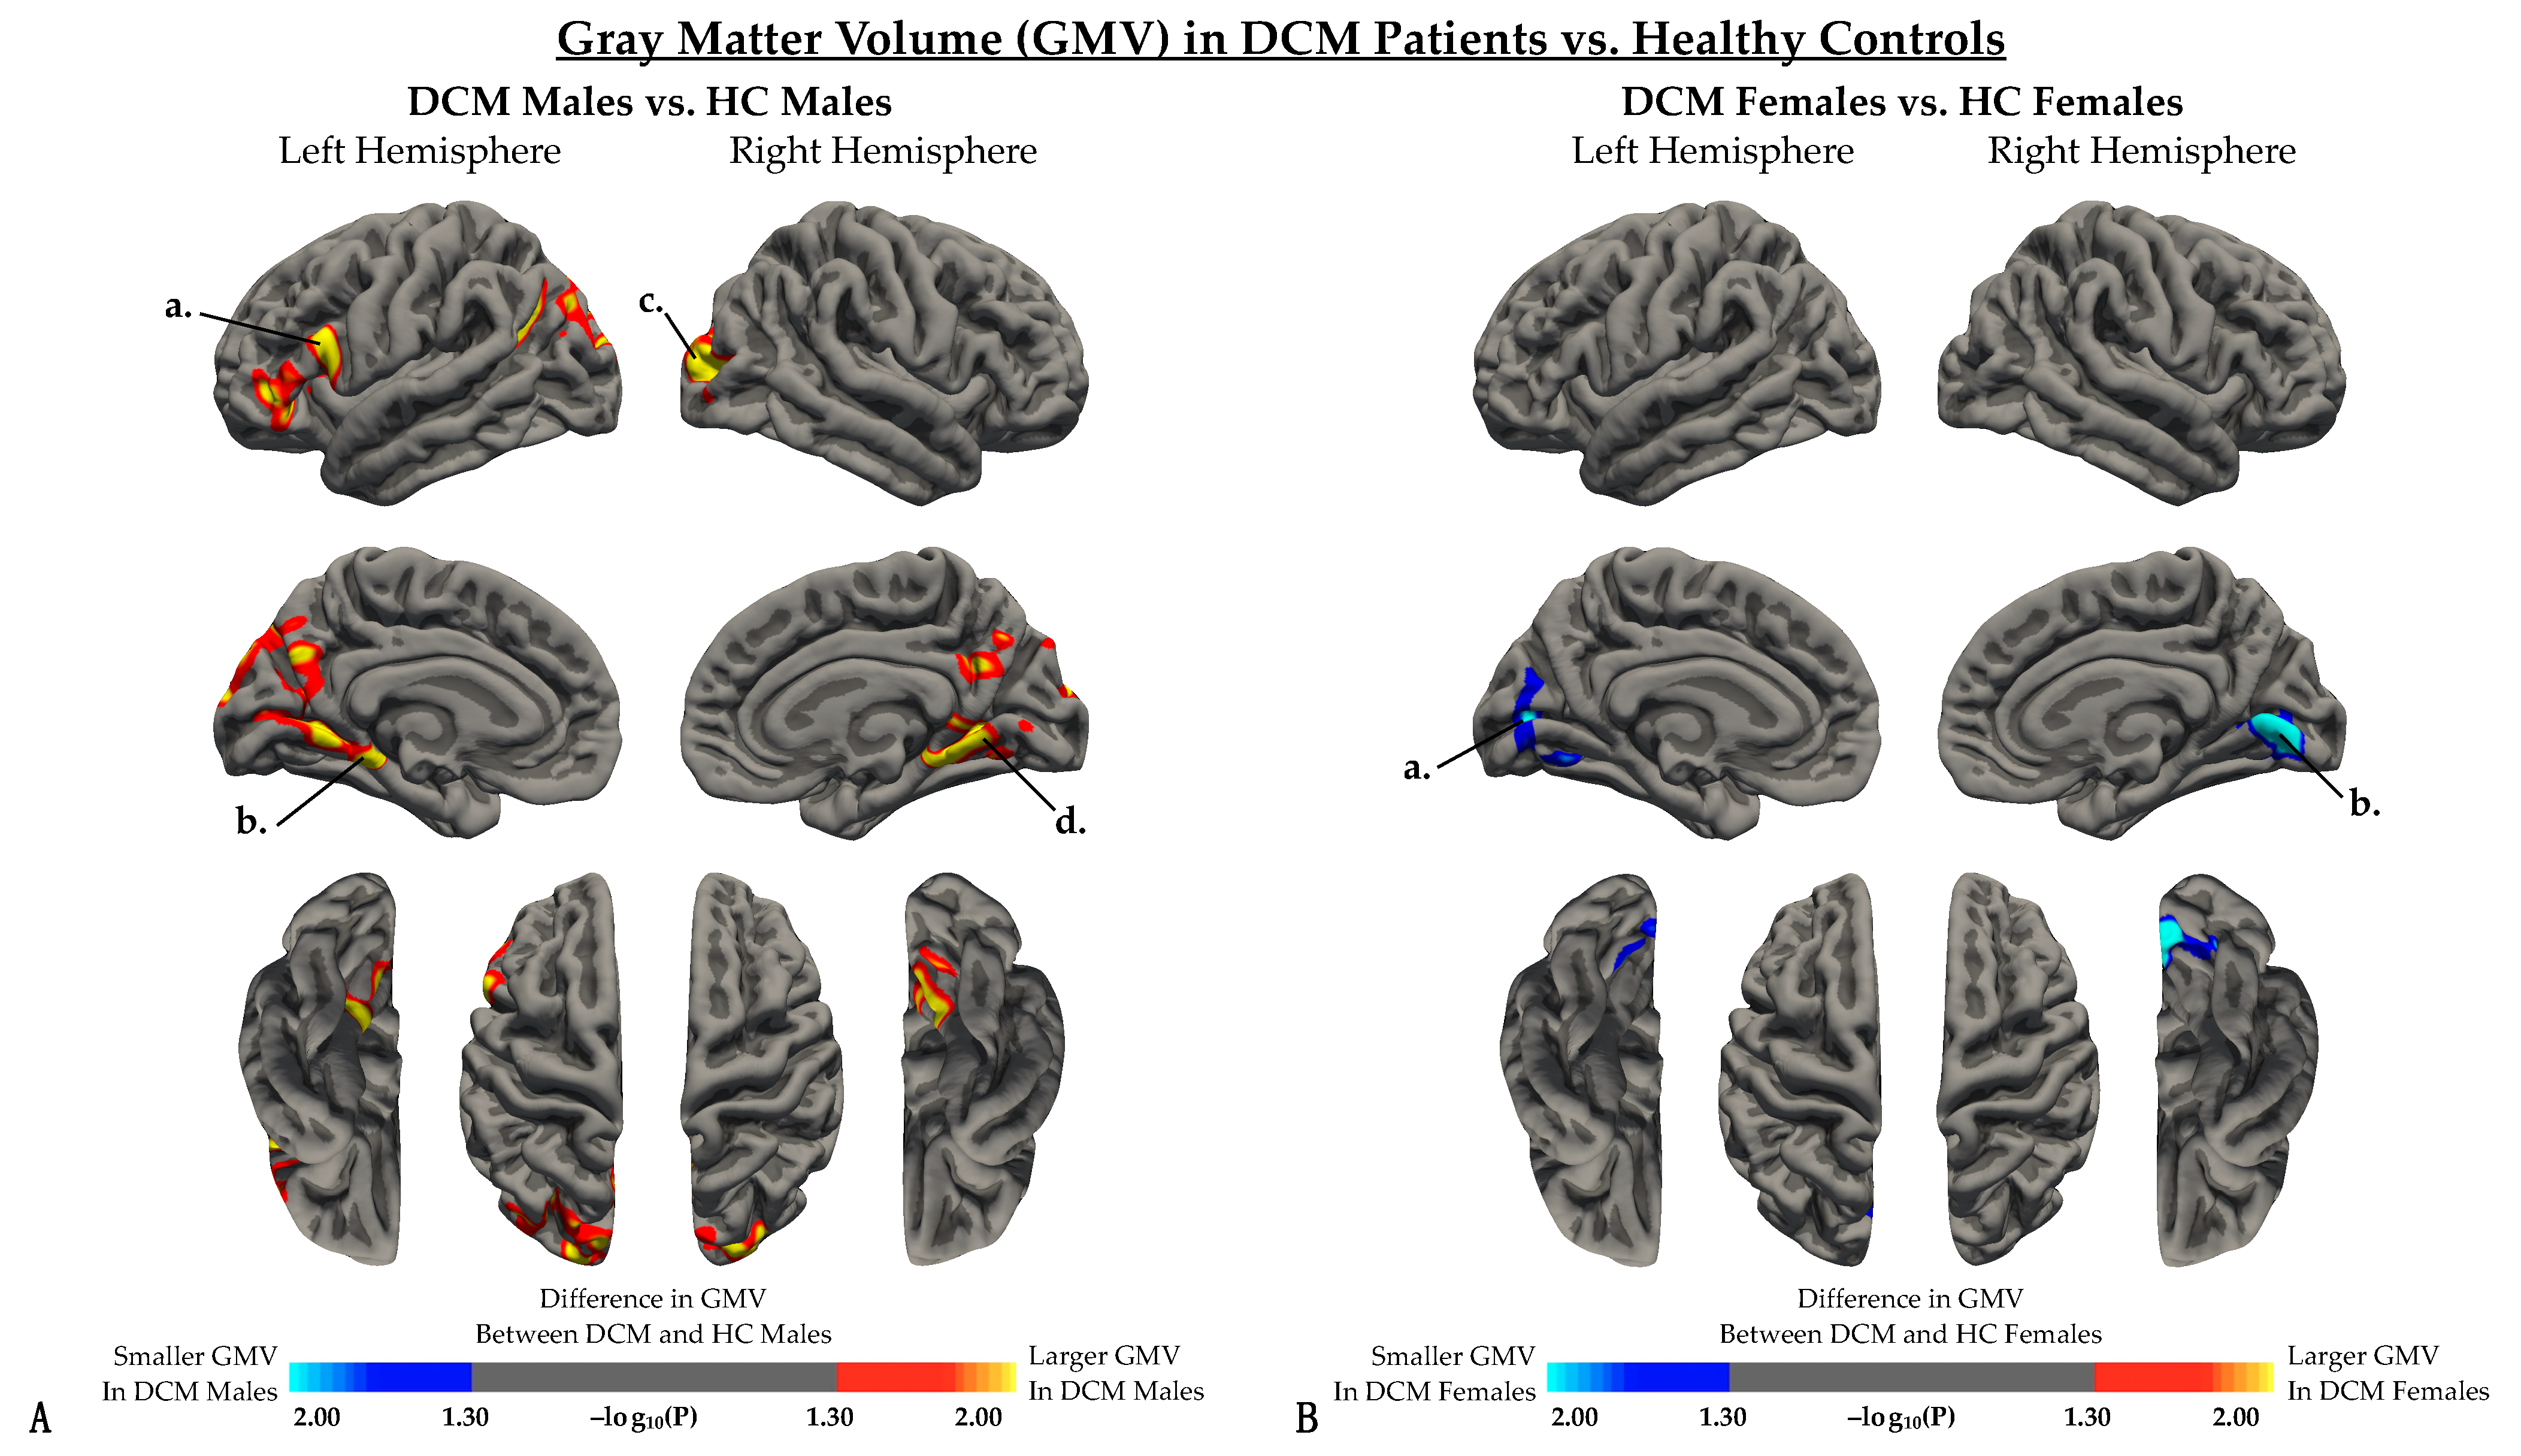
Male DCM patients displayed significantly larger gray matter volume (GMV) in the left parahippocampal gyrus, left paropercularis, right lateral occipital cortex, and right lingual gyrus compared with male HCs (Figure 2A, Table 3). On the contrary, female DCM patients exhibited significantly smaller GMV compared with female HCs, specifically in the left pericalcarine cortex and right lingual gyrus (Figure 2B, Table 3).

Figure 2.
Whole brain analysis comparing gray matter volume (GMV) between DCM patients and healthy controls when regressing out the effect of age in (A) males and (B) females. (A) Red-yellow color denotes larger GMV in DCM males, while blue-light blue color denotes smaller GMV in DCM males compared to HC males. When controlling for age, regions with significant differences in GVM were identified in the a, left parsopercularis; b, left parahippocampal gyrus; c, right lateral occipital cortex; and d, left lingual gyrus. (B) Red-yellow color denotes larger GMV in DCM females, while blue-light blue color denotes smaller GMV in DCM males compared to HC females. When controlling for both age and mJOA, regions with significant differences in GMV were identified in the a, left pericalcarine cortex; and b, right lingual gyrus. Significant clusters were determined by thresholding based on statistical significance (p < 0.05).
Table 3.
Summary of regions showing significant difference in gray matter volume (GMV) between patients and healthy controls.
3.3. Interaction between Cortical Volume and mJOA Scores
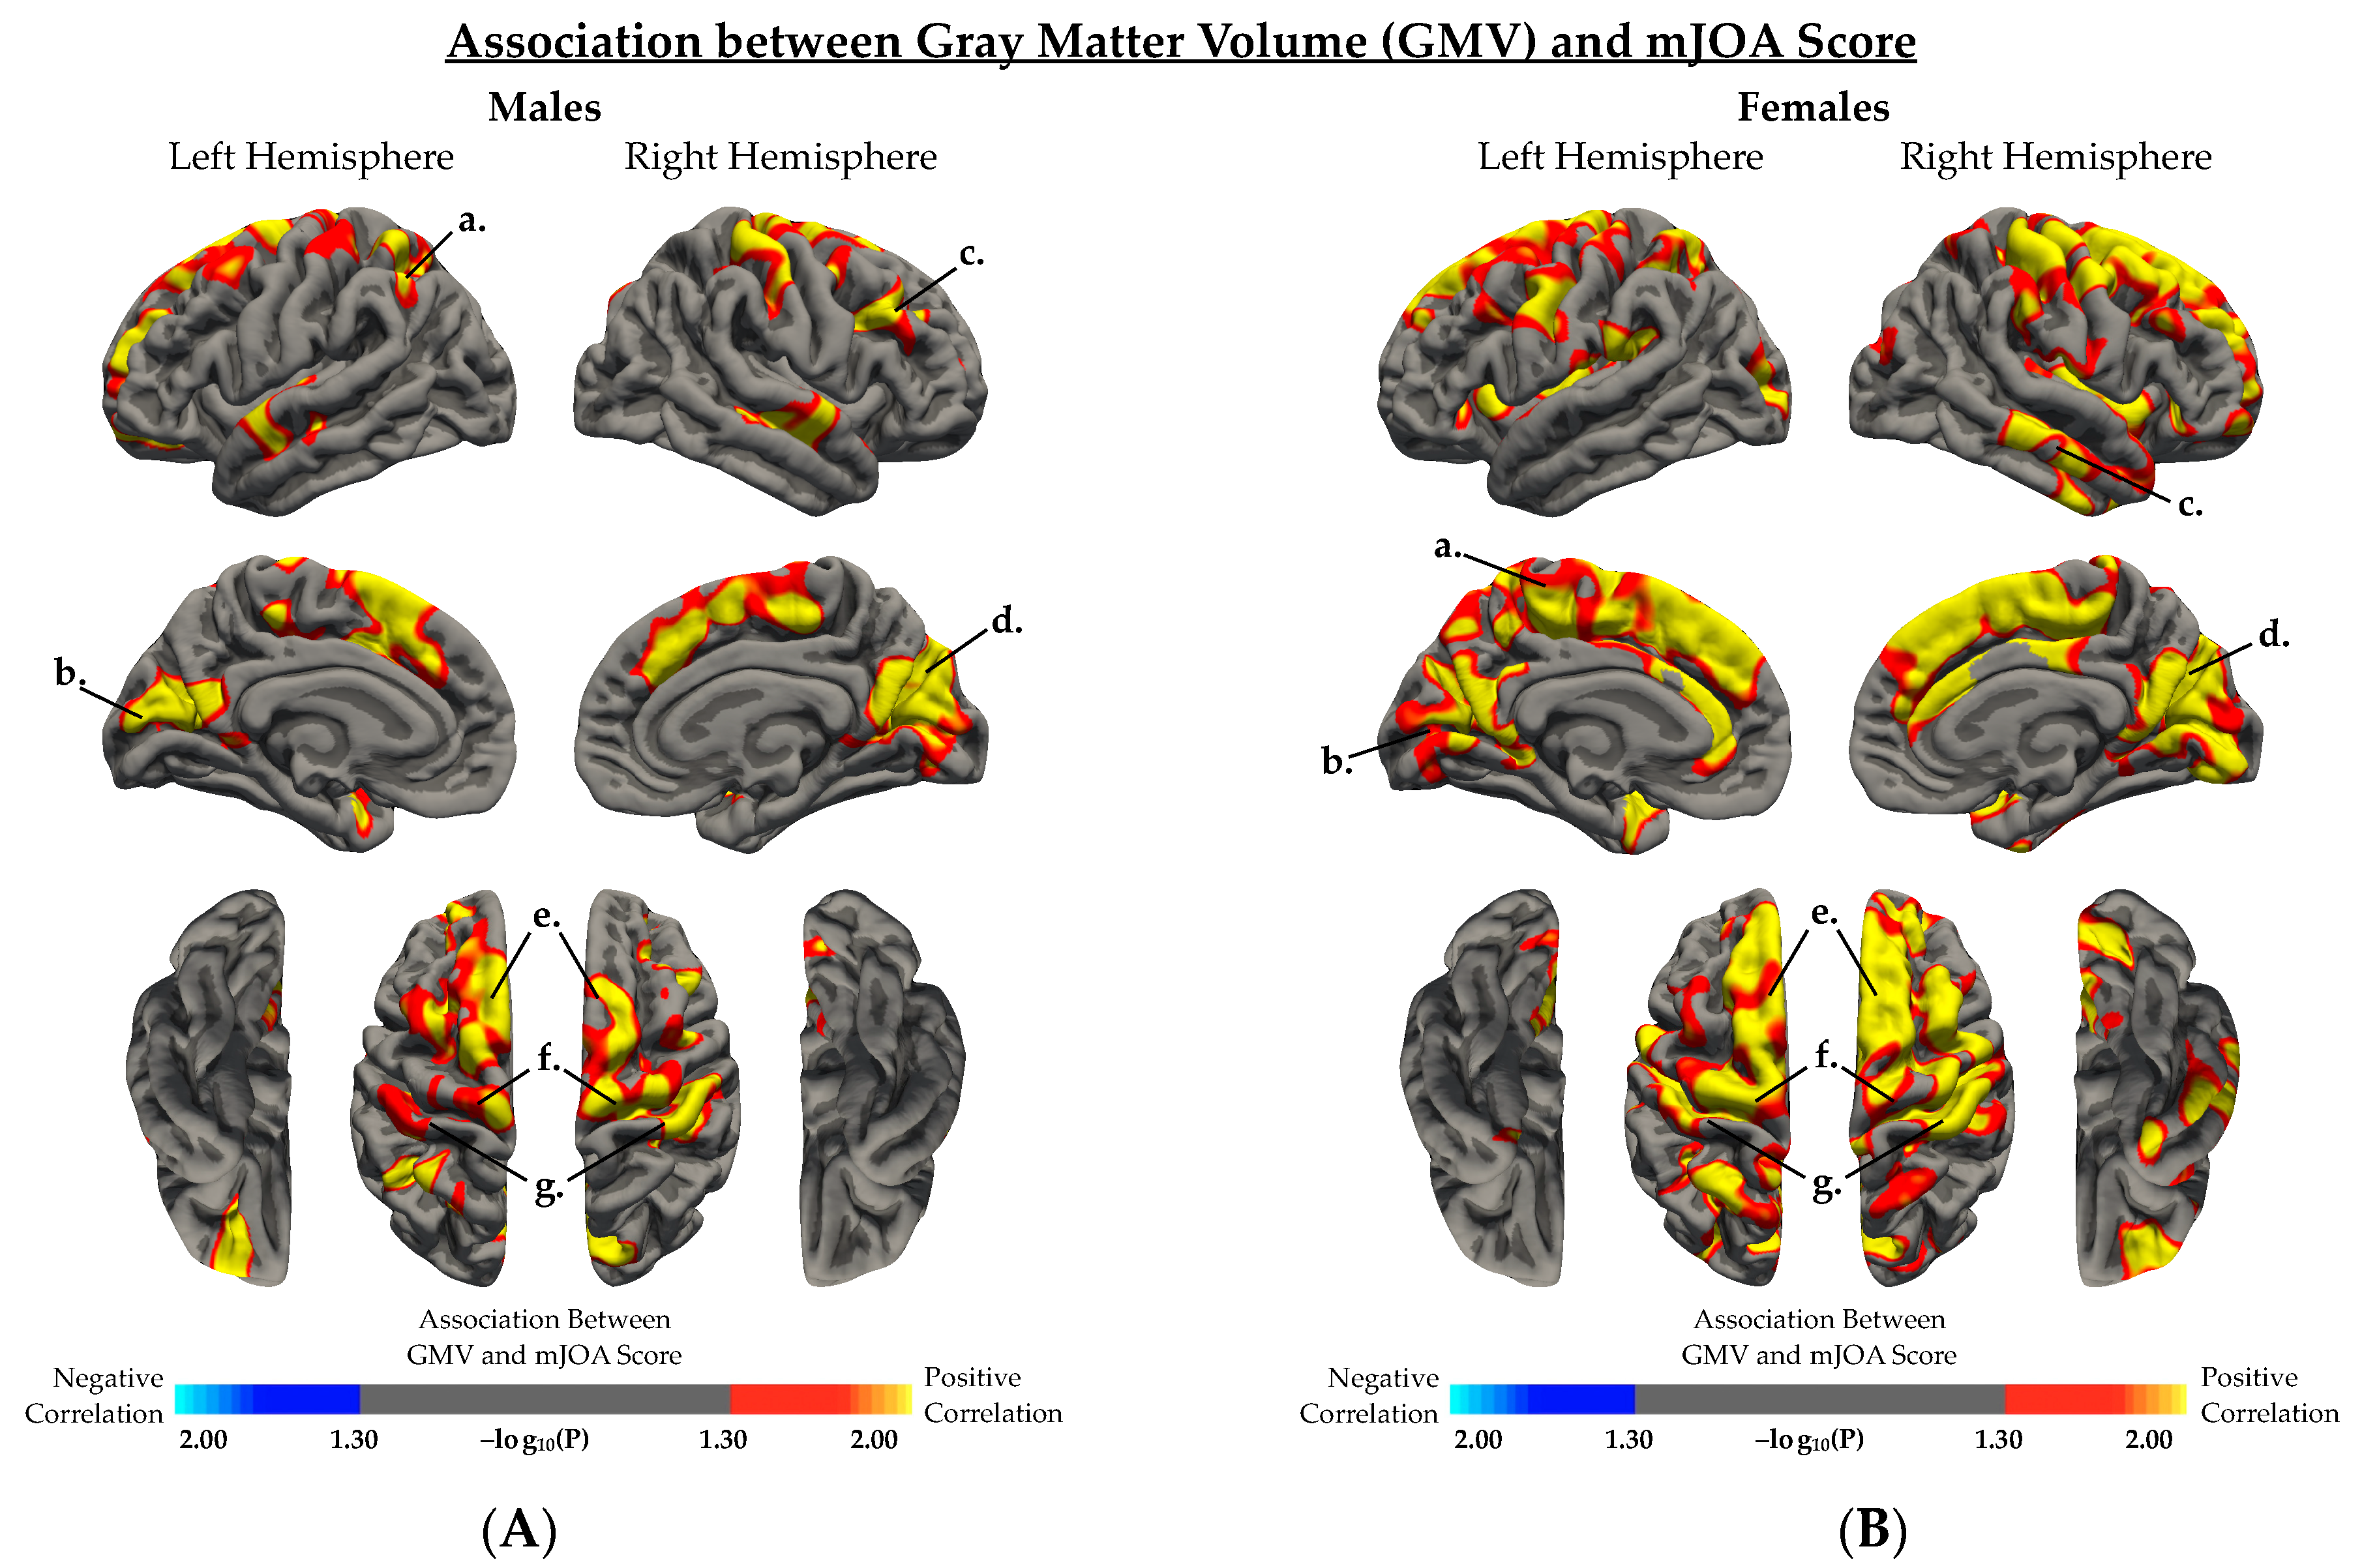
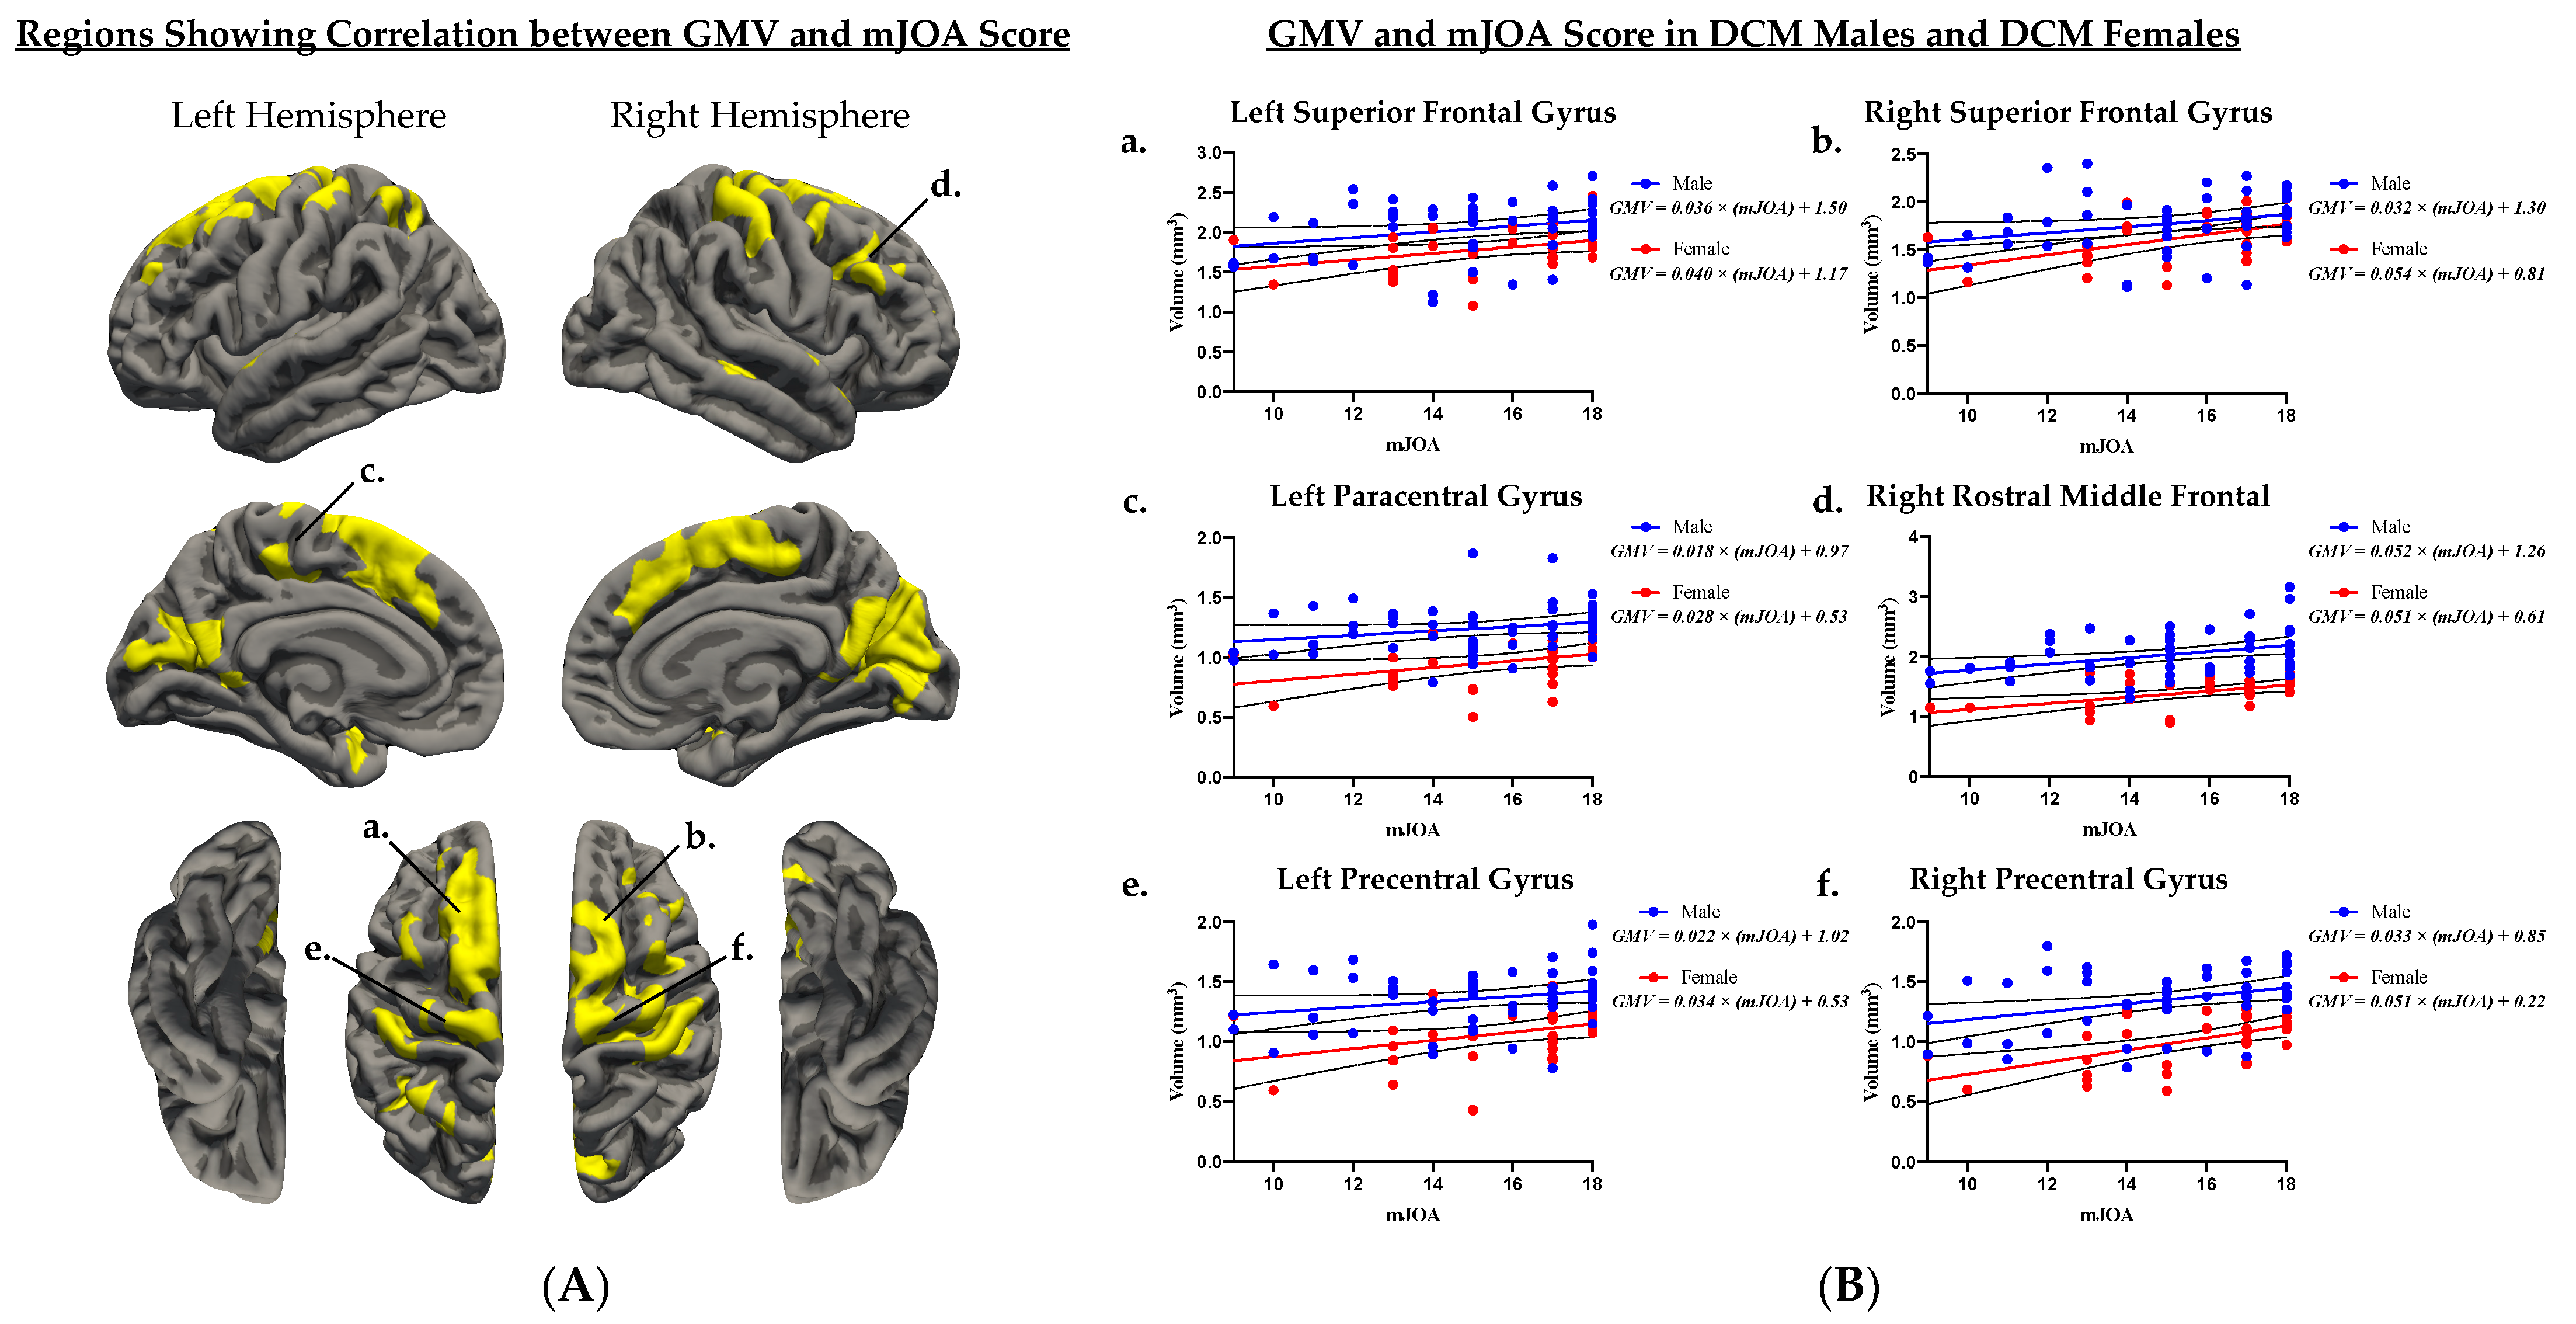
When examining the effect of sex on the association between GMV and mJOA score (Figure 3, Table 4), both males (Figure 3A) and females (Figure 3B) demonstrated a significant positive correlation between GMV and mJOA score across multiple cortical regions. Female subjects demonstrated associations between GMV and mJOA in similar regions to male subjects, but regions in female subjects appeared to extend across a broader area of the brain perhaps suggesting more widespread cortical changes in females. Mutually significant regions with a positive correlation between GMV and mJOA common for both males and females are illustrated in Figure 4A. Within DCM patients only (excluding HCs), males and females demonstrated significant correlations between age corrected GMV and mJOA within similar regions, but the degree of change (i.e., slope of the regression line) and overall GMV (i.e., intercept of regression line) were different between males and females within the left superior frontal (p = 0.0013), right superior frontal (p = 0.0301), left paracentral (p < 0.0001), right rostral middle frontal (p < 0.0001), left precentral (p < 0.0001), and right precentral (p < 0.0001) gyri, as well as the anterior, isthmus, and posterior cingulate cortex, the insula, and the precuneus (Figure 4B, Table 5).

Figure 3.
Association between gray matter volume (GMV) and mJOA score in (A) DCM and HC males, and (B) DCM and HC females, regressing out the effect of age. (A,B) Red-yellow color indicated a positive association between GMV and mJOA score, while blue-light blue color indicated negative association between GMV and mJOA score. (A) In males, regions with significant association between GMV and mJOA were identified in several regions including the a, left inferior parietal cortex; b, left pericalcarine cortex; c, right rostral middle frontal gyrus; d, right cuneus; e, bilateral superior frontal gyrus; f, bilateral precentral gyrus; and g, bilateral postcentral gyrus. (B) In females, regions with significant association between GMV and mJOA were identified in several regions including the a, left paracentral gyrus; b, left pericalcarine and lingual gyrus; c, right middle temporal gyrus; d, right cuneus and pericalcarine cortex; e, bilateral superior frontal gyrus; f, bilateral precentral gyrus; and g, bilateral postcentral gyrus. Significant clusters were determined by thresholding based on statistical significance (p < 0.05).
Table 4.
Summary of regions showing significant positive correlation between gray matter volume (GMV) and mJOA score.

Figure 4.
(A) Cortical regions with significant positive association between gray matter volume (GMV) and mJOA score in both males and females. (A) Age corrected average GMV was extracted from mutually significant cortical regions and (B) are plotted against patient mJOA score in DCM males and DCM females. ROI regions include the a, left superior frontal gyrus; b, right superior frontal gyrus; c, left paracentral gyrus; d, right rostral middle frontal gyrus; e, left precentral gyrus; and f, right precentral gyrus. (B) Age corrected average GMV and mJOA plots include simple linear regression for male patients (blue line) and female patients (red line). The light blue region denotes the 95% confidence interval for male patients and the pink region denotes the 95% confidence interval for female patients.
Table 5.
Regression analyses quantifying the association between average gray matter volume (GMV) and mJOA score for regions found significant in both sexes. LH denotes left hemisphere and RH denotes right hemisphere. The table includes the following: mutually significant anatomical region, surface area of cortical region of interest (ROI), p-value evaluating whether male and female linear fits are significantly different in slope and y-intercept, p-value evaluating whether a linear relationship occurs between average GMV and mJOA score in males, p-value evaluating whether a linear relationship occurs between average GMV and mJOA score in females, goodness of fit for males, and goodness of fit for females.
4. Discussion
The present study demonstrates significant sex-related differences in cortical volume in patients with degenerative cervical myelopathy. Prior to this investigation, the role of sex on brain structure in DCM remained largely understudied. Our findings may foster further investigation and understanding of the influence of sex and sex hormones on supraspinal plasticity following spinal cord injury.
4.1. Cortical Volumetric Differences in HCs Are Not Sex Dependent
The current study found no statistically significant differences in GMV between HC males and females. Literature investigating sex-related differences in cortical morphometry of the healthy brain remains controversial, with some studies reporting significant sex-related differences in GMV and others citing no significant difference [30,31,32,33]. To address these inconsistencies, Sanchis-Segura et al. examined how the number, size, and direction of sex differences in regional GMV vary depending on how total intercranial volume (TIV) is statistically controlled; and they concluded that when TIV effects are properly accounted for, sex differences in GMV are relatively small in healthy adults [34].
4.2. Sex-Dependent Cortical Volumetric Differences in Patients
When investigating volumetric differences within patients, we found male patients exhibited larger GMV in various regions compared to female patients, including motor, language, and pain related cortices. Previous studies have revealed DCM patients exhibit functional and morphological alterations within primary motor and sensorimotor cortices when compared to age-matched HCs [11,35,36]. We suspect patients experience alterations in such brain regions due to hormonal, neuroinflammatory, and neuronal compensatory differences between sexes [23]. Preclinical studies of spinal cord injury (SCI), stroke, and traumatic brain injury (TBI) have shown sex steroids, particularly 17-estradiol, estrogen, progesterone, and testosterone, can provide neuroprotective, pro-myelination, and anti-inflammatory effects resulting in improved tissue sparing and motor function [12,13,14,15,16,17,18].
In humans with acute traumatic SCI, administration of progesterone and vitamin D was associated with better functional recovery and outcome [17]. Interestingly, preclinical studies have shown testosterone treatment also provides neuroprotective benefits following SCI, but in the clinical setting about 43–57% of male patients experience low levels of testosterone following SCI, and low levels of testosterone were associated with severity of injury [14,22,37,38]. Sex-dependent volumetric differences observed within DCM patients and between patients and HCs may be driven by variations in hormone levels. In the male group, DCM patients exhibited larger GMV in regions involved in memory, vision, and language. Female patients exhibited fewer alterations than male patients when compared to healthy counterparts, a possible indication of the neuroprotective effects of normal or elevated progesterone and estrogen levels.
Furthermore, significant positive associations between GMV and mJOA scores were found in both male and female groups primarily across somatosensory and motor related cortical regions. Such findings are consistent with previous reports in which cortical alterations and cerebral reorganization were correlated with neurological function, proposing a compensatory relationship between cortical alterations and symptom progression in patients with cervical spondylosis [5,10,35]. A positive association between GMV and mJOA appears to confirm that patients with worsening neurological symptoms exhibit decreasing GMV across sensorimotor related cortices. Females exhibited an association between GMV and mJOA across a broader range of brain regions compared with male patients, including regions believed to be involved in pain processing [39]. Independent of mJOA, female patients consistently showed lower GMV than males within various regions involved in sensorimotor function. Our results reflect the possible influence of sex hormones on cerebral compensatory mechanisms and disease progression between males and females with DCM. Based on these novel preliminary studies, future investigations that evaluate supraspinal microstructural and functional alterations are warranted and will provide additional insight into the role of sex hormones in DCM neural plasticity.
4.3. Limitations and Future Direction
Although our patient and healthy control cohorts were well matched in terms of age and numbers of male and female subjects, it is important to note the healthy control subjects were acquired retrospectively from an image repository. Therefore, collection of age- and gender-matched HCs with brain and spinal cord imaging and mJOA testing is warranted for validating our findings and future studies. Furthermore, collection and inclusion of additional clinical and demographic information, such as handedness, disease duration, and medical comorbidities, will contribute to analyses of cortical structure in future studies. Additionally, measurement and assessment of serum sex hormones in relation to sex and neurological function would greatly benefit our understanding of the mechanisms underlying sexual dimorphism in DCM.
5. Conclusions
To the best of our knowledge this is the first study to investigate sex differences in cortical volume in patients with DCM. Results suggest males with DCM exhibit significantly larger GMV compared to female DCM patients in various brain regions, and DCM patients exhibit significant sex-related differences in the association between GMV and neurological function, particularly in brain areas involved in sensorimotor function.
Author Contributions
Conceptualization, B.M.E. and L.T.H.; methodology, B.M.E., C.W. and T.C.O.; software, C.W.; validation, N.S. and L.T.H.; formal analysis, T.C.O. and C.W.; investigation, T.C.O.; resources, L.T.H.; writing—original draft preparation, T.C.O.; writing—review and editing, T.C.O., C.W., L.T.H. and B.M.E.; visualization, T.C.O.; supervision, B.M.E. and L.T.H.; funding acquisition, B.M.E. and L.T.H. All authors have read and agreed to the published version of the manuscript.
Funding
This research was funded by the National Institutes of Health (NIH) and the National Institute of Neurological Disorders and Stroke (NINDS), grand number R01NS078494.
Institutional Review Board Statement
The study was conducted according to the guidelines of the Declaration of Helsinki and approved by the Institutional Review Board of the University of California, Los angeales (#11-001876 approved 12 September 2020).
Informed Consent Statement
Informed consent was obtained from all subjects involved in the study.
Data Availability Statement
Data will be made available upon request from investigators.
Acknowledgments
We kindly thank the patients and their families for participating in our study. We also thank the Parkinson’s Progression Markers Initiative (PPMI) for providing imaging data for our healthy control cohort.
Conflicts of Interest
The authors declare no conflict of interest.
References
- Theodore, N. Degenerative Cervical Spondylosis. N. Engl. J. Med. 2020, 383, 159–168. [Google Scholar] [CrossRef]
- Tracy, J.A.; Bartleson, J.D. Cervical Spondylotic Myelopathy. Neurology 2010, 16, 176–187. [Google Scholar] [CrossRef] [PubMed]
- Binder, A.I. Cervical spondylosis and neck pain. BMJ 2007, 334, 527–531. [Google Scholar] [CrossRef] [PubMed] [Green Version]
- Karadimas, S.K.; Erwin, W.M.; Ely, C.G.; Dettori, J.R.; Fehlings, M. Pathophysiology and Natural History of Cervical Spondylotic Myelopathy. Spine 2013, 38, S21–S36. [Google Scholar] [CrossRef]
- Woodworth, D.C.; Holly, L.T.; Mayer, E.A.; Salamon, N.; Ellingson, B.M. Alterations in Cortical Thickness and Subcortical Volume are Associated with Neurological Symptoms and Neck Pain in Patients with Cervical Spondylosis. Neurosurgery 2018, 84, 588–598. [Google Scholar] [CrossRef] [PubMed] [Green Version]
- Jütten, K.; Mainz, V.; Schubert, G.A.; Gohmann, R.F.; Schmidt, T.; Ridwan, H.; Clusmann, H.; Mueller, C.A.; Blume, C. Cortical volume reductions as a sign of secondary cerebral and cerebellar impairment in patients with degenerative cervical myelopathy. NeuroImage Clin. 2021, 30, 102624. [Google Scholar] [CrossRef] [PubMed]
- Yang, Q.; Xu, H.; Zhang, M.; Wang, Y.; Li, D. Volumetric and functional connectivity alterations in patients with chronic cervical spondylotic pain. Neuroradiology 2020, 62, 995–1001. [Google Scholar] [CrossRef]
- Holly, L.T.; Wang, C.; Woodworth, D.C.; Salamon, N.; Ellingson, B.M. Neck disability in patients with cervical spondylosis is associated with altered brain functional connectivity. J. Clin. Neurosci. 2019, 69, 149–154. [Google Scholar] [CrossRef]
- Woodworth, D.C.; Holly, L.T.; Salamon, N.; Ellingson, B.M. Resting-State Functional Magnetic Resonance Imaging Connectivity of the Brain Is Associated with Altered Sensorimotor Function in Patients with Cervical Spondylosis. World Neurosurg. 2018, 119, e740–e749. [Google Scholar] [CrossRef]
- Wang, C.; Laiwalla, A.; Salamon, N.; Ellingson, B.M.; Holly, L.T. Compensatory brainstem functional and structural connectivity in patients with degenerative cervical myelopathy by probabilistic tractography and functional MRI. Brain Res. 2020, 1749, 147129. [Google Scholar] [CrossRef]
- Holly, L.T.; Dong, Y.; Albistegui-DuBois, R.; Marehbian, J.; Dobkin, B. Cortical reorganization in patients with cervical spondylotic myelopathy. J. Neurosurg. Spine 2007, 6, 544–551. [Google Scholar] [CrossRef]
- Kövesdi, E.; Szabó-Meleg, E.; Abrahám, I.M. The Role of Estradiol in Traumatic Brain Injury: Mechanism and Treatment Potential. Int. J. Mol. Sci. 2020, 22, 11. [Google Scholar] [CrossRef]
- Elkabes, S.; Nicot, A. Sex steroids and neuroprotection in spinal cord injury: A review of preclinical investigations. Exp. Neurol. 2014, 259, 28–37. [Google Scholar] [CrossRef]
- Byers, J.S.; Huguenard, A.; Kuruppu, D.; Liu, N.-K.; Xu, X.-M.; Sengelaub, D.R. Neuroprotective effects of testosterone on motoneuron and muscle morphology following spinal cord injury. J. Comp. Neurol. 2012, 520, 2683–2696. [Google Scholar] [CrossRef] [PubMed] [Green Version]
- Sengelaub, D.R.; Han, Q.; Liu, N.-K.; Maczuga, M.A.; Szalavari, V.; Valencia, S.A.; Xu, X.-M. Protective Effects of Estradiol and Dihydrotestosterone following Spinal Cord Injury. J. Neurotrauma 2018, 35, 825–841. [Google Scholar] [CrossRef] [PubMed]
- Zendedel, A.; Mönnink, F.; Hassanzadeh, G.; Zaminy, A.; Ansar, M.M.; Habib, P.; Slowik, A.D.; Kipp, M.; Beyer, C. Estrogen Attenuates Local Inflammasome Expression and Activation after Spinal Cord Injury. Mol. Neurobiol. 2017, 55, 1364–1375. [Google Scholar] [CrossRef] [PubMed]
- Aminmansour, B.; Asnaashari, A.; Rezvani, M.; Ghaffarpasand, F.; Noorian, S.M.A.; Saboori, M.; Abdollahzadeh, P. Effects of progesterone and vitamin D on outcome of patients with acute traumatic spinal cord injury; a randomized, double-blind, placebo controlled study. J. Spinal Cord Med. 2015, 39, 272–280. [Google Scholar] [CrossRef] [PubMed] [Green Version]
- Garcia-Ovejero, D.; González, S.; Paniagua-Torija, B.; Lima, A.; Molina-Holgado, E.; De Nicola, A.F.; Labombarda, F. Progesterone Reduces Secondary Damage, Preserves White Matter, and Improves Locomotor Outcome after Spinal Cord Contusion. J. Neurotrauma 2014, 31, 857–871. [Google Scholar] [CrossRef] [PubMed] [Green Version]
- Wagner, A.K.; McCullough, E.H.; Niyonkuru, C.; Ozawa, H.; Loucks, T.; Dobos, J.A.; Brett, C.A.; Santarsieri, M.; Dixon, C.E.; Berga, S.L.; et al. Acute Serum Hormone Levels: Characterization and Prognosis after Severe Traumatic Brain Injury. J. Neurotrauma 2011, 28, 871–888. [Google Scholar] [CrossRef] [Green Version]
- Gölz, C.; Kirchhoff, F.P.; Westerhorstmann, J.; Schmidt, M.; Hirnet, T.; Rune, G.M.; Bender, R.A.; Schäfer, M.K. Sex hormones modulate pathogenic processes in experimental traumatic brain injury. J. Neurochem. 2019, 150, 173–187. [Google Scholar] [CrossRef]
- Sarkaki, A.; Haddad, M.K.; Soltani, Z.; Shahrokhi, N.; Mahmoodi, M. Time- and Dose-Dependent Neuroprotective Effects of Sex Steroid Hormones on Inflammatory Cytokines after a Traumatic Brain Injury. J. Neurotrauma 2013, 30, 47–54. [Google Scholar] [CrossRef]
- Zhong, Y.H.; Wu, H.Y.; He, R.H.; Zheng, B.E.; Fan, J.Z. Sex Differences in Sex Hormone Profiles and Prediction of Consciousness Recovery After Severe Traumatic Brain Injury. Front. Endocrinol. 2019, 10, 261. [Google Scholar] [CrossRef]
- Stewart, A.N.; MacLean, S.M.; Stromberg, A.J.; Whelan, J.P.; Bailey, W.M.; Gensel, J.C.; Wilson, M.E. Considerations for Studying Sex as a Biological Variable in Spinal Cord Injury. Front. Neurol. 2020, 11, 802, ARTN 597689fneur.2020.597689. [Google Scholar] [CrossRef]
- Yonenobu, K.; Abumi, K.; Nagata, K.; Taketomi, E.; Ueyama, K. Interobserver and Intraobserver Reliability of the Japanese Orthopaedic Association Scoring System for Evaluation of Cervical Compression Myelopathy. Spine 2001, 26, 1890–1894. [Google Scholar] [CrossRef] [PubMed]
- Imaging Data Parkinson’s Progression Markers Initiative (PPMI). Available online: https://onlinelibrary.wiley.com/doi/pdfdirect/10.1002/acn3.644 (accessed on 30 August 2021).
- Fischl, B.; Sereno, M.I.; Dale, A.M. Cortical Surface-Based Analysis: II: Inflation, Flattening, and a Surface-Based Coordinate System. NeuroImage 1999, 9, 195–207. [Google Scholar] [CrossRef] [PubMed] [Green Version]
- Desikan, R.S.; Ségonne, F.; Fischl, B.; Quinn, B.T.; Dickerson, B.C.; Blacker, D.; Buckner, R.L.; Dale, A.M.; Maguire, R.; Hyman, B.T.; et al. An automated labeling system for subdividing the human cerebral cortex on MRI scans into gyral based regions of interest. NeuroImage 2006, 31, 968–980. [Google Scholar] [CrossRef]
- Lemaitre, H.; Goldman, A.L.; Sambataro, F.; Verchinski, B.A.; Meyer-Lindenberg, A.; Weinberger, D.R.; Mattay, V.S. Normal age-related brain morphometric changes: Nonuniformity across cortical thickness, surface area and gray matter volume? Neurobiol. Aging 2012, 33, 617.e1–617.e9. [Google Scholar] [CrossRef] [PubMed] [Green Version]
- Salat, D.H.; Buckner, R.L.; Snyder, A.Z.; Greve, D.N.; Desikan, R.S.; Busa, E.; Morris, J.C.; Dale, A.M.; Fischl, B. Thinning of the Cerebral Cortex in Aging. Cereb. Cortex 2004, 14, 721–730. [Google Scholar] [CrossRef] [Green Version]
- Good, C.D.; Johnsrudeb, I.; Ashburner, J.; Henson, R.N.; Friston, K.J.; Frackowiak, R. Cerebral Asymmetry and the Effects of Sex and Handedness on Brain Structure: A Voxel-Based Morphometric Analysis of 465 Normal Adult Human Brains. NeuroImage 2001, 14, 685–700. [Google Scholar] [CrossRef] [Green Version]
- Chen, X.; Sachdev, P.S.; Wen, W.; Anstey, K. Sex differences in regional gray matter in healthy individuals aged 44–48 years: A voxel-based morphometric study. NeuroImage 2007, 36, 691–699. [Google Scholar] [CrossRef]
- Fjell, A.M.; Westlye, L.T.; Amlien, I.K.; Espeseth, T.; Reinvang, I.; Raz, N.; Agartz, I.; Salat, D.H.; Greve, U.N.; Fischl, B.; et al. Minute Effects of Sex on the Aging Brain: A Multisample Magnetic Resonance Imaging Study of Healthy Aging and Alzheimer’s Disease. J. Neurosci. 2009, 29, 8774–8783. [Google Scholar] [CrossRef] [PubMed] [Green Version]
- Smith, C.D.; Chebrolu, H.; Wekstein, D.R.; Schmitt, F.A.; Markesbery, W.R. Age and gender effects on human brain anatomy: A voxel-based morphometric study in healthy elderly. Neurobiol. Aging 2007, 28, 1075–1087. [Google Scholar] [CrossRef] [PubMed]
- Sanchis-Segura, C.; Ibanez-Gual, M.V.; Adrian-Ventura, J.; Aguirre, N.; Gomez-Cruz, A.J.; Avila, C.; Forn, C. Sex differences in gray matter volume: How many and how large are they really? Biol. Sex Differ. 2019, 10, 1–19. [Google Scholar] [CrossRef] [PubMed]
- Dong, Y.; Holly, L.T.; Albistegui-DuBois, R.; Yan, X.; Marehbian, J.; Newton, J.M.; Dobkin, B.H. Compensatory cerebral adaptations before and evolving changes after surgical decompression in cervical spondylotic myelopathy. J. Neurosurg. Spine 2008, 9, 538–551. [Google Scholar] [CrossRef] [PubMed]
- Bernabéu-Sanz, A.; Mollá-Torró, J.V.; López-Celada, S.; López, P.M.; Fernández-Jover, E. MRI evidence of brain atrophy, white matter damage, and functional adaptive changes in patients with cervical spondylosis and prolonged spinal cord compression. Eur. Radiol. 2019, 30, 357–369. [Google Scholar] [CrossRef]
- Durga, A.; Sepahpanah, F.; Regozzi, M.; Hastings, J.; Crane, D.A. Prevalence of Testosterone Deficiency After Spinal Cord Injury. PM&R 2011, 3, 929–932. [Google Scholar] [CrossRef]
- Bauman, W.A.; La Fountaine, M.F.; Spungen, A.M. Age-related prevalence of low testosterone in men with spinal cord injury. J. Spinal Cord Med. 2013, 37, 32–39. [Google Scholar] [CrossRef] [Green Version]
- Fomberstein, K.; Qadri, S.; Ramani, R. Functional MRI and pain. Curr. Opin. Anaesthesiol. 2013, 26, 588–593. [Google Scholar] [CrossRef] [PubMed]
Publisher’s Note: MDPI stays neutral with regard to jurisdictional claims in published maps and institutional affiliations. |
© 2021 by the authors. Licensee MDPI, Basel, Switzerland. This article is an open access article distributed under the terms and conditions of the Creative Commons Attribution (CC BY) license (https://creativecommons.org/licenses/by/4.0/).