
Analysis and Reliability of Anthropometric Measurements during Pregnancy: A Prospective Cohort Study in 208 Pregnant Women

 ,
,  ,
,  , , and
Abstract
1. Introduction
2. Materials and Methods
2.1. Study Population
2.2. Data Collection
2.3. Body Composition and Anthropometric Assessment
2.4. Statistical Analysis
3. Results
4. Discussion
5. Conclusions
Supplementary Materials
Author Contributions
Funding
Institutional Review Board Statement
Informed Consent Statement
Data Availability Statement
Conflicts of Interest
References
- WHO. Physical Status: The Use and Interpretation of Anthropometry; WHO: Geneva, Switzerland, 2013. [Google Scholar]
- Huston Presley, L.; Wong, W.W.; Roman, N.M.; Amini, S.B.; Catalano, P.M. Anthropometric estimation of maternal body composition in late gestation. Obstet. Gynecol. 2000, 96, 33–37. [Google Scholar] [CrossRef]
- Shah, P.; Belsey, M.; Health, C.; Planning, F.; de Onis, M.; Pradilla, A.; Anderson, M.; Kramer, M.; University, M.; Haas, J.; et al. Maternal anthropometry and pregnancy outcomes. A WHO Collaborative Study. Bull. World Health Organ. 1995, 73, 1–98. [Google Scholar]
- Abrams, B.; Altman, S.L.; Pickett, K.E. Pregnancy weight gain: Still controversial. Am. J. Clin. Nutr. 2000, 71, 33–41. [Google Scholar] [CrossRef]
- Goldstein, R.F.; Abell, S.K.; Ranasinha, S.; Misso, M.; Boyle, J.A.; Black, M.H.; Li, N.; Hu, G.; Corrado, F.; Rode, L.; et al. Association of gestational weight gain with maternal and infant outcomes: A systematic review and meta-analysis. JAMA J. Am. Med. Assoc. 2017, 317, 2207–2225. [Google Scholar] [CrossRef]
- Voerman, E.; Santos, S.; Inskip, H.; Amiano, P.; Barros, H.; Charles, M.A.; Chatzi, L.; Chrousos, G.P.; Corpeleijn, E.; Crozier, S.; et al. Association of Gestational Weight Gain With Adverse Maternal and Infant Outcomes. JAMA 2019, 321, 1702–1715. [Google Scholar]
- Vila-Candel, R.; Soriano-Vidal, F.J.; Navarro-Illana, P.; Murillo, M.; Martin-Moreno, J.M. Asociación entre el índice de masa corporal materno, la ganancia de peso gestacional y el peso al nacer; estudio prospectivo en un departamento de salud. Nutr. Hosp. 2015, 31, 1551–1557. [Google Scholar]
- Institute of Medicine (US) Committee on Nutritional Status During Pregnancy and Lactation. Body Composition Changes During Pregnancy. In Nutrition During Pregnancy: Part I Weight Gain: Part II Nutrient Supplements; National Academies Press (US): Washington, DC, USA, 1990; Chapter 6. [Google Scholar]
- Verovská, R.; Lacnák, Z.; Haluzíková, D.; Fábin, P.; Matoulek, M. Comparison of various methods of body fat analysis in overweight and obese women. Vnitr. Lek. 2009, 55, 455–461. [Google Scholar] [PubMed]
- GarcÍa, P.A.D.; Llerena, C.; Quiroz, S.E. Subcutaneous fat accumulation during pregnancy in a malnourished population. Br. J. Nutr. 1978, 40, 485–489. [Google Scholar] [CrossRef] [PubMed]
- Maso, M.J.; Gong, E.J.; Jacobson, M.S.; Bross, D.S.; Heald, F.P. Anthropometric predictors of low birth weight outcome in teenage pregnancy. J. Adolesc. Health Care 1988, 9, 188–193. [Google Scholar] [CrossRef]
- Sidebottom, A.C.; Brown, J.E.; Jacobs, D.R. Pregnancy-related changes in body fat. Eur. J. Obstet. Gynecol. Reprod. Biol. 2001, 94, 216–223. [Google Scholar] [CrossRef]
- Subhan, F.B.; Shulman, L.; Yuan, Y.; McCargar, L.J.; Kong, L.; Bell, R.C.; Letourneau, N.; Kaplan, B.J.; Field, C.J.; Dewey, D.; et al. Association of pre-pregnancy BMI and gestational weight gain with fat mass distribution and accretion during pregnancy and early postpartum: A prospective study of Albertan women. BMJ Open 2019, 9, e026908. [Google Scholar] [CrossRef]
- Martín, V. Medición de la grasa corporal mediante impedancia bioeléctrica, pliegues cutáneos y ecuaciones a partir de medidas antropométricas. Análisis Comp. 2001, 75, 221–236. [Google Scholar] [CrossRef]
- Di Cesare, M.; Bentham, J.; Stevens, G.A.; Zhou, B.; Danaei, G.; Lu, Y.; Bixby, H.; Cowan, M.J.; Riley, L.M.; Hajifathalian, K.; et al. Trends in adult body-mass index in 200 countries from 1975 to 2014: A pooled analysis of 1698 population-based measurement studies with 19.2 million participants. Lancet 2016, 387, 1377–1396. [Google Scholar]
- Nahar, S.; Mascie-Taylor, C.G.N.; Begum, H.A. Maternal anthropometry as a predictor of birth weight. Public Health Nutr. 2007, 10, 965–970. [Google Scholar] [CrossRef]
- Alfadhli, E.M. Maternal obesity influences Birth Weight more than gestational Diabetes author. BMC Pregnancy Childbirth 2021, 21, 111. [Google Scholar] [CrossRef] [PubMed]
- Klipstein-Grobusch, K.; Georg, T.; Boeing, H. Interviewer variability in anthropometric measurements and estimates of body composition. Int. J. Epidemiol. 1997, 26, S174. [Google Scholar] [CrossRef] [PubMed]
- Stewart, A.; Marfell-Jones, M.; Olds, T.; de Ridder, J.H. International Standards for Anthropometric Assessment, 3rd ed.; International Society for the Advancement of Kinanthropometry: Lower Hutt, New Zealand, 2011; ISBN 0620362073. [Google Scholar]
- da Silva, V.S.; Vieira, M.F.S. International Society for the Advancement of Kinanthropometry (ISAK) Global: International accreditation scheme of the competent anthropometrist. Rev. Bras. Cineantropometria Desempenho Hum. 2020, 22, e70517. [Google Scholar] [CrossRef]
- Sommer, C.; Jenum, A.K.; Waage, C.W.; Mørkrid, K.; Sletner, L.; Birkeland, K.I. Ethnic differences in BMI, subcutaneous fat, and serum leptin levels during and after pregnancy and risk of gestational diabetes. Eur. J. Endocrinol. 2015, 172, 649–656. [Google Scholar] [CrossRef] [PubMed]
- Park, S.Y.; Kwon, K.Y.; Kim, J.H.; Choi, H.H.; Han, K.H.; Han, J.H. Association between Appendicular Fat Mass and Metabolic Risk Factors. Korean J. Fam. Med. 2014, 35, 182. [Google Scholar] [CrossRef] [PubMed][Green Version]
- Rosner, B. Fundamentals of Biostatistics—Bernard Rosner—Google Books. 2015, Volume 943. Available online: https://books.google.com.sa/books?hl=en&lr=&id=yn4yBgAAQBAJ&oi=fnd&pg=PR7&dq=Rosner+B.+Fundamentals+of+Biostatistics.+7th+ed.+Boston,+MA:+Brooks/Cole%3B+2011&ots=IfgtVl5Eue&sig=VAVYNzRB_R0BG-nmY6PrhfKGfkI&redir_esc=y#v=onepage&q&f=false (accessed on 20 July 2021).
- Seabolt, L.A.; Welch, E.B.; Silver, H.J. Imaging methods for analyzing body composition in human obesity and cardiometabolic disease. Ann. N. Y. Acad. Sci. 2015, 1353, 41–59. [Google Scholar] [CrossRef] [PubMed]
- Sohlström, A.; Forsum, E. Changes in adipose tissue volume and distribution during reproduction in Swedish women as assessed by magnetic resonance imaging. Am. J. Clin. Nutr. 1995, 61, 287–295. [Google Scholar] [CrossRef]
- López, L.B.; Calvo, E.B.; Poy, M.S.; del Valle Balmaceda, Y.; Cámera, K. Changes in skinfolds and mid-upper arm circumference during pregnancy in Argentine women. Matern. Child Nutr. 2011, 7, 253–262. [Google Scholar] [CrossRef]
- Soltani, H.; Fraser, R.B. A longitudinal study of maternal anthropometric changes in normal weight, overweight and obese women during pregnancy and postpartum. Br. J. Nutr. 2000, 84, 95–101. [Google Scholar] [CrossRef]
- Durnin, J.V.G.A.; Womersley, J. Body fat assessed from total body density and its estimation from skinfold thickness: Measurements on 481 men and women aged from 16 to 72 Years. Br. J. Nutr. 1974, 32, 77–97. [Google Scholar] [CrossRef]
- Paxton, A.; Lederman, S.A.; Heymsfield, S.B.; Wang, J.; Thornton, J.C.; Pierson, R.N., Jr. Anthropometric equations for studying body fat in pregnant women. Am. J. Clin. Nutr. 1998, 67, 104–110. [Google Scholar] [CrossRef] [PubMed]
- Most, J.; Altazan, A.D.; Hsia, D.S.; Beyl, R.A.; Redman, L.M. Body Composition During Pregnancy Differs by Obesity Class. Obesity 2020, 28, 268–276. [Google Scholar] [CrossRef] [PubMed]
- Bogaerts, A.; Ameye, L.; Bijlholt, M.; Amuli, K.; Heynickx, D.; Devlieger, R. INTER-ACT: Prevention of pregnancy complications through an e-health driven interpregnancy lifestyle intervention—Study protocol of a multicentre randomised controlled trial. BMC Pregnancy Childbirth 2017, 17, 154. [Google Scholar] [CrossRef]
- Lohman, T. Anthropometric Standardization Reference Manual. Champaign(IL)Title; Human Kinetics Books: Champaign, IL, USA, 1988; ISBN 9780873221214. [Google Scholar]
- Taggart, N.R.; Holliday, R.M.; Billewicz, W.Z.; Hytten, F.E.; Thomson, A.M. Changes in skinfolds during pregnancy. Br. J. Nutr. 1967, 21, 439–451. [Google Scholar] [CrossRef] [PubMed]
- Mahaba, H.M.; Ismail, N.A.; El Teheiwy, M.M.; El-Goewily, M.M.; Ramadan, M.S. Development of weight gain charts for healthy Egyptian pregnant women. J. Egypt. Public Health Assoc. 2001, 76, 369–391. [Google Scholar]
- Widen, E.M.; Gallagher, D. Body composition changes in pregnancy: Measurement, predictors and outcomes. Eur. J. Clin. Nutr. 2014, 68, 643–652. [Google Scholar] [CrossRef]
- Stevens-Simon, C.; Thureen, P.; Barrett, J.; Stamm, E. Skinfold caliper and ultrasound assessments of change in the distribution of subcutaneous fat during adolescent pregnancy. Int. J. Obes. 2001, 25, 1340–1345. [Google Scholar] [CrossRef] [PubMed][Green Version]
- Most, J.; Marlatt, K.L.; Altazan, A.D.; Redman, L.M. Advances in assessing body composition during pregnancy. Eur. J. Clin. Nutr. 2018, 72, 645–656. [Google Scholar] [CrossRef] [PubMed]
- Sohlström, A.; Forsum, E. Changes in total body fat during the human reproductive cycle as assessed by magnetic resonance imaging, body water dilution, and skinfold thickness: A comparison of methods. Am. J. Clin. Nutr. 1997, 66, 1315–1322. [Google Scholar] [CrossRef] [PubMed]
- Institute of Medicine (US) Committee on Military Nutrition Research. Body Composition and Physical Performance: Applications For the Military Services; Marriott, B.M., Grumstrup-Scott, J., Eds.; National Academies Press (US): Washington, DC, USA, 1990. [Google Scholar]


| Age (years), mean (SD) | 31.93 (4.66) |
| Pre-pregnancy BMI, n (%) | |
| Underweight (BMI < 18.5 kg/m2) | 7 (3.4) |
| Normal weight (BMI 18.5–25 kg/m2) | 112 (53.8) |
| Overweight (BMI 25–30 kg/m2) | 61 (29.3) |
| Obese (BMI > 30 kg/m2) | 28 (13.5) |
| Weight gain (kg), mean (SD) | 7.48 (3.4) |
| Parity, n (%) | |
| Primiparous | 87 (41.8) |
| Multiparous | 121 (58.2) |
| Alcohol consumption, n (%) a | 5 (2.4) |
| Tobacco consumption, n (%) b | 26 (12.5) |
| Delivery, n (%) | |
| Eutocic | 112 (55.4) |
| Instrumental | 48 (23.8) |
| Caesarean | 42 (20.8) |
| 1st Trimester | 2nd Trimester | 3rd Trimester | p-Value | Bonferroni’s Post-Hoc Test | |
|---|---|---|---|---|---|
| Body mass (kg) | 67.34 (11.99) | 69.42 (11.94) | 74.61 (11.96) | 0.000 | All |
| BMI | 24.78 (4.57) | 25.52 (4.50) | 27.49 (4.62) | 0.000 | All |
| Skinfolds (mm) | |||||
| Triceps | 24.87 (8.50) | 25.26 (8.17) | 25.71 (7.67) | 0.036 | T1 vs. T3 |
| Subscapular | 19.21 (8.37) | 19.90 (8.56) | 21.93 (9.41) | 0.000 | All |
| Biceps | 14.54 (6.91) | 14.45 (7.21) | 14.91 (6.69) | 0.228 | - |
| Iliac crest | 23.45 (9.71) | 26.29 (9.86) | 29.18 (11.14) | 0.000 | All |
| Supraspinal | 20.62 (9.49) | 21.45 (9.39) | 21.64 (10.58) | 0.262 | - |
| Abdominal | 30.61 (12.27) | 31.79 (10.47) | 30.40 (10.27) | 0.032 | T1 vs. T2 T2 vs. T3 |
| Mid-thigh | 34.03 (9.74) | 36.07 (10.21) | 36.94 (10.88) | 0.000 | T1 vs. T2 T1 vs. T3 |
| Calf | 24.11 (7.91) | 24.00 (8.52) | 24.55 (7.94) | 0.409 | - |
| ∑SFT7 | 168.16 (53.42) | 172.91 (51.83) | 176.46 (53.62) | 0.003 | T1 vs. T2 T1 vs. T3 |
| ∑Arm SFT | 39.42 (14.6) | 39.71 (14.58) | 40.62 (13.54) | 0.046 | T1 vs. T3 |
| ∑Trunk SFT | 70.43 (27.36) | 73.14 (25.54) | 74.18 (27.14) | 0.019 | T1 vs. T2 T1 vs. T3 |
| ∑Leg SFT | 58.04 (16.38) | 60.07 (17.60) | 61.54 (17.66) | 0.001 | T1 vs. T2 T1 vs. T3 |
| ∑Appendicular SFT | 97.54 (28.51) | 99.78 (28.87) | 102.04 (28.74) | 0.001 | All |
| Girths (cm) | |||||
| Arm Girth (relaxed) | 27.73 (4.05) | 28.18 (3.77) | 28.54 (3.74) | 0.000 | All |
| Arm Girth (flexed) | 28.92 (4.20) | 29.32 (3.70) | 29.56(3.74) | 0.000 | All |
| Waist Girth | 80.14 (11) | 82.97 (10.61) | 87.91 (10.11) | 0.000 | All |
| Hip Girth | 102.30 (10.87) | 103.61 (9.59) | 106.41 (8.71) | 0.000 | All |
| Calf Girth | 35.6 (3.15) | 35.83 (3.37) | 36.54 (3.37) | 0.000 | All |
| Bone breadth (cm) | |||||
| Humerus | 8.94 (7.13) | 8.33 (4.85) | 7.85 (0.79) | 0.063 | - |
| Femur | 12 (1.368) | 11.69 (1.34) | 11.97 (1.37) | 0.005 | T1 vs. T2 T2 vs. T3 |
| 1st Trimester | 2nd Trimester | 3rd Trimester | p-Value | Bonferroni’s Post-Hoc Test | |
|---|---|---|---|---|---|
| Normal weight (BMI 18.5–25kg/m2) | |||||
| ∑SFT7 | 135.72 (32.67) | 143.43 (31.70) | 148.43 (35.03) | 0.000 | All |
| ∑Appendicular SFT | 80.38 (17.96) | 84.06 (18.61) | 87.40 (20.05) | 0.000 | All |
| ∑Arm SFT | 31.12 (8.87) | 32.25 (8.92) | 33.96 (9.42) | 0.003 | T2 vs. T3, T1 vs. T3 |
| ∑Leg SFT | 49.32 (11.69) | 51.72 (12.97) | 53.51 (13.41) | 0.002 | T1 vs. T2, T1 vs. T3 |
| ∑Trunk SFT | 55.91 (18.35) | 59.80 (16.81) | 61.04 (17.91) | 0.005 | T1 vs. T2, T1 vs. T3 |
| Overweight (BMI 25–30kg/m2) | |||||
| ∑SFT7 | 194.91 (33.33) | 198.81 (31.59) | 200.74 (38.85) | 0.544 | |
| ∑Appendicular SFT | 112.04 (20.29) | 112.98 (18.71) | 114.53 (19.92) | 0.611 | |
| ∑Arm SFT | 45.62 (10.46) | 45.47 (9.91) | 47.23 (10.53) | 0.451 | |
| ∑Leg SFT | 66.42 (14.55) | 67.51 (14.25) | 67.30 (14.08) | 0.856 | |
| ∑Trunk SFT | 82.87 (17.90) | 85.83 (17.64) | 86.21 (22.31) | 0.485 | |
| Obese (BMI > 30 kg/m2) | |||||
| ∑SFT7 | 240.84 (40.86) | 246.05 (45.01) | 247.95 (56.63) | 0.881 | |
| ∑Appendicular SFT | 134.07 (22.36) | 138.00 (27.35) | 139.68 (29.58) | 0.712 | |
| ∑Arm SFT | 59.05 (11.35) | 61.32 (13.78) | 57.50 (12.36) | 0.358 | |
| ∑Leg SFT | 75.02 (14.91) | 76.68 (19.78) | 82.18 (19.74) | 0.118 | |
| ∑Trunk SFT | 106.77 (23.23) | 108.05 (20.11) | 108.27 (29.91) | 0.941 | |
| 1st Trimester | 2nd Trimester | 3rd Trimester | p-Value | Bonferroni’s Post-Hoc Test | |
|---|---|---|---|---|---|
| Skinfolds (CV) | |||||
| Triceps | 0.026 (0.02) | 0.023 (0.018) | 0.024 (0.021) | 0.307 | |
| Subscapular | 0.034 (0.031) | 0.032 (0.025) | 0.029 (0.022) | 0.09 | |
| Biceps | 0.042 (0.041) | 0.044 (0.036) | 0.039 (0.033) | 0.139 | |
| Iliac crest | 0.035 (0.031) | 0.034 (0.025) | 0.031 (0.02) | 0.199 | |
| Supraspinal | 0.033 (0.028) | 0.032 (0.023) | 0.034 (0.024) | 0.677 | |
| Abdominal | 0.031 (0.021) | 0.028 (0.017) | 0.03 (0.021) | 0.149 | |
| Mid-thigh | 0.029 (0.023) | 0.023 (0.015) | 0.023 (0.016) | 0.027 | T1 vs. T2 T1 vs. T3 |
| Calf | 0.037 (0.029) | 0.035 (0.026) | 0.032 (0.02) | 0.16 | |
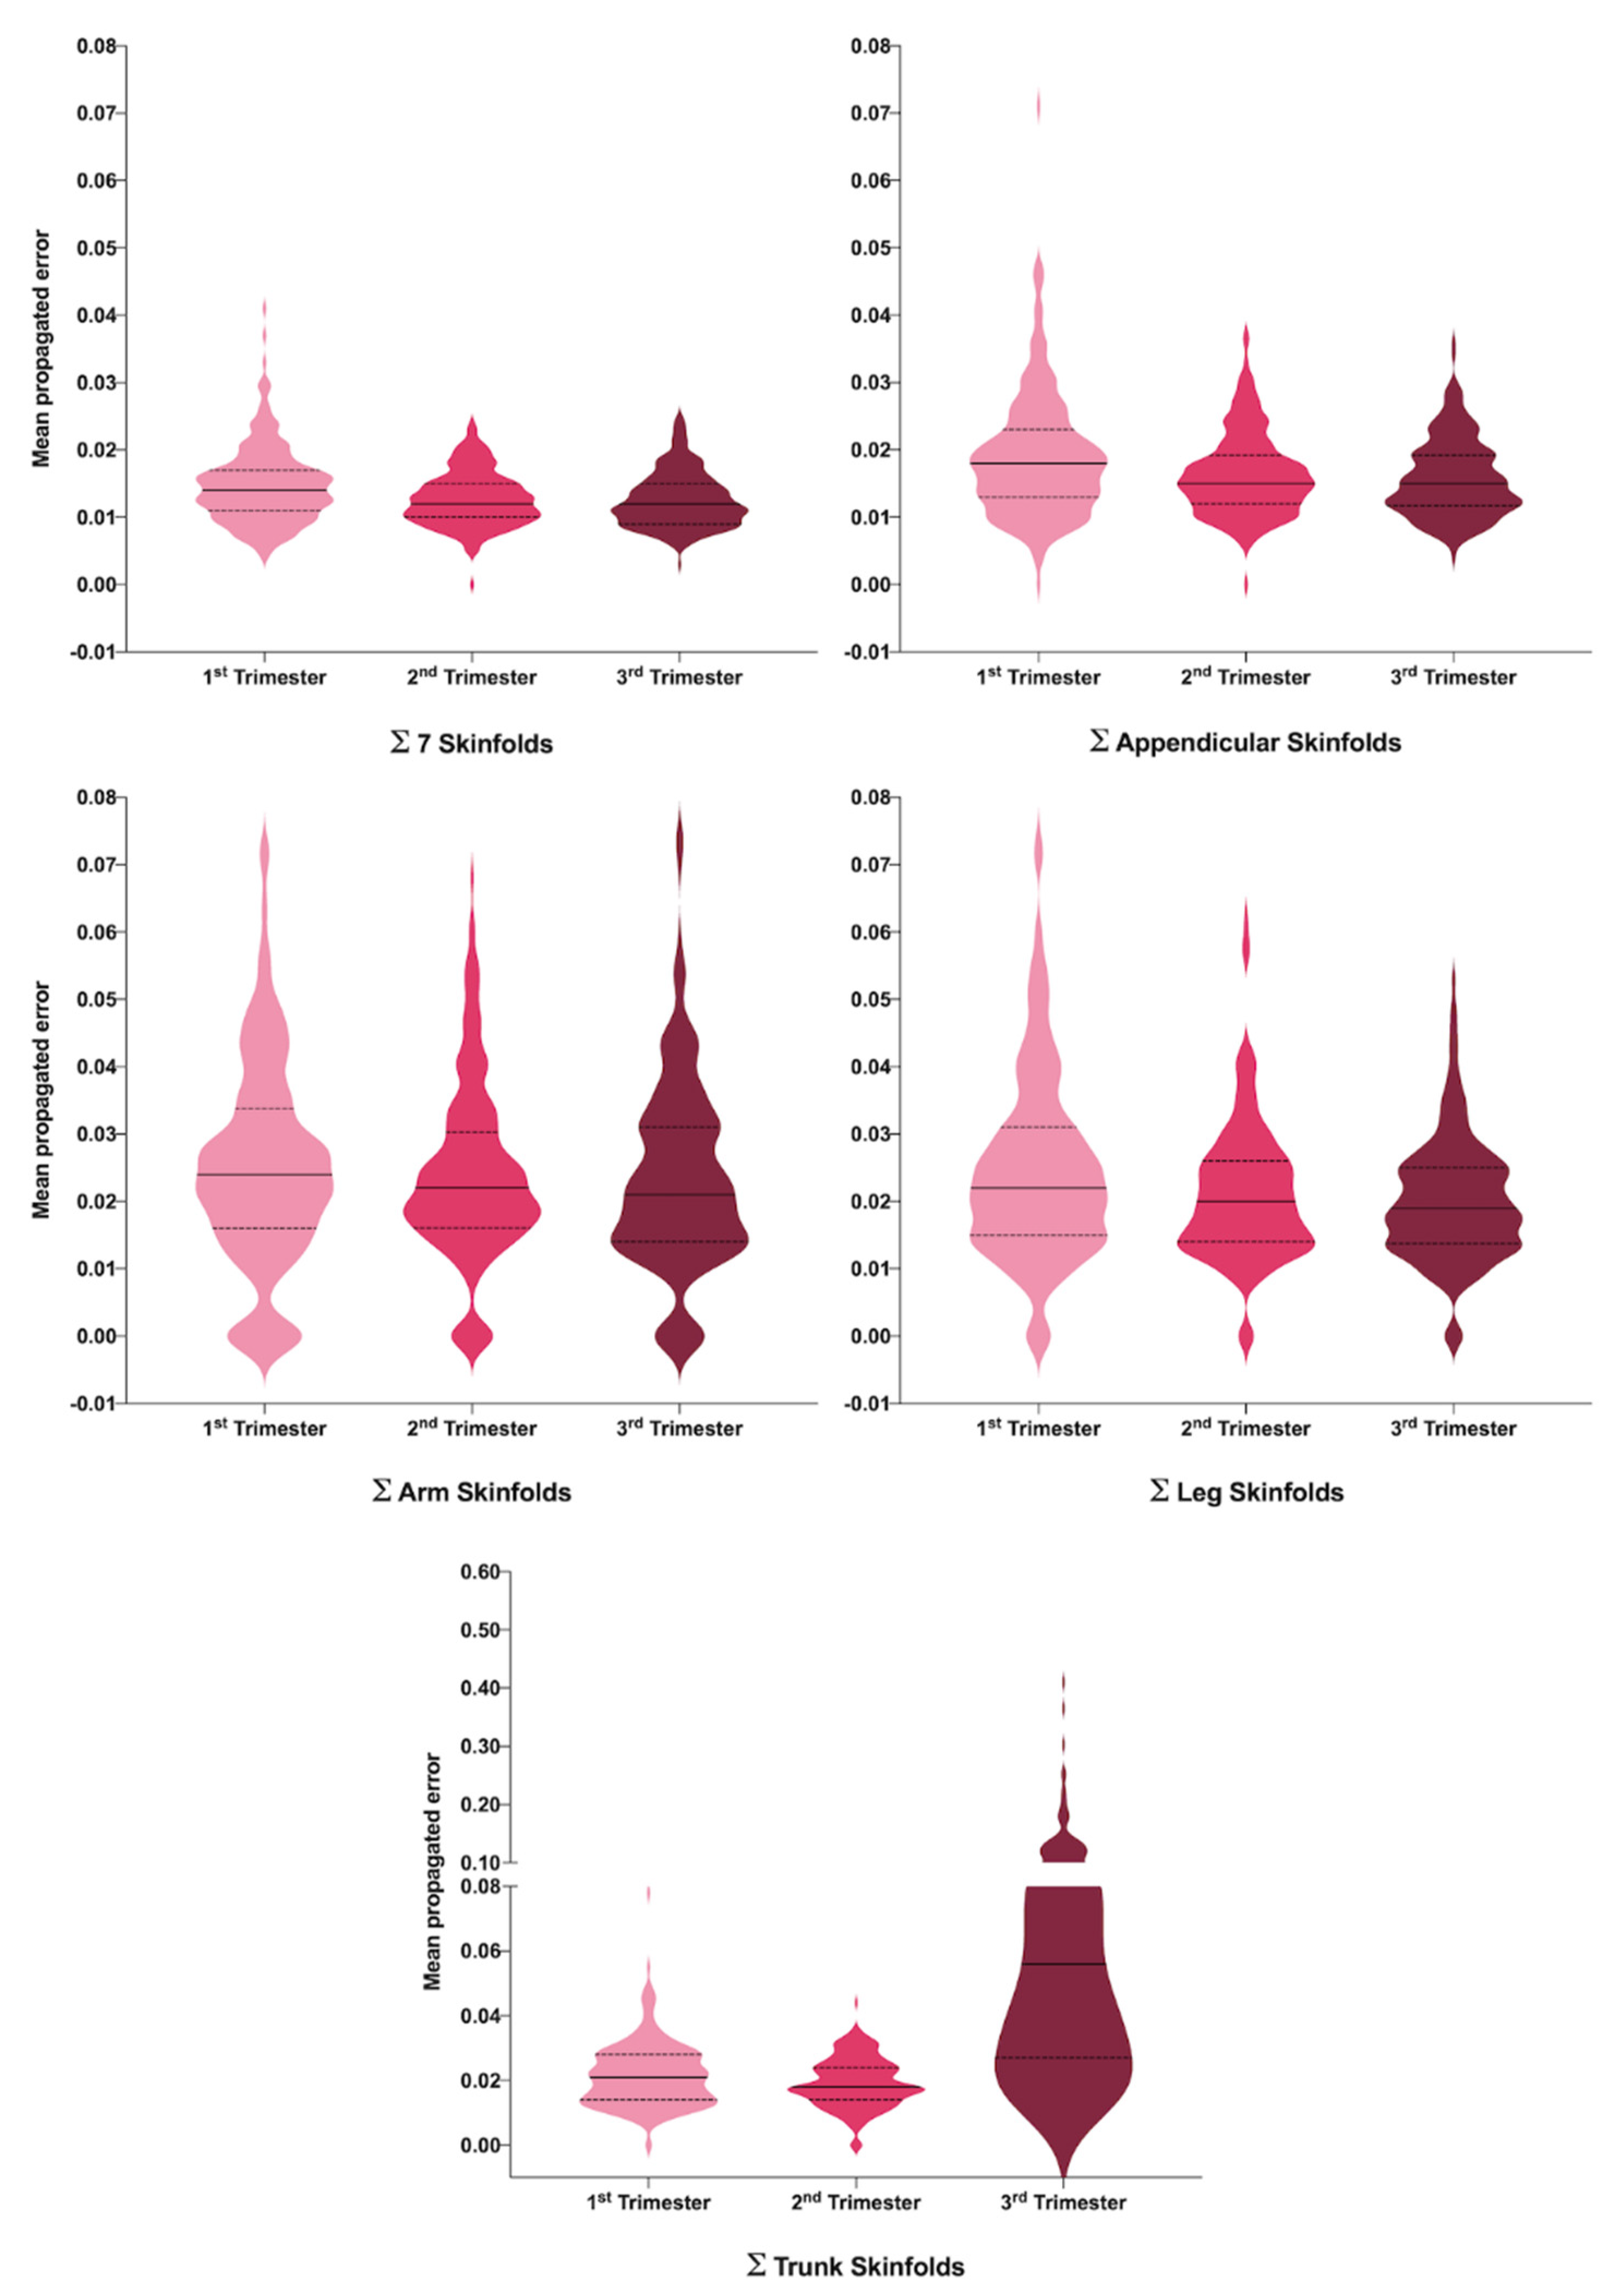
| PE ∑SFT7 | 0.015 (0.006) | 0.013 (0.004) | 0.013 (0.004) | 0.000 | T1 vs. T2 T1 vs. T3 |
| PE ∑Arm SFT | 0.025 (0.016) | 0.024 (0.013) | 0.023 (0.014) | 0.379 | |
| PE ∑Trunk SFT | 0.022 (0.01) | 0.019 (0.008) | 0.072 (0.062) | 0.000 | All |
| PE ∑Leg SFT | 0.025 (0.015) | 0.021 (0.01) | 0.02 (0.009) | 0.001 | T1 vs. T2 T1 vs. T3 |
| PE ∑Appendicular SFT | 0.019 (0.009) | 0.016 (0.006) | 0.016 (0.006) | 0.000 | T1 vs. T2 T1 vs. T3 |
| Girths (CV) | |||||
| Arm Girth (relaxed) | 0.008 (0.008) | 0.005 (0.006) | 0.006 (0.007) | 0.002 | T1 vs. T2 T1 vs. T3 |
| Arm Girth (flexed) | 0.006 (0.009) | 0.006 (0.008) | 0.005 (0.006) | 0.341 | |
| Waist Girth | 0.004 (0.004) | 0.003 (0.003) | 0.003 (0.003) | 0.000 | T1 vs. T2 T1 vs. T3 |
| Hip Girth | 0.004 (0.006) | 0.003 (0.004) | 0.002 (0.002) | 0.000 | All |
| Calf Girth | 0.004 (0.005) | 0.004 (0.004) | 0.003 (0.004) | 0.034 | T1 vs. T3 |
| Bone breadth (CV) | |||||
| Humerus | 0.01 (0.017) | 0.012 (0.019) | 0.008 (0.016) | 0.143 | |
| Femur | 0.014 (0.015) | 0.014 (0.018) | 0.008 (0.013) | 0.001 | T1 vs. T3 T2 vs. T3 |
Publisher’s Note: MDPI stays neutral with regard to jurisdictional claims in published maps and institutional affiliations. |
© 2021 by the authors. Licensee MDPI, Basel, Switzerland. This article is an open access article distributed under the terms and conditions of the Creative Commons Attribution (CC BY) license (https://creativecommons.org/licenses/by/4.0/).
Share and Cite
Gómez-Carrascosa, I.; Sánchez-Ferrer, M.L.; de la Cruz-Sánchez, E.; Arense-Gonzalo, J.J.; Prieto-Sánchez, M.T.; Alfosea-Marhuenda, E.; Iniesta, M.A.; Mendiola, J.; Torres-Cantero, A.M. Analysis and Reliability of Anthropometric Measurements during Pregnancy: A Prospective Cohort Study in 208 Pregnant Women. J. Clin. Med. 2021, 10, 3933. https://doi.org/10.3390/jcm10173933
Gómez-Carrascosa I, Sánchez-Ferrer ML, de la Cruz-Sánchez E, Arense-Gonzalo JJ, Prieto-Sánchez MT, Alfosea-Marhuenda E, Iniesta MA, Mendiola J, Torres-Cantero AM. Analysis and Reliability of Anthropometric Measurements during Pregnancy: A Prospective Cohort Study in 208 Pregnant Women. Journal of Clinical Medicine. 2021; 10(17):3933. https://doi.org/10.3390/jcm10173933
Chicago/Turabian StyleGómez-Carrascosa, Inmaculada, María L. Sánchez-Ferrer, Ernesto de la Cruz-Sánchez, Julián J. Arense-Gonzalo, María T. Prieto-Sánchez, Emilia Alfosea-Marhuenda, Miguel A. Iniesta, Jaime Mendiola, and Alberto M. Torres-Cantero. 2021. "Analysis and Reliability of Anthropometric Measurements during Pregnancy: A Prospective Cohort Study in 208 Pregnant Women" Journal of Clinical Medicine 10, no. 17: 3933. https://doi.org/10.3390/jcm10173933
APA StyleGómez-Carrascosa, I., Sánchez-Ferrer, M. L., de la Cruz-Sánchez, E., Arense-Gonzalo, J. J., Prieto-Sánchez, M. T., Alfosea-Marhuenda, E., Iniesta, M. A., Mendiola, J., & Torres-Cantero, A. M. (2021). Analysis and Reliability of Anthropometric Measurements during Pregnancy: A Prospective Cohort Study in 208 Pregnant Women. Journal of Clinical Medicine, 10(17), 3933. https://doi.org/10.3390/jcm10173933