
How to Achieve Near-Normal Visual Acuity with Bevacizumab in Diabetic Macular Edema Patients

 , , , and
Abstract
:1. Introduction
2. Materials and Methods
2.1. Permissions and Ethical Statements
2.2. Study Design
2.2.1. Initial Diagnostics
2.2.2. Further Diagnostics
- Swept-source optical coherence tomography (SS-OCT) that enabled the diagnose of diabetic macular edema based on central subfield thickness (CST) measurement and retinal morphology.
- Ultra-wide-field fluorescein angiography (UWFFA) that enabled the evaluation of the non-perfusion areas (NPA), contrast leakage areas, microaneurysms (MA) count, diabetic retinopathy severity and differentiate between focal and diffuse macular edema according to SS-OCT data.
- Early Treatment Diabetic Retinopathy Study (ETDRS) chart testing that enabled to assess best-corrected visual acuity (BCVA).
2.2.3. Study Groups and Bevacizumab Treatment Protocol
- (1)
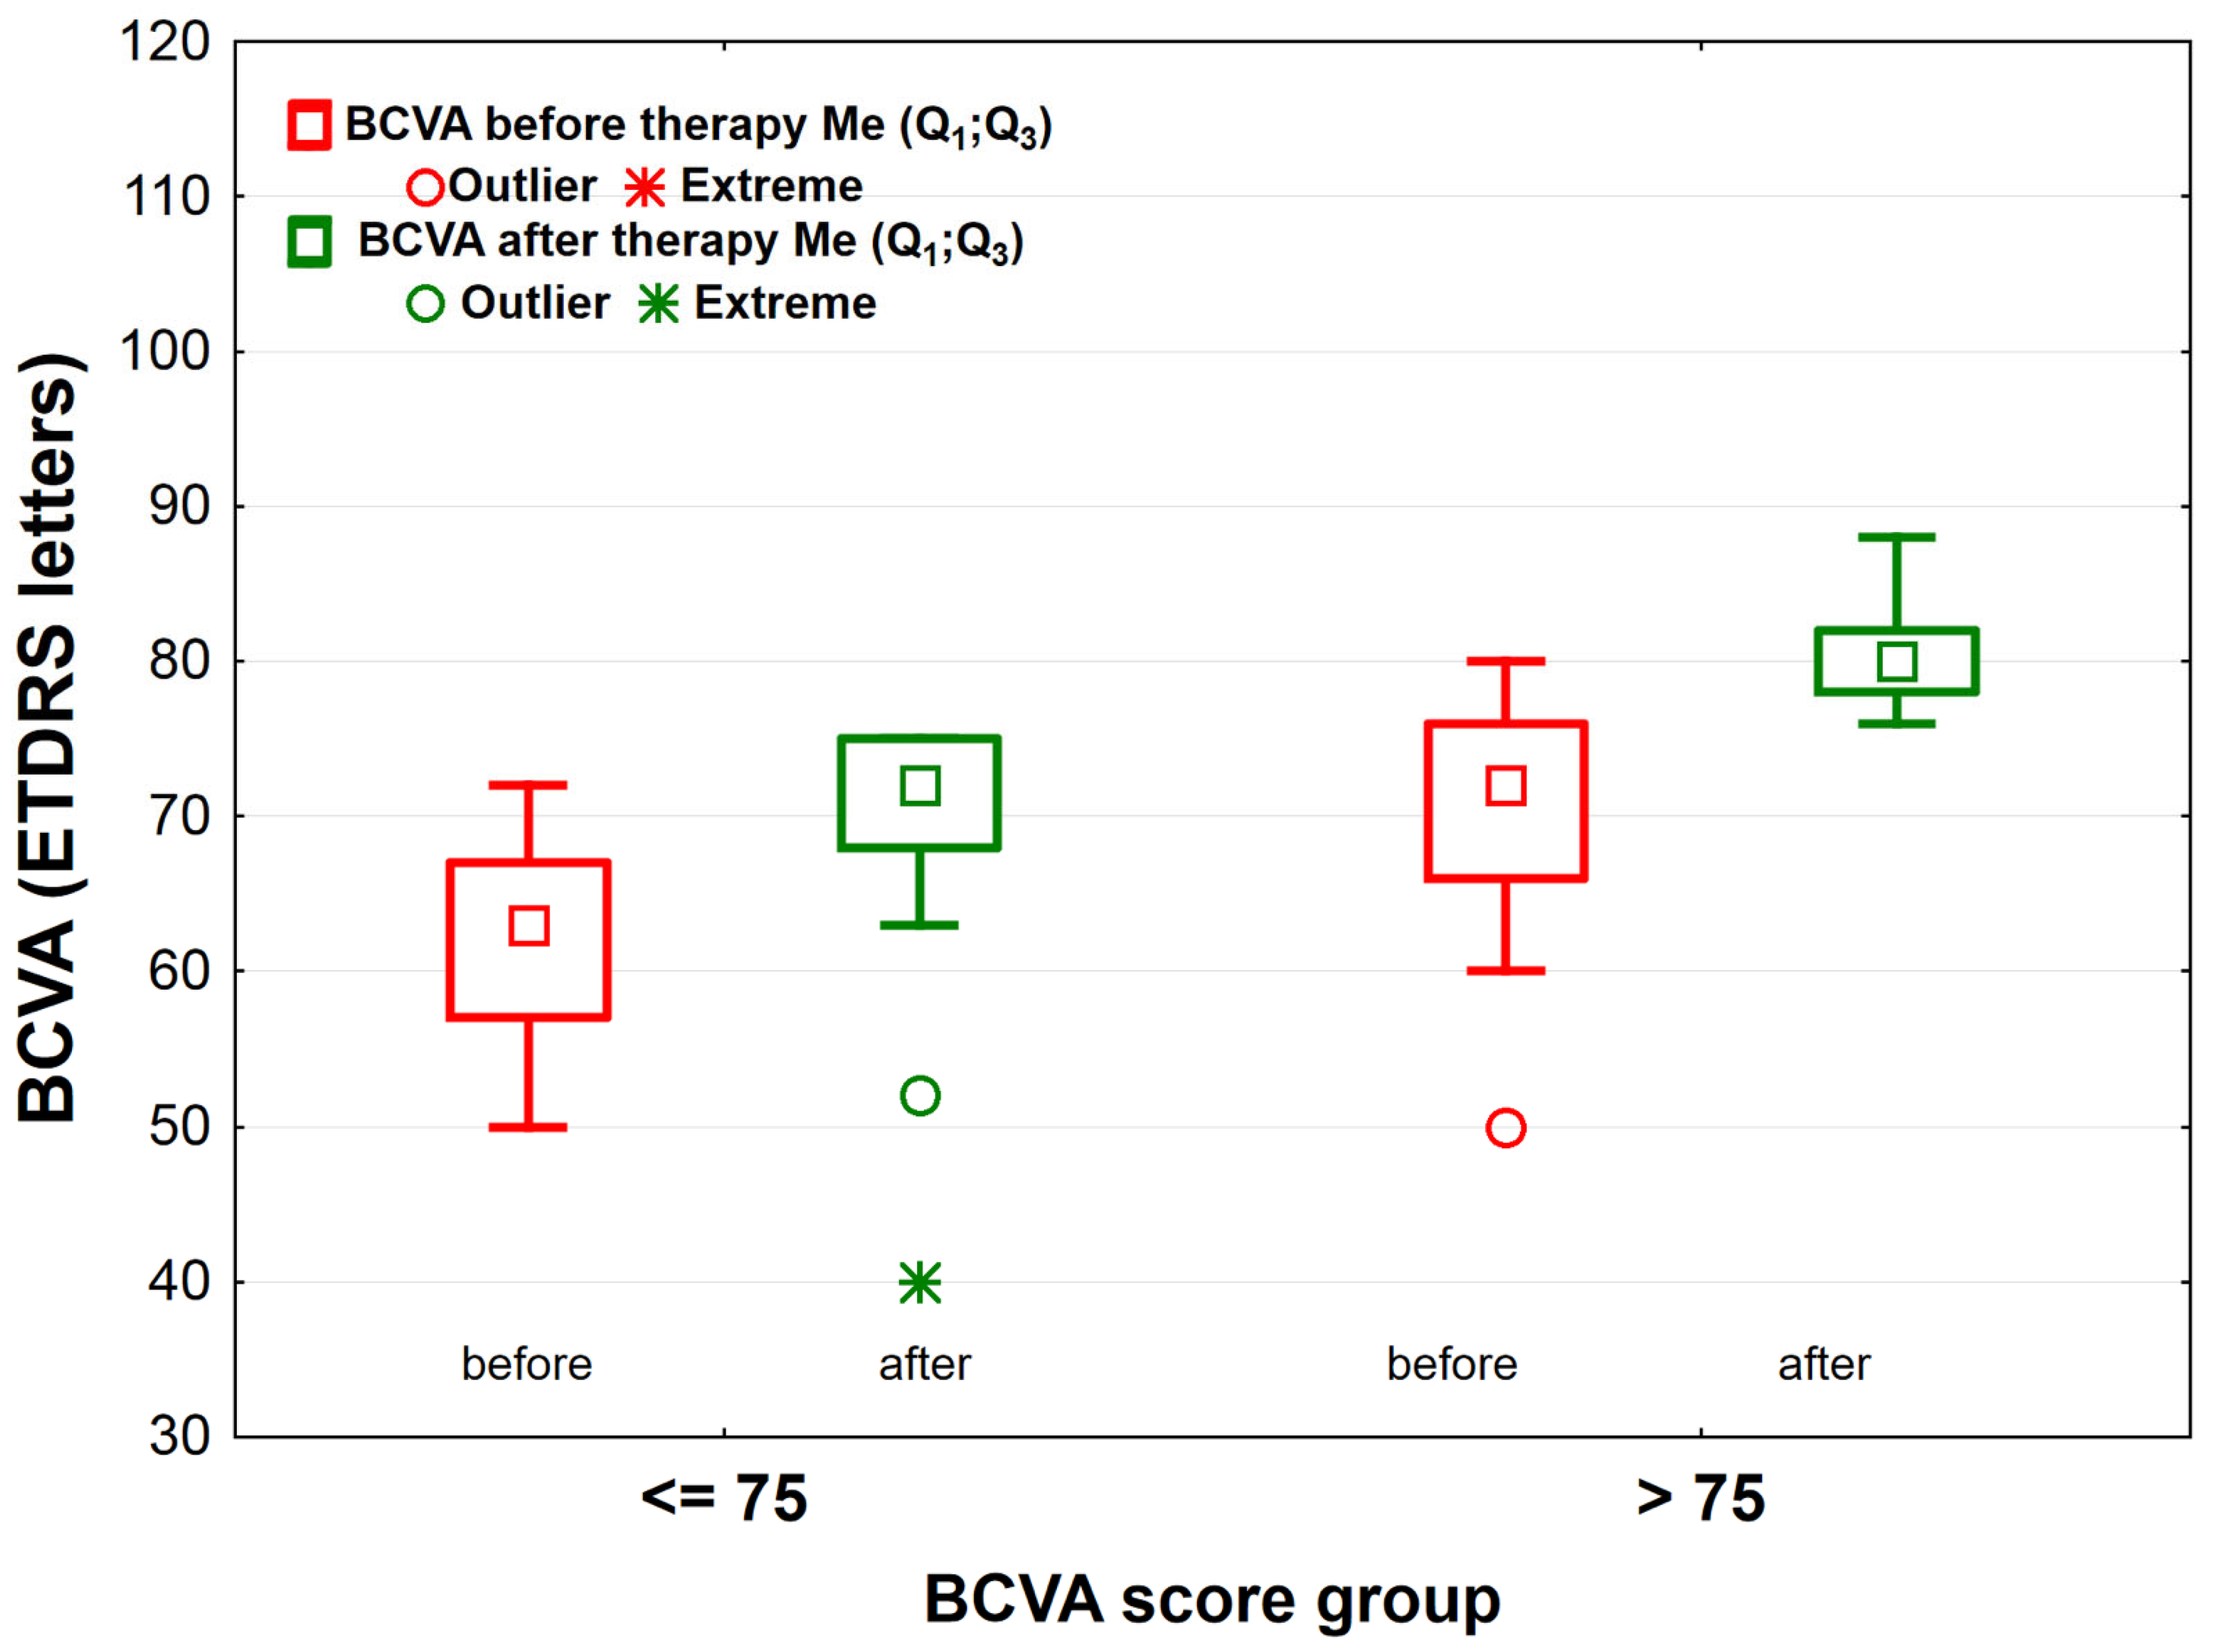
- BCVA≤75 group—patients who scored ≤ 75 ETDRS letters 1 month after completing the treatment (n = 41),
- (2)
- BCVA>75 group—patients who scored > 75 ETDRS letters 1 month after completing the treatment (n = 57).
2.3. Diagnostic Methodology
2.3.1. Swept-Source Optical Coherence Tomography (SS-OCT)
2.3.2. Ultra-Wide-Field Fluorescein Angiography (UWFFA)
2.3.3. Best-Corrected Visual Acuity (BCVA) Assessment
Early Treatment Diabetic Retinopathy Study (ETDRS) Chart Testing
2.4. Data Processing
2.4.1. Bevacizumab Treatment Effectiveness Analysis
2.4.2. Statistical Analysis
3. Results
4. Discussion
5. Conclusions
Author Contributions
Funding
Institutional Review Board Statement
Informed Consent Statement
Data Availability Statement
Conflicts of Interest
References
- Ehlken, C.; Ziemssen, F.; Eter, N.; Lanzl, I.; Kaymak, H.; Lommatzsch, A.; Schuster, A.K. Systematic review: Non-adherence and non-persistence in intravitreal treatment. Graefe’s Arch. Clin. Exp. Ophthalmol. 2020, 258, 2077–2090. [Google Scholar] [CrossRef]
- Shimizu, K.; Kobayashi, Y.; Muraoka, K. Mid-peripheral fundus involvement in diabetic retinopathy. Ophthalmology 1981, 88, 601–612. [Google Scholar] [CrossRef]
- Friberg, T.R.; Gupta, A.; Yu, J.; Huang, L.; Suner, I.; Puliafito, C.A.; Schwartz, S.D. Ultrawide angle fluorescein angiographic imaging: A comparison to conventional digital acquisition systems. Ophthalmic Surg. Lasers Imaging 2008, 39, 304–311. [Google Scholar] [CrossRef] [PubMed]
- Davis, M.D.; Norton, W.D.; Myers, F.L. Airlie classification of diabetic retinopathy. In Symposium on the Treatment of Diabetic Retinopathy; Goldberg, M.F., Fine, S.L., Eds.; US Department of Health, Education, and Welfare: Arlington, VA, USA, 1968; pp. 7–22. [Google Scholar]
- Fan, W.; Wang, K.; Falavarjani, K.G.; Sagong, M.; Uji, A.; Ip, M.; Wykoff, C.C.; Brown, D.M.; van Hemert, J.; Sadda, S.V.R. Distribution of nonperfusion area on ultra-widefield fluorescein angiography in eyes with diabetic macular edema: DAVE Study. Am. J. Ophthalmol. 2017, 180, 110–116. [Google Scholar] [CrossRef] [PubMed]
- Aiello, L.P.; Odia, I.; Glassman, A.R.; Melia, M.; Jampol, L.M.; Bressler, M.N.; Kiss, S.; Silva, P.S.; Wykoff, C.C.; Sun, J.K. Comparison of Early Treatment Diabetic Retinopathy Study standard 7-field imaging with ultrawide-field imaging for determining severity of diabetic retinopathy. JAMA Ophthalmol. 2019, 137, 65–73. [Google Scholar] [CrossRef] [Green Version]
- Wylęgała, A.; Bolek, B.; Wylęgała, E. Trends in optical coherence tomography angiography use in university clinic and private practice setting between 2014–2018. Expert Rev. Med. Devices 2020, 10, 1106–1113. [Google Scholar] [CrossRef] [PubMed]
- Lee, R.; Wong, T.Y.; Sabanayagam, C. Epidemiology of diabetic retinopathy, diabetic macular edema and related vision loss. Eye Vis. 2015, 2, 17. [Google Scholar] [CrossRef] [Green Version]
- Ogurtsova, K.; da Rocha Fernandes, J.D.; Huang, Y.; Linnenkamp, U.; Guariguata, L.; Cho, N.H.; Cavan, D.; Shaw, J.E.; Makaroff, L.E. IDF Diabetes Atlas: Global estimates for the prevalence of diabetes for 2015 and 2040. Diabetes Res. Clin. Pract. 2017, 128, 40–50. [Google Scholar] [CrossRef] [Green Version]
- Sędziak-Marcinek, B.; Teper, S.; Chełmecka, E.; Wylęgała, A.; Bias, M.; Wylęgała, E. Diabetic macular edema treatment with bevacizumab does not depend on the retinal non-perfusion presence. J. Diabetes Res. 2021, 2021, 6620122. [Google Scholar] [CrossRef]
- Baker, C.W.; Glassman, A.R.; Beaulieu, W.T.; Antoszyk, A.N.; Browning, D.J.; Chalam, K.V.; Gover, S.; Jampol, L.M.; Jhaveri, C.D.; Melia, M.; et al. Effect of Initial management with aflibercept vs laser photocoagulation vs observation on vision loss among patients with diabetic macular edema involving the center of the macula and good visual acuity. JAMA 2019, 321, 1880–1894. [Google Scholar] [CrossRef] [Green Version]
- Glassman, A.R.; Baker, C.W.; Beaulieu, W.T.; Bressler, N.M.; Punjabi, O.S.; Stockdale, C.R.; Wykoff, C.C.; Jampol, L.M.; Sun, J.K.; DRCR Retina Network. Assessment of the DRCR Retina Network approach to management with initial observation for eyes with center-involved diabetic macular edema and good visual acuity: A secondary analysis of a randomized clinical trial. JAMA Ophthalmol. 2020, 138, 341–349. [Google Scholar] [CrossRef]
- Zafar, S.; Smith, K.; Boland, M.V.; Weng, C.Y.; Solomon, S.; Channa, R. Real-world outcomes among eyes with center-involving diabetic macular edema and good visual acuity. Curr. Eye Res. 2020, 45, 879–887. [Google Scholar] [CrossRef] [PubMed]
- Diabetic Retinopathy Clinical Research Network; Wells, J.A.; Glassman, A.R.; Ayala, A.R.; Jampol, L.M.; Aiello, L.P.; Antoszyk, A.N.; Arnold-Bush, B.; Baker, C.W.; Bressler, N.M.; et al. Aflibercept, bevacizumab, or ranibizumab for diabetic macular edema. N. Eng. J. Med. 2015, 372, 1193–1203. [Google Scholar] [CrossRef] [Green Version]
- Michaelides, M.; Kaines, A.; Hamilton, R.D.; Fraser-Bell, S.; Rajendram, R.; Quhill, F.; Boos, C.J.; Xing, W.; Egan, C.; Peto, T.; et al. A prospective randomized trial of intravitreal bevacizumab or laser therapy in the management of diabetic macular edema (BOLT Study) 12-month data: Report 2. Ophthalmology 2010, 117, 1078–1086. [Google Scholar] [CrossRef] [PubMed]
- Cai, S.; Bressler, N.M. Aflibercept, bevacizumab or ranibizumab for diabetic macular oedema: Recent clinically relevant findings from DRCR.net protocol T. Curr. Opin. Ophthalmol. 2017, 28, 636–643. [Google Scholar] [CrossRef] [PubMed]
- Fang, M.; Fan, W.; Shi, Y.; Ip, M.S.; Wykoff, C.C.; Wang, K.; Falavarjani, K.G.; Brown, D.M.; van Hemert, J.; Sadda, S.R. Classification of regions of nonperfusion on ultra-widefield fluorescein angiography in patients with diabetic macular edema. Am. J. Ophthalmol. 2019, 206, 74–81. [Google Scholar] [CrossRef] [PubMed]
- Bressler, S.B.; Odia, I.; Maguire, M.G.; Dhoot, D.S.; Glassman, A.R.; Jampol, L.M.; Marcus, D.M.; Solomon, S.D.; Sun, J.K.; Diabetic Retinopathy Clinical Research Network. Factors associated with visual acuity and central subfield thickness changes when treating diabetic macular edema with anti-vascular endothelial growth factor therapy: An exploratory analysis of the protocol T randomized clinical trial. JAMA Ophthalmol. 2019, 137, 382–389. [Google Scholar] [CrossRef] [PubMed]
- Bressler, N.M.; Beaulieu, W.T.; Maguire, M.G.; Glassman, A.R.; Blinder, K.J.; Bressler, S.B.; Gonzalez, V.H.; Jampol, L.M.; Melia, M.; Sun, J.K.; et al. Early response to anti-vascular endothelial growth factor and two-year outcomes among eyes with diabetic macular edema in protocol T. Am. J. Ophthalmol. 2018, 195, 93–100. [Google Scholar] [CrossRef]
- Bressler, N.M.; Beaulieu, W.T.; Glassman, A.R.; Blinder, K.J.; Bressler, S.B.; Jampol, L.M.; Melia, M.; Wells, J.A.; Diabetic Retinopathy Clinical Research Network. Persistent macular thickening following intravitreous aflibercept, bevacizumab, or ranibizumab for central-involved diabetic macular edema with vision impairment: A secondary analysis of a randomized clinical trial. JAMA Ophthalmol. 2018, 136, 257–269. [Google Scholar] [CrossRef] [Green Version]
- Xue, K.; Yang, E.; Chong, N.V. Classification of diabetic macular oedema using ultra-widefield angiography and implications for response to anti-VEGF therapy. Br. J. Ophthalmol. 2017, 101, 559–563. [Google Scholar] [CrossRef]
- Ying, G.-S.; Huang, J.; Maguire, M.G.; Jaffe, G.J.; Grunwald, J.E.; Toth, C.; Daniel, E.; Klein, M.; Pieramici, D.; Wells, J.; et al. Baseline predictors for one-year visual outcomes with ranibizumab or bevacizumab for neovascular age-related macular degeneration. Ophthalmology 2013, 120, 122–129. [Google Scholar] [CrossRef] [Green Version]
- Chong, V.; Mitchell, P. Baseline predictors of 3-year responses to ranibizumab and laser photocoagulation therapy in patients with visual impairment due to diabetic macular edema (DME). Eur. J. Ophthalmol. 2013, 23, 446–462. [Google Scholar]
- Ehlers, J.P.; Jiang, A.C.; Boss, J.D.; Hu, M.; Figueiredo, N.; Babiuch, A.; Talcott, K.; Sharma, S.; Hach, J.; Le, T.; et al. Quantitative ultra-widefield angiography and diabetic retinopathy severity: An assessment of panretinal leakage index, ischemic index and microaneurysm count. Ophthalmology 2019, 126, 1527–1532. [Google Scholar] [CrossRef] [PubMed]
- Rodrigues, M.W.; Cardillo, J.A.; Messias, A.; Siquiera, R.C.; Scott, I.U.; Jorge, R. Bevacizumab versus triamcinolone for persistent diabetic macular edema: A randomized clinical trial. Graefe’s Arch. Clin. Exp. Ophthalmol. 2020, 258, 479–490. [Google Scholar] [CrossRef]
- Diabetic Retinopathy Clinical Research Network; Elman, M.J.; Qin, H.; Aiello, L.P.; Beck, R.W.; Bressler, N.M.; Ferris, F.L.; Glassman, A.R.; Maturi, R.K.; Melia, M. Intravitreal ranibizumab for diabetic macular edema with prompt versus deferred laser treatment: Three-year randomized trial results. Ophthalmology 2012, 119, 2312–2318. [Google Scholar] [CrossRef] [Green Version]
- Diabetic Retinopathy Clinical Research Network; Writing Committee; Aiello, L.P.; Beck, R.W.; Bressler, N.M.; Browning, D.J.; Davis, M.; Ferris, F.L.; Glassman, A.R.; Maturi, R.K.; et al. Rationale for the diabetic retinopathy clinical research network protocol for center-involved diabetic macular edema. Ophthalmology 2011, 118, e5–e14. [Google Scholar] [CrossRef] [Green Version]
- Vader, M.J.C.; Schauwvlieghe, A.-S.M.E.; Verbraak, F.D.; Dijkman, G.; Hooymans, J.M.M.; Los, L.I.; Zwinderman, A.H.; Peto, T.; Hoyng, C.B.; van Leeuven, R.; et al. Comparing the efficacy of bevacizumab and ranibizumab in patients with diabetic macular edema (BRDME). Ophthalmol. Retin. 2020, 2, 777–788. [Google Scholar] [CrossRef] [PubMed]
- Bressler, S.B.; Qin, H.; Beck, R.W.; Chalam, K.V.; Kim, J.E.; Melia, M.; Wells, J.A.; Diabetic Retinopathy Clinical Research Network. Factors associated with changes in visual acuity and central subfield thickness at 1 year after treatment for diabetic macular edema with ranibizumab. Arch. Ophthalmol. 2012, 130, 1153–1161. [Google Scholar] [CrossRef]
- Bro, T.; Derebecka, M.; Jørstad, Ø.K.; Grzybowski, A. Off-label use of bevacizumab for wet age-related macular degeneration in Europe. Graefe’s Arch. Clin. Exp. Ophthalmol. 2020, 258, 503–511. [Google Scholar] [CrossRef] [Green Version]
- Stefanini, F.R.; Arevalo, J.F.; Maia, M. Bevacizumab for the management of diabetic macular edema. World J. Diabetes 2013, 4, 19–26. [Google Scholar] [CrossRef]
- World Health Organization Model List of Essential Medicines: 21st List 2019; License: CC BY-NC-SA 3.0 IGO; World Health Organization: Geneva, Switzerland, 2019.
- Boyer, D.S.; Antoszyk, A.N.; Awh, C.C.; Bhisitkul, R.B.; Shapiro, H.; Acharya, N.R.; MARINA Study Group. Subgroup analysis of the MARINA study of ranibizumab in neovascular age-related macular degeneration. Ophthalmology 2007, 114, 246–252. [Google Scholar] [CrossRef] [PubMed]
- White, N.H.; Sun, W.; Cleary, P.A.; Danis, R.P.; Davis, M.D.; Hainsworth, D.P.; Hubbard, L.D.; LAchin, J.M.; Nathan, D.M. Prolonged effect of intensive therapy on the risk of retinopathy complications in patients with type 1 diabetes mellitus: 10 years after the Diabetes Control and Complications Trial. Arch. Ophthalmol. 2008, 126, 1707–1715. [Google Scholar] [PubMed] [Green Version]
- Dhoot, D.S.; Baker, K.; Saroj, N.; Vitti, R.; Berliner, A.J.; Metzig, C.; Thompson, D.; Singh, R.P. Baseline factors affecting changes in diabetic retinopathy severity scale score after intravitreal aflibercept or laser for diabetic macular edema: Post hoc analyses from VISTA and VIVID. Ophthalmology 2018, 125, 51–56. [Google Scholar] [CrossRef] [PubMed] [Green Version]


| Stage of Experiment | Activity | Methods |
|---|---|---|
| Recruitment | Initial interview | Chart survey |
| Diagnostics | Initial examination | Slit lamp examination |
| Qualification | 98 patients/eyes qualified | |
| Diagnostics—before IVB treatment | DME and DR assessment | UWFFA, SS-OCT, ETDRS chart testing |
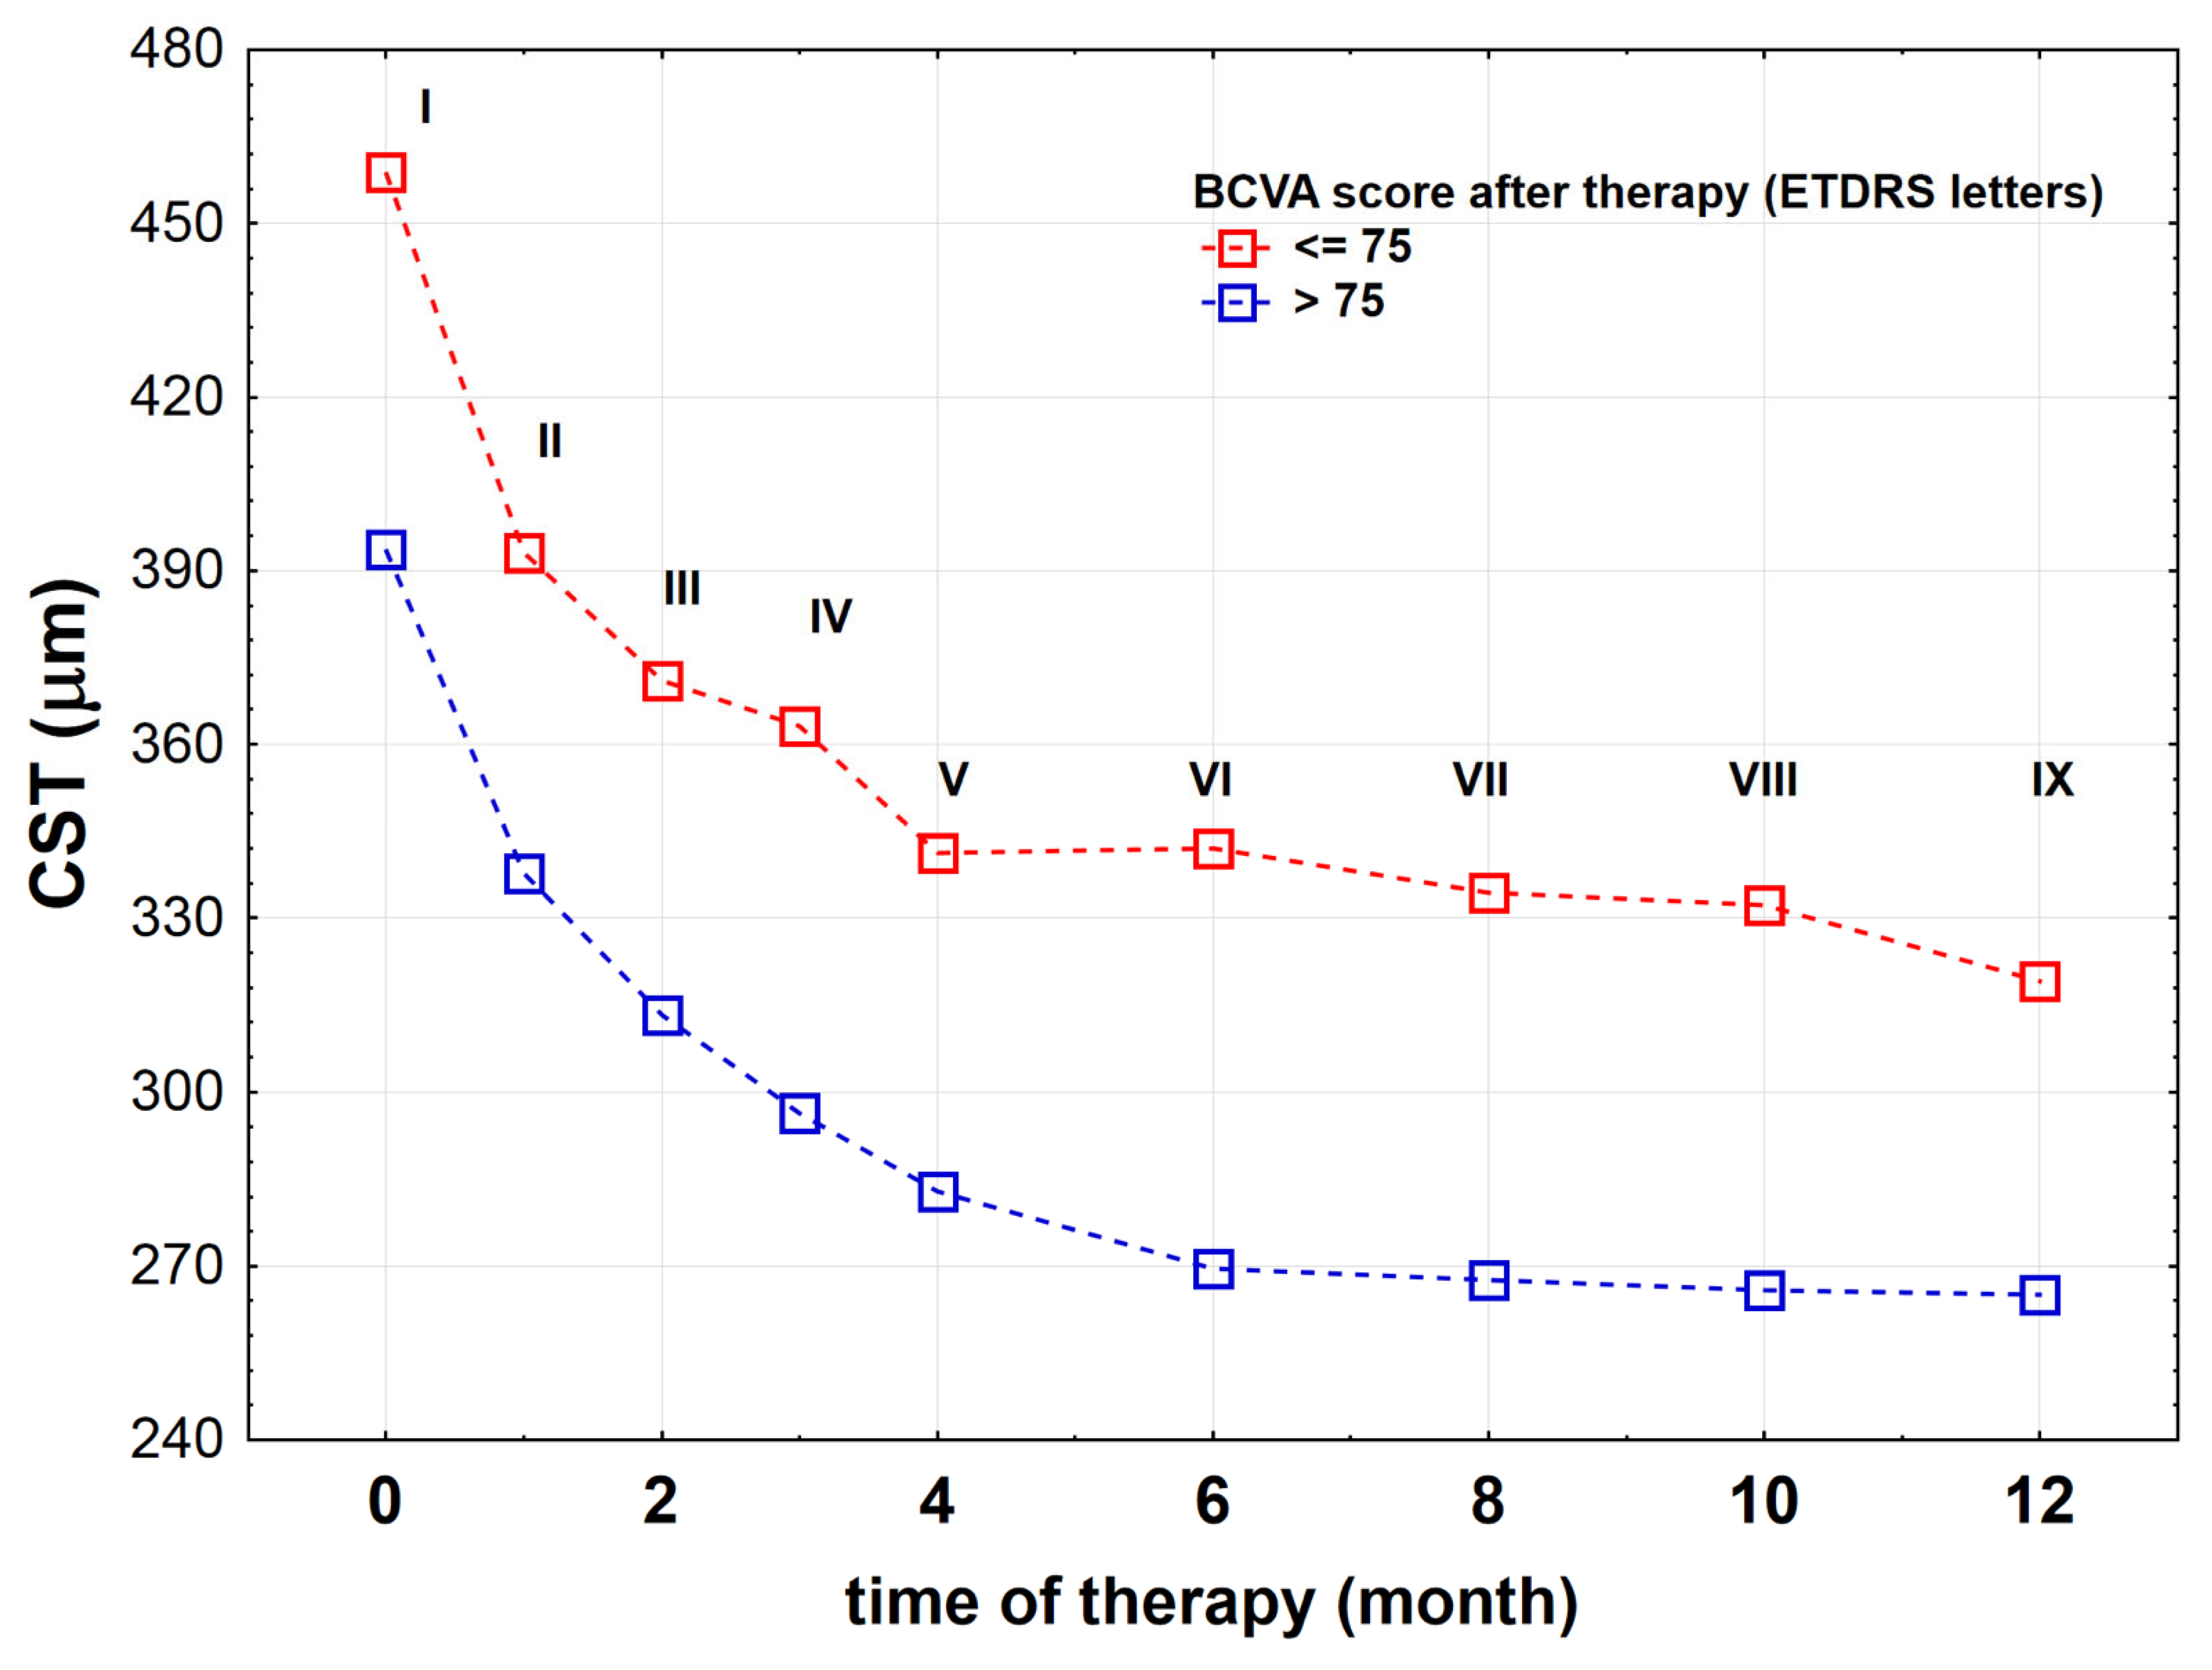
| Monitoring—during IVB treatment | IVB injection (I–V every month, VI–IX every two months) | SS-OCT before each intravitreal injection |
| Diagnostics—after IVB treatment | DME and DR assessment | UWFFA, SS-OCT, ETDRS chart testing |
| Initial analysis of the results | Distinguishing BCVA≤75 (n = 41) and BCVA>75 (n = 57) groups | |
| Final analysis of the results | Statistical analyses within groups | |
| Variable | Variants | BCVA≤75 n = 41 | BVCA>75 n = 57 | χ2 | p |
|---|---|---|---|---|---|
| Sex | female | 24 (59%) | 33 (58%) | 0.01 | 0.949 |
| male | 17 (41%) | 24 (42%) | |||
| Lens status | phakic | 19 (46%) | 31 (54%) | 0.618 | 0.432 |
| pseudophakic | 22 (54%) | 26 (46%) | |||
| Eye | right | 20 (49%) | 26 (46%) | 0.10 | 0.757 |
| left | 21 (51%) | 31 (54%) | |||
| DME | focal | 17 (41%) | 31 (54%) | 1.594 | 0.207 |
| diffuse | 24 (59%) | 26 (46%) | |||
| NPA | yes | 21 (51%) | 28 (49%) | 0.04 | 0.838 |
| no | 20 (49%) | 29 (51%) | |||
| Contrast vascular leakage (far periphery) | yes | 16 (39%) | 18 (32%) | 0.58 | 0.445 |
| no | 25 (61%) | 39 (68%) | |||
| Contrast vascular leakage (mid-periphery) | yes | 18 (44%) | 19 (33%) | 1.13 | 0.287 |
| no | 23 (56%) | 38 (67%) | |||
| Contrast vascular leackage (posterior zone) | yes | 19 (46%) | 34 (60%) | 1.70 | 0.192 |
| no | 22 (54%) | 23 (40%) | |||
| NPDR before therapy | mild | 6 (15%) | 20 (35%) | 7.07 | < 0.05 |
| moderate | 27 (66%) | 23 (40%) | |||
| severe | 8 (19%) | 14 (25%) | |||
| Hypertension | yes | 29 (71%) | 36 (63%) | 0.25 | 0.619 |
| no | 12 (29%) | 21 (37%) | |||
| Hypercholesterolemia | yes | 25 (61%) | 30 (53%) | 0.67 | 0.412 |
| no | 16 (39%) | 27 (47%) | |||
| Ischemic heart disease | yes | 5 (12%) | 12 (21%) | 1.30 | 0.253 |
| no | 36 (88%) | 45 (79%) | |||
| Kidney failure | yes | 5 (12%) | 2 (4%) | 2.71 | 0.100 |
| no | 36 (88%) | 55 (96%) | |||
| Insulin treatment | yes | 23 (56%) | 33 (58%) | 0.61 | 0.434 |
| no | 18 (44%) | 24 (42%) | |||
| Anticoagulant treatment | yes | 2 (5%) | 50 (88%) | 0.805 | 0.370 |
| no | 39 (95%) | 7 (12%) |
| Examined Parameter | Variables as Measured before Therapy | r/ρ * | p |
|---|---|---|---|
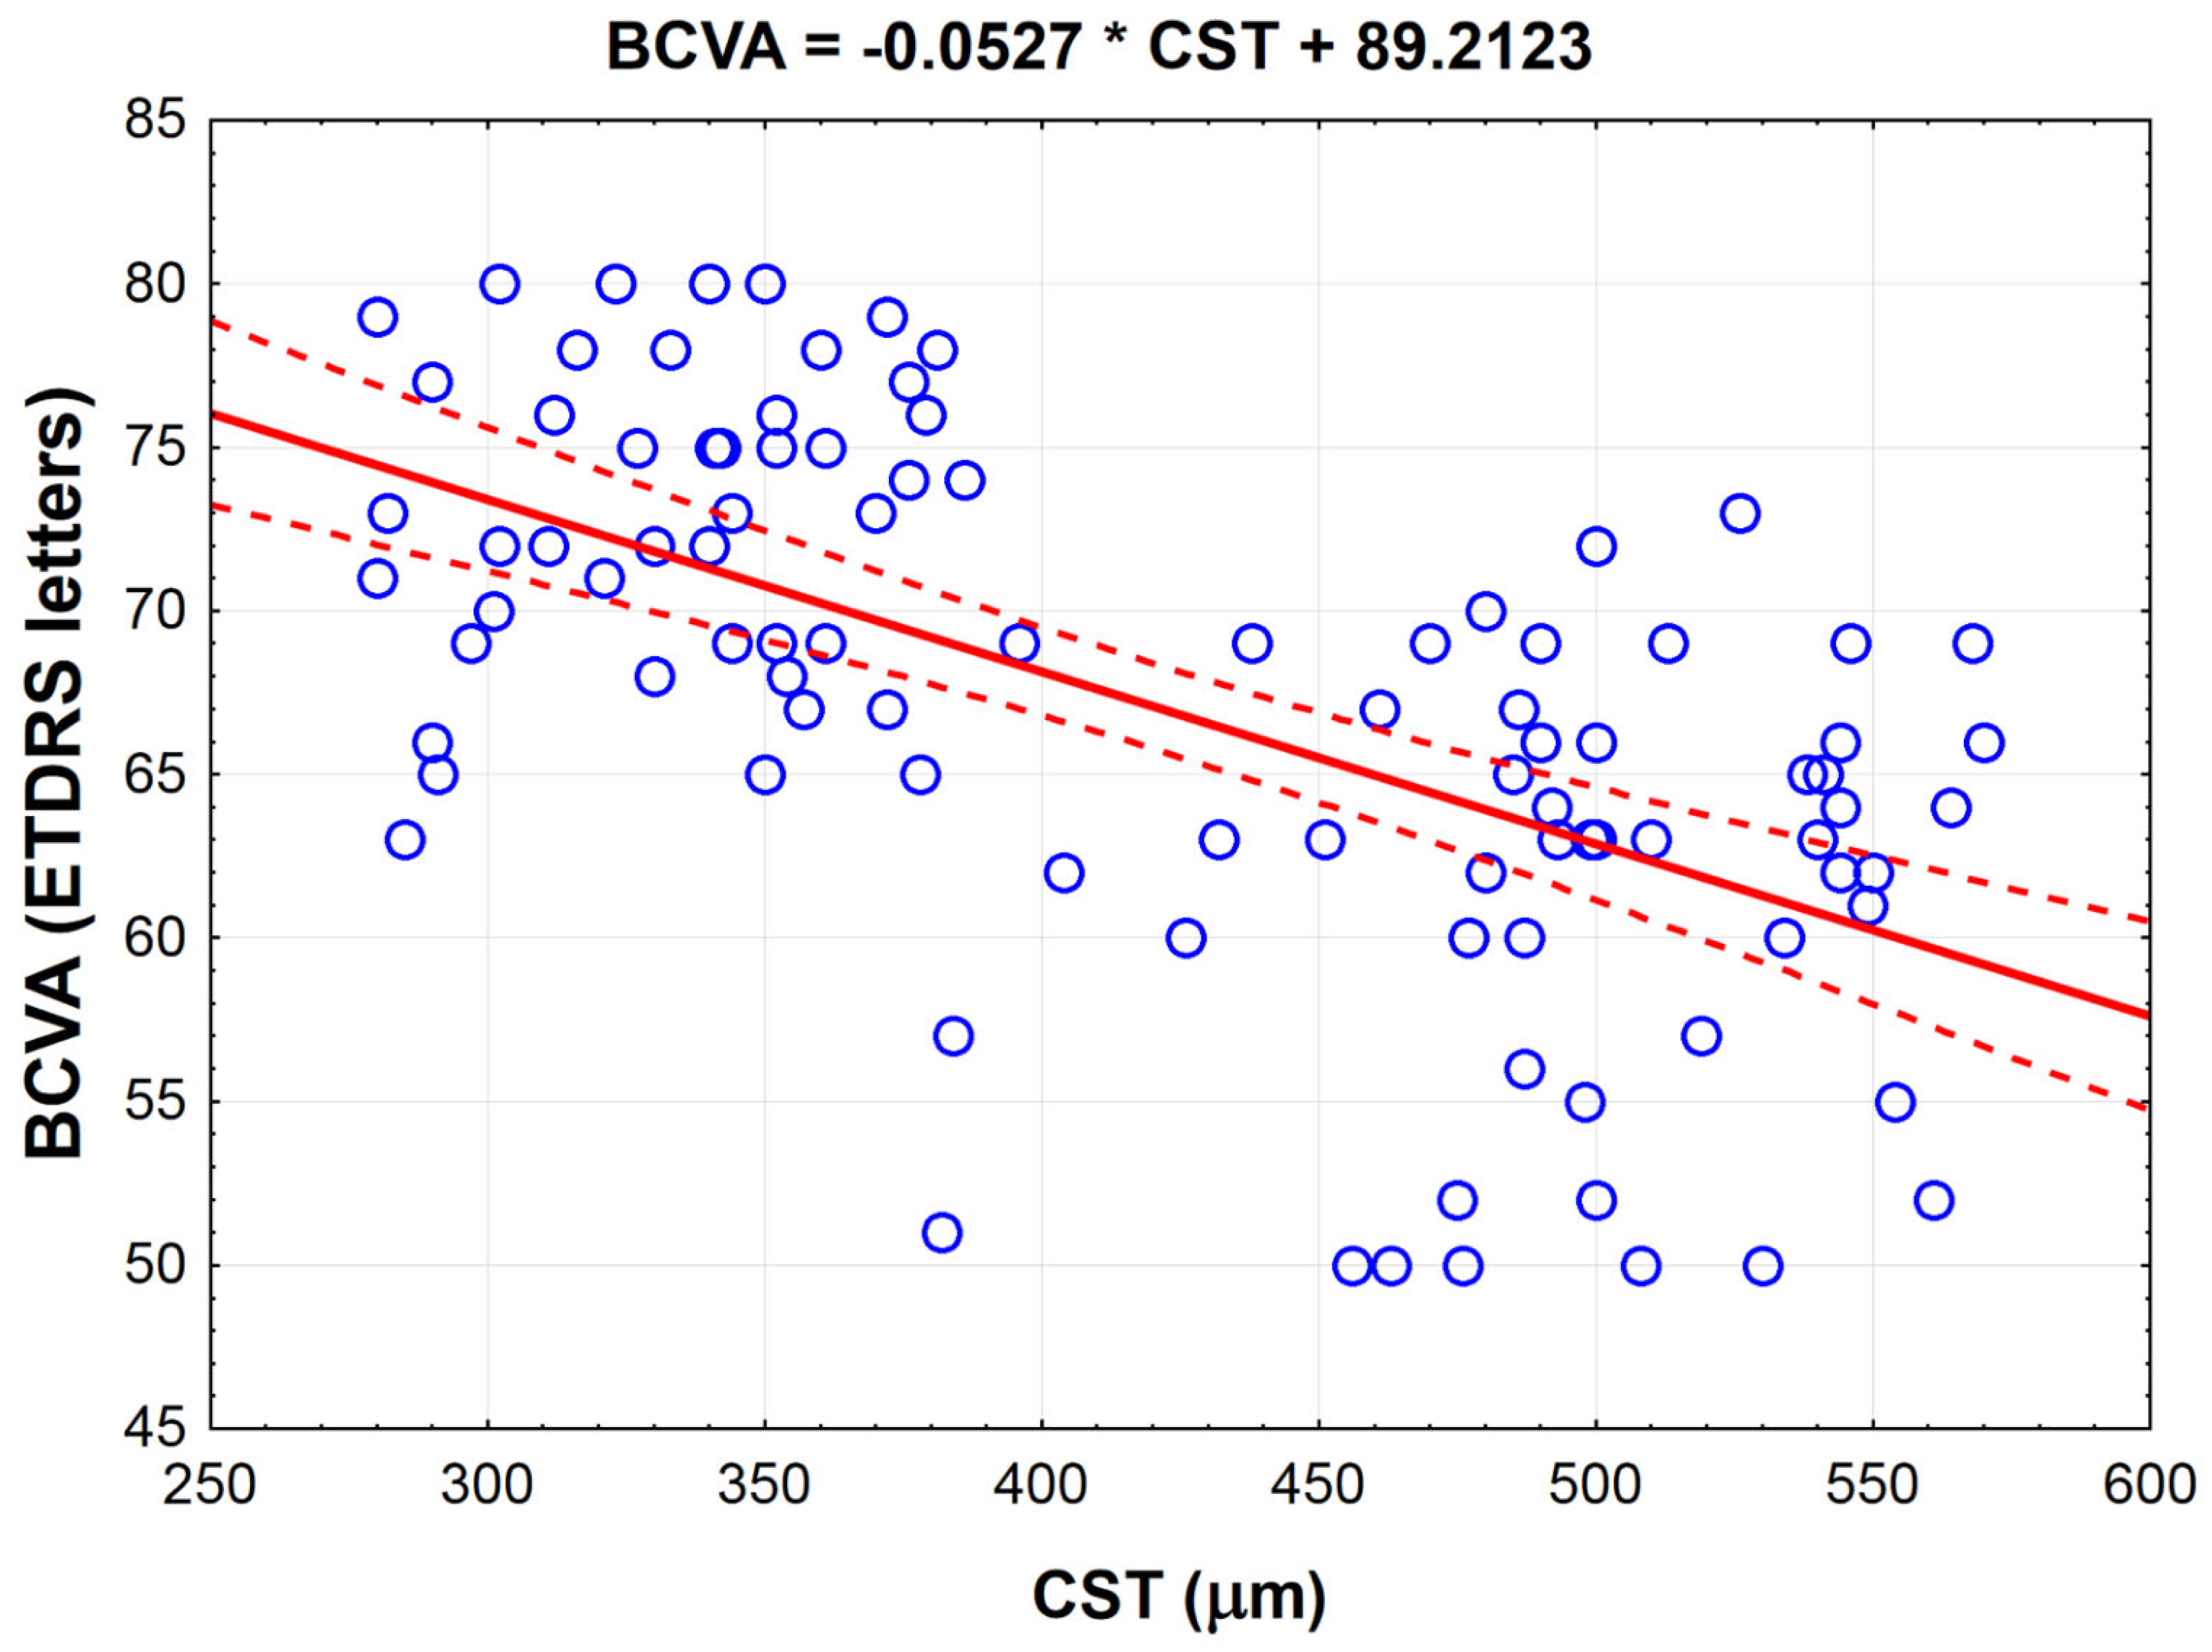
| BCVA (ETDRS letters) | CST (μm) | −0.591 | <0.001 |
| Total MA count (n) | −0.285 | <0.01 | |
| MA count in posterior zone (n) | −0.377 | <0.001 | |
| Total contrast leakage area (mm2) | −0.343 * | <0.001 | |
| Contrast leakage area in far periphery (mm2) | −0.252 * | <0.05 | |
| Contrast leakage area in mid-periphery (mm2) | −0.315 * | <0.01 | |
| Contrast leakage area in posterior zone (mm2) | −0.287 * | <0.01 | |
| Total NPA (mm2) | −0.272 * | <0.01 | |
| NPA in far periphery (mm2) | −0.303 * | <0.01 | |
| NPA in mid-periphery (mm2) | −0.314 * | <0.01 | |
| NPA in posterior zone (mm2) | −0.104 * | 0.309 | |
| Age (years) | −0.053 * | 0.602 | |
| T2DM duration (year) | −0.024 | 0.818 | |
| BMI (kg/m2) | −0.144 | 0.156 | |
| HbA1c (%) | −0.149 | 0.142 | |
| CST (μm) | BCVA (ETDRS letters) | −0.591 | <0.001 |
| Total MA count (n) | 0.389 | <0.001 | |
| MA count in posteriori (n) | 0.625 | <0.001 | |
| Total contrast leakage area (mm2) | 0.414 * | <0.001 | |
| Leakage area in far periphery (mm2) | 0.165 * | 0.104 | |
| Contrast leakage area in mid-periphery (mm2) | 0.130 * | 0.203 | |
| Contrast leakage area in posterior zone (mm2) | 0.515 * | <0.001 | |
| Total NPA (mm2) | 0.210 * | <0.05 | |
| NPA in far periphery (mm2) | 0.249 * | <0.05 | |
| NPA in mid-periphery (mm2) | 0.163 * | 0.109 | |
| NPA in posterior zone (mm2) | 0.033 * | 0.748 | |
| Age (years) | 0.150 | 0.141 | |
| T2DM duration (years) | −0.047 | 0.647 | |
| BMI (kg/m2) | 0.148 | 0.147 | |
| HbA1c (%) | 0.268 | <0.01 |
| Patients with NPDR Symptoms before Therapy [n] | Patients with NPDR Symptoms after Therapy [n] | |||
|---|---|---|---|---|
| Mild | Moderate | Severe | ||
| Mild | 26 | 26 (27%) | 0 (0%) | 0 (0%) |
| Moderate | 50 | 31 (32%) | 19 (19%) | 0 (0%) |
| Severe | 22 | 5 (5%) | 15 (15%) | 2 (2%) |
| Variables Correlating with NPDR | ρ | p |
|---|---|---|
| Total contrast leakage area | 0.773 | <0.001 |
| Contrast leakage area in far periphery | 0.545 | <0.001 |
| Contrast leakage in mid-periphery | 0.658 | <0.001 |
| Contrast leakage in posterior zone | 0.643 | <0.001 |
| Total NPA | 0.679 | <0.001 |
| NPA in far periphery | 0.514 | <0.001 |
| NPA in mid-periphery | 0.663 | <0.001 |
| NPA in posterior zone | 0.649 | <0.001 |
| Examined Parameters | Study Group | Before Bevacizumab Therapy | After Bevacizumab Therapy | pbefore vs.after |
|---|---|---|---|---|
| Total contrast leakage area [mm2] | BCVA≤75 | 23.0 (18.0;67.0) | 9.0 (4.0;15.0) | <0.001 |
| BCVA>75 | 29.0 (14.0;58.0) | 4.0 (2.0;10.0) | <0.001 | |
| p≤75 vs.>75 | 0.757 | <0.05 | ||
| Contrast leakage area in far periphery [mm2] | BCVA≤75 | 0.0 (0.0;9.0) | 0.0 (0.0;0.0) | <0.001 |
| BCVA>75 | 0.0 (0.0;10.0) | 0.0 (0.0;0.0) | <0.001 | |
| p≤75 vs.>75 | 0.743 | <0.05 | ||
| Contrast leakage area in mid-periphery [mm2] | BCVA≤75 | 4.0 (0.0;1.0) | 0.0 (0.0;3.0) | <0.001 |
| BCVA>75 | 3.0 (0.0;14.5) | 0.0 (0.0;2.0) | <0.001 | |
| p≤75 vs.>75 | 0.927 | 0.938 | ||
| Contrast leakage area in posterior [mm2] | BCVA≤75 | 20.0 (14.0;31.0) | 6.0 (4.0;12.0) | <0.001 |
| BCVA>75 | 20.0 (10.0; 31.0) | 4.0 (2.0;7.0) | <0.001 | |
| p≤75 vs.>75 | 0.572 | <0.05 | ||
| Total NPA [mm2] | BCVA≤75 | 11.0 (0.0;29.0) | 2.0 (0.0;16.0) | <0.001 |
| BCVA>75 | 0.0 (0.0;28.0) | 0.0 (0.0;4.0) | <0.001 | |
| p≤75 vs.>75 | 0.561 | 0.115 | ||
| NPA in far periphery [mm2] | BCVA≤75 | 0.0 (0.0;18.0) | 0.0 (0.0;9.0) | <0.01 |
| BCVA>75 | 0.0 (0.0;4.0) | 0.0 (0.0;0.0) | <0.01 | |
| p≤75 vs.>75 | 0.157 | 0.063 | ||
| NPA in mid-periphery [mm2] | BCVA≤75 | 0.0 (0.0;8.0) | 0.0 (0.0;2.0) | <0.001 |
| BCVA>75 | 0.0 (0.0;5.0) | 0.0 (0.0;0.0) | <0.001 | |
| p≤75 vs.>75 | 0.610 | 0.367 | ||
| NPA in posterior [mm2] | BCVA≤75 | 0.0 (0.0;4.0) | 0.0 (0.0;2.0) | <0.01 |
| BCVA>75 | 0.0 (0.0;4.0) | 0.0 (0.0;1.0) | <0.001 | |
| p≤75 vs.>75 | 0.804 | 0.640 |
| Variables | BCVA≤75 (n = 41) | BCVA>75 (n = 57) | p |
|---|---|---|---|
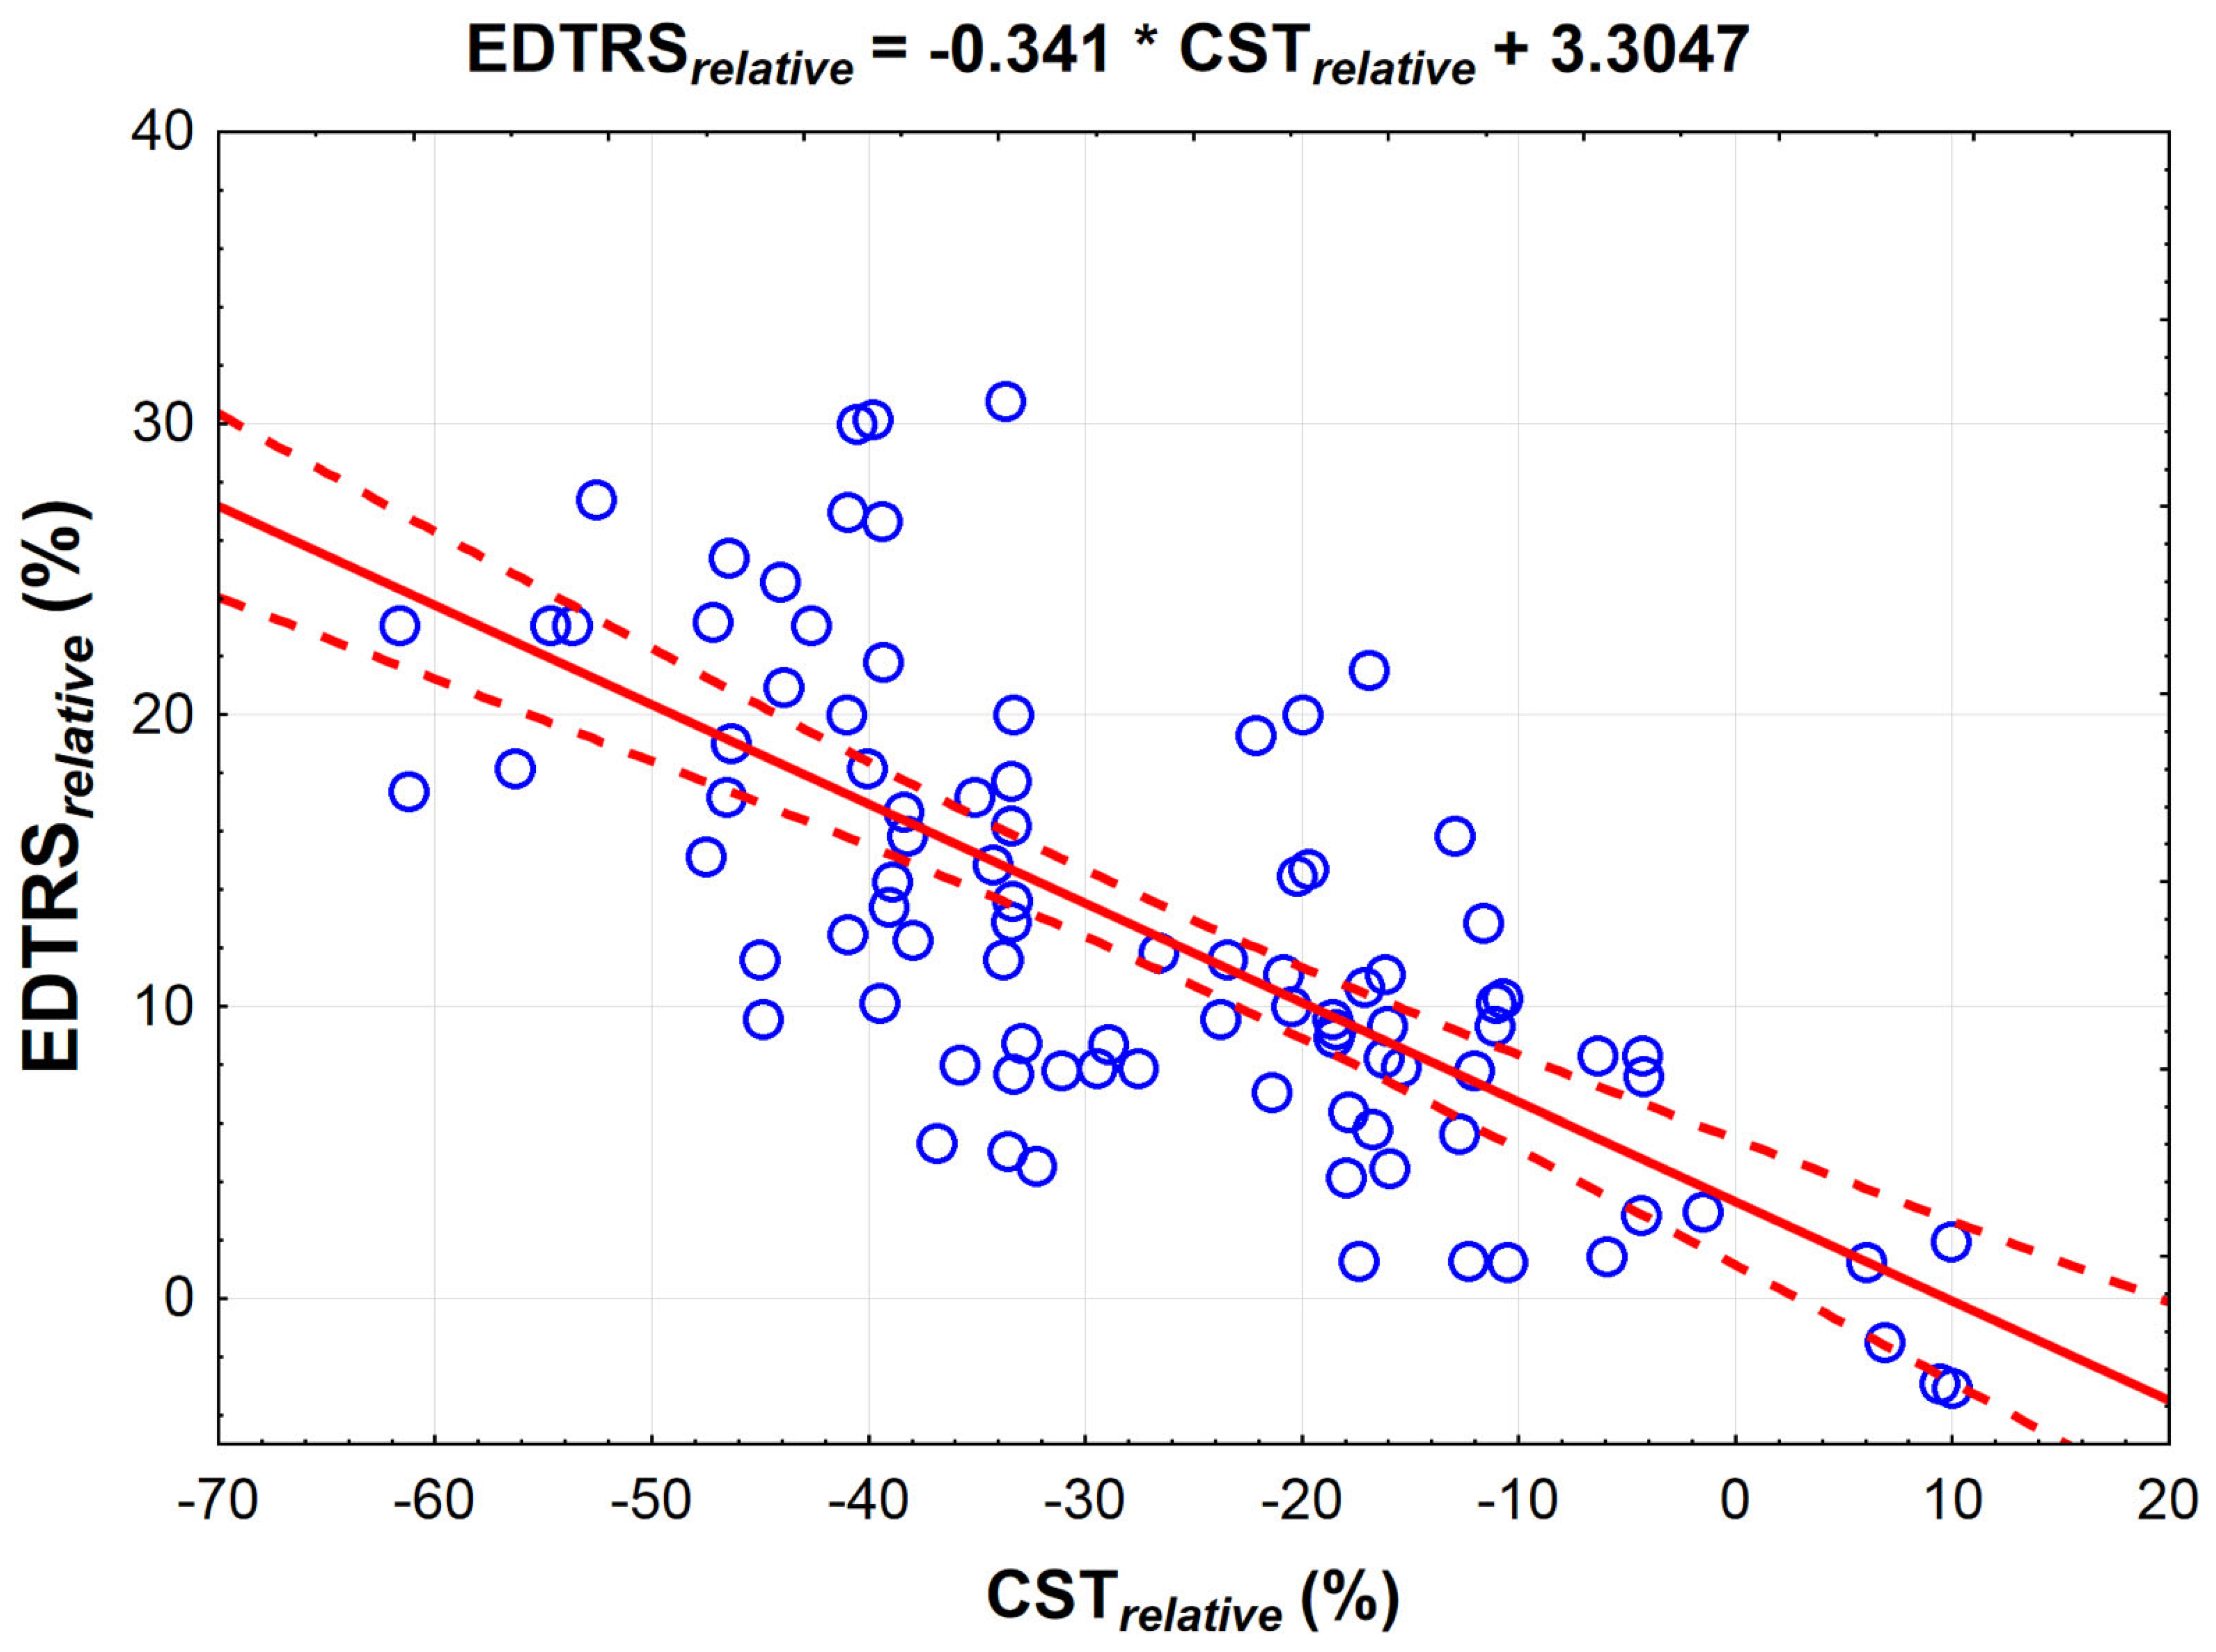
| BCVArelative | 13.6 (5.0;19.6) | 10.7 (8.0;17.3) | 0.954 |
| CSTrelative | −33.4 (−39.4;−12.9) | −27.6 (−39.8;−17.1) | 0.645 |
Publisher’s Note: MDPI stays neutral with regard to jurisdictional claims in published maps and institutional affiliations. |
© 2021 by the authors. Licensee MDPI, Basel, Switzerland. This article is an open access article distributed under the terms and conditions of the Creative Commons Attribution (CC BY) license (https://creativecommons.org/licenses/by/4.0/).
Share and Cite
Sędziak-Marcinek, B.; Wylęgała, A.; Chełmecka, E.; Wylęgała, E.; Teper, S. How to Achieve Near-Normal Visual Acuity with Bevacizumab in Diabetic Macular Edema Patients. J. Clin. Med. 2021, 10, 3572. https://doi.org/10.3390/jcm10163572
Sędziak-Marcinek B, Wylęgała A, Chełmecka E, Wylęgała E, Teper S. How to Achieve Near-Normal Visual Acuity with Bevacizumab in Diabetic Macular Edema Patients. Journal of Clinical Medicine. 2021; 10(16):3572. https://doi.org/10.3390/jcm10163572
Chicago/Turabian StyleSędziak-Marcinek, Bogumiła, Adam Wylęgała, Elżbieta Chełmecka, Edward Wylęgała, and Sławomir Teper. 2021. "How to Achieve Near-Normal Visual Acuity with Bevacizumab in Diabetic Macular Edema Patients" Journal of Clinical Medicine 10, no. 16: 3572. https://doi.org/10.3390/jcm10163572
APA StyleSędziak-Marcinek, B., Wylęgała, A., Chełmecka, E., Wylęgała, E., & Teper, S. (2021). How to Achieve Near-Normal Visual Acuity with Bevacizumab in Diabetic Macular Edema Patients. Journal of Clinical Medicine, 10(16), 3572. https://doi.org/10.3390/jcm10163572