
RP11-362K2.2:RP11-767I20.1 Genetic Variation Is Associated with Post-Reperfusion Therapy Parenchymal Hematoma. A GWAS Meta-Analysis

 , , , ,
  ,
,  , , , , , ,
  ,
,  , , , , , , , , , ,
Abstract
:1. Introduction
2. Materials and Methods
2.1. Subjects
2.1.1. Discovery Cohort
2.1.2. Replication Cohort
2.1.3. Variables
2.1.4. Eligibility Criteria
2.1.5. Standard Protocol Approvals and Patient Consent
2.2. Genotyping
2.2.1. Quality Control
2.2.2. Genome Build
2.3. Imputation
2.4. Genome-Wide Association Analysis and Meta-Analysis
2.5. Functional Annotation of Associated Variants
2.6. Estimation of Genetic Correlations
2.7. Statistical Analyses
2.8. Data Availability
3. Results
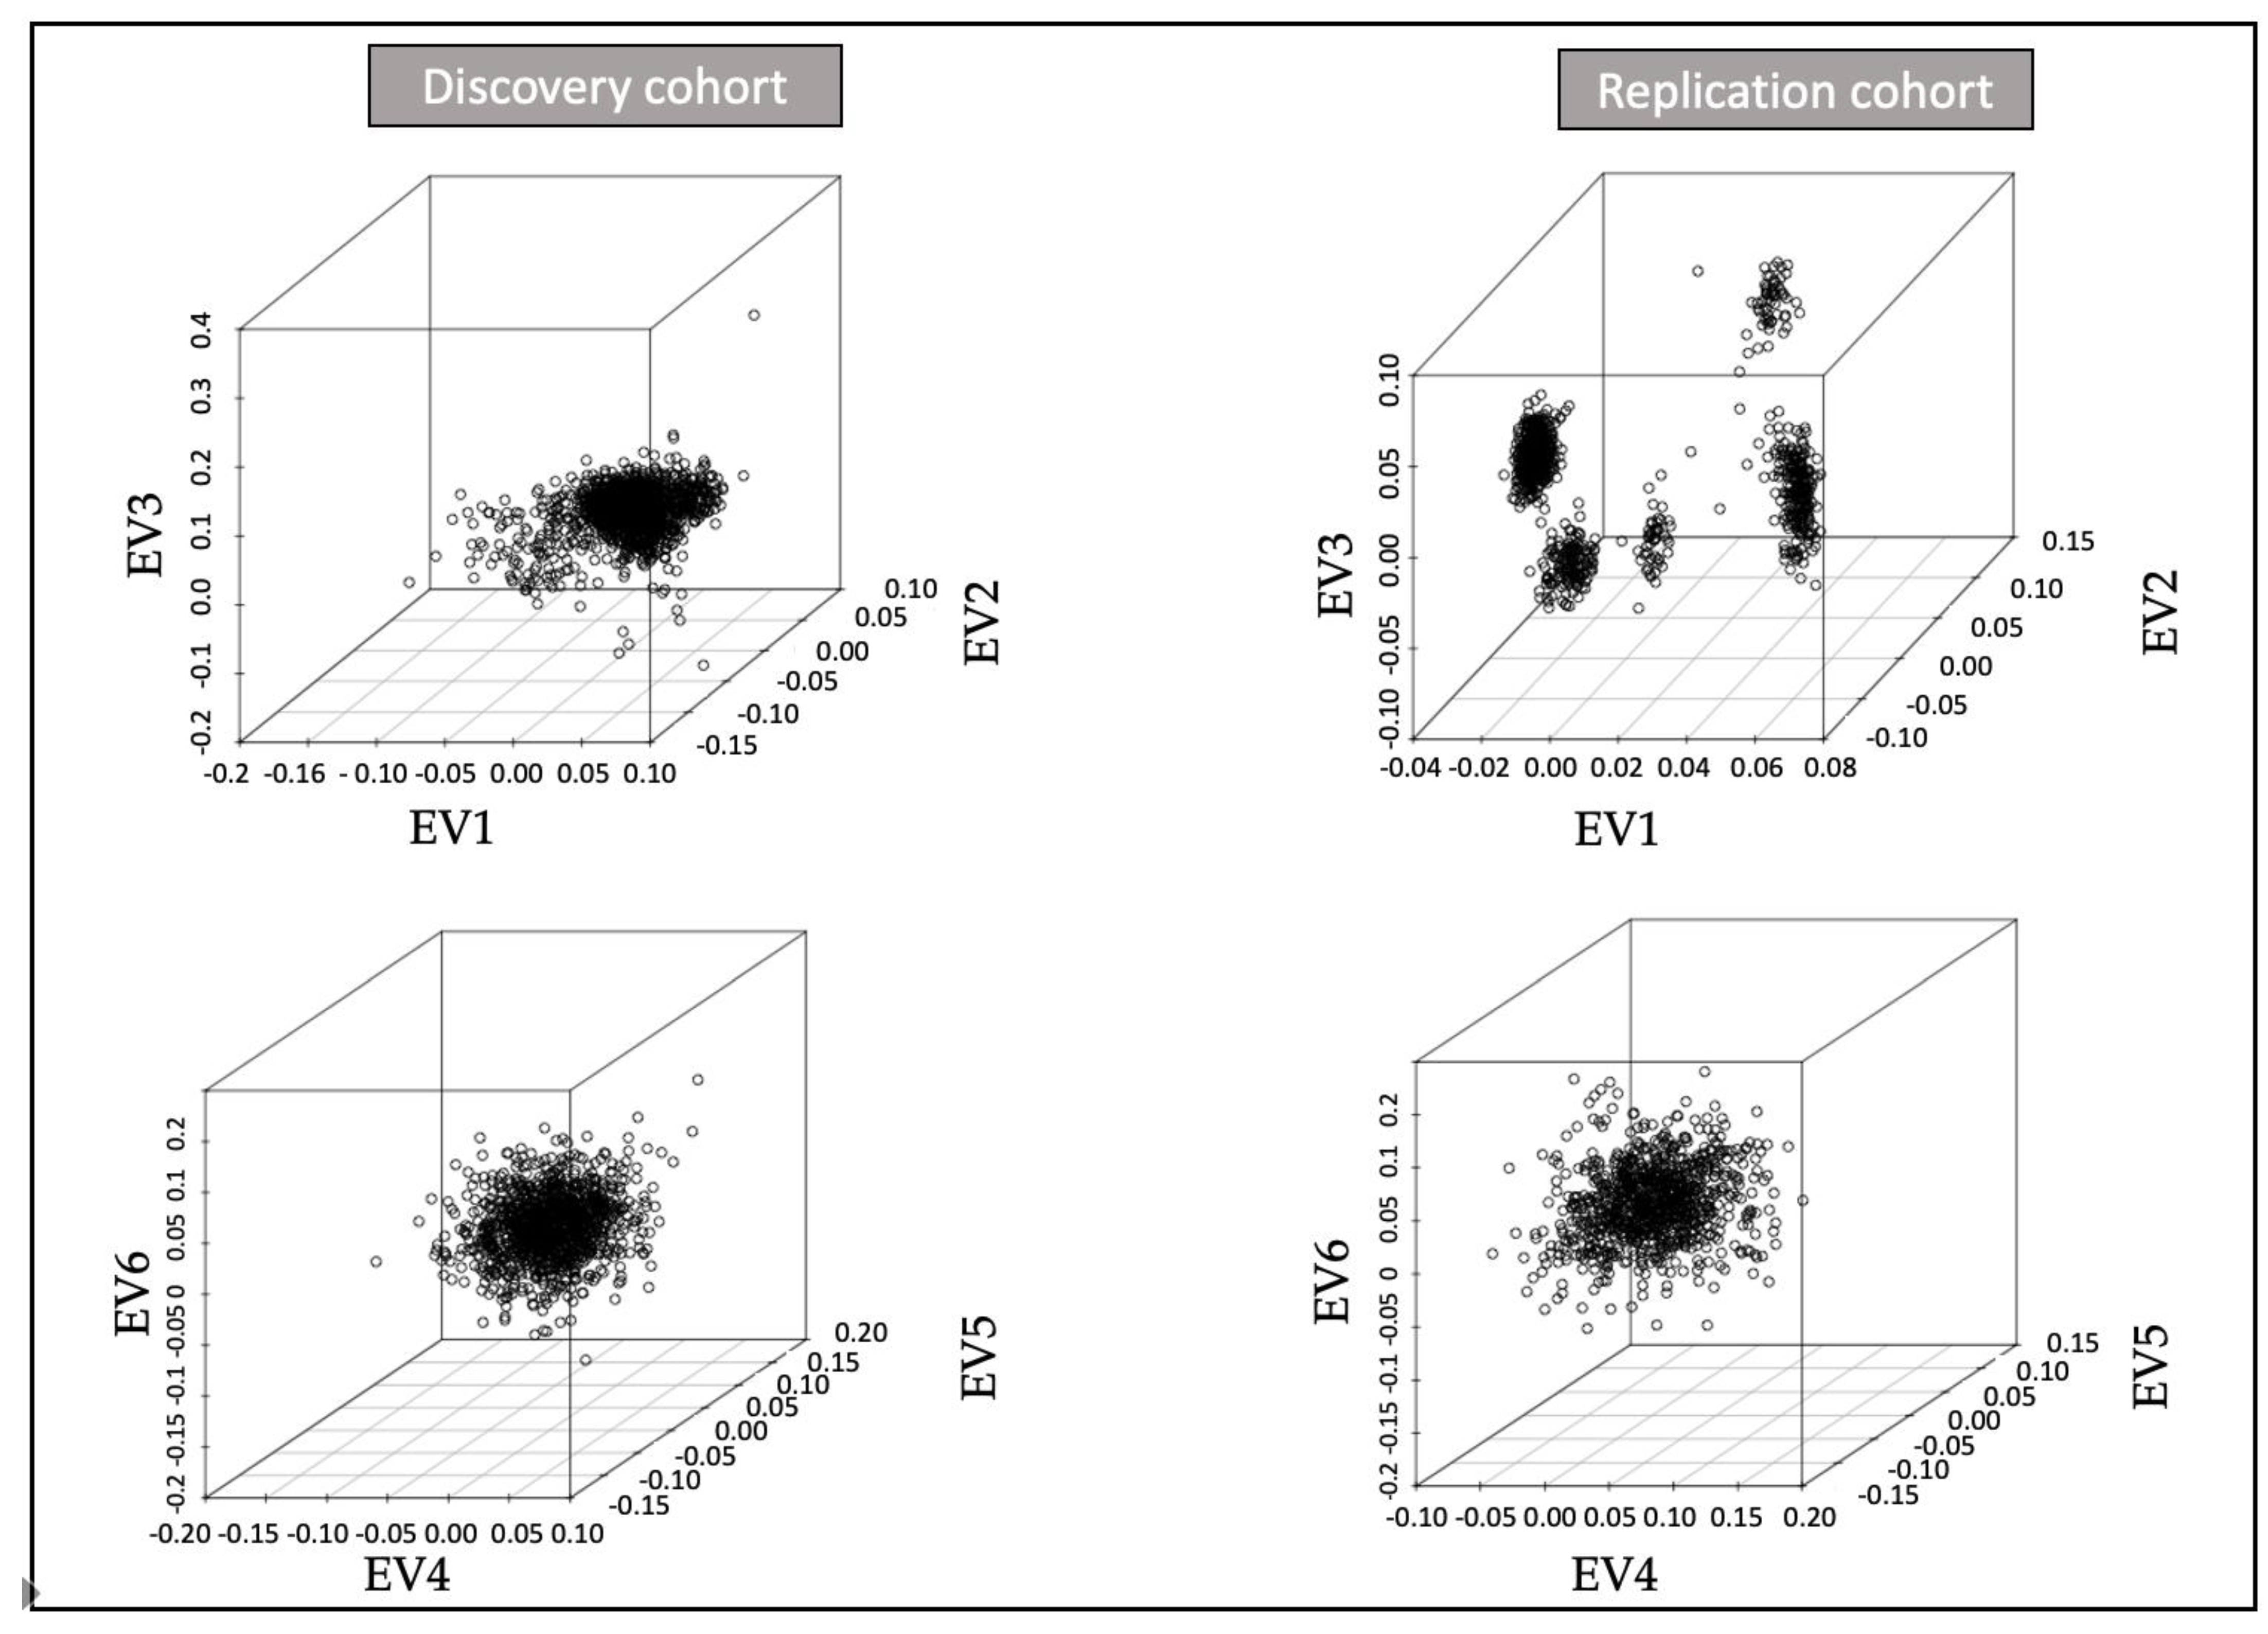
3.1. Descriptive Analysis of the Cohorts
3.1.1. Discovery
3.1.2. Replication
3.2. GWAS
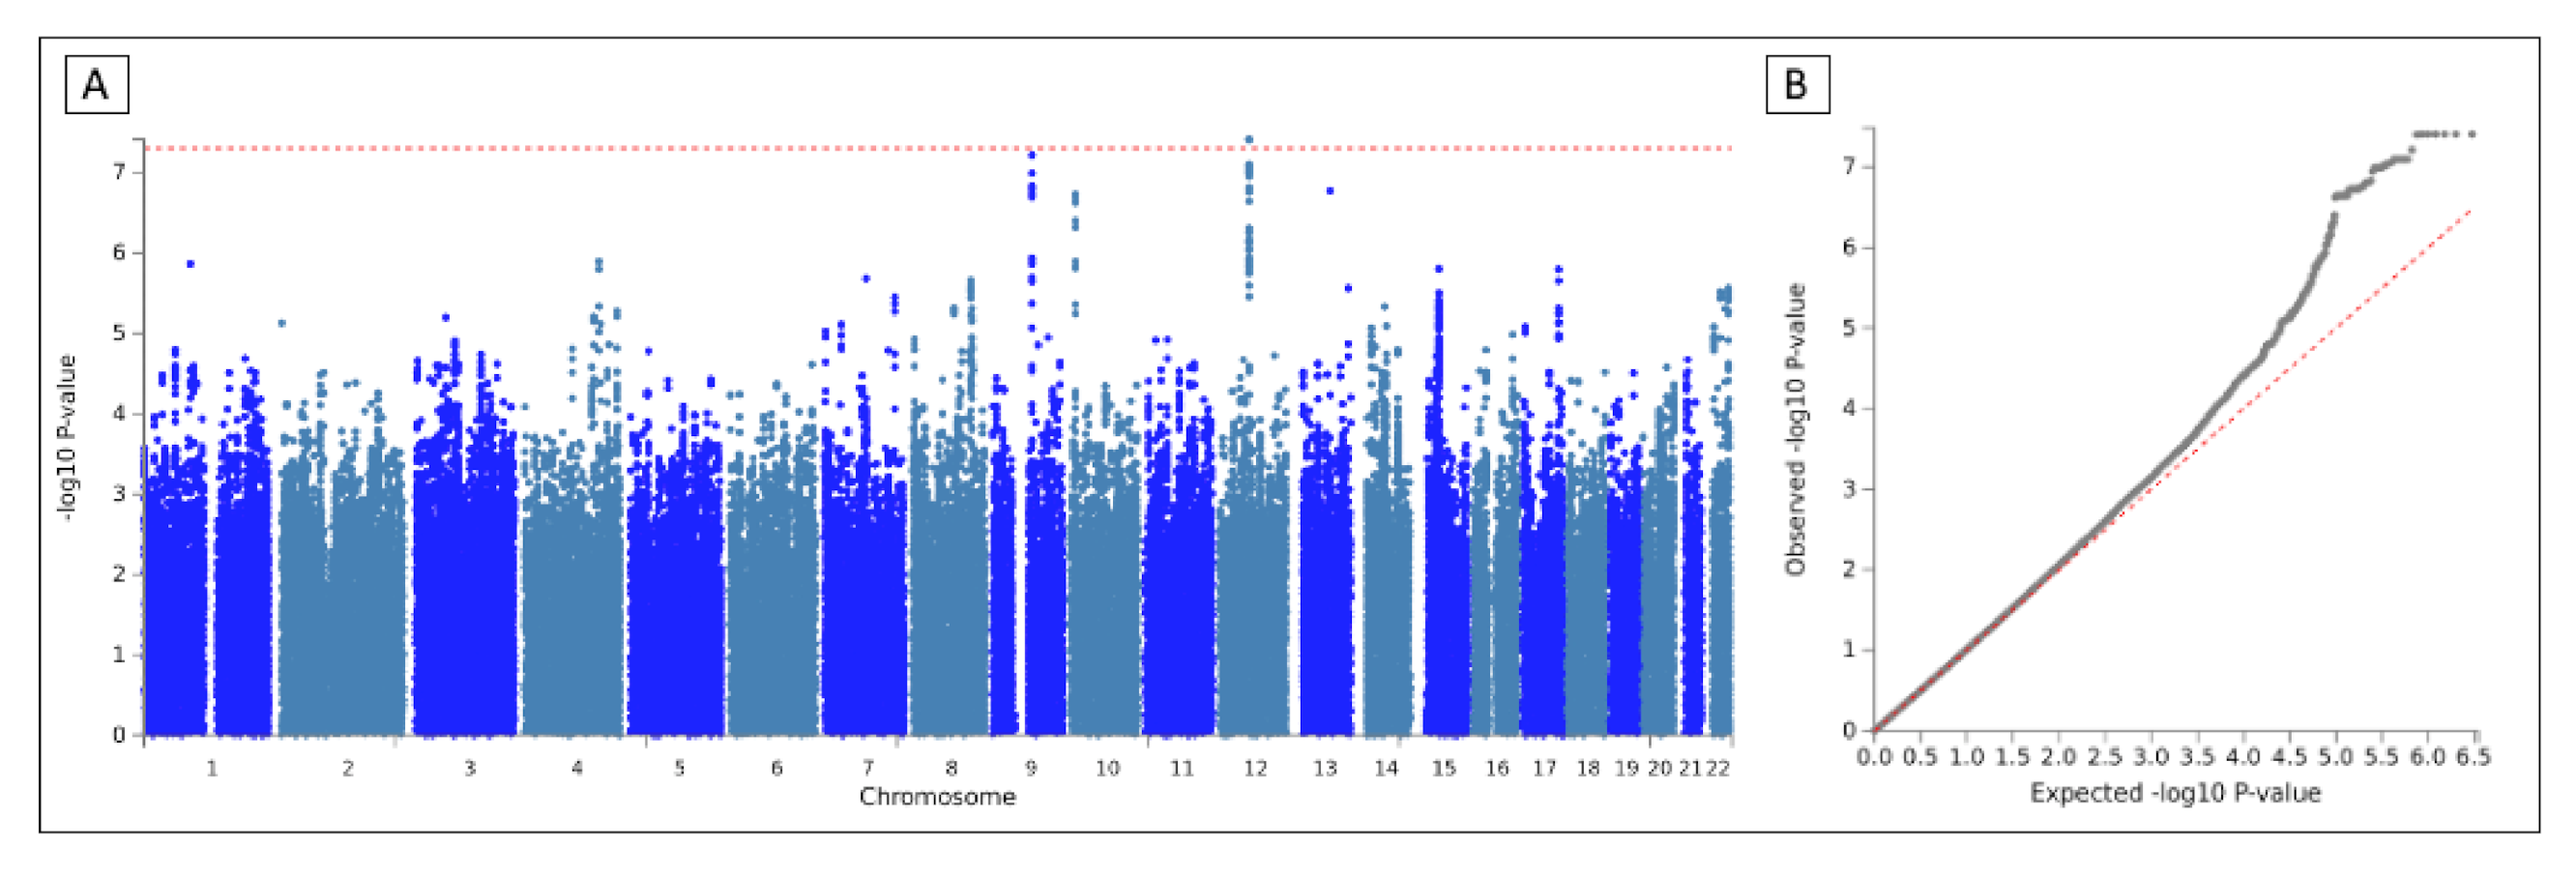
3.3. Meta-Analysis
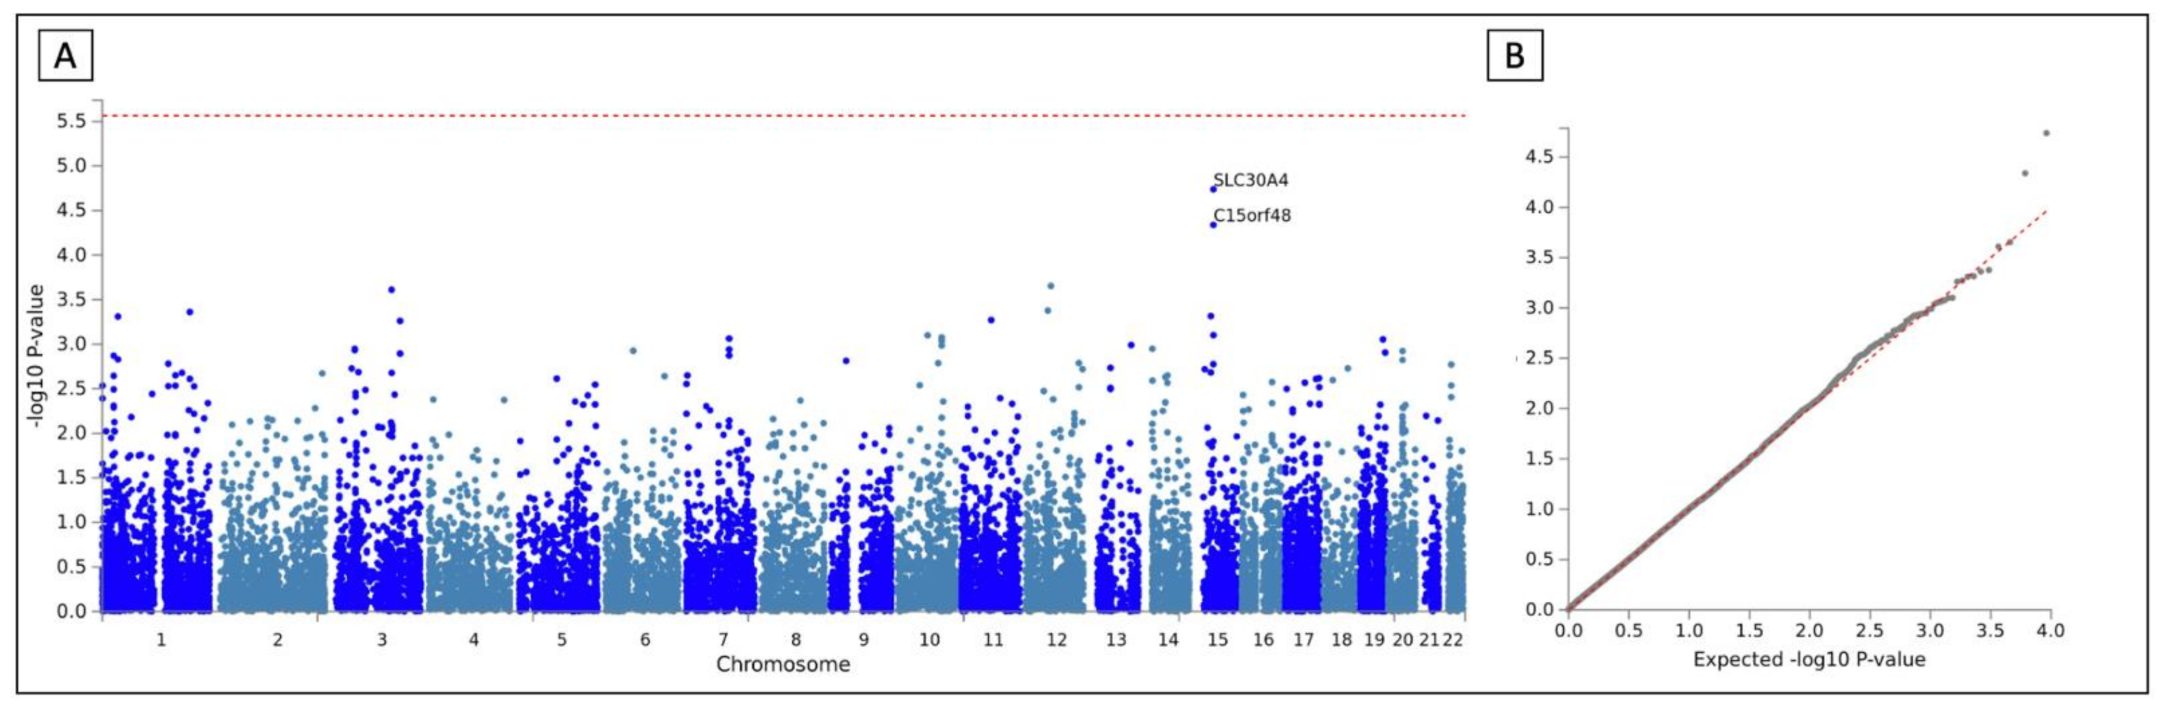
3.4. MAGMA Analysis and GO Terms
3.5. Genetic Correlations
4. Discussion
5. Conclusions
Supplementary Materials
Author Contributions
Funding
Institutional Review Board Statement
Informed Consent Statement
Data Availability Statement
Acknowledgments
Conflicts of Interest
References
- Feigin, V.L.; Norrving, B.; Mensah, G.A. Global Burden of Stroke. Circ. Res. 2017, 120, 439–448. [Google Scholar] [CrossRef]
- Fiorelli, M.; Bastianello, S.; von Kummer, R.; del Zoppo, G.J.; Larrue, V.; Lesaffre, E.; Ringleb, A.P.; Lorenzano, S.; Manelfe, C.; Bozzao, L. Hemorrhagic Transformation within 36 Hours of a Cerebral Infarct. Stroke 1999, 30, 2280–2284. [Google Scholar] [CrossRef]
- Pande, S.D.; Win, M.M.; Khine, A.A.; Zaw, E.M.; Manoharraj, N.; Lolong, L.; Tin, A.S. Haemorrhagic Transformation Following Ischaemic Stroke: A Retrospective Study. Sci. Rep. 2020, 10, 5319. [Google Scholar] [CrossRef] [PubMed] [Green Version]
- D’Amelio, M.; Terruso, V.; Famoso, G.; Di Benedetto, N.; Realmuto, S.; Valentino, F.; Ragonese, P.; Savettieri, G.; Aridon, P. Early and Late Mortality of Spontaneous Hemorrhagic Transformation of Ischemic Stroke. J. Stroke Cerebrovasc. Dis. 2014, 23, 649–654. [Google Scholar] [CrossRef] [Green Version]
- Thomalla, G.; Simonsen, C.Z.; Boutitie, F.; Andersen, G.; Berthezene, Y.; Cheng, B.; Cheripelli, B.; Cho, T.-H.; Fazekas, F.; Fiehler, J.; et al. MRI-Guided Thrombolysis for Stroke with Unknown Time of Onset. N. Engl. J. Med. 2018, 379, 611–622. [Google Scholar] [CrossRef] [PubMed] [Green Version]
- Nogueira, R.G.; Jadhav, A.P.; Haussen, D.C.; Bonafe, A.; Budzik, R.F.; Bhuva, P.; Yavagal, D.R.; Ribo, M.; Cognard, C.; Hanel, R.A.; et al. Thrombectomy 6 to 24 h after Stroke with a Mismatch between Deficit and Infarct. N. Engl. J. Med. 2018, 378, 11–21. [Google Scholar] [CrossRef]
- Albers, G.W.; Marks, M.P.; Kemp, S.; Christensen, S.; Tsai, J.P.; Ortega-Gutierrez, S.; McTaggart, R.A.; Torbey, M.T.; Kim-Tenser, M.; Leslie-Mazwi, T.; et al. Thrombectomy for Stroke at 6 to 16 h with Selection by Perfusion Imaging. N. Engl. J. Med. 2018, 378, 708–718. [Google Scholar] [CrossRef] [PubMed]
- del Río-Espínola, A.; Fernández-Cadenas, I.; Giralt, D.; Quiroga, A.; Gutiérrez-Agulló, M.; Quintana, M.; Fernández-Álvarez, P.; Domingues-Montanari, S.; Mendióroz, M.; Delgado, P.; et al. A Predictive Clinical-Genetic Model of Tissue Plasminogen Activator Response in Acute Ischemic Stroke. Ann. Neurol. 2012, 72, 716–729. [Google Scholar] [CrossRef]
- Carrera, C.; Cullell, N.; Torres-Águila, N.; Muiño, E.; Bustamante, A.; Dávalos, A.; López-Cancio, E.; Ribó, M.; Molina, C.A.; Giralt-Steinhauer, E.; et al. Validation of a Clinical-Genetics Score to Predict Hemorrhagic Transformations after RtPA. Neurology 2019, 93, e851–e863. [Google Scholar] [CrossRef]
- Carrera, C.; Cárcel-Márquez, J.; Cullell, N.; Torres-Águila, N.; Muiño, E.; Castillo, J.; Sobrino, T.; Campos, F.; Rodríguez-Castro, E.; Llucia-Carol, L.; et al. Single Nucleotide Variations in ZBTB46 Are Associated with Post-Thrombolytic Parenchymal Haematoma. Brain 2021. [Google Scholar] [CrossRef]
- Kunkle, B.W.; Grenier-Boley, B.; Sims, R.; Bis, J.C.; Damotte, V.; Naj, A.C.; Boland, A.; Vronskaya, M.; van der Lee, S.J.; Amlie-Wolf, A.; et al. Genetic Meta-Analysis of Diagnosed Alzheimer’s Disease Identifies New Risk Loci and Implicates Aβ, Tau, Immunity and Lipid Processing. Nat. Genet. 2019, 51, 414–430. [Google Scholar] [CrossRef] [Green Version]
- Chung, J.; Marini, S.; Pera, J.; Norrving, B.; Jimenez-Conde, J.; Roquer, J.; Fernandez-Cadenas, I.; Tirschwell, D.L.; Selim, M.; Brown, D.L.; et al. Genome-Wide Association Study of Cerebral Small Vessel Disease Reveals Established and Novel Loci. Brain 2019, 142, 3176–3189. [Google Scholar] [CrossRef] [PubMed]
- Mola-Caminal, M.; Carrera, C.; Soriano-Tárraga, C.; Giralt-Steinhauer, E.; Díaz-Navarro, R.M.; Tur, S.; Jiménez, C.; Medina-Dols, A.; Cullell, N.; Torres-Aguila, N.P.; et al. PATJ Low Frequency Variants Are Associated with Worse Ischemic Stroke Functional Outcome: A Genome-Wide Meta-Analysis. Circ. Res. 2019, 124, 114–120. [Google Scholar] [CrossRef]
- Fernández-Cadenas, I.; Mendióroz, M.; Giralt, D.; Nafria, C.; Garcia, E.; Carrera, C.; Gallego-Fabrega, C.; Domingues-Montanari, S.; Delgado, P.; Ribó, M.; et al. GRECOS Project (Genotyping Recurrence Risk of Stroke). Stroke 2017, 48, 1147–1153. [Google Scholar] [CrossRef] [Green Version]
- Heitsch, L.; Ibanez, L.; Carrera, C.; Pera, J.; Jimenez-Conde, J.; Slowik, A.; Strbian, D.; Fernandez-Cadenas, I.; Montaner, J.; Lee, J.-M. Meta-Analysis of Transethnic Association (MANTRA) Reveals Loci Associated with Neurological Instability after Acute Ischemic Stroke. In Proceedings of the International Stroke Conference, Houston, TX, USA, 21–24 February 2017. [Google Scholar]
- Roquer, J.; Rodríguez-Campello, A.; Gomis, M.; Jiménez-conde, J.; Cuadrado-godia, E.; Vivanco, R.; Giralt, E.; Sepúlveda, M.; Pont-Sunyer, C.; Cucurella, G.; et al. Acute Stroke Unit Care and Early Neurological Deterioration in Ischemic Stroke. J. Neurol. 2008, 255, 1012–1017. [Google Scholar] [CrossRef] [PubMed]
- Robberecht, W.; Vanhees, L.; Lemmens, R.; Pandolfo, M.; Thijs, V.; Goris, A. Variant on 9p21 Strongly Associates with Coronary Heart Disease, but Lacks Association with Common Stroke. Eur. J. Hum. Genet. 2009, 4, 1287–1293. [Google Scholar] [CrossRef]
- Charidimou, A.; Pasi, M. Microbleeds Evolution and Remote Hemorrhage Post-TPA: Red Meets White Revisited. Neurology 2019, 92, 307–308. [Google Scholar] [CrossRef] [PubMed]
- Jiang, L.; Zheng, Z.; Qi, T.; Kemper, K.E.; Wray, N.R.; Visscher, P.M.; Yang, J. A Resource-Efficient Tool for Mixed Model Association Analysis of Large-Scale Data. Nat. Genet. 2019, 51, 1749–1755. [Google Scholar] [CrossRef]
- Willer, C.J.; Li, Y.; Abecasis, G.R. METAL: Fast and Efficient Meta-Analysis of Genomewide Association Scans. Bioinformatics 2010, 26, 2190–2191. [Google Scholar] [CrossRef] [PubMed]
- Watanabe, K.; Taskesen, E.; Van Bochoven, A.; Posthuma, D. Functional Mapping and Annotation of Genetic Associations with FUMA. Nat. Commun. 2017, 8, 1826. [Google Scholar] [CrossRef] [Green Version]
- Malik, R.; Chauhan, G.; Traylor, M.; Sargurupremraj, M.; Okada, Y.; Mishra, A.; Rutten-Jacobs, L.; Giese, A.K.A.-K.; van der Laan, S.W.S.W.; Gretarsdottir, S.; et al. Multiancestry Genome-Wide Association Study of 520,000 Subjects Identifies 32 Loci Associated with Stroke and Stroke Subtypes. Nat. Genet. 2018, 50, 524–537. [Google Scholar] [CrossRef] [Green Version]
- Woo, D.; Falcone, G.J.; Devan, W.J.; Brown, W.M.; Biffi, A.; Howard, T.D.; Anderson, C.D.; Brouwers, H.B.; Valant, V.; Battey, T.W.K.; et al. Meta-Analysis of Genome-Wide Association Studies Identifies 1q22 as a Susceptibility Locus for Intracerebral Hemorrhage. Am. J. Hum. Genet. 2014, 94, 511–521. [Google Scholar] [CrossRef] [Green Version]
- Traylor, M.; Tozer, D.J.; Croall, I.D.; Lisiecka Ford, D.M.; Olorunda, A.O.; Boncoraglio, G.; Dichgans, M.; Lemmens, R.; Rosand, J.; Rost, N.S.; et al. Genetic Variation in PLEKHG1 Is Associated with White Matter Hyperintensities (n = 11,226). Neurology 2019, 92, E749–E757. [Google Scholar] [CrossRef] [Green Version]
- Willer, C.J.; Schmidt, E.M.; Sengupta, S.; Peloso, G.M.; Gustafsson, S.; Kanoni, S.; Ganna, A.; Chen, J.; Buchkovich, M.L.; Mora, S.; et al. Discovery and Refinement of Loci Associated with Lipid Levels. Nat. Genet. 2018, 176, 139–148. [Google Scholar] [CrossRef] [Green Version]
- Evangelou, E.; Warren, H.R.; Mosen-Ansorena, D.; Mifsud, B.; Pazoki, R.; Gao, H.; Ntritsos, G.; Dimou, N.; Cabrera, C.P.; Karaman, I.; et al. Genetic Analysis of over One Million People Identifies 535 New Loci Associated with Blood Pressure Traits. Nat. Genet. 2018, 50, 1412–1425. [Google Scholar] [CrossRef] [Green Version]
- Morris, A.P.; Voight, B.F.; Teslovich, T.M.; Ferreira, T.; Segre, A.V.; Steinthorsdottir, V.; Strawbridge, R.J.; Khan, H.; Grallert, H.; Mahajan, A.; et al. Large-Scale Association Analysis Provides Insights into the Genetic Architecture and Pathophysiology of Type 2 Diabetes. Nat. Genet. 2012, 44, 981–990. [Google Scholar] [CrossRef] [PubMed]
- Bennett, D.A. How Can I Deal with Missing Data in My Study? Aust. N. Z. J. Public Health 2001, 25, 464–469. [Google Scholar] [CrossRef]
- Müller, R.; Weirick, T.; John, D.; Militello, G.; Chen, W.; Dimmeler, S.; Uchida, S. ANGIOGENES: Knowledge Database for Protein-Coding and Noncoding RNA Genes in Endothelial Cells. Sci. Rep. 2016, 6, 1–8. [Google Scholar] [CrossRef] [PubMed] [Green Version]
- Wang, H.; Yang, J.; Schneider, J.A.; De Jager, P.L.; Bennett, D.A.; Zhang, H.Y. Genome-Wide Interaction Analysis of Pathological Hallmarks in Alzheimer’s Disease. Neurobiol. Aging 2020, 93, 61–68. [Google Scholar] [CrossRef] [PubMed]
- van der Meer, D.; Frei, O.; Kaufmann, T.; Shadrin, A.A.; Devor, A.; Smeland, O.B.; Thompson, W.K.; Fan, C.C.; Holland, D.; Westlye, L.T.; et al. Understanding the Genetic Determinants of the Brain with MOSTest. Nat. Commun. 2020, 11, 1–9. [Google Scholar] [CrossRef] [PubMed]
- Alshekhlee, A.; Li, C.C.; Chuang, S.Y.; Vora, N.; Edgell, R.C.; Kitchener, J.M.; Kale, S.P.; Feen, E.; Piriyawat, P.; Callison, R.C.; et al. Does Dementia Increase Risk of Thrombolysis?: A Case-Control Study. Neurology 2011, 76, 1575–1580. [Google Scholar] [CrossRef] [PubMed]
- Braemswig, T.B.; Villringer, K.; Turc, G.; Erdur, H.; Fiebach, J.B.; Audebert, H.J.; Endres, M.; Nolte, C.H.; Scheitz, J.F. Predictors of New Remote Cerebral Microbleeds after IV Thrombolysis for Ischemic Stroke. Neurology 2019, 92, E630–E638. [Google Scholar] [CrossRef] [PubMed]
- De Vries, P.S.; Brown, M.R.; Bentley, A.R.; Sung, Y.J.; Winkler, T.W.; Ntalla, I.; Schwander, K.; Kraja, A.T.; Guo, X.; Franceschini, N.; et al. Multiancestry Genome-Wide Association Study of Lipid Levels Incorporating Gene-Alcohol Interactions. Am. J. Epidemiol. 2019, 188, 1033–1054. [Google Scholar] [CrossRef] [Green Version]
- Noordam, R.; Bos, M.M.; Wang, H.; Winkler, T.W.; Bentley, A.R.; Kilpeläinen, T.O.; de Vries, P.S.; Sung, Y.J.; Schwander, K.; Cade, B.E.; et al. Multi-Ancestry Sleep-by-SNP Interaction Analysis in 126,926 Individuals Reveals Lipid Loci Stratified by Sleep Duration. Nat. Commun. 2019, 10, 5121. [Google Scholar] [CrossRef]
- Puig, N.; Montolio, L.; Camps-Renom, P.; Navarra, L.; Jiménez-Altayó, F.; Jiménez-Xarrié, E.; Sánchez-Quesada, J.L.; Benitez, S. Electronegative LDL Promotes Inflammation and Triglyceride Accumulation in Macrophages. Cells 2020, 9, 583. [Google Scholar] [CrossRef] [Green Version]
- Chen, M.H.; Raffield, L.M.; Mousas, A.; Sakaue, S.; Huffman, J.E.; Moscati, A.; Trivedi, B.; Jiang, T.; Akbari, P.; Vuckovic, D.; et al. Trans-Ethnic and Ancestry-Specific Blood-Cell Genetics in 746,667 Individuals from 5 Global Populations. Cell 2020, 182, 1198–1213. [Google Scholar] [CrossRef]
- Ahola-Olli, A.V.; Würtz, P.; Havulinna, A.S.; Aalto, K.; Pitkänen, N.; Lehtimäki, T.; Kähönen, M.; Lyytikäinen, L.P.; Raitoharju, E.; Seppälä, I.; et al. Genome-Wide Association Study Identifies 27 Loci Influencing Concentrations of Circulating Cytokines and Growth Factors. Am. J. Hum. Genet. 2017, 100, 40–50. [Google Scholar] [CrossRef] [Green Version]
- Zhang, R.; Wu, X.; Hu, W.; Zhao, L.; Zhao, S.; Zhang, J.; Chu, Z.; Xu, Y. Neutrophil-to-Lymphocyte Ratio Predicts Hemorrhagic Transformation in Ischemic Stroke: A Meta-Analysis. Brain Behav. 2019, 9, 1–9. [Google Scholar] [CrossRef]
- Shi, K.; Zou, M.; Jia, D.M.; Shi, S.; Yang, X.; Liu, Q.; Dong, J.F.; Sheth, K.N.; Wang, X.; Shi, F.D. TPA Mobilizes Immune Cells That Exacerbate Hemorrhagic Transformation in Stroke. Circ. Res. 2021, 128, 62–75. [Google Scholar] [CrossRef]
- Kim, T.J.; Park, H.K.; Kim, J.M.; Lee, J.S.; Park, S.H.; Jeong, H.B.; Park, K.Y.; Rha, J.H.; Yoon, B.W.; Ko, S.B. Blood Pressure Variability and Hemorrhagic Transformation in Patients with Successful Recanalization after Endovascular Recanalization Therapy: A Retrospective Observational Study. Ann. Neurol. 2019, 85, 574–581. [Google Scholar] [CrossRef] [PubMed]
- Langford, G.M.; Molyneaux, B.J. Myosin V in the Brain: Mutations Lead to Neurological Defects. Brain Res. Rev. 1998, 28, 1–8. [Google Scholar] [CrossRef]
- Montaner, J.; Molina, C.A.; Monasterio, J.; Abilleira, S.; Arenillas, J.F.; Ribó, M.; Quintana, M.; Alvarez-Sabín, J. Matrix Metalloproteinase-9 Pretreatment Level Predicts Intracranial Hemorrhagic Complications after Thrombolysis in Human Stroke. Circulation 2003, 107, 598–603. [Google Scholar] [CrossRef] [PubMed] [Green Version]
- Cuadrado, E.; Ortega, L.; Hernández-Guillamon, M.; Penalba, A.; Fernández-Cadenas, I.; Rosell, A.; Montaner, J. Tissue Plasminogen Activator (t-PA) Promotes Neutrophil Degranulation and MMP-9 Release. J. Leukoc. Biol. 2008, 84, 207–214. [Google Scholar] [CrossRef]
- Zheng, L.; Xiong, Y.; Liu, J.; Yang, X.; Wang, L.; Zhang, S.; Liu, M.; Wang, D. MMP-9-Related MicroRNAs as Prognostic Markers for Hemorrhagic Transformation in Cardioembolic Stroke Stroke Patients. Front. Neurol. 2019, 10, 1–7. [Google Scholar] [CrossRef] [PubMed]

| Study | Total | Cases | Controls | Arrays | Batches | Country |
|---|---|---|---|---|---|---|
| GenoTPA [9] | 240 | 34 | 180 | HumanOmni1-Quad BeadChip (Illumina) | 1 | Spain |
| GODS [13] | 993 | 28 | 342 | HumanCoreExome (Illumina) | 1 | Spain |
| GRECOS [14] | 214 | 3 | 0 | HumanCoreExome (Illumina) | 1 | Spain |
| GENISIS [15] | 3220 | 96 | 714 | HumanCoreExome (Illumina) | 5 | Spain |
| Total | 4667 | 161 | 1236 | 8 | Spain |
| Study | Total | Cases | Controls | Arrays | Batches | Country |
|---|---|---|---|---|---|---|
| GenoTPA [9] | 157 | 36 | 121 | HumanOmni1-Quad BeadChip (Illumina) | 1 | Spain |
| BASICMAR | 91 | 8 | 83 | Human Omni Quad 5M (Illumina) | 1 | Spain |
| LSGS | 45 | 8 | 37 | Human Omni Quad 5M (Illumina) | 1 | Belgium |
| HELSINKI2000 | 164 | 12 | 152 | HumanCoreExome (Illumina) | 1 | Finland |
| GENISIS [15] | 70 | 2 | 68 | HumanCoreExome (Illumina) | 1 | Finland |
| 53 | 4 | 49 | HumanCoreExome (Illumina) | 1 | Poland | |
| 484 | 42 | 403 | HumanCoreExome (Illumina) | 1 | Spain | |
| Total | 1064 | 112 | 913 | 7 | Spain |
| Variables (Number of Observations) | Controls (n = 1003) | Cases (n = 141) | p-Value | OR (95% IC) |
|---|---|---|---|---|
| Age (n= 1142) | 75 ± 16 | 77 ± 12 | 6.70 × 10⁻² | |
| Sex (n = 1144), male | 55% (548/1003) | 52% (73/141) | 5.29 × 10⁻¹ | 0.89 (0.62–1.29) |
| HTN (n = 1138) | 64% (634/998) | 65% (91/140) | 7.79 × 10⁻¹ | 1.07 (0.73–1.58) |
| DM (n = 1143) | 22% (225/1002) | 30% (42/141) | 5.64 × 10⁻² | 1.46 (0.97–2.19) |
| DLP (n = 821) | 38% (279/728) | 37% (34/93) | 8.21 × 10⁻¹ | 0.93 (0.57–1.48) |
| AF (n = 1140) | 37% (299/999) | 38% (53/141) | 7.93 × 10⁻² | 1.41 (0.96–2.07) |
| SH (n = 788) | 21% (148/698) | 18% (16/90) | 3.93 × 10⁻¹ | 0.8 (0.42–1.44) |
| NIHSS (n = 1141) | 14 ± 11 | 17 ± 9 | 4.11 × 10⁻⁴ | |
| mRS (n = 587) | 0 ± 1 | 0 ± 1 | 1.84 × 10⁻² | |
| Gly (n = 1104) | 119 ± 44 | 127 ± 49 | 1.02 × 10⁻¹ | |
| SBP (n = 705) | 153 ± 35 | 158 ± 37 | 2.50 × 10⁻¹ | |
| DBP (n = 731) | 80 ± 20 | 80 ± 20 | 4.47 × 10⁻¹ | |
| IA (n = 708) | 5% (28/620) | 13% (11/88) | 5.12 × 10⁻³ | 3.01 (1.30–6.55) |
| TM (n = 336) | 6% (17/286) | 0% (0/50) | 8.72 × 10⁻² | 0 (0–1.36) |
| CES (n = 1115) | 46% (451/977) | 55% (76/138) | 5.57 × 10⁻² | 1.43 (0.98–2.08) |
| LAS (n = 1115) | 20% (193/977) | 9% (11/138) | 3.91 × 10⁻⁴ | 0.35 (0.17–0.67) |
| SVO (n = 1115) | 1% (12/977) | 1% (2/138) | 6.88 × 10⁻¹ | 1.18 (0.13–5.40) |
| Variables (Number of Observations) | Controls (n = 819) | Cases (n = 76) | p-Value | OR (95% IC) |
|---|---|---|---|---|
| Age (n = 895) | 72 ± 17 | 76 ± 11 | 9.82 × 10⁻³ | |
| Sex (n = 895), male | 52% (425/819) | 53% (40/76) | 1 | 1.03 (0.63–1.7) |
| DM (n = 643) | 18% (103/586) | 16% (9/57) | 8.56 × 10⁻¹ | 0.88 (0.37–1.89) |
| AF (n = 770) | 32% (223/700) | 49% (34/70) | 7.40 × 10⁻³ | 2.02 (1.19–3.42) |
| NIHSS (n = 895) | 11 ± 11 | 16 ± 8 | 6.33 × 10⁻⁶ | |
| Gly (n = 464) | 120 ± 42 | 135 ± 52 | 1.35 × 10⁻¹ | |
| CES (n = 670) | 60% (365/604) | 77% (51/66) | 7.36 × 10⁻³ | 2.22 (1.20–4.36) |
| ID | Rs | p-Value | Beta (SE) | MAF | Nearest Gene | Func | RDB | eQTL | GO Terms |
|---|---|---|---|---|---|---|---|---|---|
| 12:59127963:A:G | rs79770152 | Metal: 3.90 × 10⁻⁸ DC: 2.18 × 10⁻⁵ RC: 3.79 × 10⁻⁵ | 0.0895 (0.0152) (++) | 9% | RP11-362K2.2:RP11-767I20.1 | ncRNA (intronic) | 7 | ||
| 9:78563802:G:T | rs13297983 | Metal: 6.10 × 10⁻⁸ DC: 7.80 × 10⁻⁷ RC: 1.00 × 10⁻³ | 0.0968 (0.0166) (++) | 7% | PCSK5 | Intronic | 7 | Renin secretion into blood stream, proteolysis, heart development | |
| 13:73655521:G:T | rs1537385 | Metal: 1.69 × 10⁻⁷ DC: 1.11 × 10⁻⁴ RC: 4.09 × 10⁻⁵ | −0.1096 (0.0195) (--) | 4% | KLF5 | Intergenic | 3a | Angiogenesis | |
| 10:10130938:A:G | rs35246078 | Metal: 1.87 × 10⁻⁷ DC: 1.50 × 10⁻⁴ RC: 3.57 × 10⁻⁵ | 0.1091 (0.0195) (++) | 7% | RP5-933E2.1 | Intergenic | 6 | ||
| 4:148508838:G:T | rs61170156 | Metal: 1.28 × 10⁻⁶ DC: 2.20 × 10⁻⁵ RC: 1.45 × 10⁻³ | 0.0670 (0.0129) (++) | 17% | RP11-752L20.5 | ncRNA (intronic) | 5 | TMEM184C (thyroid), GPRC5C, CD300C, BTBD17, KIF19, FDXR, MRPS7 | |
| 1:92310874:A:G | rs6686126 | Metal: 1.37 × 10⁻⁶ DC: 9.87 × 10⁻³ RC: 3.13 × 10⁻⁶ | 0.0868 (0.0167) (++) | 7% | TGFBR3 | Intronic | 2b | Blood vessel development, heart morphogenesis, organ regeneration | |
| 15:45737253:A:C | rs72711259 | Metal: 1.58 × 10⁻⁶ DC: 2.12 × 10⁻² RC: 6.62 × 10⁻⁷ | 0.0731 (0.0142) (++) | 12% | C15orf48 | Intronic | 7 | SLC28A2 (rectum, colon, esofagus and gastroesophagus junction, tibial nerve, testis, thyroid, cervical spinal cord), SQRDL (thyroid), SLC30A4, SHF (cervical spinal cord), DUOX1 (cerebellum), SORD, SPATA5L1 (adipose tissue, whole blood, artery tibial, esofagus and gastroesophagus junction, skeletal muscle, thyroid), SLC28A2, SPATA5L1, RP11-96O20.4, GATM (artery tibial, skeletal muscle), TRIM69 (thyroid) | Nucleus, mitochondrion |
| 17:72393744:A:G | rs4348170 | Metal: 1.60 × 10⁻⁶ DC: - RC: 2.55 × 10⁻⁷ | 0.1077 (0.0209) (?+) | 10% | RNA5SP448 | Intergenic | NA | BTBD17, FDXR (brain cortex), CD300C, FDXR, GPRC5C (adrenal gland), KIF19, MRPS7 (liver) | |
| 7:83857204:C:T | rs7802925 | Metal: 2.09 × 10⁻⁶ DC: 4.73 × 10⁻⁶ RC: 6.89 × 10⁻³ | −0.0907 (0.0178) (--) | 6% | SEMA3A | Intronic | 5 | Apoptotic process, neuron migration, nerve development | |
| 8:117535199:C:T | rs16888486 | Metal: 2.19 × 10⁻⁶ DC: 2.71 × 10⁻³ RC: 3.10 × 10⁻⁵ | −0.1023 (0.0201) (++) | 6% | EIF3H | Intergenic | 7 | UTP23 (whole blood) | Gene expression, extracellular vesicular exosome |
| Trait | Rho | Rho SE | Corr | p-Value |
|---|---|---|---|---|
| Alzheimer’s Disease | 0.049 | 0.021 | 0.200 | 2.15 × 10⁻² |
| White Matter Hyperintensities | −0.100 | 0.047 | −2.257 | 3.46 × 10⁻² |
| Deep ICH | 0.089 | 0.80 | 0.141 | 2.66 × 10⁻¹ |
| ICH | 0.070 | 0.082 | 0.199 | 3.03 × 10⁻¹ |
| SVO | −0.006 | 0.008 | −0.067 | 4.90 × 10⁻¹ |
| SBP | −0.007 | 0.013 | −0.021 | 6.06 × 10⁻¹ |
| Lobar ICH | 0.031 | 0.080 | 0.189 | 6.96 × 10⁻¹ |
| CES | −0.002 | 0.008 | −0.021 | 7.96 × 10⁻¹ |
| AIS | −0.002 | 0.008 | −0.017 | 8.32 × 10⁻¹ |
| DBP | −0.003 | 0.013 | −0.009 | 8.41 × 10⁻¹ |
| LAS | −0.001 | 0.009 | −0.006 | 9.46 × 10⁻¹ |
| AS | −0.0005 | 0.008 | −0.005 | 2.66 × 10⁻¹ |
Publisher’s Note: MDPI stays neutral with regard to jurisdictional claims in published maps and institutional affiliations. |
© 2021 by the authors. Licensee MDPI, Basel, Switzerland. This article is an open access article distributed under the terms and conditions of the Creative Commons Attribution (CC BY) license (https://creativecommons.org/licenses/by/4.0/).
Share and Cite
Muiño, E.; Cárcel-Márquez, J.; Carrera, C.; Llucià-Carol, L.; Gallego-Fabrega, C.; Cullell, N.; Lledós, M.; Castillo, J.; Sobrino, T.; Campos, F.; et al. RP11-362K2.2:RP11-767I20.1 Genetic Variation Is Associated with Post-Reperfusion Therapy Parenchymal Hematoma. A GWAS Meta-Analysis. J. Clin. Med. 2021, 10, 3137. https://doi.org/10.3390/jcm10143137
Muiño E, Cárcel-Márquez J, Carrera C, Llucià-Carol L, Gallego-Fabrega C, Cullell N, Lledós M, Castillo J, Sobrino T, Campos F, et al. RP11-362K2.2:RP11-767I20.1 Genetic Variation Is Associated with Post-Reperfusion Therapy Parenchymal Hematoma. A GWAS Meta-Analysis. Journal of Clinical Medicine. 2021; 10(14):3137. https://doi.org/10.3390/jcm10143137
Chicago/Turabian StyleMuiño, Elena, Jara Cárcel-Márquez, Caty Carrera, Laia Llucià-Carol, Cristina Gallego-Fabrega, Natalia Cullell, Miquel Lledós, José Castillo, Tomás Sobrino, Francisco Campos, and et al. 2021. "RP11-362K2.2:RP11-767I20.1 Genetic Variation Is Associated with Post-Reperfusion Therapy Parenchymal Hematoma. A GWAS Meta-Analysis" Journal of Clinical Medicine 10, no. 14: 3137. https://doi.org/10.3390/jcm10143137
APA StyleMuiño, E., Cárcel-Márquez, J., Carrera, C., Llucià-Carol, L., Gallego-Fabrega, C., Cullell, N., Lledós, M., Castillo, J., Sobrino, T., Campos, F., Rodríguez-Castro, E., Millán, M., Muñoz-Narbona, L., Bustamante, A., López-Cancio, E., Ribó, M., Álvarez-Sabín, J., Jiménez-Conde, J., Roquer, J., ... Consortium, t. S. S. G. (2021). RP11-362K2.2:RP11-767I20.1 Genetic Variation Is Associated with Post-Reperfusion Therapy Parenchymal Hematoma. A GWAS Meta-Analysis. Journal of Clinical Medicine, 10(14), 3137. https://doi.org/10.3390/jcm10143137