
Fasting Normoglycemia after Intravenous Thrombolysis Predicts Favorable Long-Term Outcome in Non-Diabetic Patients with Acute Ischemic Stroke

 ,
,  ,
,
Abstract
:1. Introduction
2. Materials and Methods
2.1. Patients
2.2. Glucose Measurements
2.3. Statistics
3. Results
3.1. Patient Characteristics
3.2. Association between FNG and Favorable Outcome
3.2.1. All Patients
3.2.2. Subgroup Analyses According to Diabetes
3.3. Association between FNG and Excellent Outcome
3.3.1. All Patients
3.3.2. Subgroup Analyses According to Diabetes
3.4. Association between FNG and Mortality
4. Discussion
5. Conclusions
Supplementary Materials
Author Contributions
Funding
Institutional Review Board Statement
Informed Consent Statement
Data Availability Statement
Conflicts of Interest
References
- Poppe, A.; Majumdar, S.; Jeerakathil, T.; Ghali, W.; Buchan, A.; Hill, M. Admission Hyperglycemia Predicts a Worse Outcome in Stroke Patients Treated with Intravenous Thromobolysis. Diabetes Care 2009, 32, 3–8. [Google Scholar] [CrossRef] [PubMed] [Green Version]
- Tsivgoulis, G.; Katsanos, A.H.; Mavridis, D.; Lambadiari, V.; Roffe, C.; MacLeod, M.J.; Sevcik, P.; Cappellari, M.; Nevšímalová, M.; Toni, D.; et al. Association of baseline hyperglycemia with outcomes of patients with and without diabetes with acute ischemic stroke treated with intravenous thrombolysis: A propensity score-matched analysis from the SITS-ISTR registry. Diabetes 2019, 68, 1861–1869. [Google Scholar] [CrossRef] [PubMed] [Green Version]
- Osei, E.; Fonville, S.; Zandbergen, A.A.M.; Koudstaal, P.J.; Dippel, D.W.J.; den Hertog, H.M. Impaired fasting glucose is associated with unfavorable outcome in ischemic stroke patients treated with intravenous alteplase. J. Neurol. 2018, 265, 1426–1431. [Google Scholar] [CrossRef]
- Cao, W.; Ling, Y.; Wu, F.; Yang, L.; Cheng, X.; Dong, Q. Higher fasting glucose next day after intravenous thrombolysis is independently associated with poor outcome in acute ischemic stroke. J. Stroke Cerebrovasc. Dis. 2015, 24, 100–103. [Google Scholar] [CrossRef] [PubMed]
- Johnston, K.C.; Bruno, A.; Pauls, Q.; Hall, C.E.; Barrett, K.M.; Barsan, W.; Fansler, A.; Van De Bruinhorst, K.; Janis, S.; Durkalski-Mauldin, V.L. Intensive vs Standard Treatment of Hyperglycemia and Functional Outcome in Patients with Acute Ischemic Stroke: The SHINE Randomized Clinical Trial. JAMA J. Am. Med. Assoc. 2019, 322, 326–335. [Google Scholar] [CrossRef]
- Wnuk, M.; Popiela, T.; Drabik, L.; Brzegowy, P.; Lasocha, B.; Wloch-Kopec, D.; Pulyk, R.; Jagiella, J.; Wiacek, M.; Kaczorowski, R.; et al. Fasting Hyperglycemia and Long-term Outcome in Patients with Acute Ischemic Stroke Treated with Mechanical Thrombectomy. J. Stroke Cerebrovasc. Dis. 2020, 29, 104774. [Google Scholar] [CrossRef] [PubMed]
- Trouillas, P.; Von Kummer, R. Classification and pathogenesis of cerebral hemorrhages after thrombolysis in ischemic stroke. Stroke 2006, 37, 556–561. [Google Scholar] [CrossRef] [Green Version]
- Wahlgren, N.; Ahmed, N.; Eriksson, N.; Aichner, F.; Bluhmki, E.; Dávalos, A.; Erilä, T.; Ford, G.A.; Grond, M.; Hacke, W.; et al. Multivariable Analysis of Outcome Predictors and Adjustment of Main Outcome Results to Baseline Data Profile in Randomized Controlled Trials. Stroke 2008, 39, 3316–3322. [Google Scholar] [CrossRef] [Green Version]
- Ahmed, N.; Wahlgren, N.; Brainin, M.; Castillo, J.; Ford, G.A.; Kaste, M.; Lees, K.R.; Toni, D. Relationship of Blood Pressure, Antihypertensive Therapy, and Outcome in Ischemic Stroke Treated With Intravenous Thrombolysis. Stroke 2009, 40, 2442–2449. [Google Scholar] [CrossRef] [Green Version]
- American Diabetes Association. Standards of medical care in diabetes 2014. Diabetes Care 2014, 37, S81–S90. [Google Scholar]
- Powers, W.J.; Rabinstein, A.A.; Ackerson, T.; Adeoye, O.M.; Bambakidis, N.C.; Becker, K.; Biller, J.; Brown, M.; Demaerschalk, B.M.; Hoh, B.; et al. 2018 Guidelines for the Early Management of Patients With Acute Ischemic Stroke: A Guideline for Healthcare Professionals From the American Heart Association/American Stroke Association. Stroke 2018, 49, e46–e110. [Google Scholar] [CrossRef]
- Fang, H.; Pan, Y.; Wang, Y.; Wang, C.; Wang, Y.; Zhong, L. Prognostic value of admission hyperglycemia on outcomes of thrombolysis in ischemic stroke patients with or without diabetes. Chin. Med. J. 2020, 133, 2244–2246. [Google Scholar] [CrossRef]
- Tayek, C.J. Diabetes patients and non-diabetic patients intensive care unit and hospital mortality risks associated with sepsis. World J. Diabetes 2012, 3, 29. [Google Scholar] [CrossRef] [PubMed]
- Shimoyama, T.; Kimura, K.; Uemura, J.; Saji, N.; Shibazaki, K. Elevated glucose level adversely affects infarct volume growth and neurological deterioration in non-diabetic stroke patients, but not diabetic stroke patients. Eur. J. Neurol. 2014, 21, 402–410. [Google Scholar] [CrossRef] [PubMed]
- Fraticelli, L.; Freyssenge, J.; Claustre, C.; Buisson, M.; Bischoff, M.; Nighoghossian, N.; Derex, L.; El Khoury, C. Sex-Related Differences in Management and Outcome of Acute Ischemic Stroke in Eligible Patients to Thrombolysis. Cerebrovasc. Dis. 2019, 47, 196–204. [Google Scholar] [CrossRef]
- Ngiam, J.N.; Cheong, C.W.S.; Leow, A.S.T.; Wei, Y.-T.; Thet, J.K.X.; Lee, I.Y.S.; Sia, C.-H.; Tan, B.Y.Q.; Khoo, C.-M.; Sharma, V.K.; et al. Stress Hyperglycaemia is Associated with Poor Functional Outcomes in Patients with Acute Ischaemic Stroke after Intravenous Thrombolysis. QJM Int. J. Med. 2020, 1–5. [Google Scholar] [CrossRef] [PubMed]
- Bandettini di Poggio, M.; Finocchi, C.; Brizzo, F.; Altomonte, F.; Bovis, F.; Mavilio, N.; Serrati, C.; Malfatto, L.; Mancardi, G.L.; Balestrino, M. Management of acute ischemic stroke, thrombolysis rate, and predictors of clinical outcome. Neurol. Sci. 2019, 40, 319–326. [Google Scholar] [CrossRef]
- Wu, Z.; Zeng, M.; Li, C.; Qiu, H.; Feng, H.; Xu, X.; Zhang, H.; Wu, J. Time-dependence of NIHSS in predicting functional outcome of patients with acute ischemic stroke treated with intravenous thrombolysis. Postgrad. Med. J. 2019, 95, 181–186. [Google Scholar] [CrossRef] [PubMed]
- Wu, L.; Huang, X.; Wu, D.; Zhao, W.; Wu, C.; Che, R.; Zhang, Z.; Jiang, F.; Bian, T.; Yang, T.; et al. Relationship between Post-Thrombolysis Blood Pressure and Outcome in Acute Ischemic Stroke Patients Undergoing Thrombolysis Therapy. J. Stroke Cerebrovasc. Dis. 2017, 26, 2279–2286. [Google Scholar] [CrossRef]
- Chwojnicki, K.; Kozera, G.; Sobolewski, P.; Fryze, W.; Nyka, W.M. Intravenous thrombolysis and three-year ischemic stroke mortality. Acta Neurol. Scand. 2017, 135, 540–545. [Google Scholar] [CrossRef] [PubMed]
- Perova, N.V.; Ozerova, I.N.; Aleksandrovich, O.V.; Metel’skaia, V.A.; Shal’nova, S.A. Clinical value of insulin resistance in fasting normoglycemia. Kardiologiia 2011, 51, 49–54. [Google Scholar] [PubMed]
- Ago, T.; Matsuo, R.; Hata, J.; Wakisaka, Y.; Kuroda, J.; Kitazono, T.; Kamouchi, M. Insulin resistance and clinical outcomes after acute ischemic stroke. Neurology 2018, 90, E1470–E1477. [Google Scholar] [CrossRef] [PubMed]


| Whole Group | With DM | Without DM | |||||||
|---|---|---|---|---|---|---|---|---|---|
| Glucose < 5.5 mmol/L n = 69 | Glucose ≥ 5.5 mmol/L n = 293 | p-Value | Glucose < 5.5 mmol/L n = 12 | Glucose ≥ 5.5 mmol/L n = 93 | p-Value | Glucose < 5.5 mmol/L n = 57 | Glucose ≥ 5.5 mmol/L n = 200 | p-Value | |
| Age (years) | 70 (54–78) | 73 (64–82) | 0.005 | 78 (71–80) | 74 (65–82) | 0.331 | 65 (53–75) | 72 (64–82) | <0.001 |
| Women, n (%) | 30 (43.5) | 147 (50.2) | 0.317 | 4 (33.3) | 47 (50.5) | 0.360 | 26 (45.6) | 100 (50.0) | 0.559 |
| BMI (kg/m2) | 25.8 (23.4–27.8) | 27.1 (24.4–30.1) | 0.013 | 24.9 (23.4–27.0) | 29.1 (26.1–31.8) | 0.001 | 25.9 (23.4–28.7) | 25.9 (23.9–29.4) | 0.578 |
| Hypertension, n (%) | 54 (78.3) | 250 (85.3) | 0.150 | 11 (91.7) | 87 (93.5) | 0.584 | 43 (75.4) | 163 (81.5) | 0.311 |
| Ischemic heart disease, n (%) | 14 (20.3) | 70 (23.9) | 0.523 | 3 (25.0) | 30 (32.3) | 0.749 | 11 (19.3) | 40 (20.0) | 0.907 |
| Atrial fibrillation, n (%) | 16 (23.2) | 90 (30.7) | 0.216 | 3 (25.0) | 36 (38.7) | 0.528 | 13 (22.8) | 54 (27.0) | 0.525 |
| Hypercholesterolemia, n (%) | 29 (42.0) | 88 (30.0) | 0.055 | 7 (58.3) | 30 (32.3) | 0.108 | 22 (38.6) | 58 (29.0) | 0.167 |
| Smoking, n (%) | 12 (17.7) | 43 (15.2) | 0.736 | 1 (8.3) | 10 (10.8) | 1.00 | 11 (19.3) | 33 (17.2) | 0.812 |
| Previous stroke, n (%) | 12 (17.4) | 54 (18.40 | 0.840 | 2 (16.7) | 21 (22.6) | 1.00 | 10 (17.5) | 33 (16.5) | 0.852 |
Stroke etiology, n (%)
| |||||||||
| 10 (14.5) | 39 (13.3) | 0.172 | 4 (33.3) | 14 (15.0) | 0.534 | 6 (10.5) | 25 (12.5) | 0.077 | |
| 2 (2.9) | 1 (0.3) | 0 (0.0) | 1 (1.1) | 2 (3.5) | 0 (0.0) | ||||
| 19 (27.5) | 100 (34.1) | 3 (25.0) | 38 (40.9) | 16 (28.1) | 62 (31.0) | ||||
| 5 (7.3) | 12 (4.1) | 0 (0.0) | 2 (2.1) | 5 (8.8) | 10 (5.0) | ||||
| 33 (47.8) | 141 (48.1) | 5 (41.7) | 38 (40.9) | 28 (49.1) | 103 (51.5) | ||||
| Mechanical thrombectomy, n (%) | 26 (37.7) | 82 (28.0) | 0.113 | 1 (8.3) | 33 (35.5) | 0.978 | 25 (43.9) | 49 (24.5) | 0.004 |
| Time from stroke onset to thrombolysis (min) | 138 (99–176) | 135 (95–183) | 0.655 | 115 (91–156) | 135 (96–185) | 0.243 | 140 (100–190) | 135 (94–180) | 0.998 |
| NIHSS score on admission | 10.3 ± 6.6 | 12.3 ± 6.8 | 0.026 | 8.7 ± 4.9 | 12.3 ± 6.4 | 0.060 | 10.7 ± 6.1 | 12.3 ± 7.0 | 0.122 |
| NIHSS score after r-tPA | 6.3 ± 6.6 | 9.0 ± 7.9 | 0.012 | 7.0 ± 5.1 | 8.4 ± 7.0 | 0.665 | 6.1 ± 6.9 | 9.3 ± 8.3 | 0.010 |
Post-MT hemorrhagic brain complications, n (%)
| |||||||||
| 58 (84.1) | 229 (78.2) | 0.810 | 11 (91.7) | 73 (78.5) | 0.718 | 47 (82.5) | 156 (78.0) | 0.892 | |
| 4 (5.8) | 21 (7.2) | 1 (8.3) | 6 (6.4) | 3 (5.3) | 15 (7.5) | ||||
| 4 (5.8) | 20 (6.8) | 0 (0.0) | 7 (7.5) | 4 (7.0) | 13 (6.5) | ||||
| 2 (2.9) | 12 (4.1) | 0 (0.0) | 4 (4.3) | 2 (3.5) | 8 (4.0) | ||||
| 1 (1.5) | 11 (3.8) | 0 (0.0) | 3 (3.2) | 1 (1.7) | 8 (4.0) | ||||
| Maximal SBP within 24 h after r-tPA (mmHg) | 140 (120–150) | 147 (135–164) | 0.002 | 140 (125–150) | 148 (135–160) | 0.285 | 140 (120–150) | 146 (134–165) | 0.005 |
| Maximal DBP within 24 h after r-tPA (mmHg) | 80 (71–83) | 80 (70–90) | 0.101 | 80 (70–80) | 80 (70–90) | 0.459 | 80 (72–85) | 80 (71–90) | 0.124 |
| Fasting glucose (mmol/L) | 5.0 (4.7–5.3) | 6.9 (6.2–8.6) | <0.001 | 4.4 (3.6–4.7) | 8.1 (6.5–11.5) | <0.001 | 5.2 (4.9–5.3) | 6.7 (6.1–7.8) | <0.001 |
| Creatinine (µmol/L) | 78 (69–98) | 82 (68–97) | 0.572 | 103 (72–122) | 83 (64–99) | 0.177 | 74 (67–95) | 82 (69–92) | 0.202 |
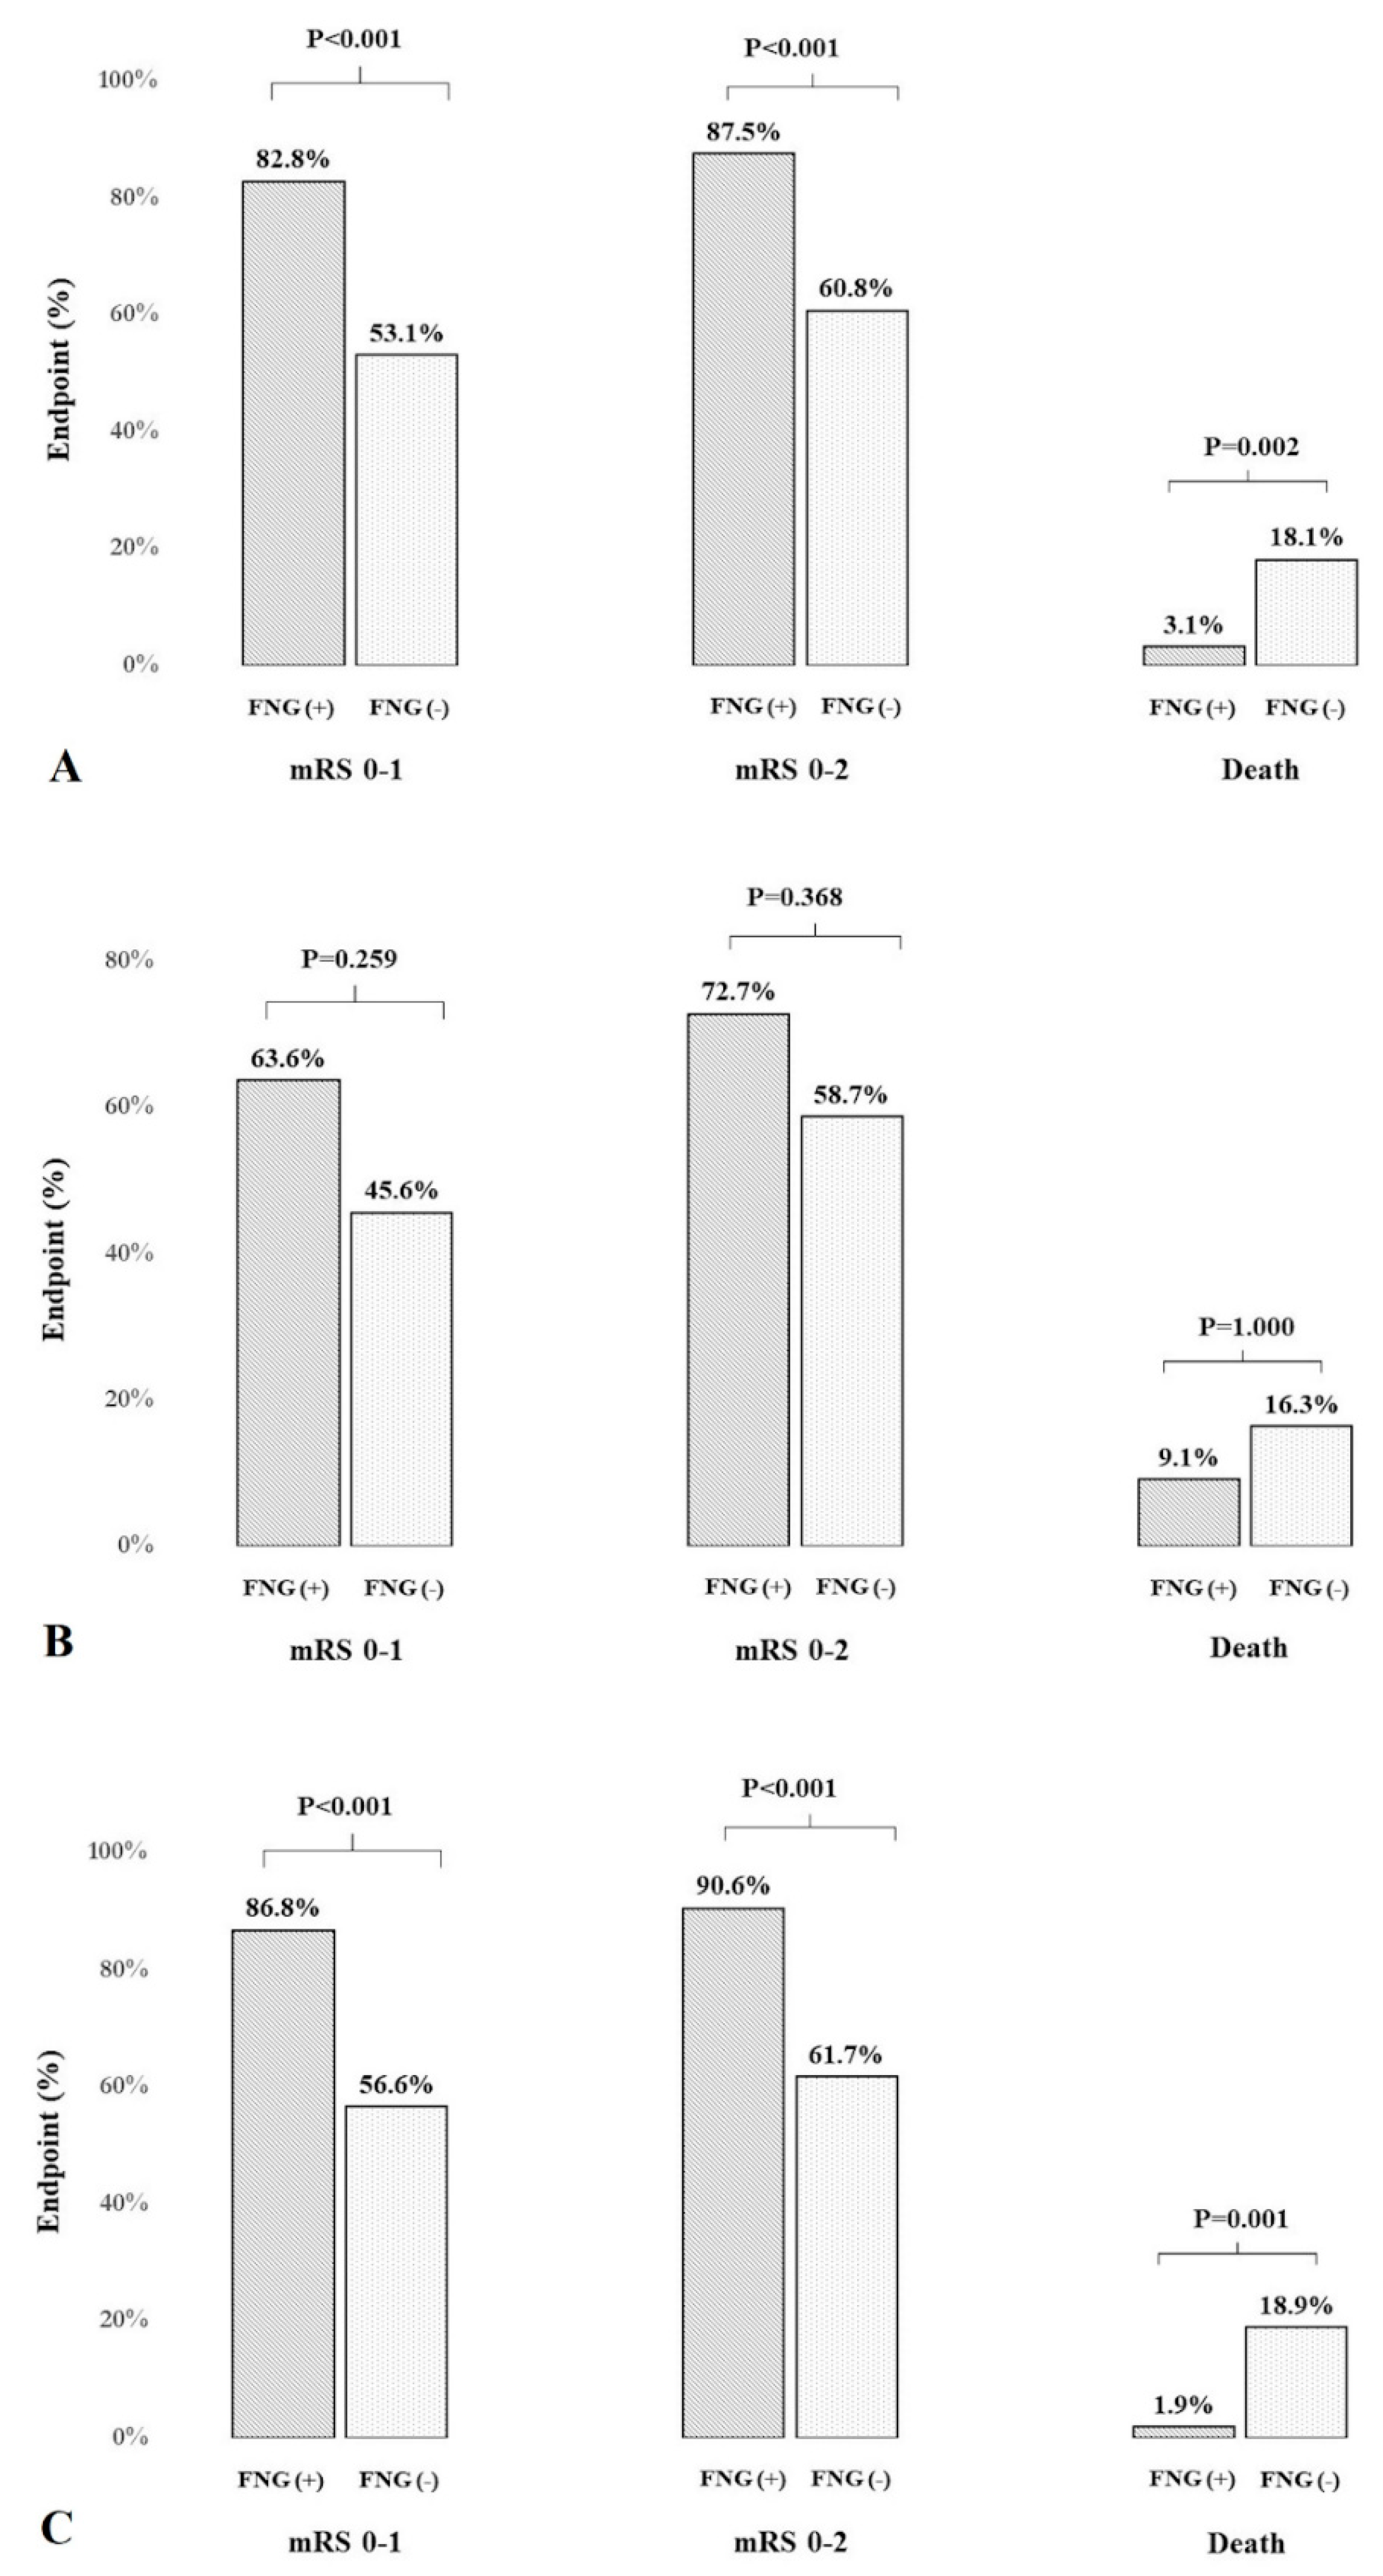
| mRS 0–1, 90 days, n (%) | 53 (82.8) | 153 (53.1) | <0.001 | 7 (63.6) | 42 (45.6) | 0.259 | 46 (86.8) | 111 (56.6) | <0.001 |
| mRS 0–2, 90 days, n (%) | 56 (87.5) | 175 (60.8) | <0.001 | 8 (72.7) | 54 (58.7) | 0.368 | 48 (90.6) | 121 (61.7) | <0.001 |
| Death (mRS = 6), 90 days, n (%) | 2 (3.1) | 52 (18.1) | 0.002 | 1 (9.1) | 15 (16.3) | 1.000 | 1 (1.9) | 37 (18.9) | 0.001 |
| Favorable Outcome (mRS 0–2) | ||||||
| Univariable | Multivariable | |||||
| 90-day favorable clinical outcome, diabetic + non-diabetic patients | HR | 95% CI | p-Value | HR | 95% CI | p-Value |
| Age (per 1 year) | 0.95 | 0.94–0.97 | <0.001 | 0.92 | 0.89–0.95 | <0.001 |
| Sex (female) | 0.53 | 0.34–0.83 | 0.005 | - | - | - |
| BMI (per 1 unit) | 0.96 | 0.92–1.02 | 0.163 | - | - | - |
| Atrial fibrillation | 0.57 | 0.35–0.91 | 0.019 | - | - | |
| NIHSS score after r-tPA (per 1 point) | 0.73 | 0.69–0.78 | <0.001 | 0.70 | 0.65–0.76 | <0.001 |
| Maximal SBP within 24 h after r-tPA (per 1 mmHg) | 0.99 | 0.98–0.99 | 0.053 | 0.92 | 0.89–0.95 | 0.037 |
| Mechanical thrombectomy | 0.67 | 0.42–1.07 | 0.091 | - | - | - |
| Hemorrhagic brain complications (ECASS 1–3) | 0.16 | 0.09–0.28 | <0.001 | - | - | - |
| Fasting glucose < 5.5 mmol/L | 4.52 | 2.08–9.83 | <0.001 | 4.12 | 1.38–12.35 | 0.011 |
| 90-day favorable clinical outcome, diabetic patients | ||||||
| Age (per 1 year) | 0.96 | 0.92–0.99 | 0.352 | 0.87 | 0.80–0.95 | 0.002 |
| Sex (female) | 0.92 | 0.42–2.03 | 0.841 | - | - | - |
| BMI (per 1 unit) | 0.89 | 0.81–0.98 | 0.018 | - | - | - |
| Atrial fibrillation | 0.48 | 0.21–1.08 | 0.075 | - | - | - |
| Previous stroke | 0.41 | 0.16–1.06 | 0.067 | - | - | - |
| NIHSS score after r-tPA (per 1 point) | 0.77 | 0.70–0.85 | <0.001 | 0.64 | 0.54–0.77 | <0.001 |
| Hemorrhagic brain complications (ECASS 1–3) | 0.25 | 0.09–0.68 | 0.007 | - | - | - |
| Creatinine (per 1 µmol/L) | 0.98 | 0.97–0.99 | 0.019 | 0.97 | 0.94–0.99 | 0.018 |
| Fasting glucose < 5.5 mmol/L | 1.88 | 0.47–1.54 | 0.375 | - | - | - |
| 90-day favorable clinical outcome, non-diabetic patients | ||||||
| Age (per 1 year) | 0.95 | 0.93–0.98 | <0.001 | 0.94 | 0.90–0.98 | 0.01 |
| Sex (female) | 0.40 | 0.23–0.69 | 0.011 | - | - | - |
| BMI (per 1 unit) | 1.02 | 0.95–1.09 | 0.585 | - | - | - |
| Hypertension | 0.18 | 0.07–0.47 | <0.001 | - | - | - |
| Maximal SBP within 24 h after r-tPA (per 1 mmHg) | 0.99 | 0.98–0.99 | 0.012 | 1.03 | 1.01–1.05 | 0.007 |
| NIHSS score after r-tPA (per 1 point) | 0.71 | 0.66–0.77 | <0.001 | 0.68 | 0.62–0.75 | <0.001 |
| Hemorrhagic brain complications (ECASS 1–3) | 0.13 | 0.07–0.25 | <0.001 | - | - | - |
| Fasting glucose < 5.5 mmol/L | 5.95 | 2.27–15.6 | <0.001 | 5.96 | 1.42–25.1 | 0.015 |
| Excellent Outcome (mRS 0–1) | ||||||
| Univariable | Multivariable | |||||
| 90-day excellent clinical outcome, diabetic + non-diabetic patients | HR | 95% CI | p-Value | HR | 95% CI | p-Value |
| Sex (female) | 0.59 | 0.38–0.90 | 0.015 | - | - | - |
| BMI (per 1 unit) | 0.96 | 0.96–1.01 | 0.126 | - | - | - |
| Atrial fibrillation | 0.63 | 0.40–0.99 | 0.049 | - | - | - |
| NIHSS score after r-tPA (per 1 point) | 0.73 | 0.69–0.77 | <0.001 | 0.71 | 0.66–0.76 | <0.001 |
| Maximal SBP within 24 h after r-tPA (per 1 mmHg) | 0.99 | 0.98–0.99 | 0.014 | - | - | - |
| Mechanical thrombectomy | 0.53 | 0.33–0.84 | 0.007 | - | - | - |
| Hemorrhagic brain complications (ECASS 1–3) | 0.17 | 0.10–0.30 | <0.001 | - | - | - |
| Fasting glucose < 5.5 mmol/L | 4.25 | 2.13–8.47 | <0.001 | 3.47 | 1.32–9.14 | 0.012 |
| 90-day excellent clinical outcome, diabetic patients | ||||||
| Age (per 1 year) | 0.98 | 0.94–1.02 | 0.226 | - | - | - |
| Sex (female) | 1.52 | 0.70–3.32 | 0.289 | - | - | - |
| BMI (per 1 unit) | 0.89 | 0.81–0.98 | 0.019 | - | - | - |
| NIHSS score after r-tPA (per 1 point) | 0.70 | 0.62–0.80 | <0.001 | 0.69 | 0.60–0.79 | <0.001 |
| Mechanical thrombectomy | 0.42 | 0.18–1.00 | 0.050 | - | - | - |
| Hemorrhagic brain complications (ECASS 1–3) | 0.27 | 0.09–0.81 | 0.019 | - | - | - |
| Creatinine (per 1 µmol/L) | 0.99 | 0.97–0.99 | 0.040 | 0.98 | 0.96–0.99 | 0.021 |
| Fasting glucose < 5.5 mmol/L | 2.08 | 0.57–7.61 | 0.267 | - | - | - |
| 90-day excellent clinical outcome, non-diabetic patients | ||||||
| Age (per 1 year) | 0.95 | 0.93–0.97 | <0.001 | 0.96 | 0.93–0.99 | 0.02 |
| Sex (female) | 0.37 | 0.22–0.63 | <0.001 | 0.34 | 0.14–0.87 | 0.024 |
| BMI (per 1 unit) | 1.03 | 0.96–1.10 | 0.474 | - | - | - |
| Hypertension | 0.21 | 0.09–0.49 | <0.001 | - | - | - |
| Maximal SBP within 24 h after r-tPA (per 1 mmHg) | 0.98 | 0.97–0.99 | <0.001 | - | - | - |
| NIHSS score after r-tPA (per 1 point) | 0.72 | 0.67–0.78 | <0.001 | 0.71 | 0.65–0.77 | <0.001 |
| Mechanical thrombectomy | 0.59 | 0.34–1.03 | 0.065 | |||
| Hemorrhagic brain complications (ECASS 1–3) | 0.14 | 0.07–0.28 | <0.001 | - | - | - |
| Fasting glucose < 5.5 mmol/L | 5.03 | 2.16–11.7 | <0.001 | 3.47 | 1.10–12.2 | 0.035 |
| Univariable | Multivariable | |||||
|---|---|---|---|---|---|---|
| 90-Day Risk of Death, Diabetic + Non-Diabetic Patients | HR | 95% CI | p-Value | HR | 95% CI | p-Value |
| Age (per 1 year) | 1.05 | 1.02–1.08 | <0.001 | 1.07 | 1.03–1.11 | <0.001 |
| Sex (female) | 1.48 | 0.82–2.66 | 0.189 | - | - | - |
| BMI (per 1 unit) | 1.07 | 0.94–1.08 | 0.870 | - | - | - |
| NIHSS score after r-tPA (per 1 point) | 1.24 | 1.17–1.31 | <0.001 | 1.22 | 1.15–1.29 | <0.001 |
| Hemorrhagic brain complications (ECASS 1–3) | 6.70 | 3.59–12.5 | <0.001 | 2.66 | 1.19–5.91 | 0.017 |
| Maximal SBP within 24 h after r-tPA (per 1 mmHg) | 1.01 | 1.01–1.03 | 0.014 | - | - | - |
| Hypertension | 3.85 | 1.16–12.78 | 0.028 | - | - | - |
| Atrial fibrillation | 2.02 | 1.11–3.67 | 0.021 | - | - | - |
| Platelets (per 105/µL) | 0.65 | 0.40–1.04 | 0.071 | - | - | - |
| Fasting glucose < 5.5 mmol/L | 1.47 | 0.04–0.62 | 0.009 | 0.23 | 0.03–1.81 | 0.164 |
| 90-day risk of death, diabetic patients | ||||||
| Age (per 1 year) | 1.03 | 0.98–1.09 | 0.254 | - | - | - |
| Sex (female) | 1.12 | 0.39–3.26 | 0.832 | - | - | - |
| BMI (per 1 unit) | 1.11 | 1.00–1.25 | 0.057 | - | - | - |
| NIHSS score after r-tPA (per 1 point) | 1.24 | 1.12–1.38 | <0.001 | 1.27 | 1.12–1.42 | <0.001 |
| Hemorrhagic brain complications (ECASS 1–3) | 4.06 | 1.30–12.7 | 0.016 | - | - | - |
| Atrial fibrillation | 3.70 | 1.22–11.2 | 0.021 | 5.12 | 1.31–20.1 | 0.019 |
| Platelets count (per 105/µL) | 0.37 | 0.12–1.11 | 0.075 | - | - | - |
| Fasting glucose < 5.5 mmol/L | 0.51 | 0.06–4.31 | 0.539 | - | - | - |
| 90-day risk of death, non-diabetic patients | ||||||
| Age (per 1 year) | 1.06 | 1.02–1.09 | <0.001 | 1.07 | 1.02–1.11 | 0.005 |
| Sex (female) | 1.67 | 0.83–3.38 | 0.153 | - | - | - |
| BMI (per 1 unit) | 0.94 | 0.85–1.03 | 0.190 | - | - | - |
| NIHSS score after r-tPA (per 1 point) | 1.24 | 1.16–1.33 | <0.001 | 1.20 | 1.12–1.29 | <0.001 |
| Hemorrhagic brain complications (ECASS 1–3) | 8.29 | 3.92–17.6 | <0.001 | 2.93 | 1.12–7.69 | 0.029 |
| Maximal SBP within 24 h after r-tPA (per 1 mmHg) | 1.02 | 1.01–1.04 | 0.001 | - | - | - |
| Hypertension | 5.44 | 1.27–23.4 | 0.023 | - | - | - |
| Fasting glucose < 5.5 mmol/L | 0.08 | 0.01–0.62 | 0.015 | 0.07 | 0.01–2.10 | 0.125 |
Publisher’s Note: MDPI stays neutral with regard to jurisdictional claims in published maps and institutional affiliations. |
© 2021 by the authors. Licensee MDPI, Basel, Switzerland. This article is an open access article distributed under the terms and conditions of the Creative Commons Attribution (CC BY) license (https://creativecommons.org/licenses/by/4.0/).
Share and Cite
Wnuk, M.; Derbisz, J.; Drabik, L.; Malecki, M.; Slowik, A. Fasting Normoglycemia after Intravenous Thrombolysis Predicts Favorable Long-Term Outcome in Non-Diabetic Patients with Acute Ischemic Stroke. J. Clin. Med. 2021, 10, 3005. https://doi.org/10.3390/jcm10143005
Wnuk M, Derbisz J, Drabik L, Malecki M, Slowik A. Fasting Normoglycemia after Intravenous Thrombolysis Predicts Favorable Long-Term Outcome in Non-Diabetic Patients with Acute Ischemic Stroke. Journal of Clinical Medicine. 2021; 10(14):3005. https://doi.org/10.3390/jcm10143005
Chicago/Turabian StyleWnuk, Marcin, Justyna Derbisz, Leszek Drabik, Maciej Malecki, and Agnieszka Slowik. 2021. "Fasting Normoglycemia after Intravenous Thrombolysis Predicts Favorable Long-Term Outcome in Non-Diabetic Patients with Acute Ischemic Stroke" Journal of Clinical Medicine 10, no. 14: 3005. https://doi.org/10.3390/jcm10143005
APA StyleWnuk, M., Derbisz, J., Drabik, L., Malecki, M., & Slowik, A. (2021). Fasting Normoglycemia after Intravenous Thrombolysis Predicts Favorable Long-Term Outcome in Non-Diabetic Patients with Acute Ischemic Stroke. Journal of Clinical Medicine, 10(14), 3005. https://doi.org/10.3390/jcm10143005