Article

Impartially Validated Multiple Deep-Chain Models to Detect COVID-19 in Chest X-ray Using Latent Space Radiomics

1
Department of Electrical and Computer Engineering, Laval University, Quebec City, QC G1V 0A6, Canada
2
Terasaki Institute for Biomedical Innovation, Los Angeles, CA 90024, USA
3
Department of Radiation Oncology, City of Hope Comprehensive Cancer Center, Duarte, CA 91010, USA
4
Department of Radiology, University of Pennsylvania, Philadelphia, PA 19104, USA
5
Department of Computer Science, Perception Robotics and Intelligent Machines (PRIME) Research Group, University of Moncton, New Brunswick, NB E1A 3E9, Canada
*
Authors to whom correspondence should be addressed.
J. Clin. Med. 2021, 10(14), 3100; https://doi.org/10.3390/jcm10143100
Submission received: 2 May 2021 / Revised: 1 July 2021 / Accepted: 7 July 2021 / Published: 14 July 2021
(This article belongs to the Section Nuclear Medicine & Radiology)

Abstract

:
The COVID-19 pandemic continues to spread globally at a rapid pace, and its rapid detection remains a challenge due to its rapid infectivity and limited testing availability. One of the simply available imaging modalities in clinical routine involves chest X-ray (CXR), which is often used for diagnostic purposes. Here, we proposed a computer-aided detection of COVID-19 in CXR imaging using deep and conventional radiomic features. First, we used a 2D U-Net model to segment the lung lobes. Then, we extracted deep latent space radiomics by applying deep convolutional autoencoder (ConvAE) with internal dense layers to extract low-dimensional deep radiomics. We used Johnson–Lindenstrauss (JL) lemma, Laplacian scoring (LS), and principal component analysis (PCA) to reduce dimensionality in conventional radiomics. The generated low-dimensional deep and conventional radiomics were integrated to classify COVID-19 from pneumonia and healthy patients. We used 704 CXR images for training the entire model (i.e., U-Net, ConvAE, and feature selection in conventional radiomics). Afterward, we independently validated the whole system using a study cohort of 1597 cases. We trained and tested a random forest model for detecting COVID-19 cases through multivariate binary-class and multiclass classification. The maximal (full multivariate) model using a combination of the two radiomic groups yields performance in classification cross-validated accuracy of 72.6% (69.4–74.4%) for multiclass and 89.6% (88.4–90.7%) for binary-class classification.

1. Introduction

The global pandemic associated with COVID-19 continues to spread across the world. It has led to more than 151 million cases and 3.17 million deaths as of 30 April 2021, according to the World Health Organization (WHO) statistics [1]. The WHO declared this to be a Public Health Emergency of International Concern (PHEIC) on 30 January 2020, and finally, on 11 March 2020, the situation was recognized as a global pandemic [2,3]. The highly contagious nature of this virus, leading to infections similar to the severe acquired respiratory syndrome, increased the importance of early detection of COVID-19 to prevent the further spreading of this disease. In clinical routine, simply available imaging modalities, for instance, chest X-ray (CXR) and thoracic computed tomography (CT) offer significant aid to clinicians for imaging diagnosis [4,5,6,7,8,9,10,11,12,13]. However, the current gold standard is the reverse transcription–polymerase chain reaction (RT-PCR) to diagnose COVID-19 viral infection. However, RT-PCR, which relies upon nasopharyngeal or throat swabs, can be influenced by low viral load or sampling errors [6,10] and thus presents a significant challenge, particularly during the early stage of infection with low sensitivity [11,12,13].
Machine learning, as part of artificial intelligence (AI), has unequivocally revolutionized modern medicine, significantly contributed to the medical imaging field, and actively shown its strength for the battle against COVID-19 by enabling more accurate, safe, reliable, and efficient solutions [14]. Several machine-learning-based pipelines are offered for COVID-19, which aim to automatically segment the lung lobes [15,16,17,18,19,20,21,22,23,24] or provide diagnosis and clinical assessment [7,9,25,26], supporting the unequivocal performance of AI in medical imaging. These approaches often used pretrained deep models or a variety of these models or used conventional imaging biomarkers, which are concerned with the accuracy of the models. However, here, we challenge such analysis by our own designed models to extract deep-imaging throughputs and by independently valid models; all models used in this study to prove the reproducibility of these models.
CT and CXR are two widely used imaging modalities to diagnose or screen for COVID-19 [4,5,6,7,8,9]. Many studies focus on classifying COVID-19 patients from those with other non-COVID-19-related diseases, such as pneumonia [22,23,24,25,26,27,28]. Indeed, there is some degree of similarity between pneumonia and COVID-19 for radiological examinations. Chen et al. [22] proposed a U-Net++-based approach to discriminate COVID-19 versus non-COVID-19 patients on the segmented lung area with 106 chest CT images (51 COVID-19 patients). X-ray imaging modalities are less sensitive than CT imaging [27] while considering the first-line investigation method for COVID-19 screening. However, considering the overwhelming number of COVID-19 cases, routine CT imaging places an immense load on different radiology locations, increasing the necessity of employing CXR imaging to detect COVID-19. To differentiate COVID-19 from pneumonia and healthy cases, Ghoshal et al. [25] presented the Bayesian convolutional neural networks trained on 70 lung CXR images from available data sources with a detection accuracy of 92.9% [28]. This outperformed the standard VGG16 model-based diagnosis, which showed 85.7% detection accuracy.
A comparative analysis on three deep-learning models (i.e., InceptionV3, ResNet50, and combined Inception-ResNetV2) used to detect COVID-19 showed that the ResNet50 model achieved the highest classification accuracy, followed by InceptionV3 and Inception-ResNetV2 while testing on publicly available CXR images [7]. Another ResNet-based COVID-19 detection model obtained an area under the curve (AUC) performance of 95.2% in 1078 X-ray images (1008 non-COVID-19 pneumonia and 70 COVID-19 patients) [26]. Heidari et al. [27] proposed a convolutional neural network (CNN) model through transfer learning to categorize CXR images into the classes of infected pneumonia, COVID-19, other community-acquired no-COVID-19 pneumonia, and normal cases using 8474 diagnostic images and yielded an accuracy of 94.5%. In summary, CNN-based models to detect COVID-19 using CXR imaging include but are not limited to ResNet18 [28,29,30], ResNet50 [7,30,31], MobileNetV2 [8], CoroNet [32], Xception [33], Xception + ResNet50V2 [34], DarkCovidNet [35], COVID-Net [9], COVIDX-Net [36], Parallel-Dilated COVIDNet (PDCOVIDNet) [37], and Deep-COVID [38]. Many of these methods rather used pretrained models to tackle the classification problem or extracting features to be used with the classifier or did not validate their model independently.
This study scrutinizes a hybrid machine learning approach involving a hierarchy of models to computerize the diagnosis of COVID-19 from CXR images. We first applied an intelligent system for automatic segmentation of the lung lobes using U-Net and then used the models trained with conventional and/or deep radiomics to perform assessments on several independent validation sets. U-Net is independently used for our testing datasets after being trained by our training set, which makes it more interesting than previously presented approaches (e.g., [28]). Our study investigates the plausibility of deep and conventional radiomics as imaging biomarkers for diagnosing COVID-19 using CXR. Here, we summarized the contributions of this study as follows:
  • The proposed approach trains and independently uses a 2D U-Net model for segmenting the lung lobes in CXR images;
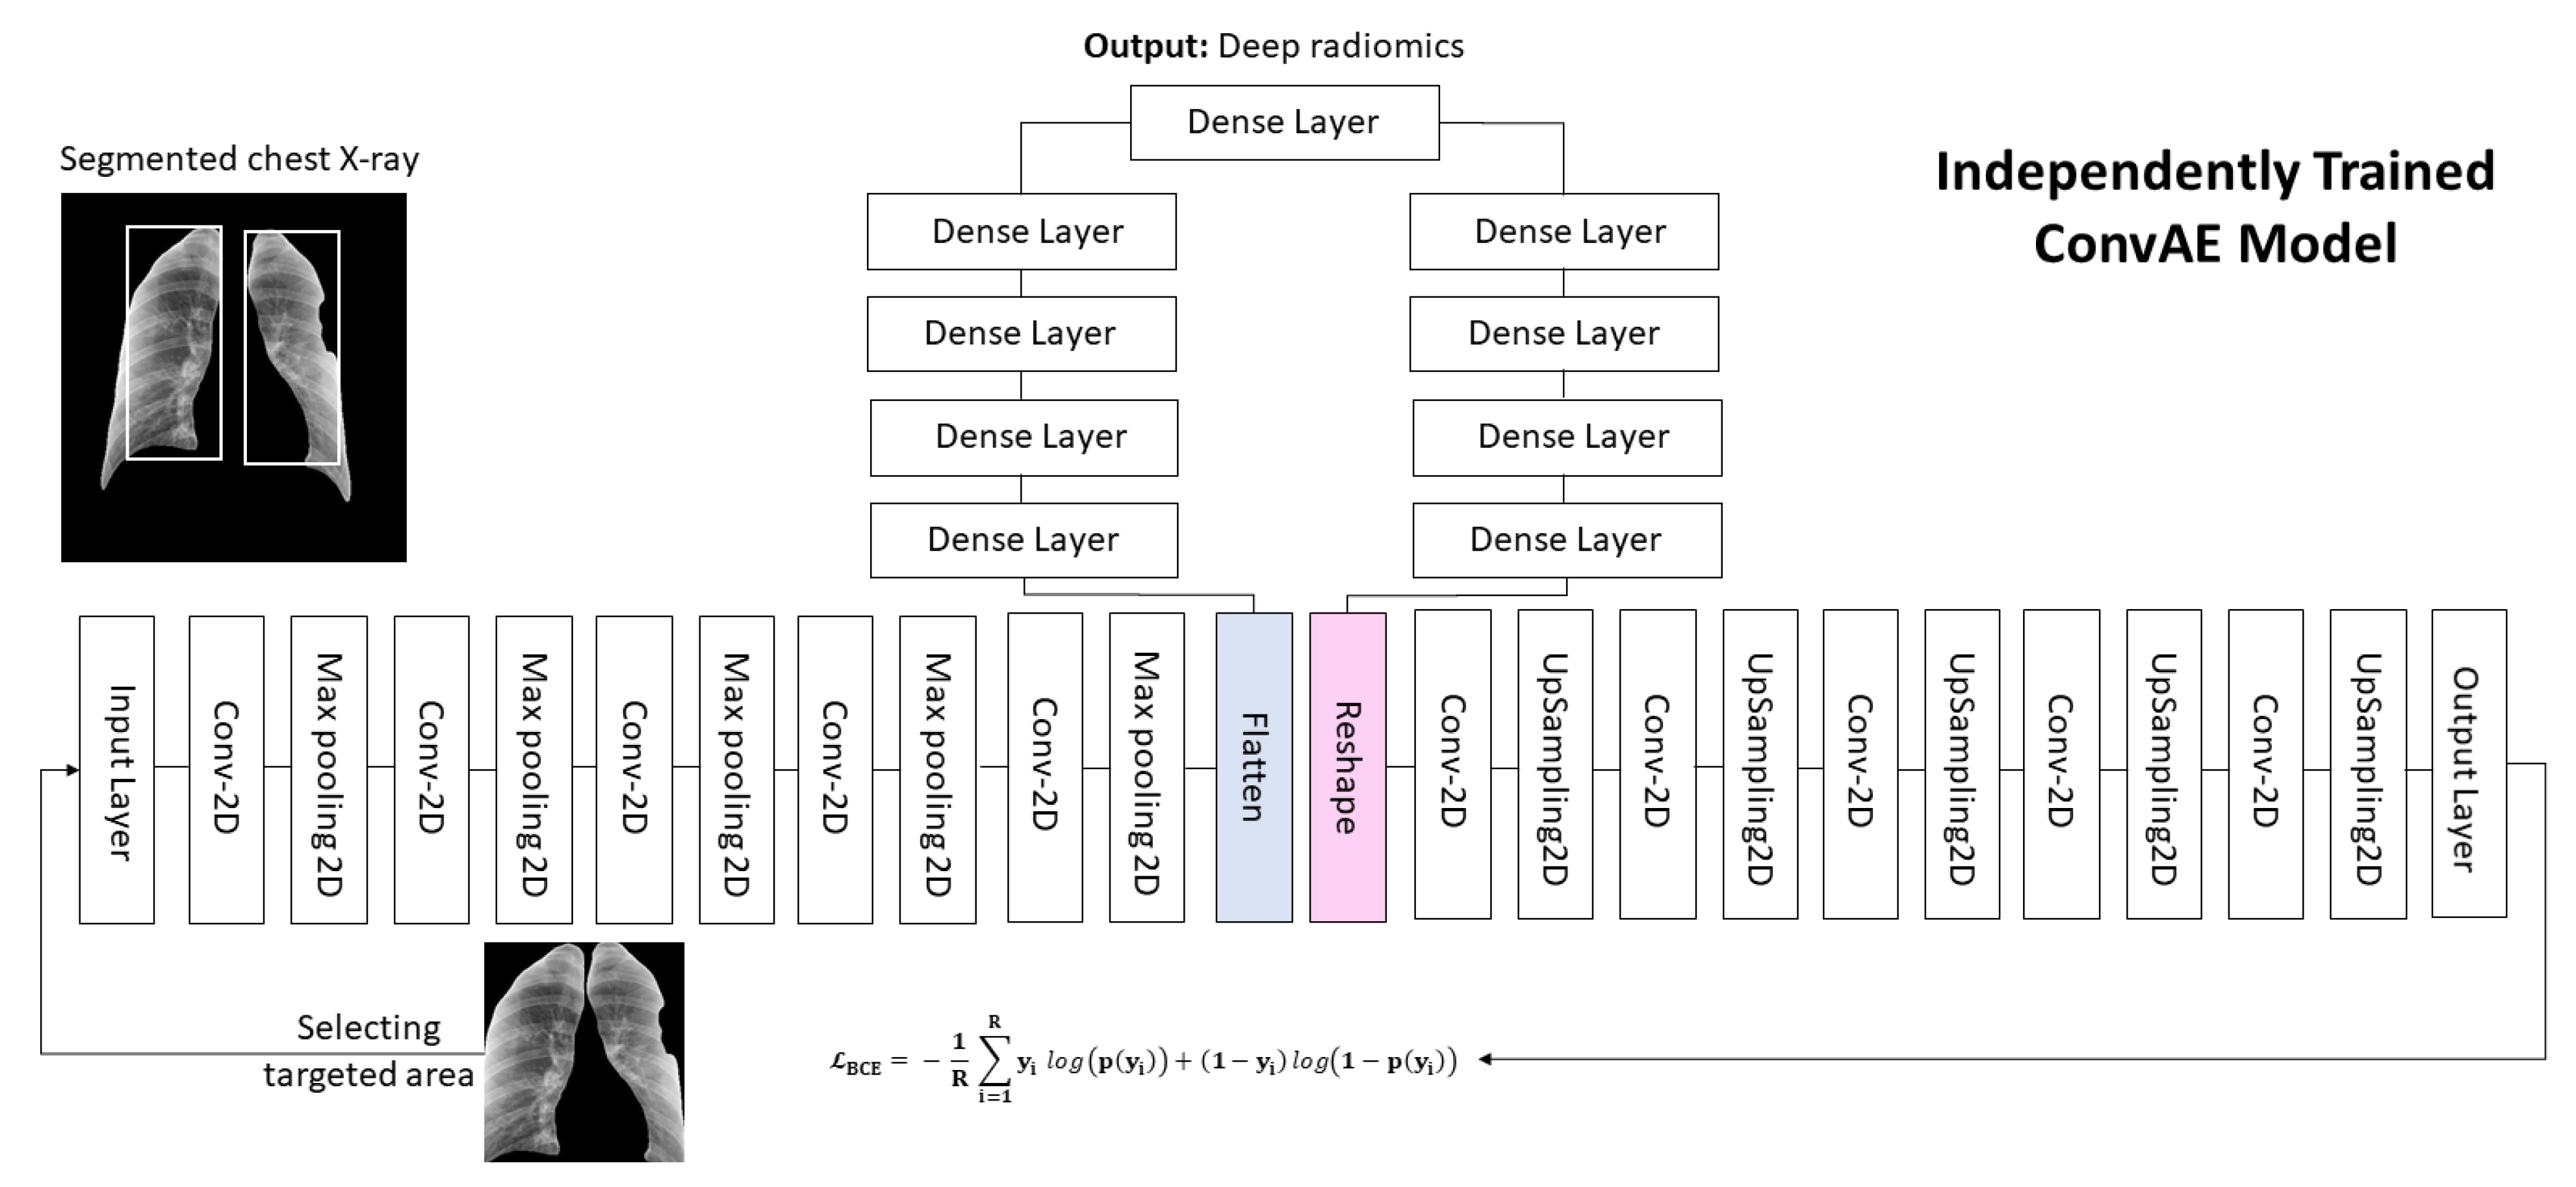
  • We proposed a convolutional deep autoencoder (ConvAE) to extract low-dimensional deep-imaging features, called deep radiomics, from CXR images as potential diagnostic biomarkers for COVID-19;
  • Our study addresses the curse of dimensionality problem using high-dimensional deep radiomics by utilizing a ConvAE to compress the feature space and combine them with conventional radiomics for diagnostic purposes;
  • The proposed model successfully classifies subjects into healthy, pneumonia, and COVID-19 cases through binary- and multiclass classification, as validated with an independent cohort of patients. We also provided comparative analyses of the different combinations of feature categories.
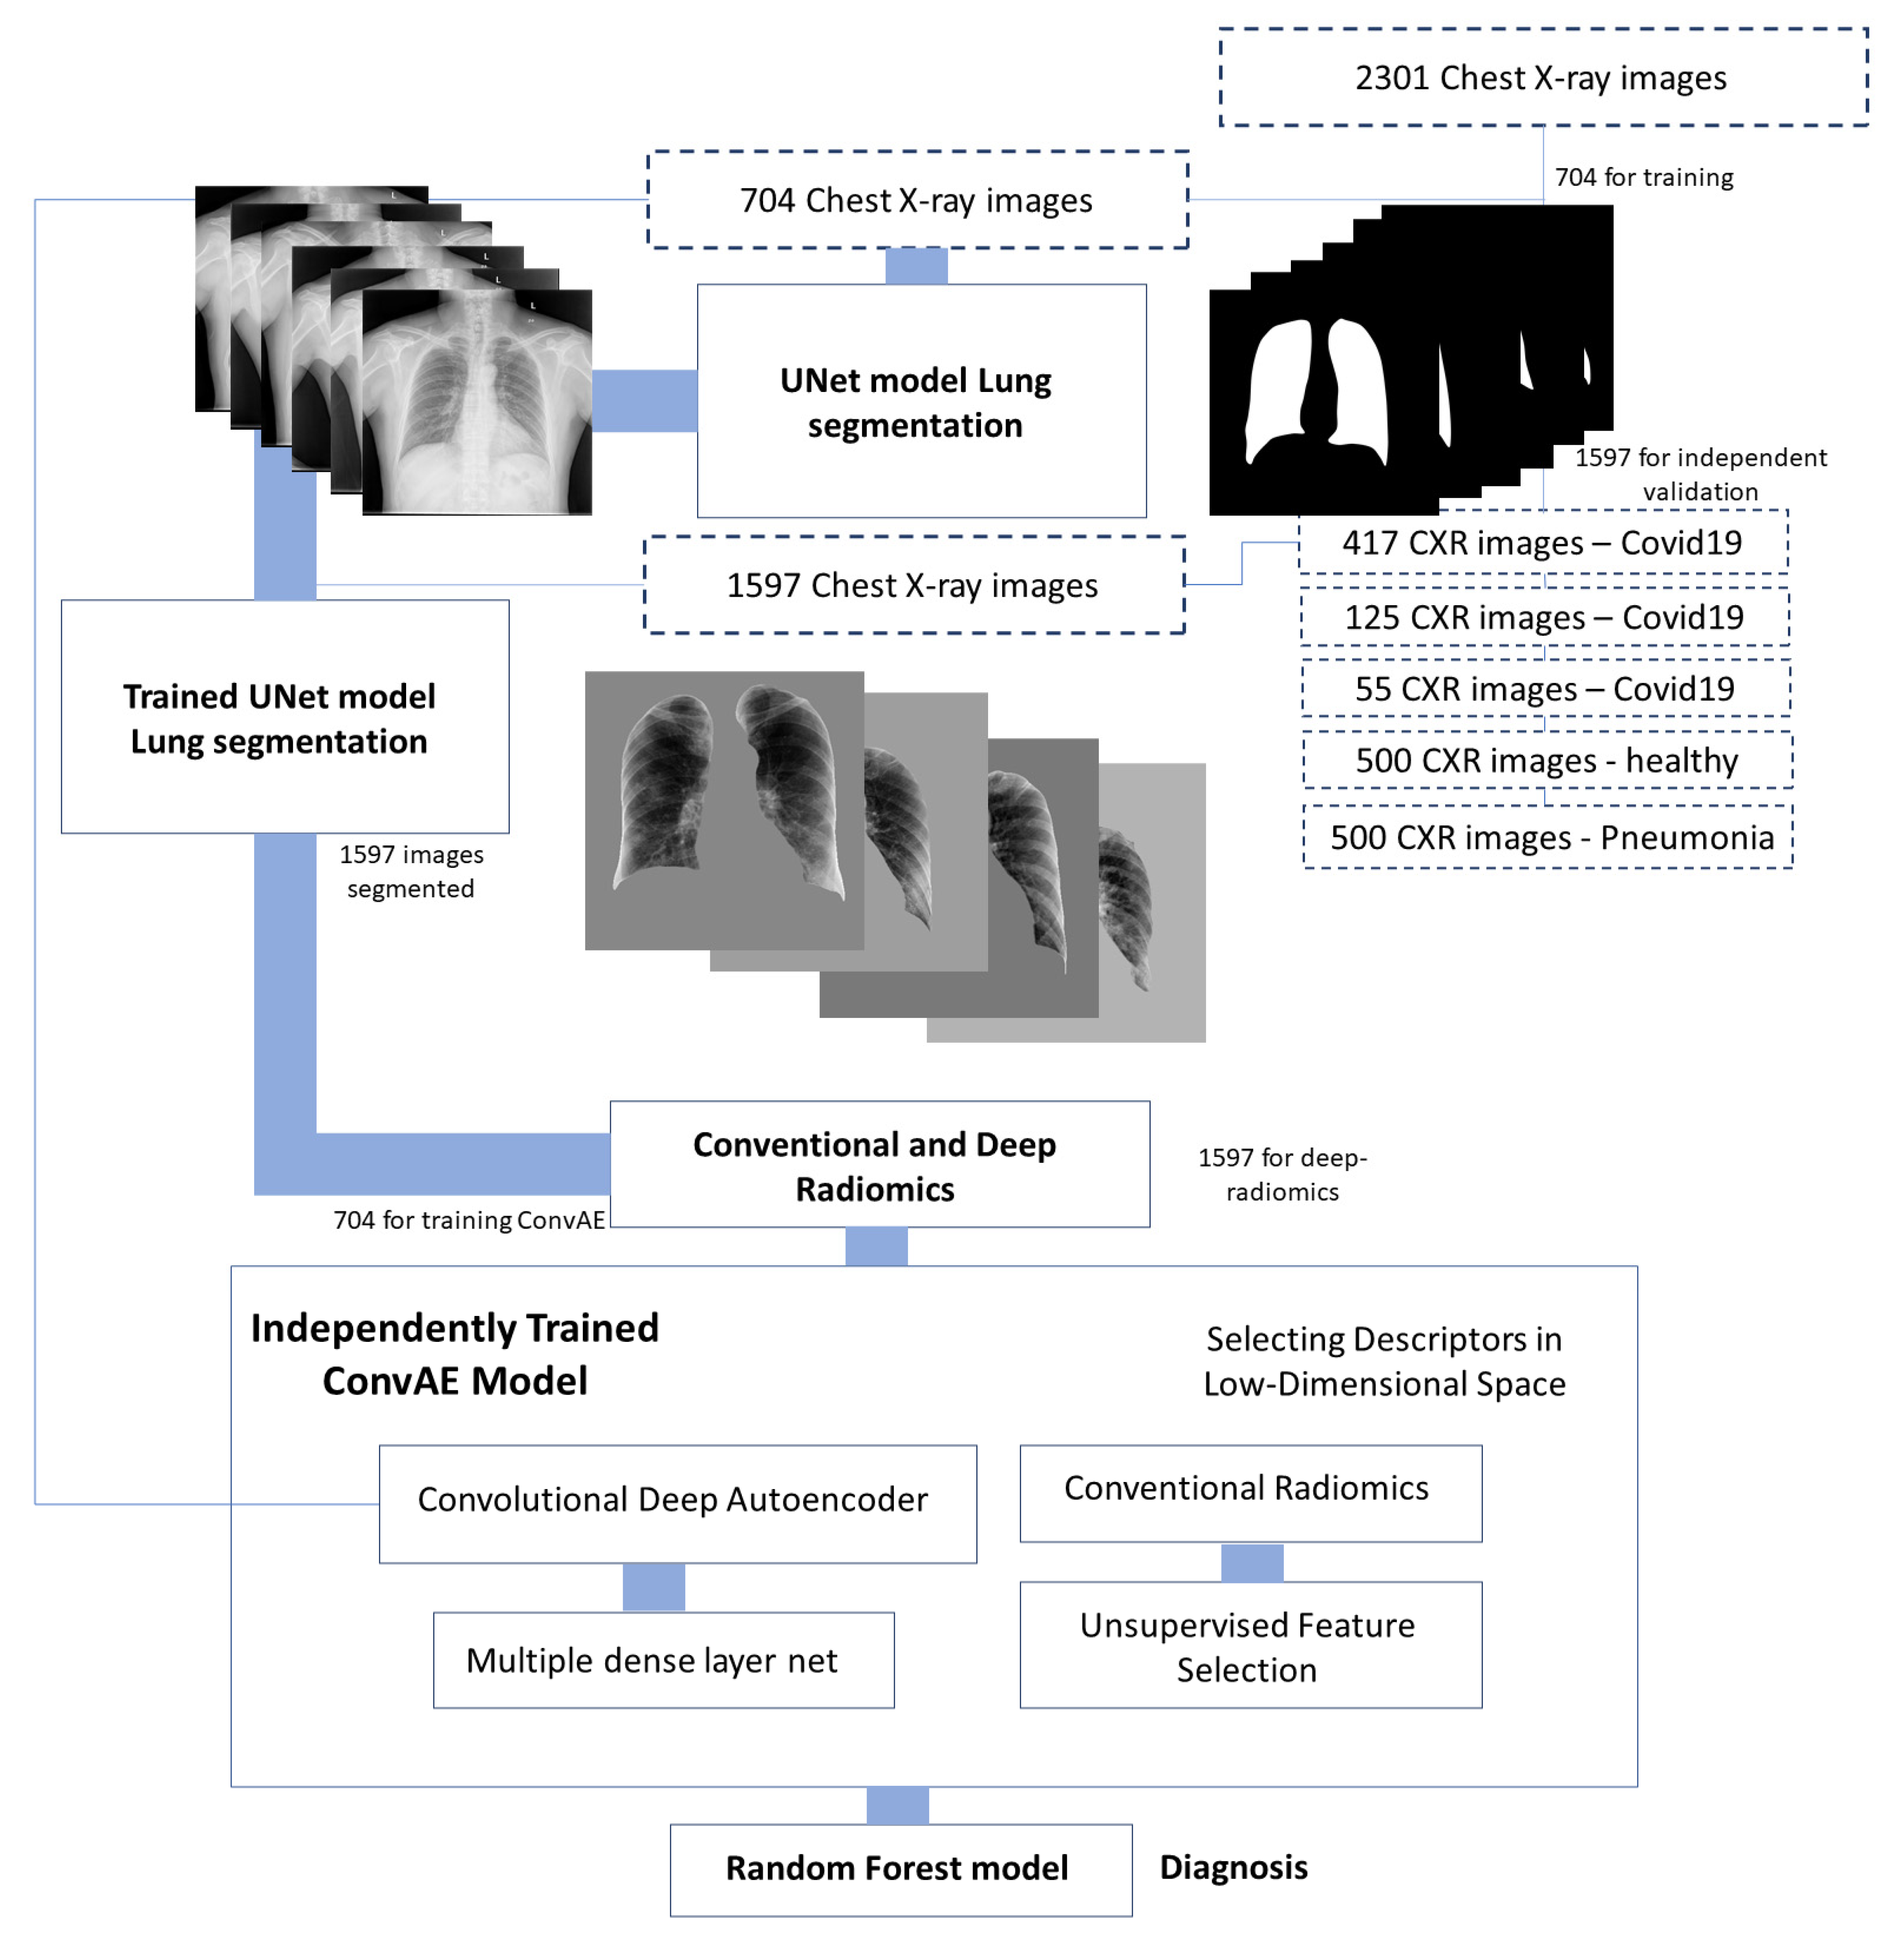
In the next section, the methodology and application of U-Net and ConvAE to segment lung lobes (https://www.kaggle.com/nikhilpandey360/chest-xray-masks-and-labels, accessed on 21 January 2019) and extract deep radiomics are presented. Section 3 and Section 4 show experimental results and discussion, respectively. Section 5 concludes the study with a summary of the results and overall performance.

2. Methods

The proposed methodology relies on a hierarchy of deep learning models for segmenting lung lobes, extracting deep radiomics, and detecting COVID-19 cases from extracted features. The workflow of the proposed study is shown in Figure 1.

2.1. U-Net for Segmentation of Lung Lobes

Lung lobes segmentation has achieved reasonable accuracy using different configurations of deep neural networks [15,16,17,18,19,20,21,22,23]. Particularly, automatic segmentation of lung lobes to diagnose COVID-19 uses deep-learning-based models. Among many structures, the U-Net architecture has achieved exceptional capability in segmenting lung images in CT and CXR modalities [15,21]. In this study, we used 2D U-Net to segment lung lobes in CXR images.
The U-Net architecture [39] contains an encoding (contracting) path and decoding (expanding) path in the model. The encoding path shrinks the input spatial dimension to reduce the size, and the decoding pathway enlarges the dimensionality of the data and then generates segmentation maps as the outcome. The initial design does not use padding in convolutional layers, leading to a smaller output segmentation map. However, as we would like to preserve the same initial spatial range of the input and the output, we used padding in the model’s architecture. Our modified architecture had 32 convolutional layers in the encoding (contracting) path. All the CXR images were normalized, and for every convolutional layer, batch normalization and a rectified activation linear unit (ReLu) layer were used. After every consecutive convolutional layer, three 2 × 2 pooling layers decreased the input spatial dimension of 512 × 512 to a reduced dimensionality of 32 × 32 as the outcome of the contracting path (encoder). After that, these compressed data were directed to a decoder (expanding path), which has an encoder with skip connection (bridges) between two paths. This path was deconvolved by upsampling the data with a constant kernel size (2 × 2). The transitional data from the encoder were then appended to the upsampled data in each layer for the entire path, which facilitated the model to reconstruct the information lost throughout the max-pooling process. Our model took a CXR image with a single channel and spatial size of 512 × 512 for 2D and a cube size of 128 × 128 × 64 for 3D model. Figure 2 shows more details about the network architecture. Additionally, the convolutional and deconvolutional layers with their filters are presented in Figure 2, which can help the readers follow changes in data dimensionality through the model. The overall trainable parameters in our network are 7,759,521.
Dice loss: The Dice loss function originated from the Sørensen–Dice similarity coefficient in the 1940s and was used to measure the similarity between two samples [40,41]. The Dice loss is used for 3D segmentation of medical imaging in 2016 [42]. Dice similarity coefficient (DSC)’s definition is represented as follows:
DSC = 2 i N p ( y i ) g i i N p ( y i ) 2 + i N g i 2
where p ( y i ) is the predicted probability value of the segmented label i , and g i represents the actual label value to be segmented by our model. i changes according to the number of segments (here we have two labels lung lobes and background).
Binary cross-entropy loss function/log loss: Binary, or sigmoid, cross-entropy (BCE) [43] is a cross-entropy loss function modified by adding a sigmoid activation function in the overall loss as follows:
BCE = 1 R   i = 1 R y i   l o g ( p ( y i ) ) + ( 1 y i ) l o g ( 1 p ( y i ) )
where y represents the actual label and p ( y ) is the predicted probability value of the segmented label for all R points. The use of a sigmoid function, 1 1 + e y , allows the function’s binarization, representing the existing class against the background class.

2.2. Deep Radiomics

Convolutional neural networks (CNNs) are recognized deep neural network structures that have been widely used for a variety of applications, especially in medicine [44]. The convolution layers made by additive adaptive filters that control the receipt field of the layers have increased the popularity and efficiency of the model [45,46,47,48]. We have already used CNN in the U-Net to segment the lung lobes in the previous section. Another known form of utilizing such models is to extract hidden layer weights of a pretrained model and use them as features, called deep radiomics, or deepomics. Some successful pretrained models used for this purpose are AlexNet [45], deep residual network (ResNet) [49], VGG network [50], and GoogleNet (also codenamed Inception_v1) [51]. In medical imaging and, specifically, COVID-19 imaging research, many CNN models were used as pretrained, fine-tuned, or slightly modified models, which showed promising results to detect COVID-19. Pretrained ResNet and InceptionV3 models were used in various versions either individually or combined to detect COVID-19 infection in CXR imaging [10,28]. The transfer learning method was applied to one or a combination of several pre-trained CNN models (i.e., Xception) for detecting COVID-19 [8,10,34]. An application of deep learning to deal with the high dimensionality of deep radiomics using Xception + ResNet50V2 involves convolutional and drop-out layers [34], which has some similarities with a parallel-dilated convolutional neural network architecture [37], despite the fundamental differences that come from using two distinct deep-learning pathways instead of pretrained models. Similarly, there are some other variations of pretrained models labeled with other names (i.e., CoroNet [30] and COVIDX-Net [36]), which achieved considerable performance in differentiating COVID-19 from pneumonia and normal cases. Several deep-learning-interconnected models used a hierarchy of CNN models with more innovative configurations to conduct classification, such as DarkCovidNet [35] and COVID-Net [9].
The extraction of radiomics-based features also has sparked great interest among researchers in the field, in which a large number of features from CXR images are extracted through deep-learning models (e.g., ResNet) and SVM [31] or conventional radiomics approaches [52,53] used to perform computer-aided diagnosis. Although better diagnostic/prognostic decisions are made by having higher dimensional features to capture the characteristics of the medical data better, the abundance of attributes creates a problem called the curse of dimensionality. It lowers the accuracy while showing pseudo improvement in the overall accuracy of the system due to the increased collinearity among the features. To alleviate this problem, one potential solution is to use deep-learning feature selection for deep radiomics [54].
In this study, a deep convolutional autoencoder modified with dense layers was used. Several initial layers are convolutional layers with 3 × 3 filter size and dense layers to convert the input images to latent space and extract the representation code of the input [52,55]. Such a stacked autoencoder encodes the input CXR image into compressed latent space radiomics, also known as code, within the lower-dimensional space. With these codes, the autoencoder reconstructs the original input similar to decoder path modules [56,57]. The proposed architecture carries out the self-learning representations from CXR images and analyzes the latent space-compressed radiomic features in terms of their discriminative capacity. By training the autoencoder, the model learns how to reconstruct the compact representation of input data.
Here, we propose the CNN-based radiomics through a stacked autoencoder trained exclusively for such high-dimensional input CXR images. Autoencoders are data specific, spontaneously learned from training input CXR images, with a completely independent dataset, instead of achieving by human interference and lossy. This model is trained based on the loss function comparing the original input and decompressed representations. The parameters of the compression (encoding)/decompression (decoding) functions are updated in such a way that they minimize the reconstruction loss using stochastic gradient descent (SGD) [56,57].
Consider a 10-layer convolutional autoencoder model, as depicted graphically in Figure 2. Let x M × M with M = 512   be the CXR input image that passes through the 5-layer convolutional encoder. In each encoder layer, there is a filter bank K f 3 × 3 , with a dilation rate of 1 and fixed f = 1 , 2 , , F , ( F = 32) number of filters for the entire model [58]. The convolution layer creates a feature map Y f M ´ × M ´ , by 2D discrete convolution, and is shown by the following:
Y f i , j = x = 0 2 y = 0 2 K f 2 x , 2 y X 1 + s ( i 1 ) 2 , 1 + s ( j 1 ) 2  
where M ´ = M , and s 1 is called a stride. In general, a single layer model is an affine transformation of x by a nonlinear function y ^ = f ( W x + b ) , where the weight matrix is W D × M ,    b   D is a bias term, and f ( . ) is a nonlinear function. The output h p of a layer, p is presented by the following:
h p + 1 = f p + 1 ( W p h p + b p ) = f p + 1 ( W p f p ( ( f 1 ( W 0 x + b 0 ) ) + b p 1 ) + b p )
where h 1 = f 1 ( W 0 x + b 0 ) is the first layer’s output, and h p is known as a feature vector at the path layer. The proposed autoencoder consists of a multiple-layer encoder denoted as E .
h = f E ( x ; θ E )
where h is the output of the encoder or the features (CNN-based radiomics) and θ = { W p , b p } p = 0 p 1 . A decoder network showed as D also reconstructs the input x by the following:
x ^ = f D ( h ; θ D )
Training this autoencoder then involves calculating the expected reconstruction loss over all the training samples [58] as follows:
θ E * , θ D * = arg min θ E , θ D   𝔼 ( x , y ) 𝒫 [ ( f ( x ; θ ) , y ) ]
where 𝒫 is data generating distribution and ( y ^ , y ) is discrepancy loss of the reconstructed and input data. We use BCE loss here, as presented in Equation (2). Neural networks are often trained using SGD or its variations [59,60] in which gradients are computed with the backpropagation procedure [61]. The proposed ConvAE model has a 3 × 3   kernel filter, 2 × 2 kernel stride, same padding, with no residual connection, and dese layer between contraction and expansion paths (see Figure 2).

2.3. Conventional Radiomics Features

Decoding tumor imaging information into subvisual and quantitative features through the extraction of radiomics features as mineable data follows four steps: image acquisition; selection of the region of interest (ROI); extraction of features; decision making (predictive/prognosis method) [62,63,64]. The proposed approach employed 354 radiomics features in 9 families: first-order statistics (FO), shape-based expression (SB), gray level co-occurrence matrix (GLCM), gray level dependence matrix (GLDM), gray level run length matrix (GLRLM), gray level size zone matrix (GLSZM), neighboring gray-tone difference matrix (NGTDM), Laplacian of Gaussian (LOG), and three-layer filtering wavelet. The dimension of these conventional radiomics renders the data analysis prone to the curse of dimensionality problem.
This study used three different unsupervised feature selection approaches trained on our training set and independently tested our targeted cohorts. We applied the Johnson–Lindenstrauss (JL) lemma [65,66], Laplacian scoring [67], and principal component analysis (PCA) [68] to reduce the dimensionality of conventional radiomics extracted by spanning the current manifold of data onto low-dimensional space using a sparse Achlioptas matrix. All three of these approaches were applied to the Shenzhen set (n = 704) in the discovery stage. Then, the entire parameters of the system were frozen for the independent validation step (n = 1597). Having our deep and conventional radiomics compressed, we used a random forest to classify COVID-19 patients from pneumonia and healthy cases using each category of the radiomics (i.e., ConvAE latent space, conventional radiomics, or a combination of both) (Figure 1).

3. Results

Our models (U-Net and ConvAE) were trained and independently validated with three other datasets to examine the proposed systems. In the next section, we describe all datasets in detail. We used only COVID-19 cases that have confirmed lung manifestation. These datasets were selected randomly and based on having a higher number of COVID-19 patients. Table 1 presents number of patients used for training and validation of the proposed approach.
The resulting U-Net to segment the lung area and ConvAE to extract CNN-based radiomics were subsequently evaluated in terms of the ability to diagnose COVID-19 versus healthy and pneumonia patients.

3.1. Study Population

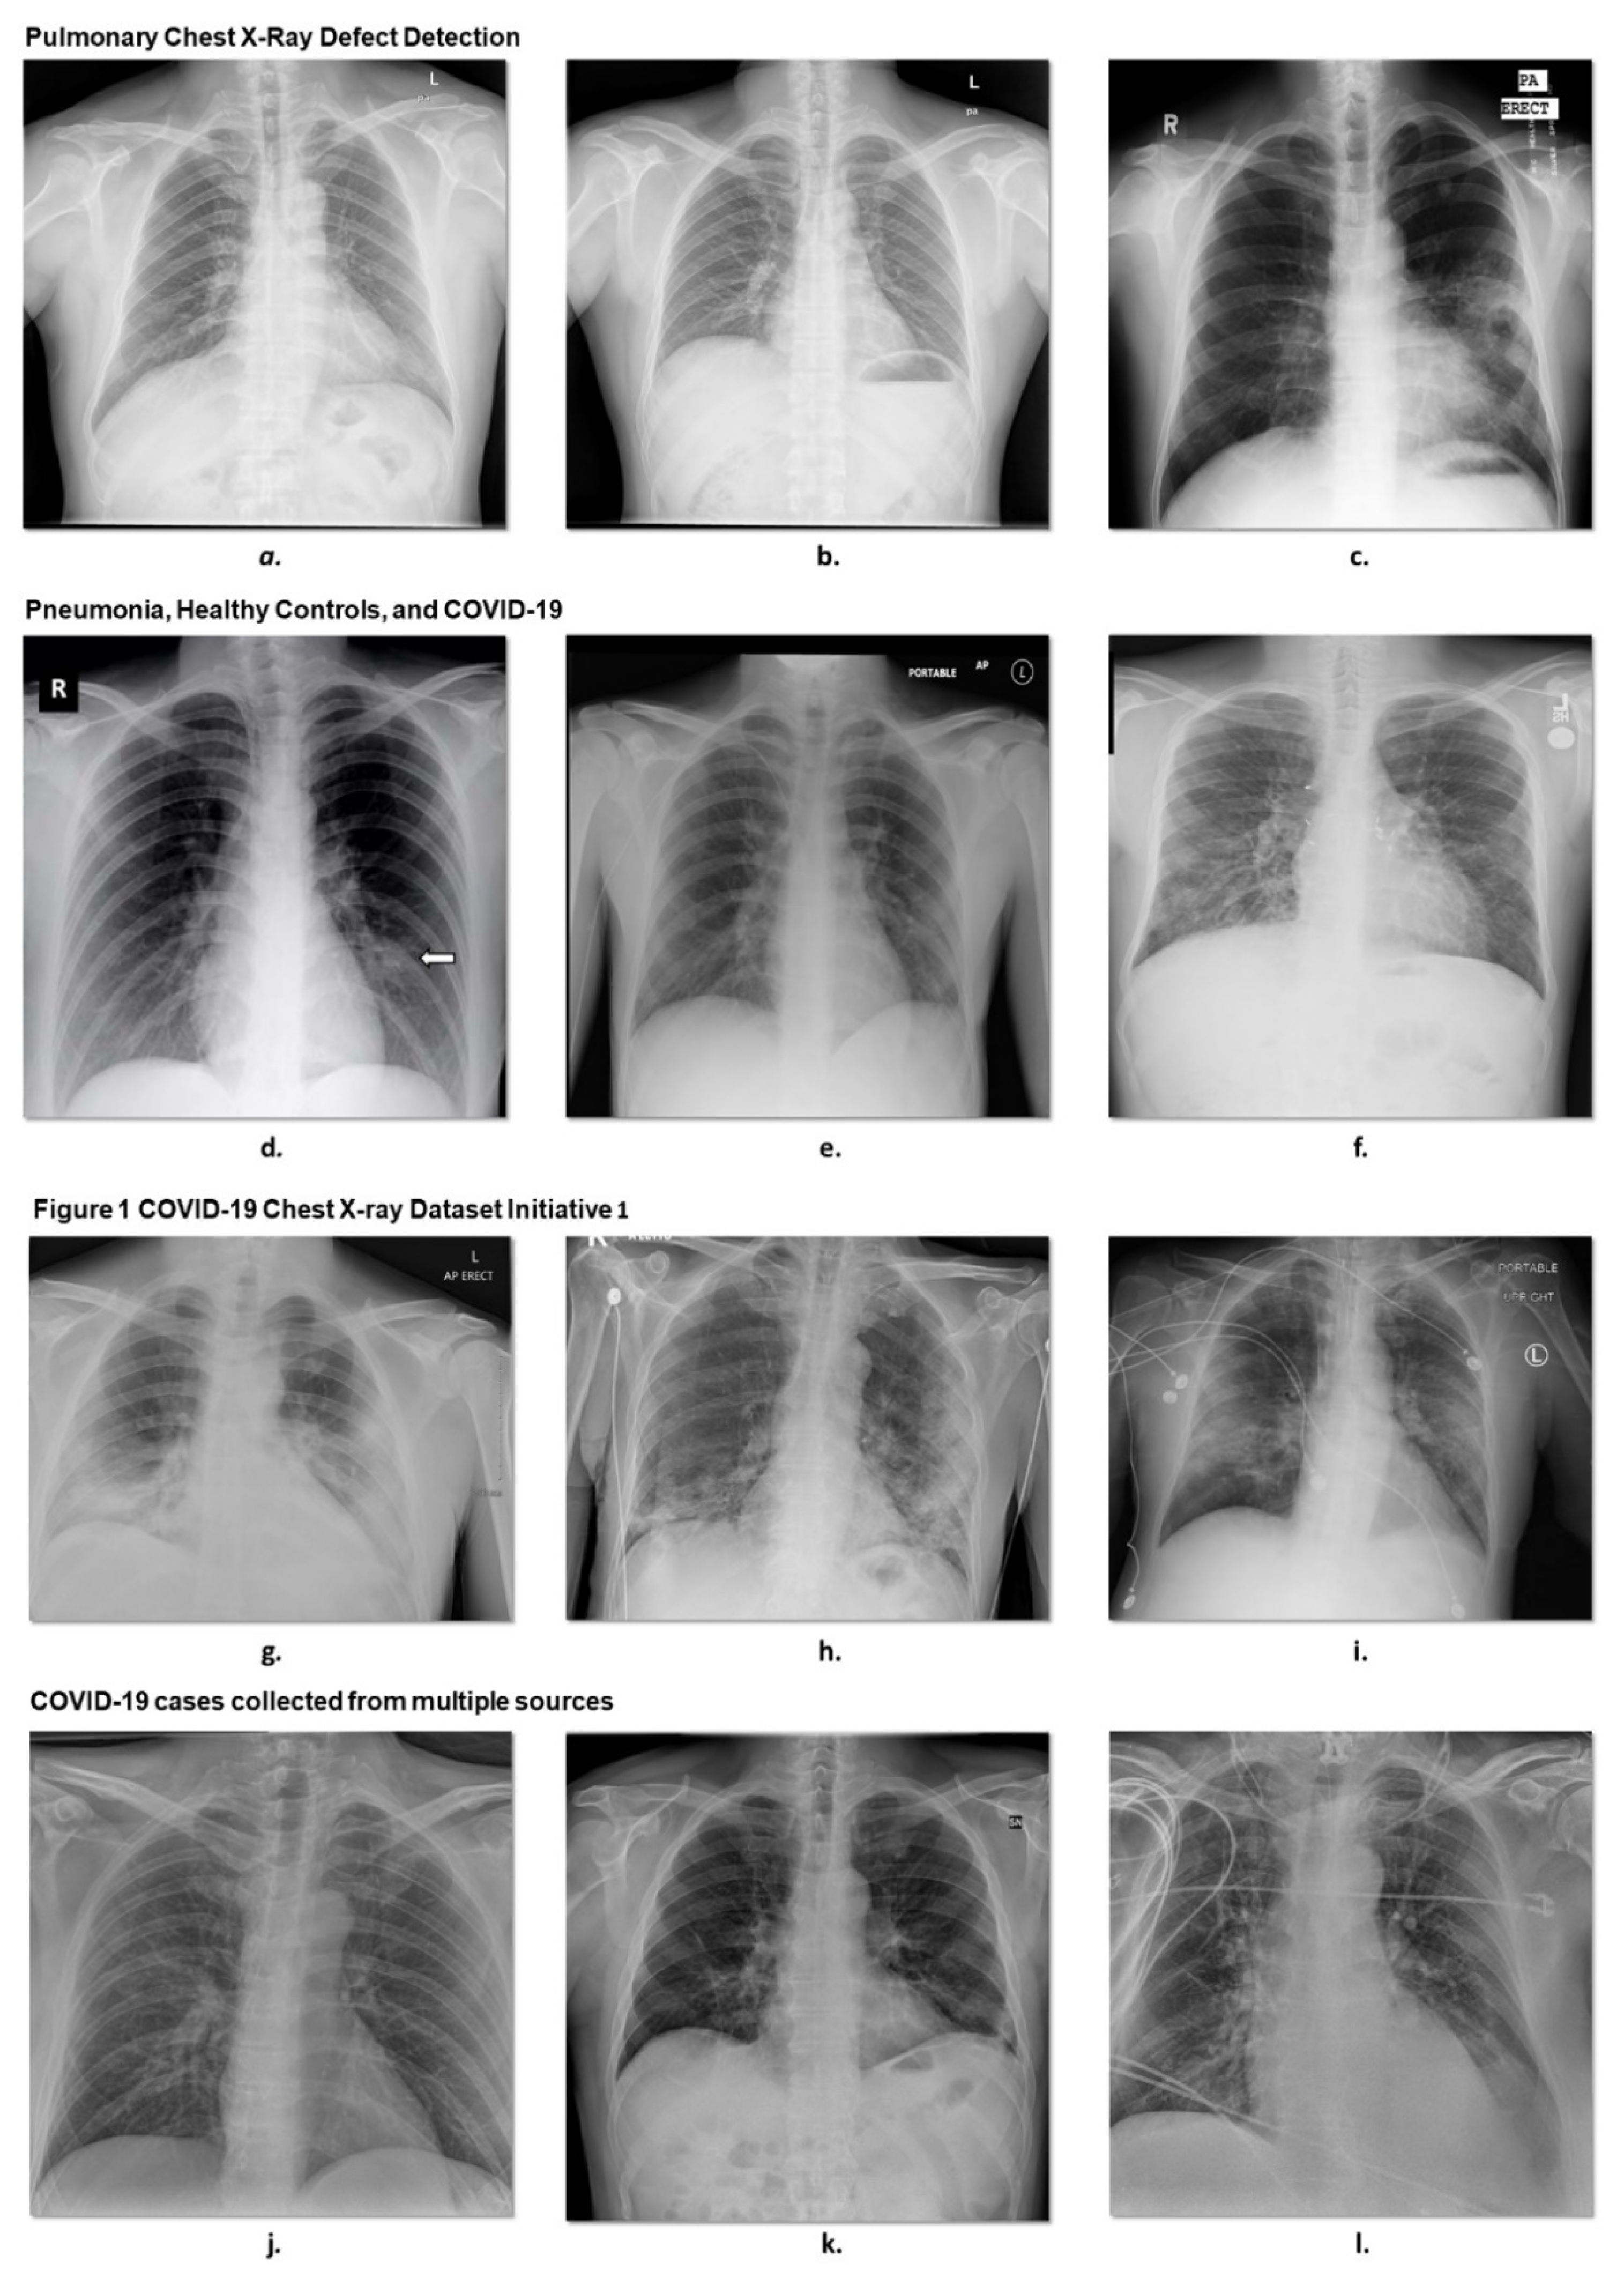
3.1.1. Pulmonary Chest X-ray Disease Detection

To design and test the U-Net model for the segmentation of the lung lobes, we used 704 chest X-ray images from the Pulmonary Chest X-Ray Defect Detection, Montgomery County X-ray set, and China set—The Shenzhen set—Chest X-ray Database provided by the National Library of Medicine, National Institutes of Health, Bethesda, MD, USA, and Shenzhen No. 3 People’s Hospital, Guangdong Medical College, Shenzhen, China [69,70]. For the Montgomery County X-ray set, images were acquired from the Department of Health and Human Services (the tuberculosis control program) of Montgomery County, MD, USA. The dataset contains 138 posterior–anterior X-rays, of which 58 cases are abnormal with manifestations of tuberculosis, and 80 cases are normal. The rest of the data were from the Shenzhen set, which contains 336 cases with tuberculosis and 326 normal cases. From the data, we selected 566 cases based on the availability of their masks. Figure 3a–c presents some examples of this dataset.

3.1.2. COVID-19 Cases Collected from Multiple Sources

In total, 417 frontal chest X-rays of COVID-19 cases were selected from the dataset, 761 images with 679 frontal chest and 82 lateral views. Of the 679 frontal images, 518 were standard frontal posteroanterior–anteroposterior (PA/AP) views, and 161 were AP laying down supine all of which were collected from different hospitals across 26 countries. In total, there were 468 COVID-19 (SARSr-CoV-2), 16 SARS (SARSr-CoV-1), 10 MERS-CoV, 5 Varicella, 4 Influenza, 3 Herpes viral cases, 13 Streptococcus spp., 9 Klebsiella spp., 4 Escherichia coli, 4 Nocardia spp., 5 Mycoplasma spp., 7 Legionella spp., 2 Unknown, 1 Chlamydophila spp., 1 Staphylococcus spp. bacterial cases, 24 Pneumocystis spp., 2 Aspergillosis spp. fungal cases, 8 Lipoid, 1 Aspiration, and 59 unknown cases in the age of 20 to 90 years old [71,72,73,74,75,76,77,78,79,80] (Figure 3j–l).

3.1.3. Pneumonia, Healthy Controls, and COVID-19

In total, 1125 chest X-ray cases were collected from multiple data sources. Of those, 125 COVID-19 cases were selected from [81], whereas 500 normal and 500 pneumonia cases [35] were selected from the ChestX-ray8 database [80] (Figure 3d–f).

3.1.4. Figure 1 COVID-19 Chest X-ray Dataset Initiative

A total of 55 frontal chest X-ray images of COVID-19 cases were selected from Figure 1 database. DarwinAI and the University of Waterloo have launched an open-source project as a part of the COVIDx dataset to develop the models for COVID-19 detection (COVID-Net) and COVID-19 risk stratification (COVID-RiskNet) [9,82,83,84]. Figure 3g–i shows three examples of this dataset.
All the data above were collected from multiple sources, which are publicly available through online websites, such as Figure 1 [84,85], Radiopaedia.org, the Italian Society of Medical and Interventional Radiology [86], and the Hannover Medical School [85,87]. The data are also accessible in the form of images from online publications, websites, or directly from PDFs using tools, such as pdf images [88]. All the images used for different parts of the proposed approach were frontal X-rays with an overall size of 512 × 512 pixels.

3.1.5. U-Net-Based Segmentation of the Lung Lobes

A total of 704 CXR images were randomly stratified into two training and testing groups, having 566 and 138 cases, respectively. We used the U-Net structure for 2D CHX imaging segmentation [89]. The input CXR images had a 512 × 512 dimension. All input images were normalized, and for every convolutional layer, batch normalization and a rectified activation linear unit (ReLu) layer were used. Every consecutive convolutional layer with a filter size of 3 × 3, 2 × 2 pooling layers decreased the input spatial dimension of 512 × 512 to a smaller dimension of 32 × 32 at the end of the encoder (contracting path). In the convolution layer, 16 filters were convolved with the input CXR images. The model used the same size padding with a 2 × 2 stride. In the decoder (expanding path), the model was a mirrored architecture of the encoder with skip connection (bridges) between two paths, as shown in Figure 1. This path was deconvolved with the upsampled data with a 3 × 3 kernel size. The intermediate data from the encoder was appended to the upsampled data in each layer for the entire path, which helps the model to reconstruct some of the information lost during the max-pooling operation. The overall number of trainable parameters in our network was 7,759,521, and the maximum number of channels was 512. The Adam optimizer trained all models with a modifying learning rate of 2 × 10 4 to   10 6 . The models were trained for 100 epochs with a batch size of 16 for the described cohort of patients. The proposed approach was implemented with the TensorFlow library in Python programming language [90,91] (for training and testing the model). The segmentation results were achieved throughout the inference process by applying the binary accuracy to the predicted similarity with ground truth (GT) labels, which reached close to 98% for the validation set. Then, this trained model was used to segment the lung lobes for other cohorts of patients and generated masks for 1597 CXR images preparing the data for extracting radiomics.

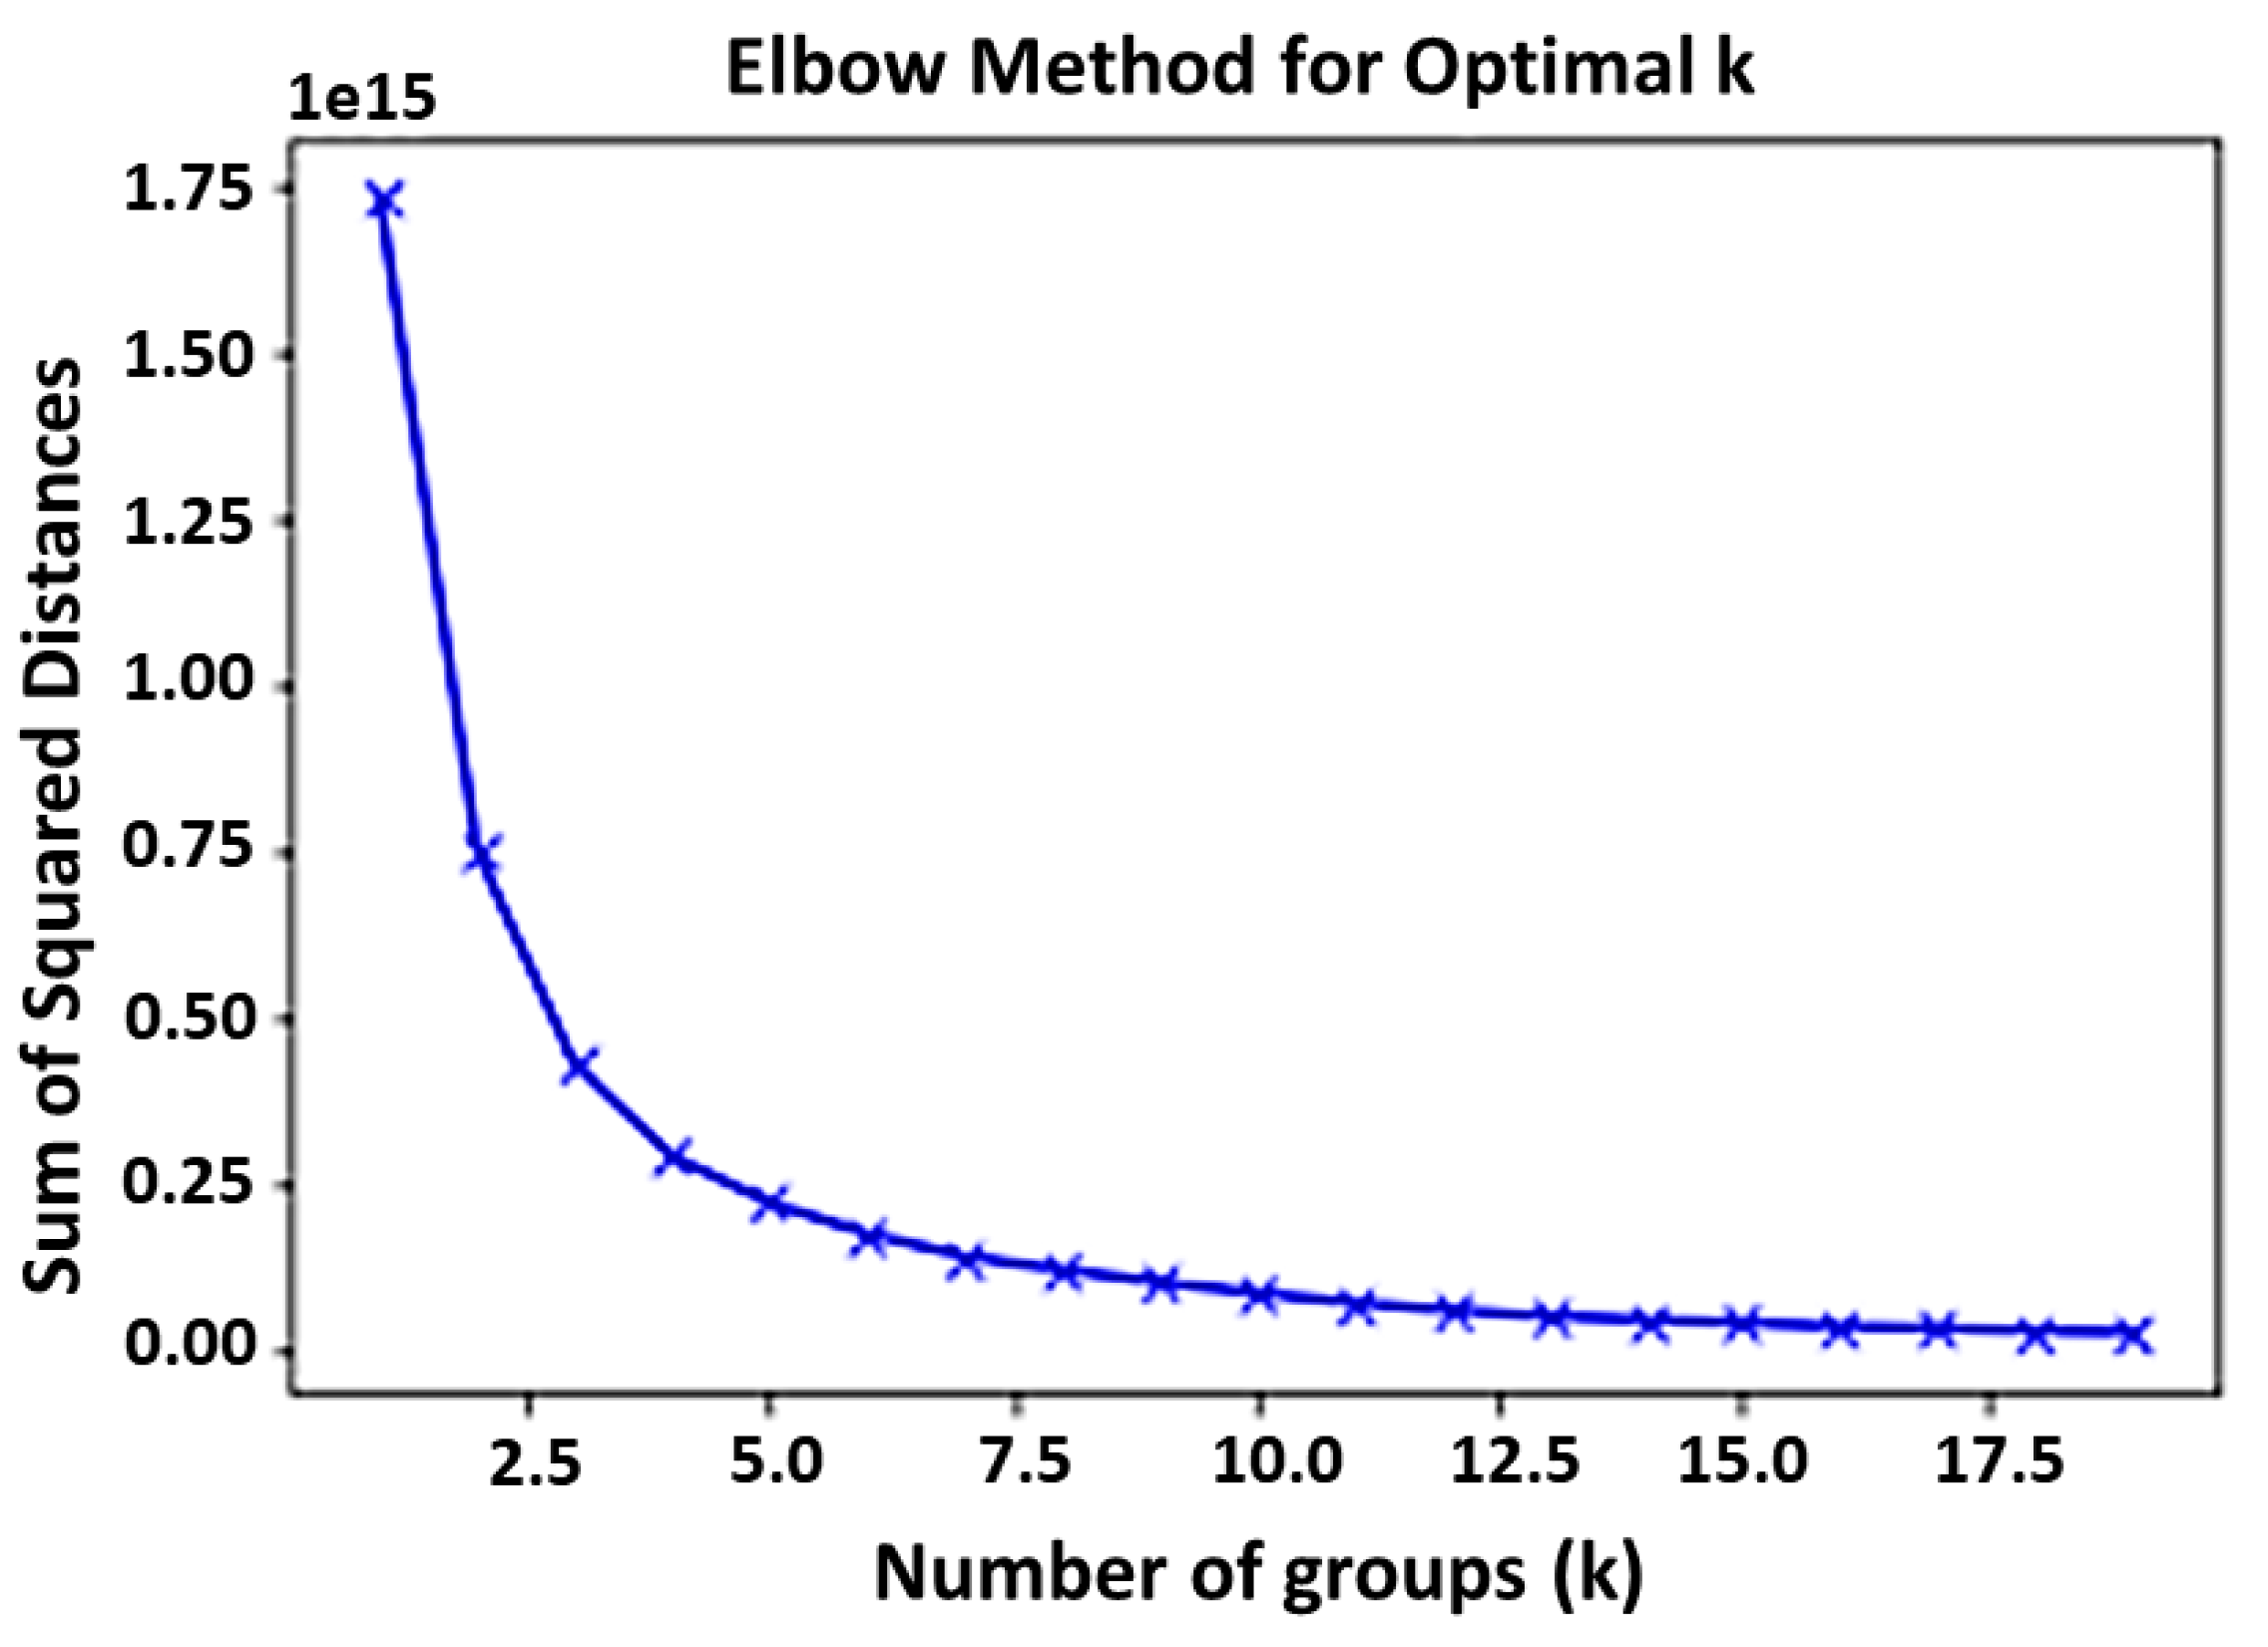
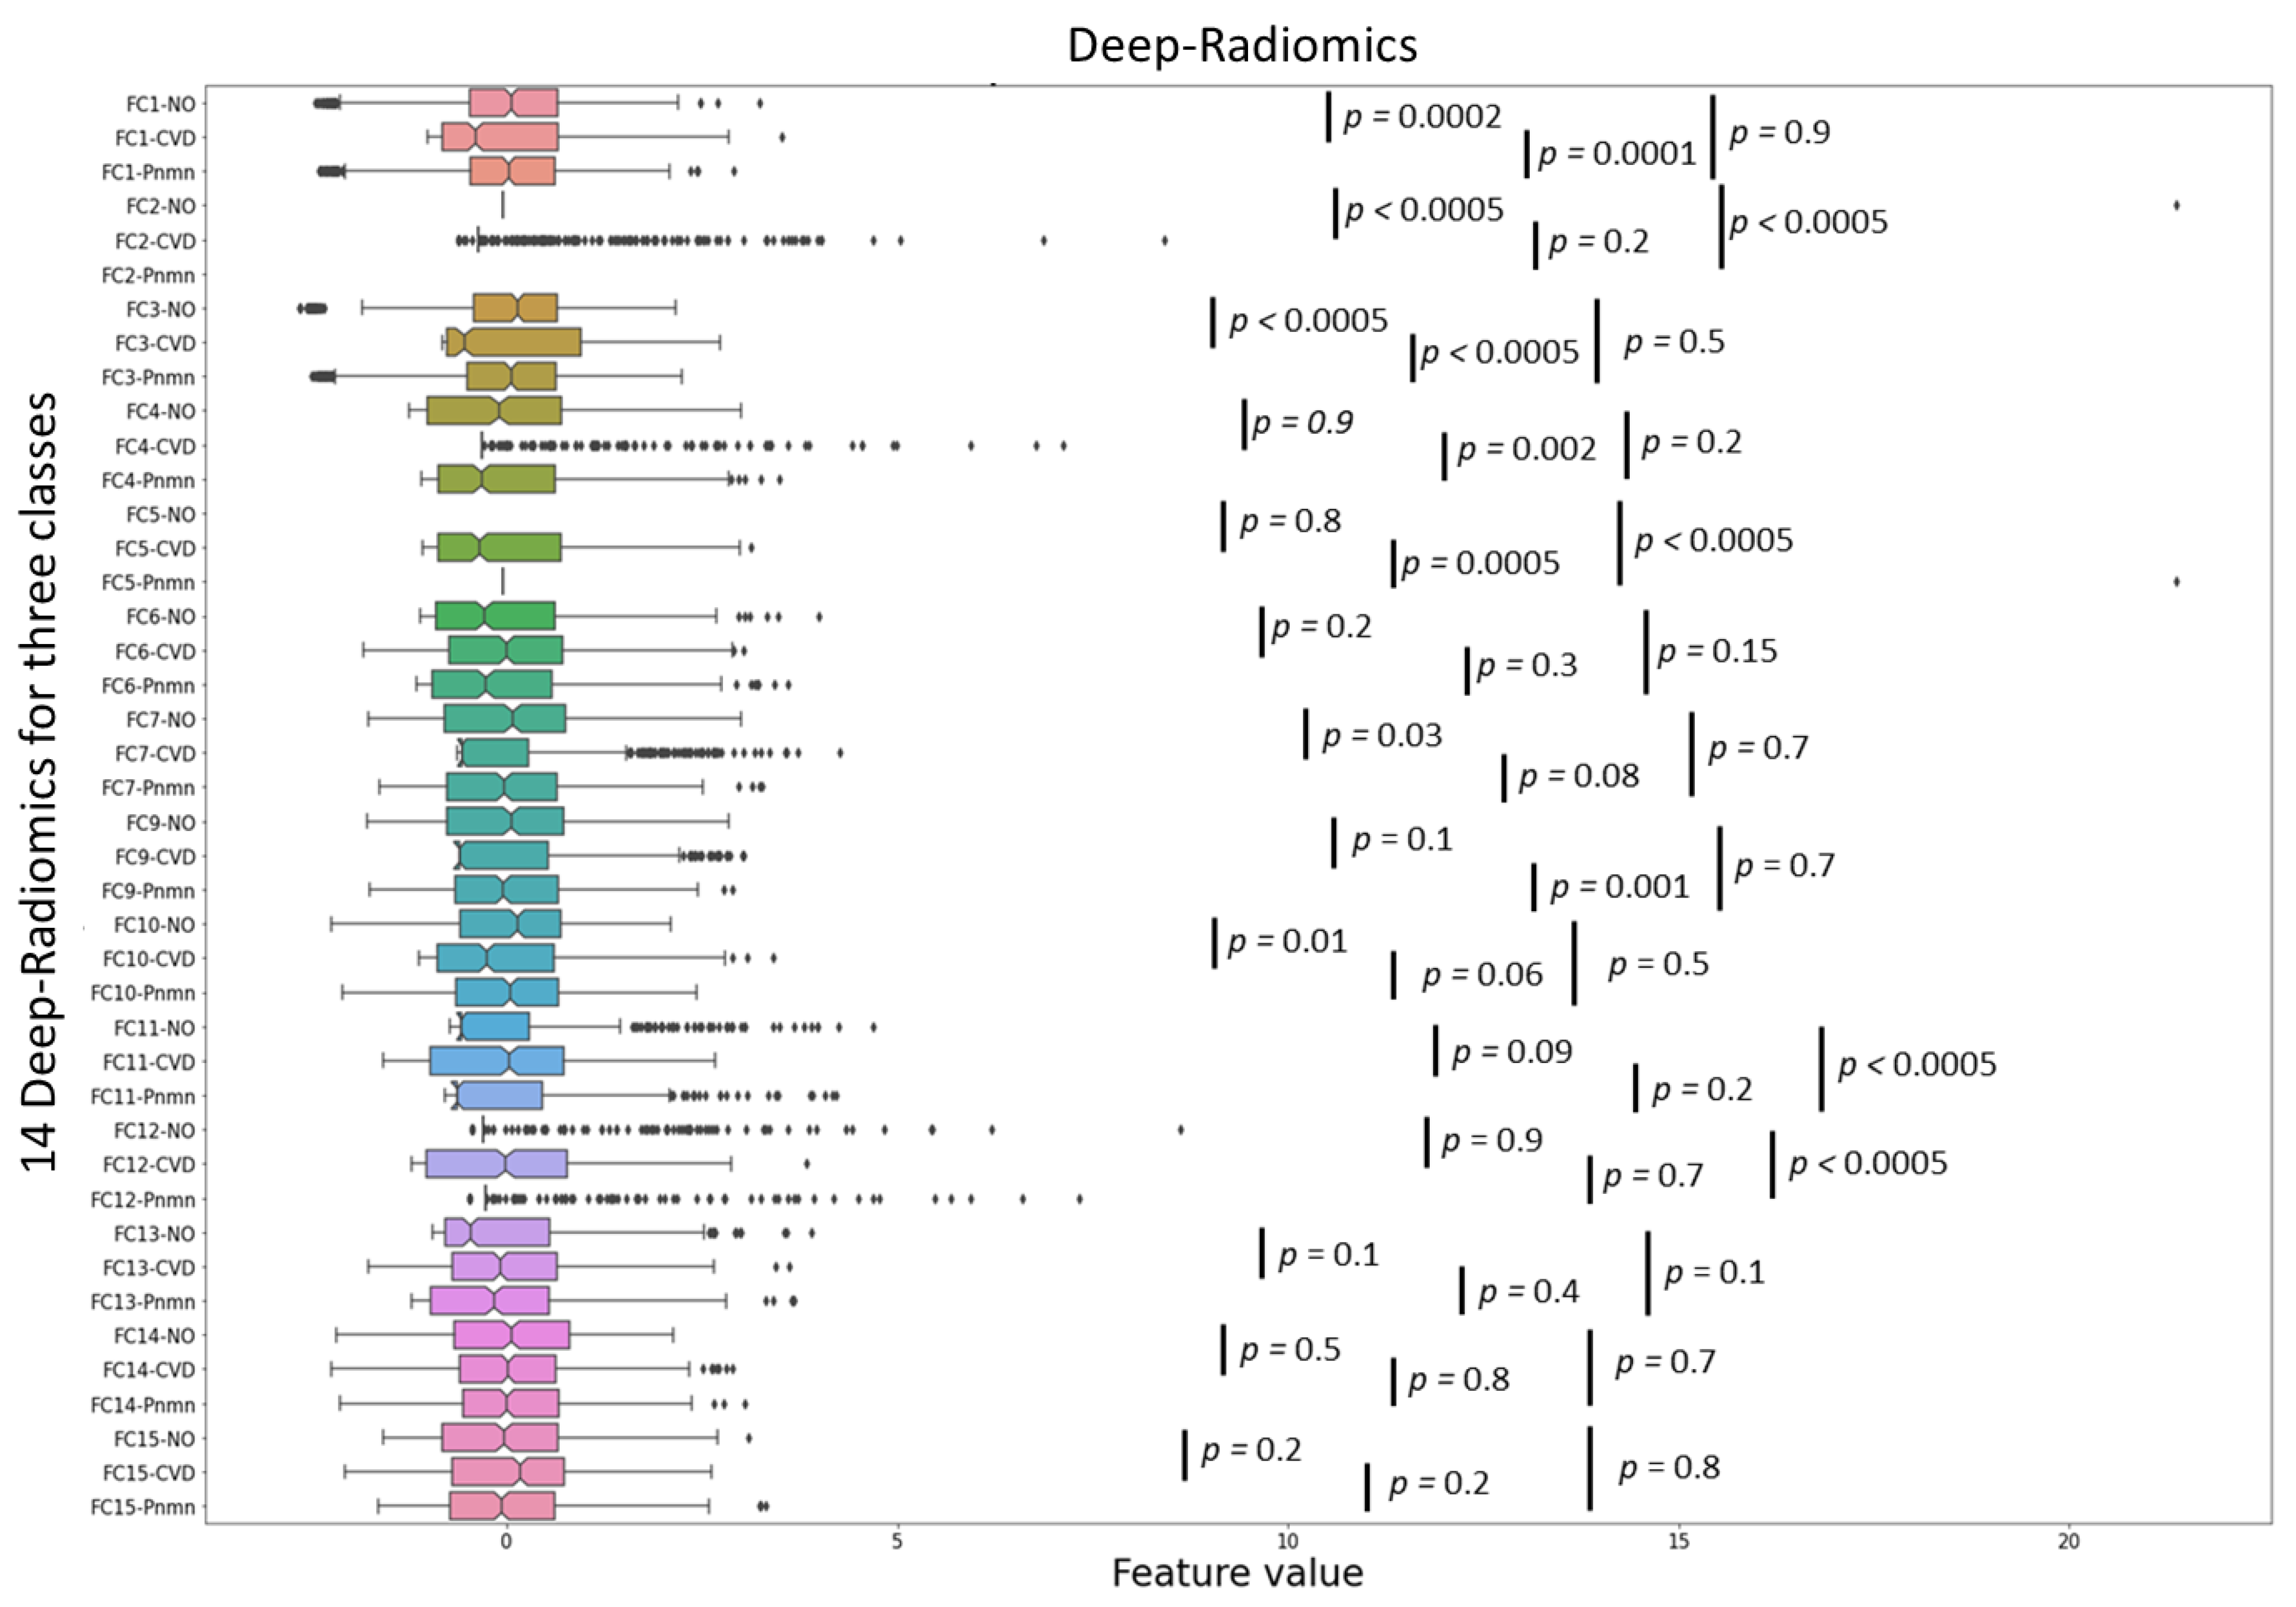
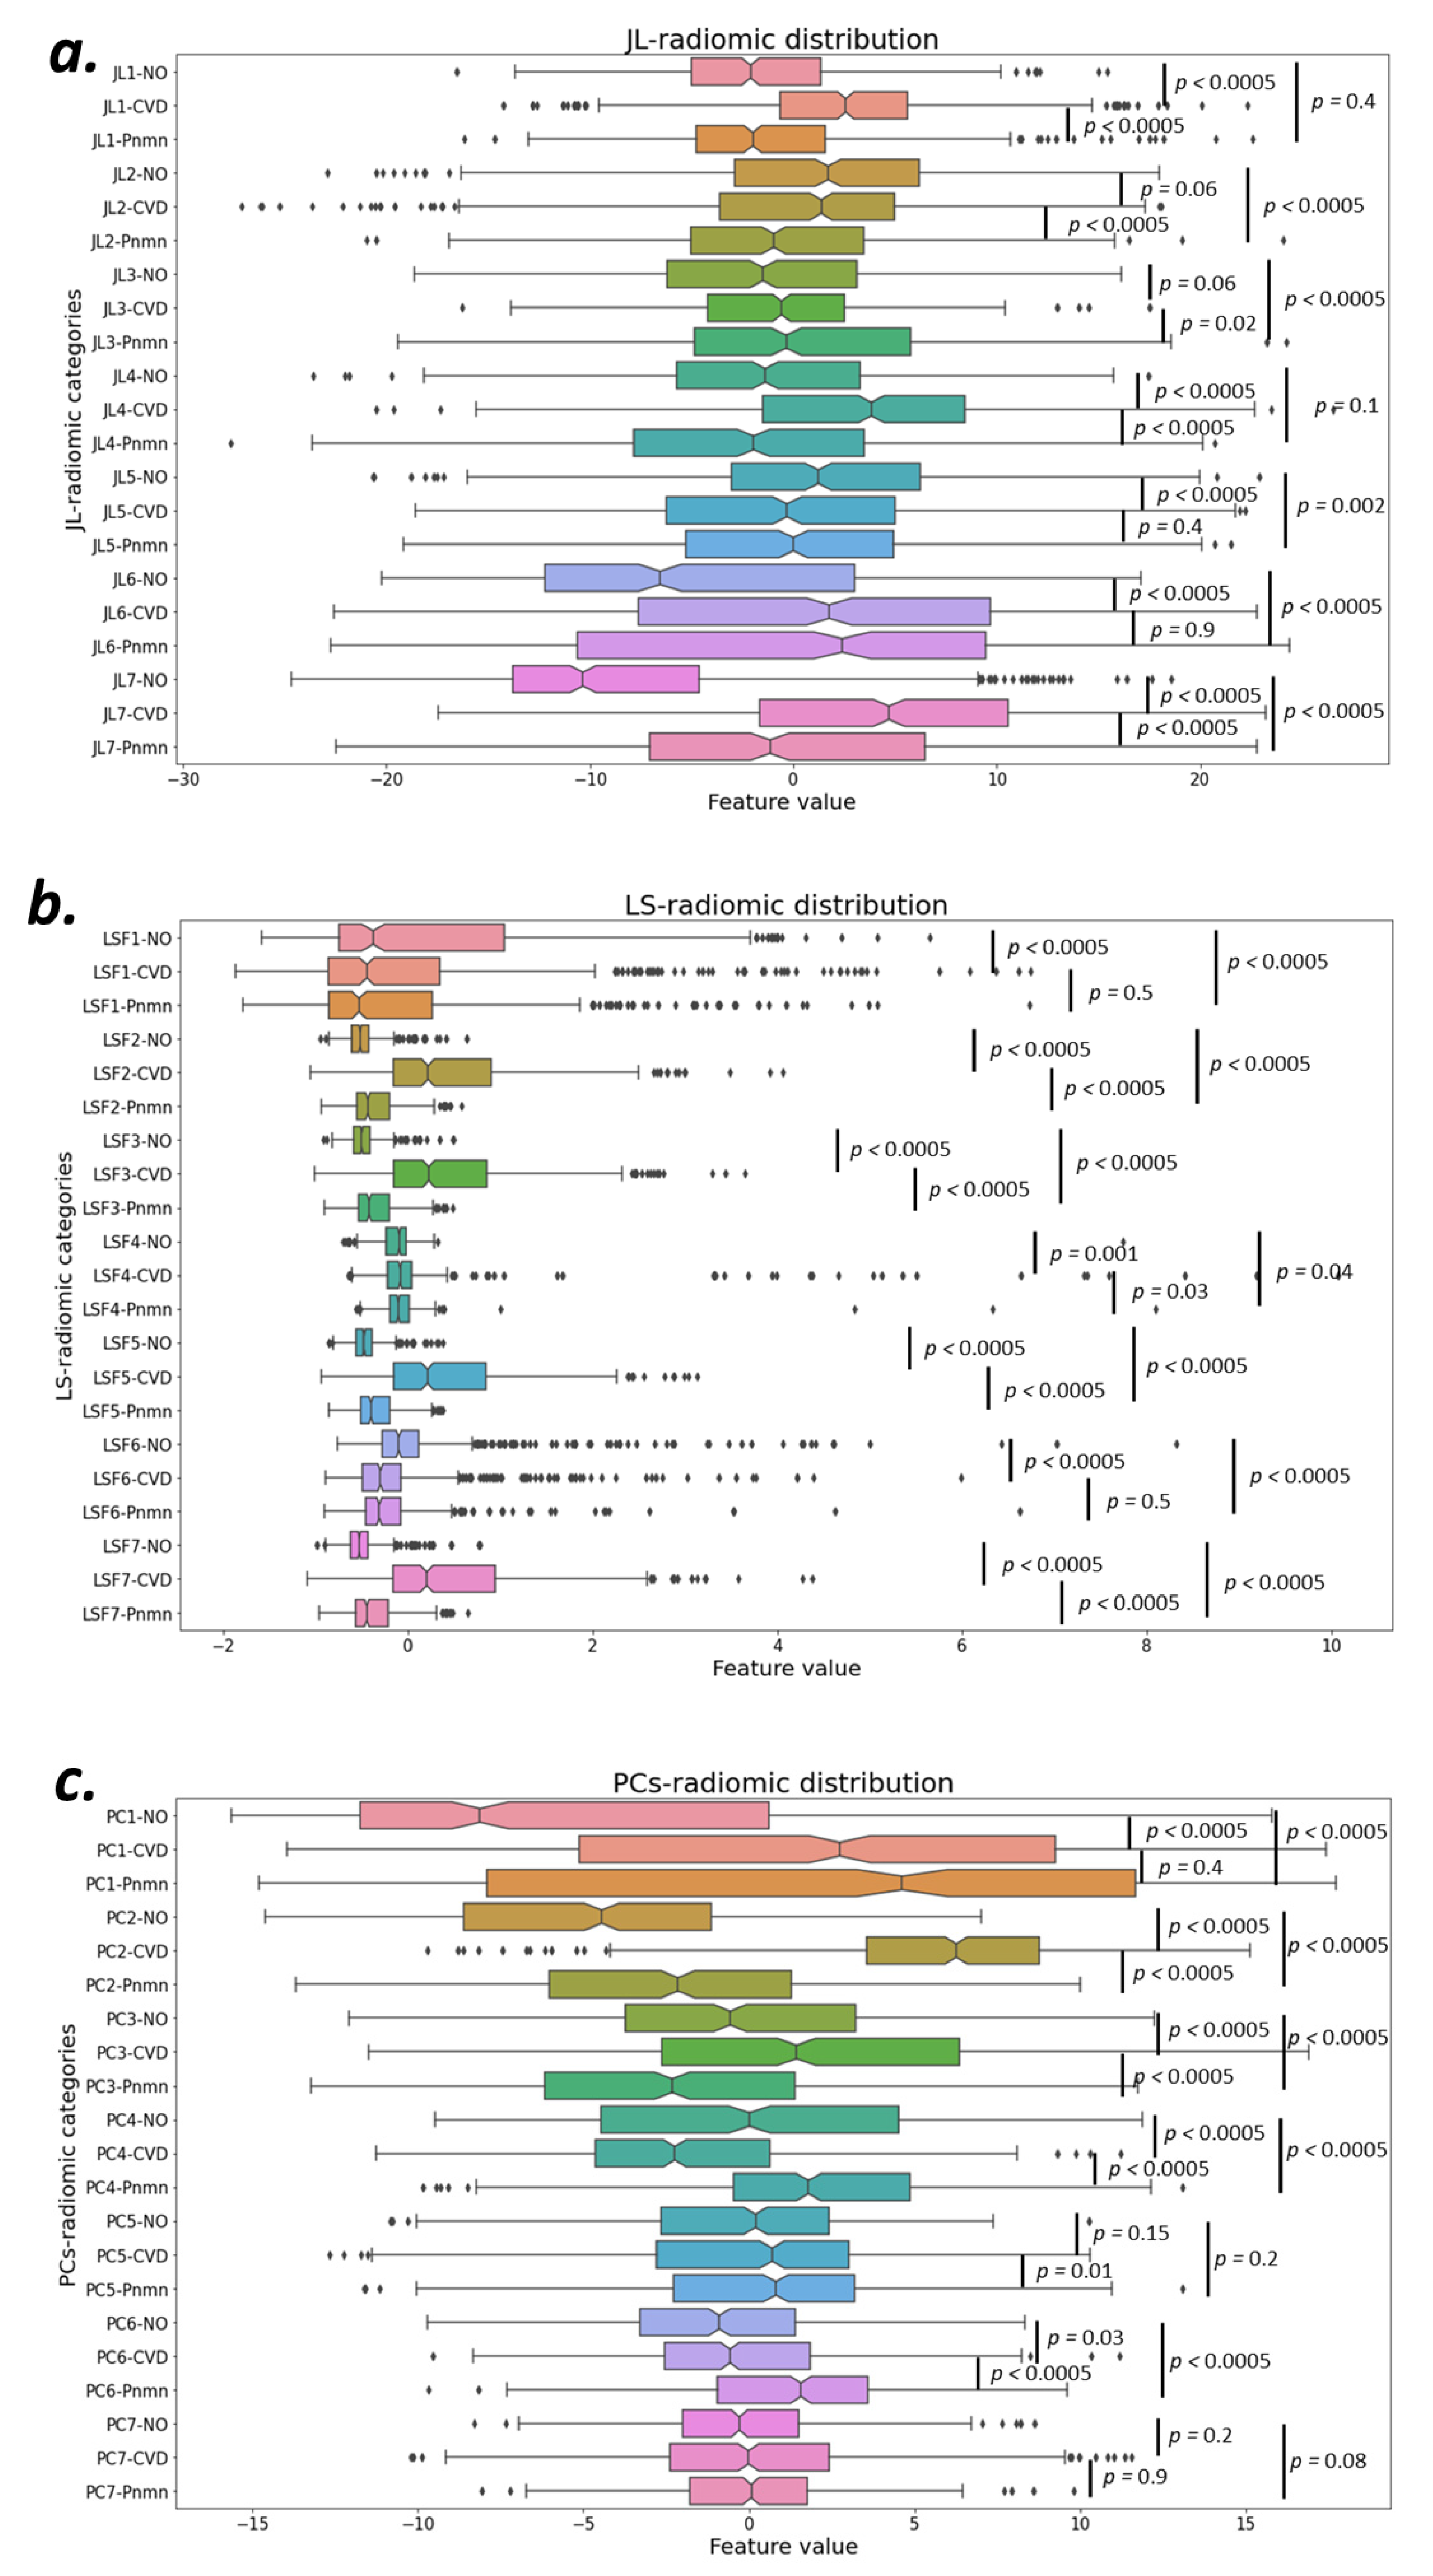
3.1.6. Conventional and Deep Latent Space Radiomics

We extracted 354 conventional radiomics [64] using the original CXR images, and the U-Net obtained their corresponding masks for the validation sets. These datasets were used to extract radiomics for their 2D targeted ROI (i.e., solely the lung lobes area) using the trained model. Out of all conventional radiomics, seven descriptors were selected using three different JL, LS, and PCA approaches. These seven descriptors were chosen based on the elbow method of choosing the best number of grouping features (Figure A1 in Appendix A).
Our proposed ConvAE model comprised 5 convolutional blocks and had 636,929 trainable parameters, with a preferred signal channel input image dimension of 512 × 512. The input image then passed through 16 filters with 3 × 3 kernels. The rescaling dimensions of the input image are from 512, 256, 128, 64, 32, and 16, while the fourth dimension grew from 1, 16, 32, 64, and 128. In the middle of the model, the hierarchy of dense layers compressed the dimensionality from 16,384 to 16, which generated 16 deep latent space features. The proposed ConvAE model has a 3 × 3   kernel filter, 2 × 2 kernel stride, same padding, with no residual connection with batch normalization and dese layer between contraction and expansion paths (see Figure 2). Out of 16, 2 features (FC-8 and FC-16) were discarded due to zero, and 14 other features were used for classification.
Figure 4 presents the separation power of each selected conventional radiomics to categorize COVID-19 (CVD), pneumonia (Pnmn), and no finding (NO) cases concerning the GT using the Kruskal–Wallis test to show the statistical significance. Similarly, Figure 5 shows the classification of 14 deep-radiomics obtained from the ConvAE model. The separation among different groups was more statistically significant for PCA (Figure 4a) and LS (Figure 4b). However, JL and deep radiomics also showed reasonable separation between different cases. For instance, FC2 responds only for COVID-19 cases and no response for pneumonia and healthy cases.

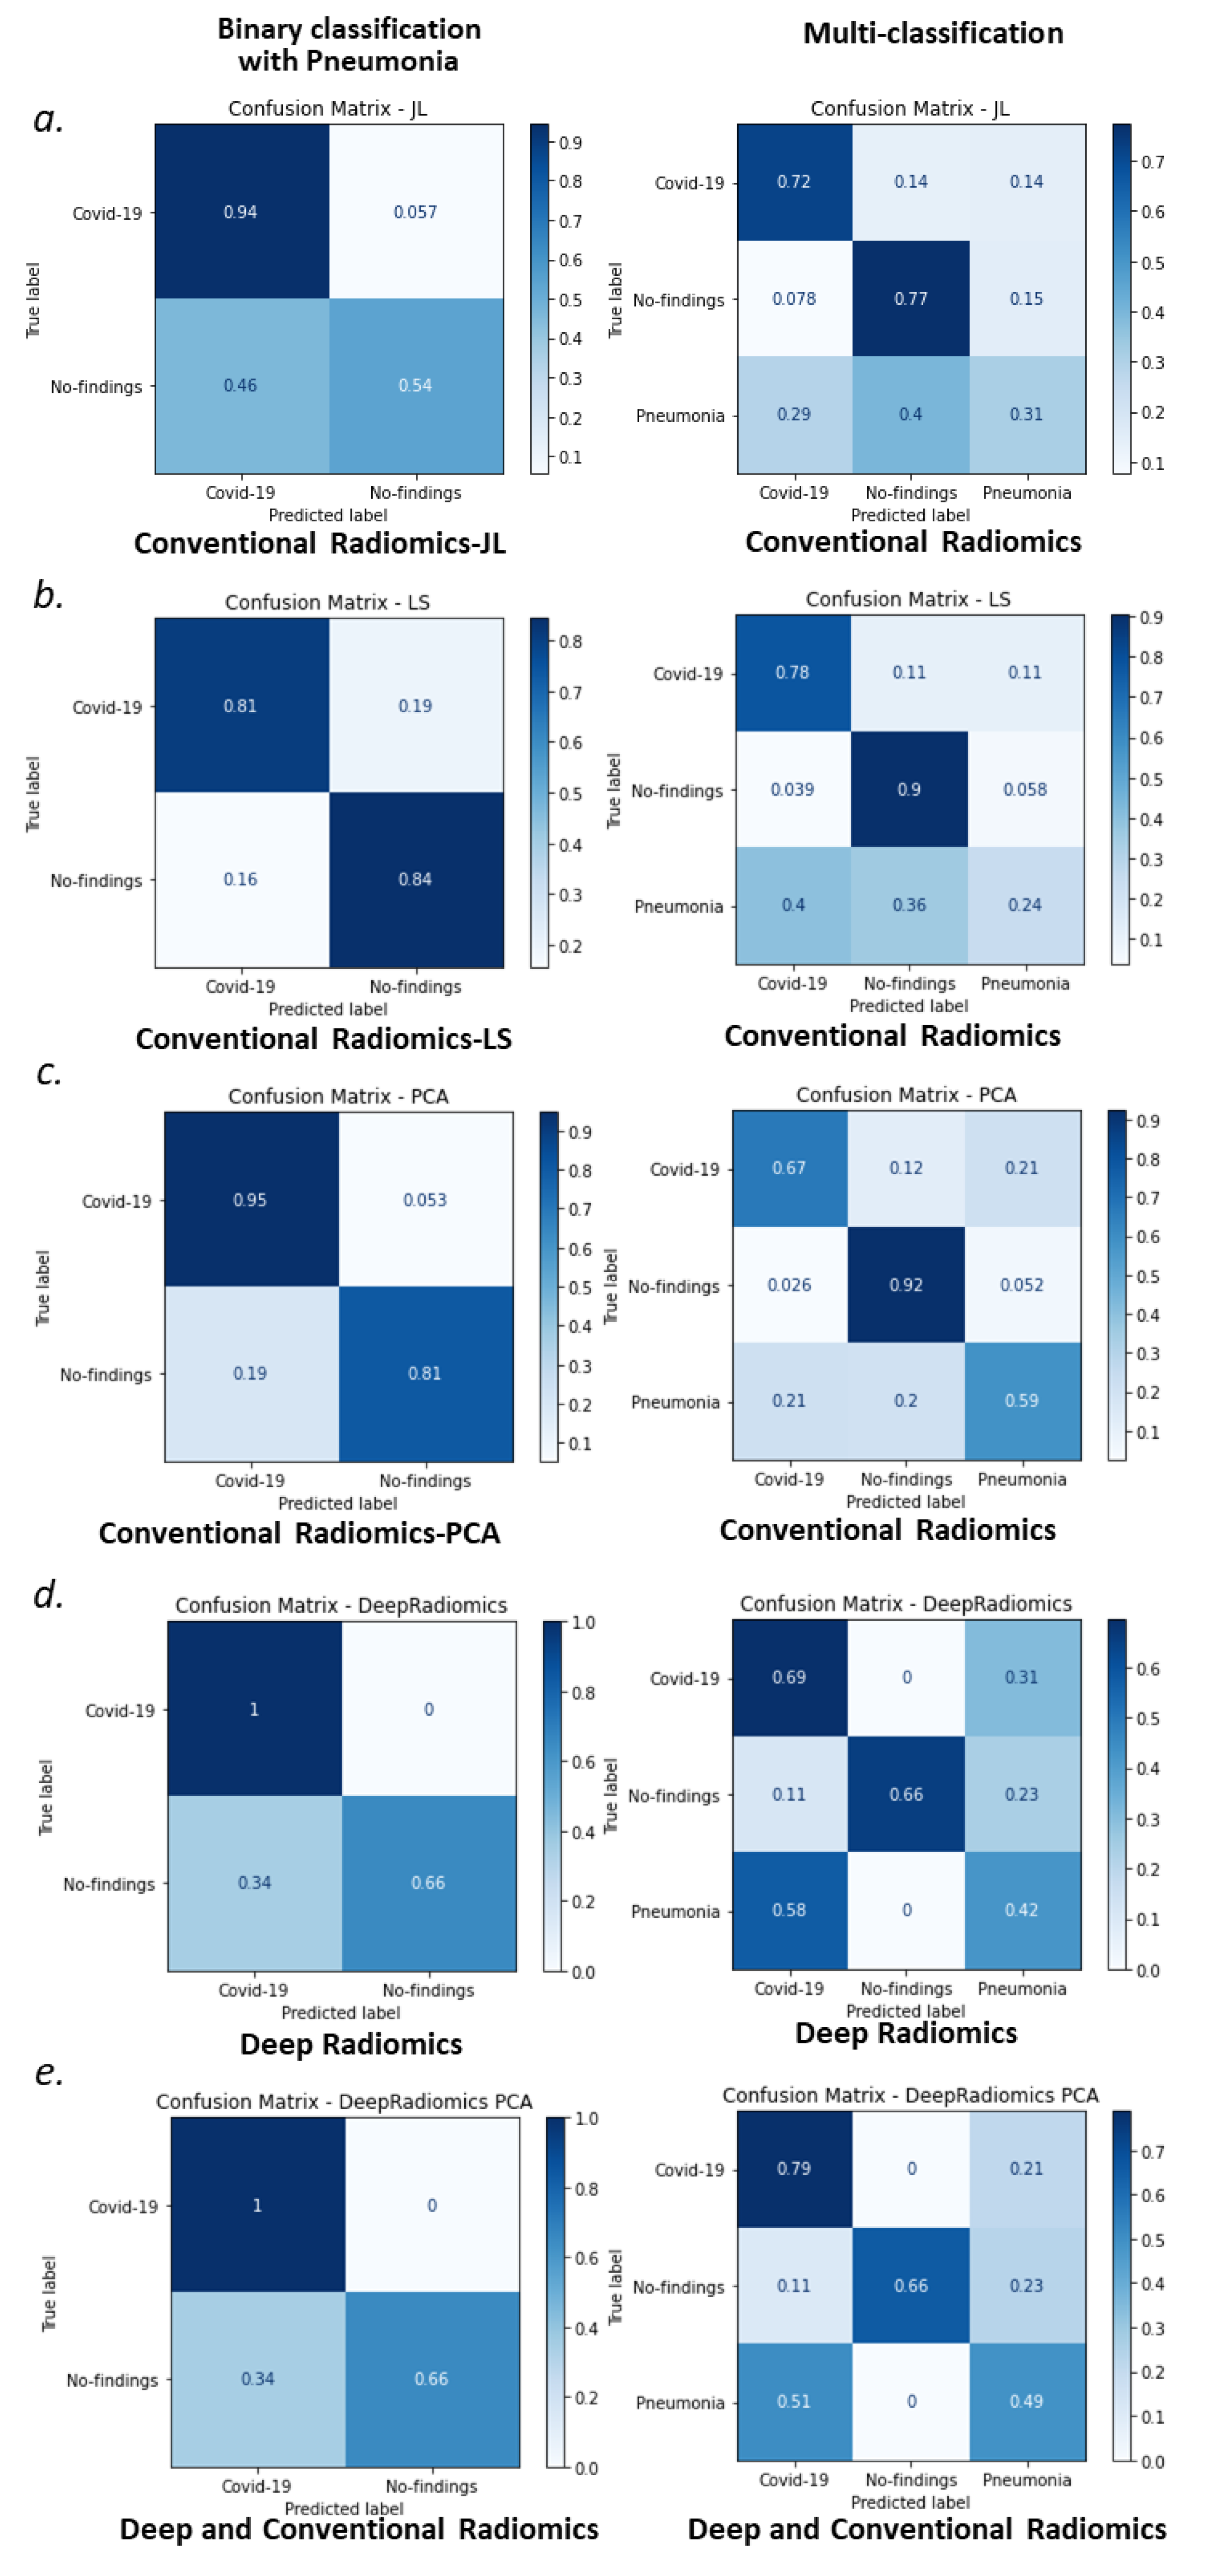
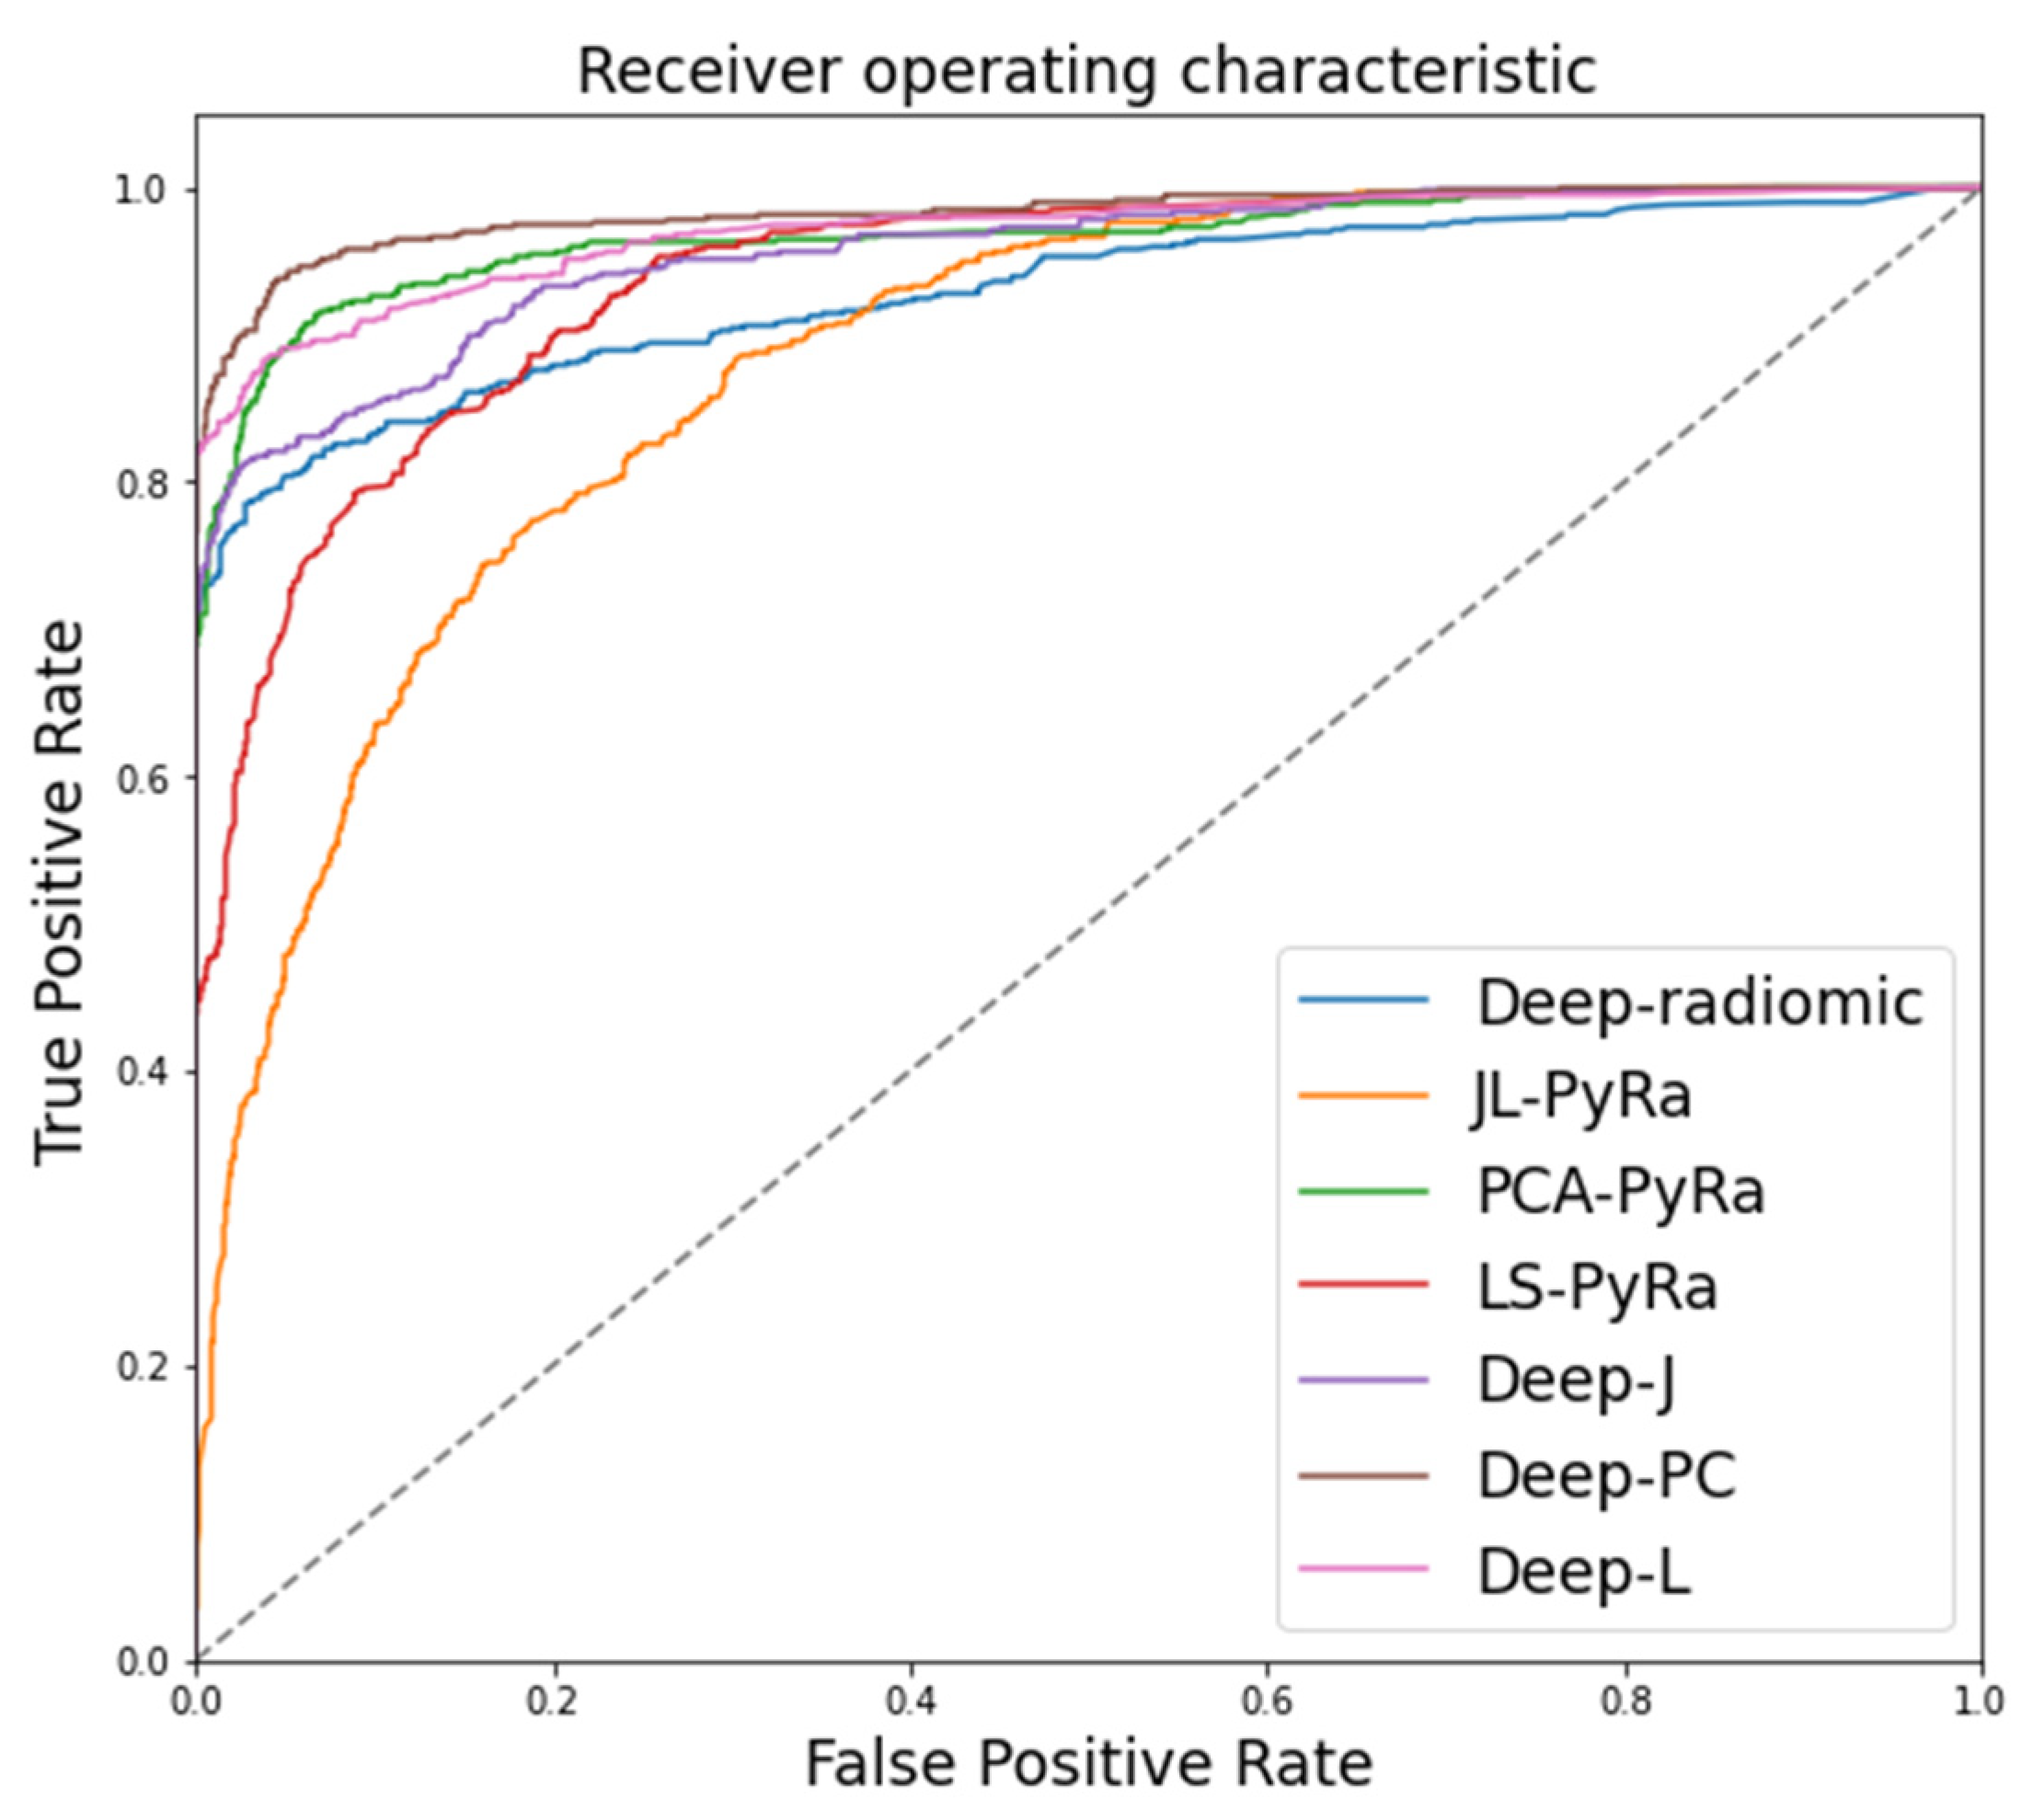
3.2. Random Forest Classification of COVID-19

To calculate the quantitative accuracy, we employed clinical diagnosis as the GT for our calculation. The GTs were labeled as 1 for COVID-19, 2 for pneumonia, and 0 for healthy cases. In binary-class classification, we labeled COVID-19 as 1 and the other two groups as 0.
We created three categories of patients based on imaging biomarkers to perform classification using a random forest classifier. Three imaging biomarkers included conventional radiomics, deep radiomics, and a combination of both groups. We classified 1597 cases based on 14 ConAE deep latent space radiomic descriptors, 7 conventional radiomics, and finally, a combination of both while comparing them with the gold standard data (GT) from clinical assessment. To investigate which type of imaging biomarkers is more appropriate for classifying COVID-19 patients, we performed both binary and multi-class classification and trained our multivariate random forest classifier with leave-one-out cross-validation in which we randomly split the data into training and testing sets. Table 2 and Figure 6 show the cross-validated accuracy of each method and their receiver operating characteristic (ROC) curves.
The best multivariate binary-class classification model for COVID-19 versus non-COVID-19 (i.e., pneumonia and no-finding) cases was PCA, which resulted in an accuracy of 89.6% (88.4–90.7%), and deep-LS and deep-PCA for the combination of both radiomic types (conventional radiomics and deep radiomics) resulted in 88.9% (88.7–93.2%, and 88.8% (88.7–89.0%), respectively.
JL radiomics showed the lowest binary-class classification accuracy 79.3% (77.2–80.3%) to detect COVID-19 versus other cases. This might be due to spanning features onto a lower-dimensional space that preserves the Euclidean distance between features but not selecting the most effective radiomics, increasing the accuracy of classification. This trend is also observed in multiclass classification and JL 63.9% (62.5–65.2%), which showed the lowest classification accuracy after deep radiomics, 63.5% (61.3–65.1%). PCA alone showed the highest accuracy for both binary 89.6 (88.4–90.7) and multiclass 72.6 (69.4–74.4) classification. Once combined with deep radiomics, PCA resulted in 88.8 (88.7–89.0) and 72.5 (71.2–73.4) for binary and multiclass classifications, respectively. Deep-LS showed the lowest accuracy, 66.8% (65.9–73.4%), in multiclass COVID-19 classification when both types of features are combined. We also calculated the statistical difference of the maximal accuracy (PCA) with other approaches using a two-tailed t-test (see Table 2). Deep-LS showed considerable similarity to PCA covariates (t-statistic = 1.05, p-value = 0.29), and there was a marginal statistical significance for deep-PCA (t-statistic = 2.3, p-value = 0.02). The rest of the methods showed significant statistical differences. Figure 6 shows the confusion matrices for binary- and multiclass classification of COVID-19. For binary-class classification, we stratified patients into COVID-19 cases versus “other” cases (i.e., no finding and pneumonia). Among the five groups, conventional radiomic PCA (Figure 7c—left column), deep radiomics (Figure 7d—left column), and their combination (Figure 7e—left column) showed the highest accuracy of COVID-19 detection. In multiclass classification, LS radiomics (Figure 7b—right column) and deep-radiomics-PCA (Figure 7e—right column) showed the highest accuracy of detecting COVID-19. PCA-radiomics (Figure 7c—right column) showed the highest accuracy of finding healthy and Pneumonia cases.
The application of deep ConvAE created deep radiomics and provided a low-dimensional representation of ROI. It also demonstrated a substantial increase in model performance for classifying COVID-19 patients from healthy or pneumonia patients (Figure 6, and Table 2). Deep radiomics is known for its tendency of having high dimensionality, thereby intensifying the possibility of overfitting a decision-making unit (i.e., the random forest model in this study) and the curse of dimensionality problem. The proposed ConvAE provided low-dimensional deep radiomics by spanning the imaging features to a lower-dimensional space [54]. We applied dimensionality reduction for the conventional radiomics by following the traditional way to shrink features while preserving the image characteristics. Despite having a different structure and mechanism, our proposed model is comparable in terms of the accuracy of COVID-19 detection. It shows a slight difference from previously reported models such as CoroNet [32] (89.6% accuracy), COVID-Net (93.3% accuracy), ResNet-50 (90.6% accuracy), and VGG-19 (83.0% accuracy) [83].

4. Discussion

This study proposed an automated system to diagnose COVID-19 using standard and deep radiomics in chest X-ray imaging. Specifically, this study demonstrated a deep-learning-based dimensionality reduction model, which integrates with selected conventional radiomics for diagnostic purposes. We showed the possibility of independently validating two deep-learning models to segment the lung lobe areas and identify potential COVID-19 patients enabling fast, noninvasive, and more cost-effective CXR-imaging-based diagnosis of COVID-19. The training of our models was absolutely independent of our training cohorts of patients. These datasets are selected randomly and based on having a higher number of COVID-19 patients. Overall, the study impartially validated with approximately the same size patients’ cohorts (597: COVID-19 and 500: Pneumonia patients, and 500 healthy cases), which increased the possibility of fair and unbiased assessment.
One limitation of the presented approach is the lack of clinical information in our data. Even with the substantial number of cases used for model development, there is a need for the models to incorporate clinical input to develop a more reliable diagnostic system. Additionally, there is a need for more data from various sources to further validate the present work and assess the model’s generalizability, or association to some demographics and clinical factors such as race (similar to [92]). Although our data are relatively large, there are only three label categories: COVID-19, pneumonia, and healthy. Having a more significant cohort of patients with more categories will enhance the statistical power of our analysis by improving the benchmarking system. Furthermore, there are more configurations for extracting deep radiomics. These configurations may allow us to find a better compression scheme that captures deep-imaging biomarkers with superior discriminative capability, efficiently representing the disease characteristics in CXR imaging. For conventional radiomics, the current random projection of high-dimensional manifold to low-dimensional representative radiomic signatures can be made through a more established, selective, and systematic approach. There is also an option to make diagnostic decisions directly using the trained deep learning model instead of using it for deep radiomic extraction. However, this would involve different configurations for training the model.
The techniques presented in the current study offer several advantages. First, applying ConvAE to extract deep radiomics provides an effective way of projecting CXR imaging biomarkers to lower-dimensional radiomic signatures, which avoids pretrained models with higher dimensional features and overfitting the decision-making unit. Second, the ConvAE eliminates the human-engineering feature selection to decrease the dimensionality of deep radiomics. Third, the proposed method successfully showed good performance on the independent validation sets for lung lobe segmentation and generation of deep radiomics.

5. Conclusions

This study proposed an automatic diagnosis of COVID-19 in CXR imaging using deep and conventional radiomics features. A 2D U-Net model was trained to segment the lung lobes, and from these regions of interest, radiomic features were extracted. We performed dimensionality reduction using a convolutional deep autoencoder (ConvAE) to extract low-dimensional deep radiomics (14 features) and Pyradiomics library to extract conventional imaging biomarkers. Johnson–Lindenstrauss (JL) lemma, Laplacian scoring, and principal component analysis (PCA) were used to reduce the dimensionality of features from 354 to 7 radiomics for conventional radiomics. We trained the entire system using 704 CXR images then independently tested our system on 1597 patients with COVID-19, pneumonia, or no finding. We compared the performance of each type of radiomic feature to detect COVID-19 cases through multivariate binary-class and multiclass classification. We trained and tested a random forest model for detecting COVID-19 cases through multivariate binary-class and multiclass classification. The maximal (full multivariate) model using a combination of the two radiomic groups showed excellent performance in classifying cases with a cross-validated accuracy of 72.5 (71.2–73.4) for multi-class and 88.8 (88.7–89.0) for binary-class classification. For future work, other deep-learning-based configurations can be explored to increase the system’s overall accuracy.

Author Contributions

Conceptualization, methodology, software, validation, formal analysis, investigation, resources, B.Y., S.K. and H.A.; study data, B.Y.; writing—original draft preparation, B.Y.; writing—review and editing, B.Y., S.K., A.A., H.A., M.A., S.M.A., X.P.V.M. and S.A.; visualization, B.Y.; supervision, X.P.V.M., S.A. and M.A. All authors have read and agreed to the published version of the manuscript.

Funding

This research received no external funding.

Institutional Review Board Statement

The study was conducted according to the guidelines of the Declaration of Helsinki and used a publicly available dataset [69,70,71,72,73,74,75,76,77,78,79,80,81,82,83,84,85,86,87,88,89].

Informed Consent Statement

Not applicable.

Data Availability Statement

In this study, we used publicly available datasets [69,70,71,72,73,74,75,76,77,78,79,80,81,82,83,84,85,86,87,88,89].

Acknowledgments

This is collaborative research work with no funding. We do not claim any diagnostic capability of a model as there must be a clinical study conducted to validate such a model clinically. We acknowledge and thank many different researchers and scientists who provided the chest X-ray imaging datasets.

Conflicts of Interest

The authors declare no conflict of interest.

Appendix A

The Elbow approach has been established to determine the optimum number of features to alleviate collinearity. As shown in the graph (Figure A1), the point for selecting is less than 10% variance of the graph. This indicates somewhere around k = 7. We used this analogy for our feature selection approaches in this study and picked 7 radiomics out of 354 conventional radiomics.
Figure A1. The elbow method to find the optimum cluster number points out k = 7 as the best number of features selected to represent collinearity.
Jcm 10 03100 g0a1

References

  1. World Health Organization (WHO). Coronavirus Disease 2019 (COVID-19) Situation Report—80; WHO: Geneva, Switzerland, 2020; Available online: https://www.who.int/docs/default-source/coronaviruse/weekly-updates/wou-16oct-cleared.pdf?sfvrsn=c8f87df8_0&download=true (accessed on 16 October 2020).
  2. World Health Organization (WHO). Statement on the Second Meeting of the International Health Regulations (2005) Emergency Committee Regarding the Outbreak of Novel Coronavirus (2019-nCoV); WHO: Geneva, Switzerland, 2020. [Google Scholar]
  3. World Health Organization (WHO). WHO Director-General’s Opening Remarks at the Media Briefing on COVID-19; WHO: Geneva, Switzerland, 2020. [Google Scholar]
  4. Kanne, J.P. Chest CT findings in 2019 novel coronavirus (2019-nCoV) infections from Wuhan, China: Key points for the radiologist. Radiology 2020, 295, 16–17. [Google Scholar] [CrossRef] [PubMed] [Green Version]
  5. Bernheim, A.; Mei, X.; Huang, M.; Yang, Y.; Fayad, Z.A.; Zhang, N.; Diao, K.; Lin, B.; Zhu, X.; Li, K.; et al. Chest CT findings in coronavirus disease-19 (COVID-19): Relationship to duration of infection. Radiology 2020, 295, 200463. [Google Scholar] [CrossRef] [Green Version]
  6. Xie, X.; Zhong, Z.; Zhao, W.; Zheng, C.; Wang, F.; Liu, J.J.R. Chest CT for typical 2019-nCoV pneumonia: Relationship to negative RT-PCR testing. Radiology 2020, 296, E41–E45. [Google Scholar] [CrossRef] [Green Version]
  7. Narin, A.; Kaya, C.; Pamuk, Z. Automatic detection of coronavirus disease (COVID-19) using X-ray images and deep convolutional neural networks. arXiv 2020, arXiv:2003.10849. [Google Scholar]
  8. Apostolopoulos, I.D.; Bessiana, T. COVID-19: Automatic detection from X-Ray images utilizing transfer learning with convolutional neural networks. arXiv 2020, arXiv:2003.11617. [Google Scholar] [CrossRef] [PubMed] [Green Version]
  9. Gunraj, H.; Wang, L.; Wong, A. COVIDNet-CT: A tailored deep convolutional neural network design for detection of COVID-19 cases from chest CT images. arXiv 2020, arXiv:2009.05383. [Google Scholar]
  10. Ai, T.; Yang, Z.; Hou, H.; Zhan, C.; Chen, C.; Lv, W.; Tao, Q.; Sun, Z.; Xia, L. Correlation of chest CT and RT-PCR testing for Coronavirus Disease 2019 (COVID-19) in China: A report of 1014 cases. Radiology 2020, 296, E32–E40. [Google Scholar] [CrossRef] [PubMed] [Green Version]
  11. Fang, Y.; Zhang, H.; Xie, J.; Lin, M.; Ying, L.; Pang, P.; Ji, W. Sensitivity of chest CT for COVID-19: Comparison to RT-PCR. Radiology 2020, 296, E115–E117. [Google Scholar] [CrossRef]
  12. Salehi, S.; Abedi, A.; Balakrishnan, S.; Gholamrezanezhad, A. Coronavirus Disease 2019 (COVID-19): A systematic review of imaging findings in 919 patients. Am. J. Roentgenol. 2020, 215, 87–93. [Google Scholar] [CrossRef]
  13. Shi, F.; Wang, J.; Shi, J.; Wu, Z.; Wang, Q.; Tang, Z.; He, K.; Shi, Y.; Shen, D. Review of artificial intelligence techniques in imaging data acquisition, segmentation, and diagnosis for COVID-19. IEEE Rev. Biomed. Eng. 2021, 14, 4–15. [Google Scholar] [CrossRef] [Green Version]
  14. Bullock, J.; Luccioni, A.; Pham, K.H.; Lam, C.S.N.; Luengo-Oroz, M. Mapping the landscape of artificial intelligence applications against COVID-19. arXiv 2020, arXiv:2003.11336. [Google Scholar]
  15. Zheng, C.; Deng, X.; Fu, Q.; Zhou, Q.; Feng, J.; Ma, H.; Liu, W.; Wang, X. Deep learning-based detection for COVID-19 from chest CT using weak label. MedRxiv 2020. [Google Scholar] [CrossRef] [Green Version]
  16. Cao, Y.; Xu, Z.; Feng, J.; Jin, C.; Han, X.; Wu, H.; Shi, H. Longitudinal assessment of COVID-19 using a deep learning-based quantitative CT pipeline: Illustration of two cases. Radiol. Cardiothorac. Imaging 2020, 2, e200082. [Google Scholar] [CrossRef] [PubMed] [Green Version]
  17. Huang, L.; Han, R.; Ai, T.; Yu, P.; Kang, H.; Tao, Q.; Xia, L. Serial quantitative chest CT assessment of COVID-19: A deep learning approach. Radiol. Cardiothorac. Imaging 2020, 2, e200075. [Google Scholar] [CrossRef] [Green Version]
  18. Qi, X.; Jiang, Z.; Yu, Q.; Shao, C.; Zhang, H.; Yue, H.; Ma, B.; Wang, Y.; Liu, C.; Meng, X.; et al. Machine learning-based CT radiomics model for predicting hospital stay in patients with pneumonia associated with SARS-CoV-2 infection: A multicenter study. MedRxiv 2020. [Google Scholar] [CrossRef]
  19. Gozes, O.; Frid-Adar, M.; Greenspan, H.; Browning, P.D.; Zhang, H.; Ji, W.; Bernheim, A.; Siegel, E. Rapid AI development cycle for the coronavirus (COVID-19) pandemic: Initial results for automated detection and patient monitoring using deep learning CT image analysis. arXiv 2020, arXiv:2003.05037, 2020. [Google Scholar]
  20. Li, L.; Qin, L.; Xu, Z.; Yin, Y.; Wang, X.; Kong, B.; Bai, J.; Lu, Y.; Fang, Z.; Song, Q.; et al. Using artificial intelligence to detect COVID-19 and community-acquired pneumonia based on pulmonary CT: Evaluation of the diagnostic accuracy. Radiology 2020, 296, E65–E71. [Google Scholar] [CrossRef] [PubMed]
  21. Chen, J.; Wu, L.; Zhang, J.; Zhang, L.; Gong, D.; Zhao, Y.; Chen, Q.; Huang, S.; Yang, M.; Yang, X.; et al. Deep learning-based model for detecting 2019 novel coronavirus pneumonia on high-resolution computed tomography: A prospective study. MedRxiv 2020. [Google Scholar] [CrossRef] [Green Version]
  22. Wang, B.; Jin, S.; Yan, Q.; Xu, H.; Luo, C.; Wei, L.; Zhao, W.; Hou, X.; Ma, W.; Xu, Z.; et al. AI-assisted CT imaging analysis for COVID-19 screening: Building and deploying a medical AI system. MedRxiv 2020. [Google Scholar] [CrossRef]
  23. Shan, F.; Gao, Y.; Wang, J.; Shi, W.; Shi, N.; Han, M.; Xue, Z.; Shen, D.; Shi, Y. Lung infection quantification of COVID-19 in CT images with deep learning. arXiv 2020, arXiv:2003.04655. [Google Scholar]
  24. Ghoshal, B.; Tucker, A. Estimating uncertainty and interpretability in deep learning for coronavirus (COVID-19) detection. arXiv 2020, arXiv:2003.10769. [Google Scholar]
  25. Zhang, J.; Xie, Y.; Li, Y.; Shen, C.; Xia, Y. COVID-19 screening on Chest X-ray images using deep learning based anomaly detection. arXiv 2020, arXiv:2003.12338. [Google Scholar]
  26. Wong, H.Y.F.; Lam, H.Y.S.; Fong, A.H.-T.; Leung, S.T.; Chin, T.W.-Y.; Lo, C.S.Y.; Lui, M.M.-S.; Lee, J.C.Y.; Chiu, K.W.-H.; Chung, T.W.-H.; et al. Frequency and distribution of chest radiographic findings in patients positive for COVID-19. Radiology 2020, 296, E72–E78. [Google Scholar] [CrossRef] [Green Version]
  27. Heidari, M.; Mirniaharikandehei, S.; Khuzani, A.Z.; Danala, G.; Qiu, Y.; Zheng, B. Improving the performance of CNN to predict the likelihood of COVID-19 using chest X-ray images with preprocessing algorithms. Int. J. Med. Inform. 2020, 144, 104284. [Google Scholar] [CrossRef] [PubMed]
  28. Oh, Y.; Park, S.; Ye, J.C. Deep learning COVID-19 features on CXR using limited training data sets. IEEE Trans. Med Imaging 2020, 39, 2688–2700. [Google Scholar] [CrossRef] [PubMed]
  29. Yoo, S.H.; Geng, H.; Chiu, T.L.; Yu, S.K.; Cho, D.C.; Heo, J.; Choi, M.S.; Choi, I.H.; Van, C.C.; Nhung, N.V.; et al. Deep learning-based decision-tree classifier for COVID-19 diagnosis from chest X-ray imaging. Front. Med. 2020, 7, 427. [Google Scholar] [CrossRef] [PubMed]
  30. Basu, S.; Mitra, S.; Saha, N. Deep learning for screening COVID-19 using chest X-Ray images. In Proceedings of the 2020 IEEE Symposium Series on Computational Intelligence (SSCI), Canberra, ACT, Australia, 1–4 December 2020; pp. 2521–2527. [Google Scholar]
  31. Sethy, P.K.; Behera, S.K.; Ratha, P.K.; Biswas, P. Detection of coronavirus disease (COVID-19) based on deep features and support vector machine. Preprints 2020, 2020030300. [Google Scholar] [CrossRef]
  32. Khan, A.I.; Shah, J.L.; Bhat, M.M. CoroNet: A deep neural network for detection and diagnosis of COVID-19 from chest x-ray images. Comput. Methods Prog. Biomed. 2020, 196, 105581. [Google Scholar] [CrossRef]
  33. Wang, D.; Mo, J.; Zhou, G.; Xu, L.; Liu, Y. An efficient mixture of deep and machine learning models for COVID-19 diagnosis in chest X-ray images. PLoS ONE 2020, 15, e0242535. [Google Scholar] [CrossRef]
  34. Rahimzadeh, M.; Attar, A. A modified deep convolutional neural network for detecting COVID-19 and pneumonia from chest X-ray images based on the concatenation of Xception and ResNet50V2. Inform. Med. Unlocked 2020, 19, 100360. [Google Scholar] [CrossRef]
  35. Ozturk, T.; Talo, M.; Yildirim, E.A.; Baloglu, U.B.; Yildirim, O.; Acharya, U.R. Automated detection of COVID-19 cases using deep neural networks with X-ray images. Comput. Biol. Med. 2020, 121, 103792. [Google Scholar] [CrossRef]
  36. El-Din, H.E.; Shouman, M.A.; Karar, M.E. COVIDX-Net: A framework of deep learning classifiers to diagnose COVID-19 in X-ray images. arXiv 2020, arXiv:2003.11055. [Google Scholar]
  37. Chowdhury, N.K.; Rahman, M.; Kabir, M.A. PDCOVIDNet: A parallel-dilated convolutional neural network architecture for detecting COVID-19 from chest X-ray images. Health Inf. Sci. Syst. 2020, 8, 27. [Google Scholar] [CrossRef]
  38. Minaee, S.; Kafieh, R.; Sonka, M.; Yazdani, S.; Soufi, G.J. Deep-COVID: Predicting COVID-19 from chest X-ray images using deep transfer learning. Med. Image Anal. 2020, 65, 101794. [Google Scholar] [CrossRef] [PubMed]
  39. Ronneberger, O.; Fischer, P.; Brox, T. U-Net: Convolutional networks for biomedical image segmentation. In Proceedings of the 2015 International Conference on Medical Image Computing and Computer-Assisted Intervention, Munich, Germany, 5–9 October 2015; Springer: Cham, Switzerland, 2015; pp. 234–241. [Google Scholar]
  40. Sorensen, T. A method of establishing groups of equal amplitude in plant sociology based on similarity of species and its application to analyses of the vegetation on Danish commons. K. Dan. Vidensk. Selsk. Biol. Skr. 1948, 5, 1–34. [Google Scholar]
  41. Dice, L.R. Measures of the amount of ecologic association between species. Ecology 1945, 26, 297–302. [Google Scholar] [CrossRef]
  42. Milletari, F.; Navab, N.; Ahmadi, S.-A. V-Net: Fully convolutional neural networks for volumetric medical image segmentation. In Proceedings of the 2016 Fourth International Conference on 3D Vision (3DV), Stanford, CA, USA, 25–28 October 2016; pp. 565–571. [Google Scholar]
  43. Murphy, K.P. Machine Learning: A Probabilistic Perspective; MIT Press: Cambridge, MA, USA, 2012. [Google Scholar]
  44. LeCun, Y. LeNet-5, Convolutional Neural Networks. Available online: http://yann.lecun.com/exdb/lenet (accessed on 1 July 2020).
  45. Aghdam, H.H.; Heravi, E.J. Guide to Convolutional Neural Networks: A Practical Application to Traffic-Sign Detection and Classification; Springer: Cham, Switzerland, 2017. [Google Scholar]
  46. Convolutional Neural Networks (LeNet)—DeepLearning 0.1 Documentation; LISA Lab.: Online, 31 August 2013.
  47. Ciresan, D.C.; Meier, U.; Masci, J.; Maria Gambardella, L.; Schmidhuber, J. Flexible, high performance convolutional neural networks for image classification. In Proceedings of the International Joint Conference on Artificial Intelligence, Barcelona, Spain, 16–22 July 2011; Volume 22, p. 1237. [Google Scholar]
  48. Krizhevsky, A.; Sutskever, I.; Hinton, G.E. Imagenet classification with deep convolutional neural networks. In Advances in Neural Information Processing Systems; MIT Press: Cambridge, MA, USA, 2012; Volume 25, pp. 1097–1105. [Google Scholar]
  49. He, K.; Zhang, X.; Ren, S.; Sun, J. Deep residual learning for image recognition. arXiv 2015, arXiv:1512.03385. [Google Scholar]
  50. Simonyan, K.; Zisserman, A. Very deep convolutional networks for large-scale image recognition. arXiv 2014, arXiv:1409.1556. [Google Scholar]
  51. Szegedy, C.; Liu, W.; Jia, Y.; Sermanet, P.; Reed, S.; Anguelov, D.; Erhan, D.; Vanhoucke, V.; Rabinovich, A. Going deeper with convolutions. In Proceedings of the IEEE Conference on Computer Vision and Pattern Recognition (CVPR), Boston, MA, USA, 7–12 June 2015; pp. 1–9. [Google Scholar]
  52. Homayounieh, F.; Ebrahimian, S.; Babaei, R.; Mobin, H.K.; Zhang, E.; Bizzo, B.C.; Mohseni, I.; Digumarthy, S.R.; Kalra, M.K. CT radiomics, radiologists, and clinical information in predicting outcome of patients with COVID-19 pneumonia. Radiol. Cardiothorac. Imaging 2020, 2, e200322. [Google Scholar] [CrossRef]
  53. Fang, X.; Li, X.; Bian, Y.; Ji, X.; Lu, J. Radiomics nomogram for the prediction of 2019 novel coronavirus pneumonia caused by SARS-CoV-2. Eur. Radiol. 2020, 30, 6888–6901. [Google Scholar] [CrossRef]
  54. Yousefi, B.; Akbari, H.; Maldague, X. Detecting vasodilation as potential diagnostic biomarker in breast cancer using deep learning-driven thermomics. Biosensors 2020, 10, 164. [Google Scholar] [CrossRef]
  55. Cavallari, G.B.; Ribeiro, L.S.; Ponti, M. Unsupervised representation learning using convolutional and stacked auto-encoders: A domain and cross-domain feature space analysis. In Proceedings of the 2018 31st SIBGRAPI Conference on Graphics, Patterns and Images (SIBGRAPI), Paraná, Brazil, 29 October–1 November 2018; pp. 440–446. [Google Scholar]
  56. Ponti, M.A.; Ribeiro, L.S.F.; Nazare, T.S.; Bui, T.; Collomosse, J. Everything you wanted to know about deep learning for computer vision but were afraid to ask. In Proceedings of the 2017 30th SIBGRAPI Conference on Graphics, Patterns and Images Tutorials (SIBGRAPI-T), Niteroi, Brazil, 17–20 October 2017; pp. 17–41. [Google Scholar]
  57. Shin, H.-C.; Orton, M.R.; Collins, D.; Doran, S.J.; Leach, M. Stacked autoencoders for unsupervised feature learning and multiple organ detection in a pilot study using 4D patient data. IEEE Trans. Pattern Anal. Mach. Intell. 2013, 35, 1930–1943. [Google Scholar] [CrossRef] [PubMed]
  58. Gonzalez, F.J.; Balajewicz, M. Deep convolutional recurrent autoencoders for learning low-dimensional feature dynamics of fluid systems. arXiv 2018, arXiv:1808.01346. [Google Scholar]
  59. Kingma, D.P.; Ba, J. Adam: A method for stochastic optimization. arXiv 2014, arXiv:1412.6980. [Google Scholar]
  60. Zeiler, M.D. ADADELTA: An adaptive learning rate method. arXiv 2012, arXiv:1212:5701. [Google Scholar]
  61. Rumelhart, D.E.; Hinton, G.E.; Williams, R.J. Learning representations by back-propagating errors. Nature 1986, 323, 533–536. [Google Scholar] [CrossRef]
  62. Wilson, R.; Devaraj, A. Radiomics of pulmonary nodules and lung cancer. Transl. Lung Cancer Res. 2017, 6, 86–91. [Google Scholar] [CrossRef] [Green Version]
  63. Han, F.; Wang, H.; Zhang, G.; Han, H.; Song, B.; Li, L.; Moore, W.; Lu, H.; Zhao, H.; Liang, Z. Texture Feature Analysis for Computer-Aided Diagnosis on Pulmonary Nodules. J. Digit. Imaging 2015, 28, 99–115. [Google Scholar] [CrossRef]
  64. Van Griethuysen, J.J.M.; Fedorov, A.; Parmar, C.; Hosny, A.; Aucoin, N.; Narayan, V.; Beets-Tan, R.G.H.; Fillion-Robin, J.-C.; Pieper, S.; Aerts, H.J.W.L. Computational radiomics system to decode the radiographic phenotype. Cancer Res. 2017, 77, e104–e107. [Google Scholar] [CrossRef] [Green Version]
  65. Johnson, W.B.; Lindenstrauss, J.; Beals, R.; Beck, A.; Bellow, A.; Hajian, A. Extensions of Lipschitz mappings into a Hilbert space. Contemp. Math. 1984, 26, 189–206. [Google Scholar] [CrossRef]
  66. Dasgupta, S.; Gupta, A. An Elementary Proof of the Johnson-Lindenstrauss Lemma; International Computer Science Institute: Berkeley, CA, USA, 1999. [Google Scholar]
  67. He, X.; Cai, D.; Niyogi, P. Laplacian score for feature selection. In Advances in Neural Information Processing Systems; MIT Press: Cambridge, MA, USA, 2005; Volume 18, pp. 507–514. [Google Scholar]
  68. Malhi, A.; Gao, R. PCA-based feature selection scheme for machine defect classification. IEEE Trans. Instrum. Meas. 2004, 53, 1517–1525. [Google Scholar] [CrossRef]
  69. Jaeger, S.; Karargyris, A.; Candemir, S.; Folio, L.; Siegelman, J.; Callaghan, F.; Xue, Z.; Palaniappan, K.; Singh, R.K.; Antani, S.; et al. Automatic tuberculosis screening using chest radiographs. IEEE Trans. Med. Imaging 2014, 33, 233–245. [Google Scholar] [CrossRef]
  70. Candemir, S.; Jaeger, S.; Palaniappan, K.; Musco, J.P.; Singh, R.K.; Xue, Z.; Karargyris, A.; Antani, S.; Thoma, G.; McDonald, C.J. Lung segmentation in chest radiographs using anatomical atlases with nonrigid registration. IEEE Trans. Med. Imaging 2014, 33, 577–590. [Google Scholar] [CrossRef]
  71. Cohen, J.P.; Morrison, P.; Dao, L.; Roth, K.; Duong, T.Q.; Ghassemi, M. COVID-19 image data collection: Prospective predictions are the future. arXiv 2020, arXiv:2006.11988. [Google Scholar]
  72. Lung Bounding Boxes and Chest X-ray Segmentation. Available online: https://github.com/GeneralBlockchain/ (accessed on 30 June 2021).
  73. Pneumonia Severity Scores for 94 Images. Available online: https://github.com/ieee8023/covid-chestxray-dataset/blob/master/annotations/covid-severity-scores.csv (accessed on 30 May 2020).
  74. Cohen, J.P.; Dao, L.; Roth, K.; Morrison, P.; Bengio, Y.; Abbasi, A.F.; Shen, B.; Mahsa, H.K.; Ghassemi, M.; Li, H.; et al. Predicting COVID-19 pneumonia severity on chest X-ray with deep learning. arXiv 2020, arXiv:2005.11856. [Google Scholar] [CrossRef] [PubMed]
  75. Generated Lung Segmentations. Available online: https://github.com/ieee8023/covid-chestxray-dataset/blob/master/annotations/lungVAE-masks (accessed on 1 June 2020).
  76. Selvan, R.; Dam, E.B.; Rischel, S.; Sheng, K.; Nielsen, M.; Pai, A. Lung segmentation from chest X-rays using variational data imputation. arXiv 2020, arXiv:2005.10052. [Google Scholar]
  77. Brixia Score for 192 Images. Available online: https://github.com/BrixIA/Brixia-score-COVID-19 (accessed on 30 May 2020).
  78. Signoroni, A.; Savardi, M.; Benini, S.; Adami, N.; Leonardi, R.; Gibellini, P.; Vaccher, F.; Ravanelli, M.; Borghesi, A.; Farina, D. End-to-end learning for semiquantitative rating of COVID-19 severity on Chest X-rays. arXiv 2020, arXiv:2006.04603. [Google Scholar]
  79. Lung and Other Segmentations for 517 Images. Available online: https://github.com/v7labs/covid-19-xray-dataset/tree/master/annotations (accessed on 1 June 2020).
  80. Cohen, J.P.; Morrison, P.; Dao, L. COVID-19 image data collection. arXiv 2020, arXiv:2003.11597. [Google Scholar]
  81. Cohen, J.P. COVID-19 Image Data Collection. 2020. Available online: https://github.com/ieee8023/covid-chestxray-dataset (accessed on 22 March 2020).
  82. Wang, X.; Peng, Y.; Lu, L.; Lu, Z.; Bagheri, M.; Summers, R.M. Chest X-ray 8: Hospital scale chest X-ray database and benchmarks on weakly-supervised classification and localization of common thorax diseases. In Proceedings of the IEEE Conference on Computer Vision and Pattern Recognition, Honolulu, HI, USA, 21–26 July 2017; pp. 2097–2106. [Google Scholar]
  83. Wang, L.; Lin, Z.Q.; Wong, A. COVID-Net: A tailored deep convolutional neural network design for detection of COVID-19 cases from chest X-ray images. Sci. Rep. 2020, 10, 19549. [Google Scholar] [CrossRef]
  84. Wang, L.; Wong, A.; Lin, Z.Q.; Lee, J.; McInnis, P.; Chung, A.; Ross, M.; Van Berlo, B.; Ebadi, A. Figure 1 COVID-19 Chest X-ray Dataset Initiative. Available online: https://github.com/agchung/Figure1-COVID-chestxray-dataset/blob/master/README.md#figure-1-covid-19-chest-x-ray-dataset-initiative (accessed on 10 June 2021).
  85. COVID-19 Clinical Cases. Available online: https://www.figure1.com/covid-19-clinical-cases (accessed on 10 June 2021).
  86. COVID-19 DATABASE. Available online: https://www.sirm.org/category/senza-categoria/covid-19/ (accessed on 10 June 2021).
  87. Winther, H.B.; Laser, H.; Gerbel, S.; Maschke, S.K.; Hinrichs, J.B.; Vogel-Claussen, J.; Wacker, F.K.; Höper, M.M.; Meyer, B.C. COVID-19 Image Repository. 2020. Available online: https://data.uni-hannover.de/dataset/ca654807-033c-4650-a967-2d1641f49f0b (accessed on 11 June 2021).
  88. Poppler. Available online: https://poppler.freedesktop.org/dataset (accessed on 11 June 2021).
  89. Pandey, N. Lung Segmentation from Chest X-ray Dataset. Available online: https://www.kaggle.com/nikhilpandey360/lung-segmentation-from-chest-x-ray-dataset (accessed on 11 June 2021).
  90. Python 3, Google Compute Engine Backend, T4, and P100 GPU and 27.4 Gb RAM; Google 2020. Available online: https://colab.research.google.com/ (accessed on 11 June 2021).
  91. Abadi, M.; Barham, P.; Chen, Z.; Davis, A.; Dean, J.; Devin, M.; Ghemawat, S.; Irving, G.; Isard, M.; Zheng, X. Tensorflow: A system for large-scale machine learning. In Proceedings of the 12th {USENIX} Symposium on Operating Systems Design and Implementation, Savannah, GA, USA, 2–4 November 2016; pp. 265–283. [Google Scholar]
  92. Tartaglione, E.; Barbano, C.; Berzovini, C.; Calandri, M.; Grangetto, M. Unveiling COVID-19 from CHEST X-Ray with Deep Learning: A hurdles race with small data. Int. J. Environ. Res. Public Health 2020, 17, 6933. [Google Scholar] [CrossRef]
Figure 1. Schematic representing the proposed approach using ConvAE radiomics in low-dimensional space representation for diagnosis of COVID-19.
Jcm 10 03100 g001
Figure 2. The proposed convolutional deep autoencoder (ConvAE) for generating deep radiomics with low-dimensional deep radiomic descriptors.
Jcm 10 03100 g002
Figure 3. Some examples of CXR images for each dataset are presented: (ac) are our 704 cases of training set taken from the Shenzhen set; (dl) images are used to independently validate our system.
Jcm 10 03100 g003
Figure 4. Classification power of each selected radiomic group to categorize COVID-19 (CVD), pneumonia (Pnmn), and no finding (NO) cases with respect to ground truth are demonstrated using Kruskal–Wallis test to show the statistical significance of the classification of conventional radiomics using three dimensionality reduction methods JL (a), LS (b), and PCA (c).
Jcm 10 03100 g004
Figure 5. Similar to conventional radiomics, here classification power of 14 deep radiomic groups to categorize COVID-19 (CVD), pneumonia (Pnmn), and no finding (NO) cases with respect to ground truth are demonstrated using Kruskal–Wallis test to show the statistical significance of the classification.
Jcm 10 03100 g005
Figure 6. The receiver operating characteristic (ROC) curves for deep radiomics and compressed conventional radiomics using JL, LS, and PCA, and a combination of both deep and conventional radiomics are shown.
Jcm 10 03100 g006
Figure 7. Confusion matrices for binary-class (upper row) and multiclass (lower row) classification of COVID-19 are presented for conventional radiomics (ac); deep radiomics (d), and a combination of both groups of radiomics for the best conventional radiomics (e).
Jcm 10 03100 g007
Table 1. Training and validation scheme for the proposed approach.
Scheme of Model Training and Independent Validation
PurposeModelLearning StageNumber of Cases and Dataset
Segmentation of Lung LobesU-Net 1Training704 The Shenzhen set
Independent Validation417 COVID-19
1125 ChestX-ray8
55 Figure 1
COVID-19 IdentificationConvAE 2Training704 The Shenzhen set
Independent Validation417 COVID-19
1125 ChestX-ray8
55 Figure 1
1 This is a 2D U-Net model. 2 ConvAE was designed and trained on our training cohort of patients to generate CNN-based radiomics (i.e., deepomics).
Table 2. Results of diagnosis based on the classification of symptomatic versus asymptomatic patients with the leave-one-out cross-validation.
Accuracy of Multivariate Models
MethodsClassification Accuracy 1 (%)t-Test 2; t-Statistic, Two-Tailed p-Value
Binary ClassificationDeep-radiomics88.7 (88.7–88.9)8.6, <0.0005
JL-PyRad79.3 (77.2–80.3)>90, <0.0005
PCA-PyRad89.6 (88.4–90.7)-
LS-PyRad83.6 (82.9–84.3)55.4, <0.0005
Deep-JL88.7 (88.7–88.8)8.6, <0.0005
Deep-PCA88.8 (88.7–89.0)7.9, <0.0005
Deep-LS88.9 (88.7–93.2)1.05, 0.29
Multiclass ClassificationDeep-radiomics63.5 (61.3–65.1)>90, <0.0005
JL-PyRad63.9 (62.5–65.2)>90, <0.0005
PCA-PyRad72.6 (69.4–74.4)-
LS-PyRad65.7 (65.1–66.2)72.6, <0.0005
Deep-JL67.7 (64.9–71.4)42.1, <0.0005
Deep-PCA72.5 (71.2–73.4)2.3, 0.02
Deep-LS66.8 (65.9–73.4)32.3, <0.0005
1 Classification accuracy reported by median (±QR). 2 t-test calculated for each method versus maximal accuracy.
Publisher’s Note: MDPI stays neutral with regard to jurisdictional claims in published maps and institutional affiliations.

