
Association of Serum Bilirubin Level with Metabolic Syndrome and Non-Alcoholic Fatty Liver Disease: A Cross-Sectional Study of 1672 Obese Children

 ,
,  , , and
Abstract
1. Introduction
2. Materials and Methods
2.1. Study Design
2.2. Clinical Assessment
2.3. Laboratory Assessment
2.4. Liver Ultrasonography
2.5. Statistical Analysis
3. Results
3.1. Measurements of the Study Subjects
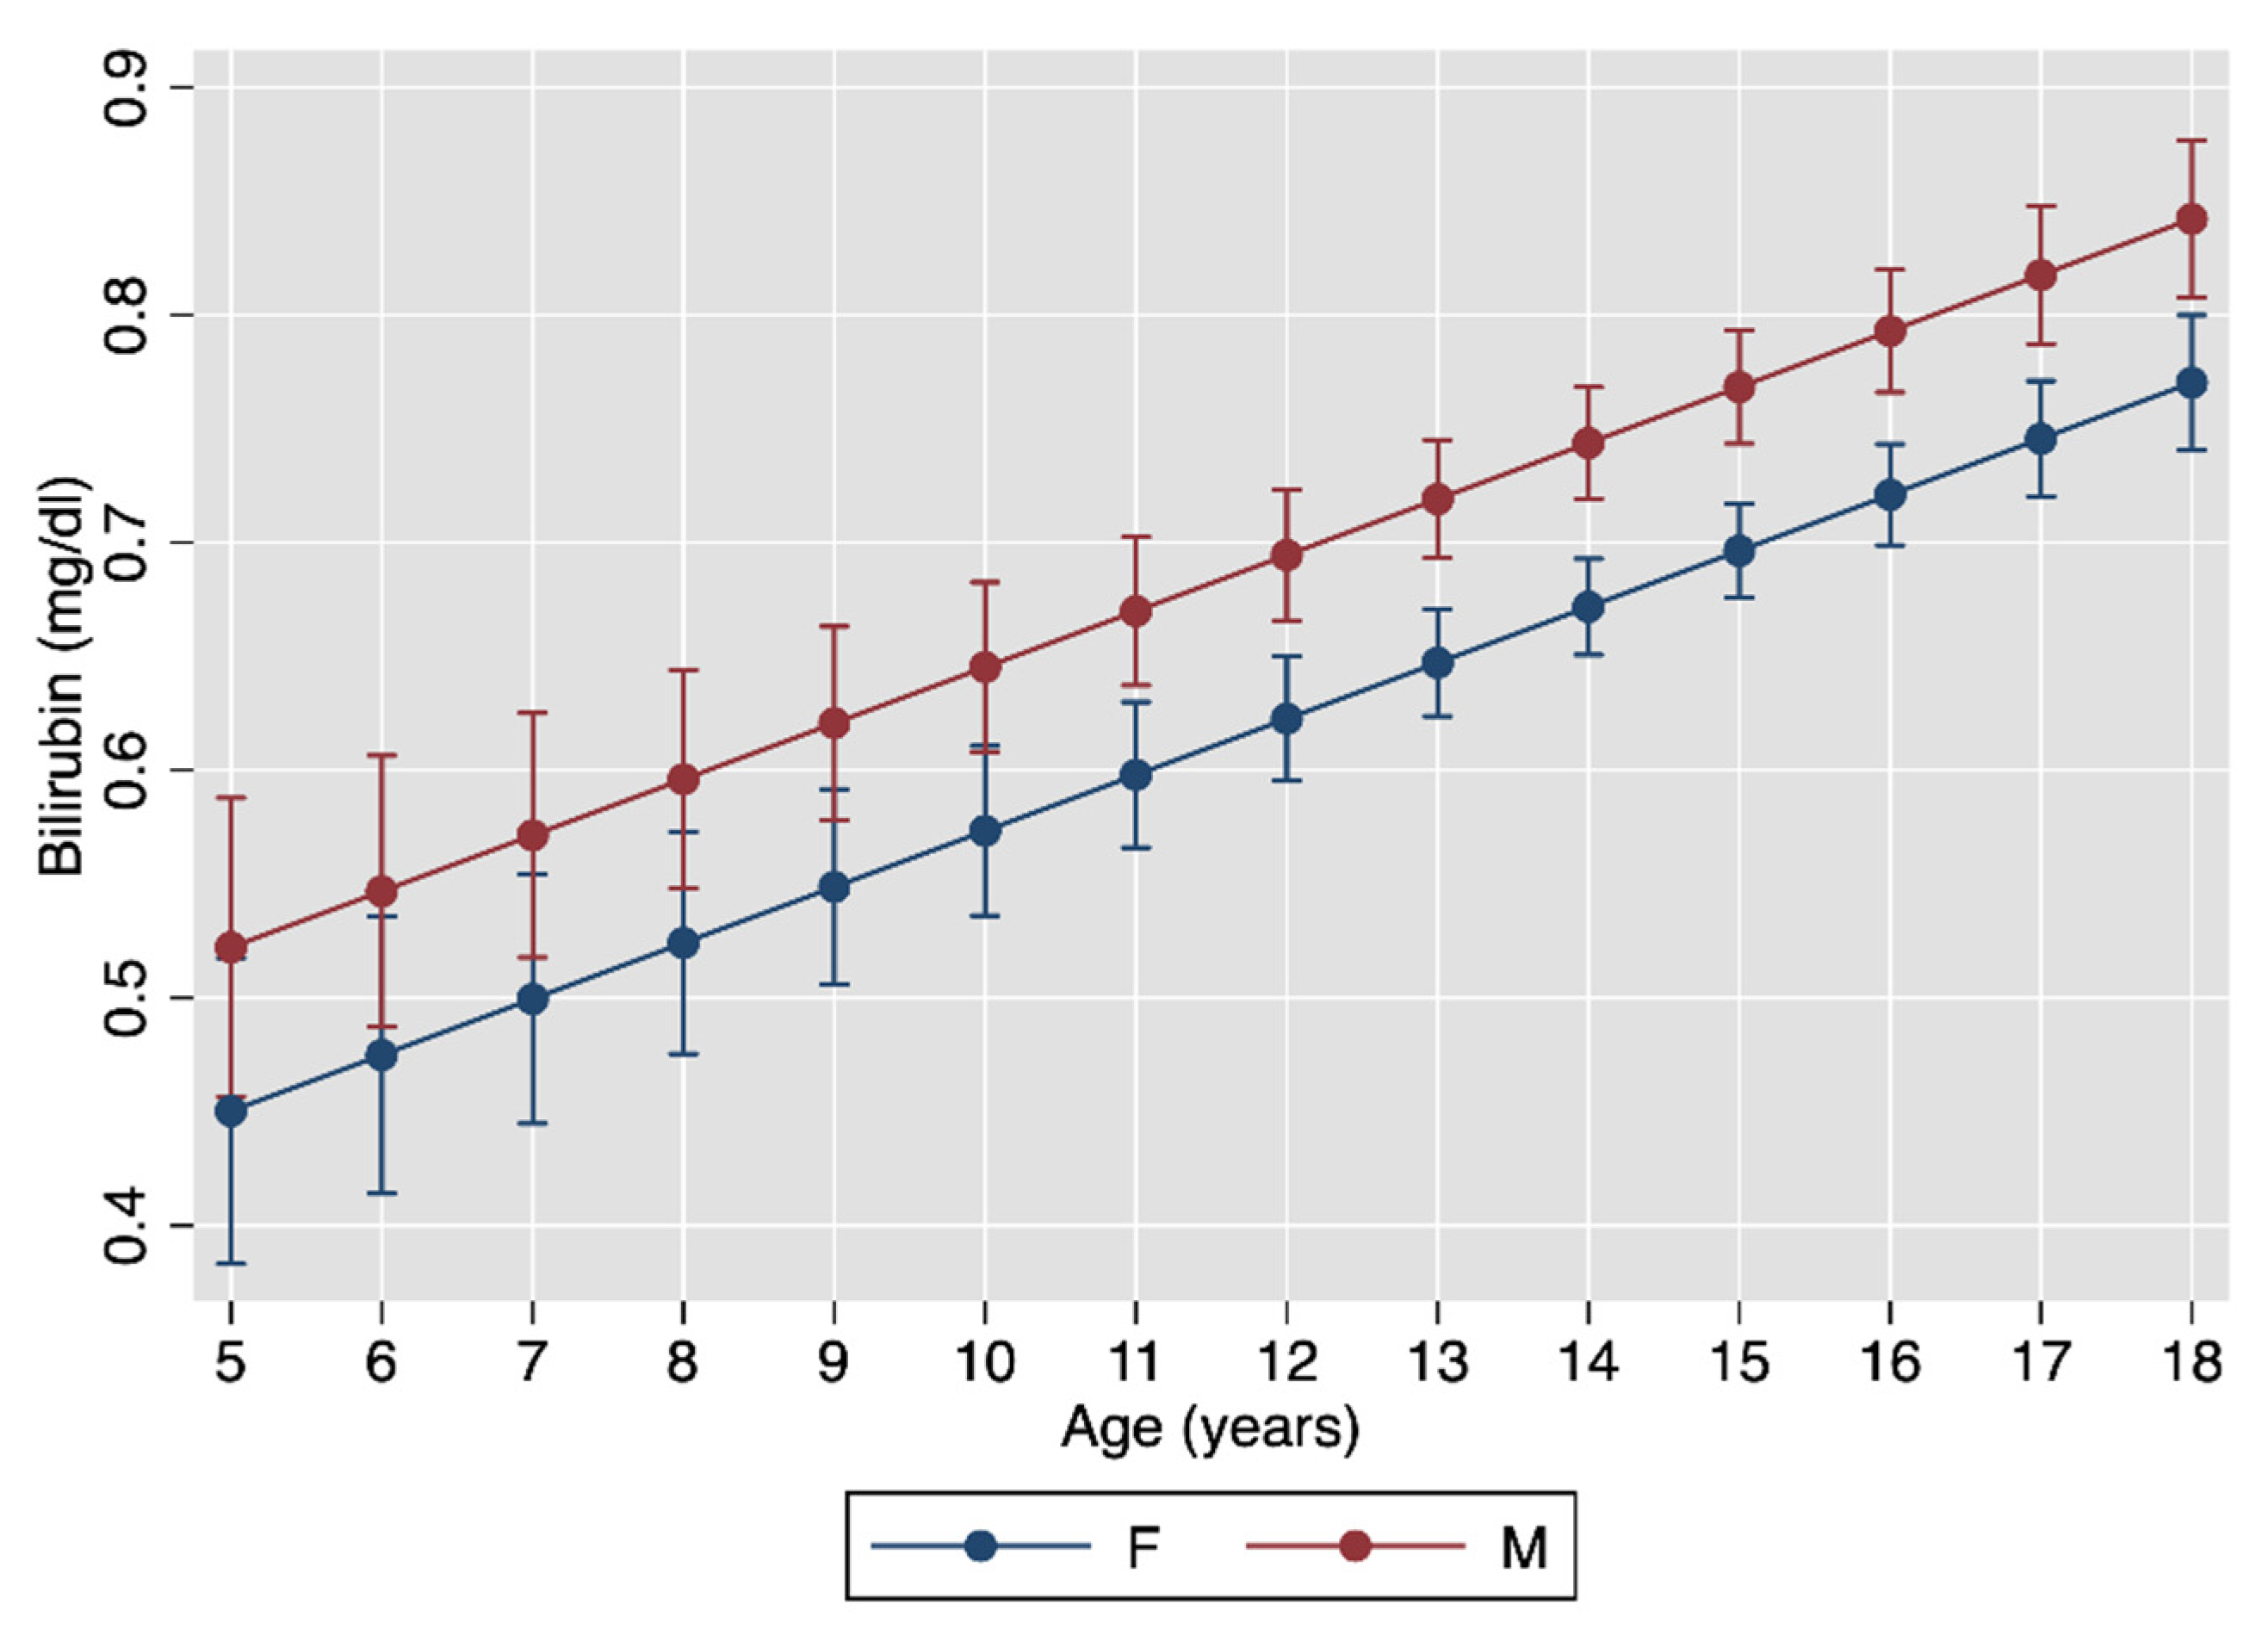
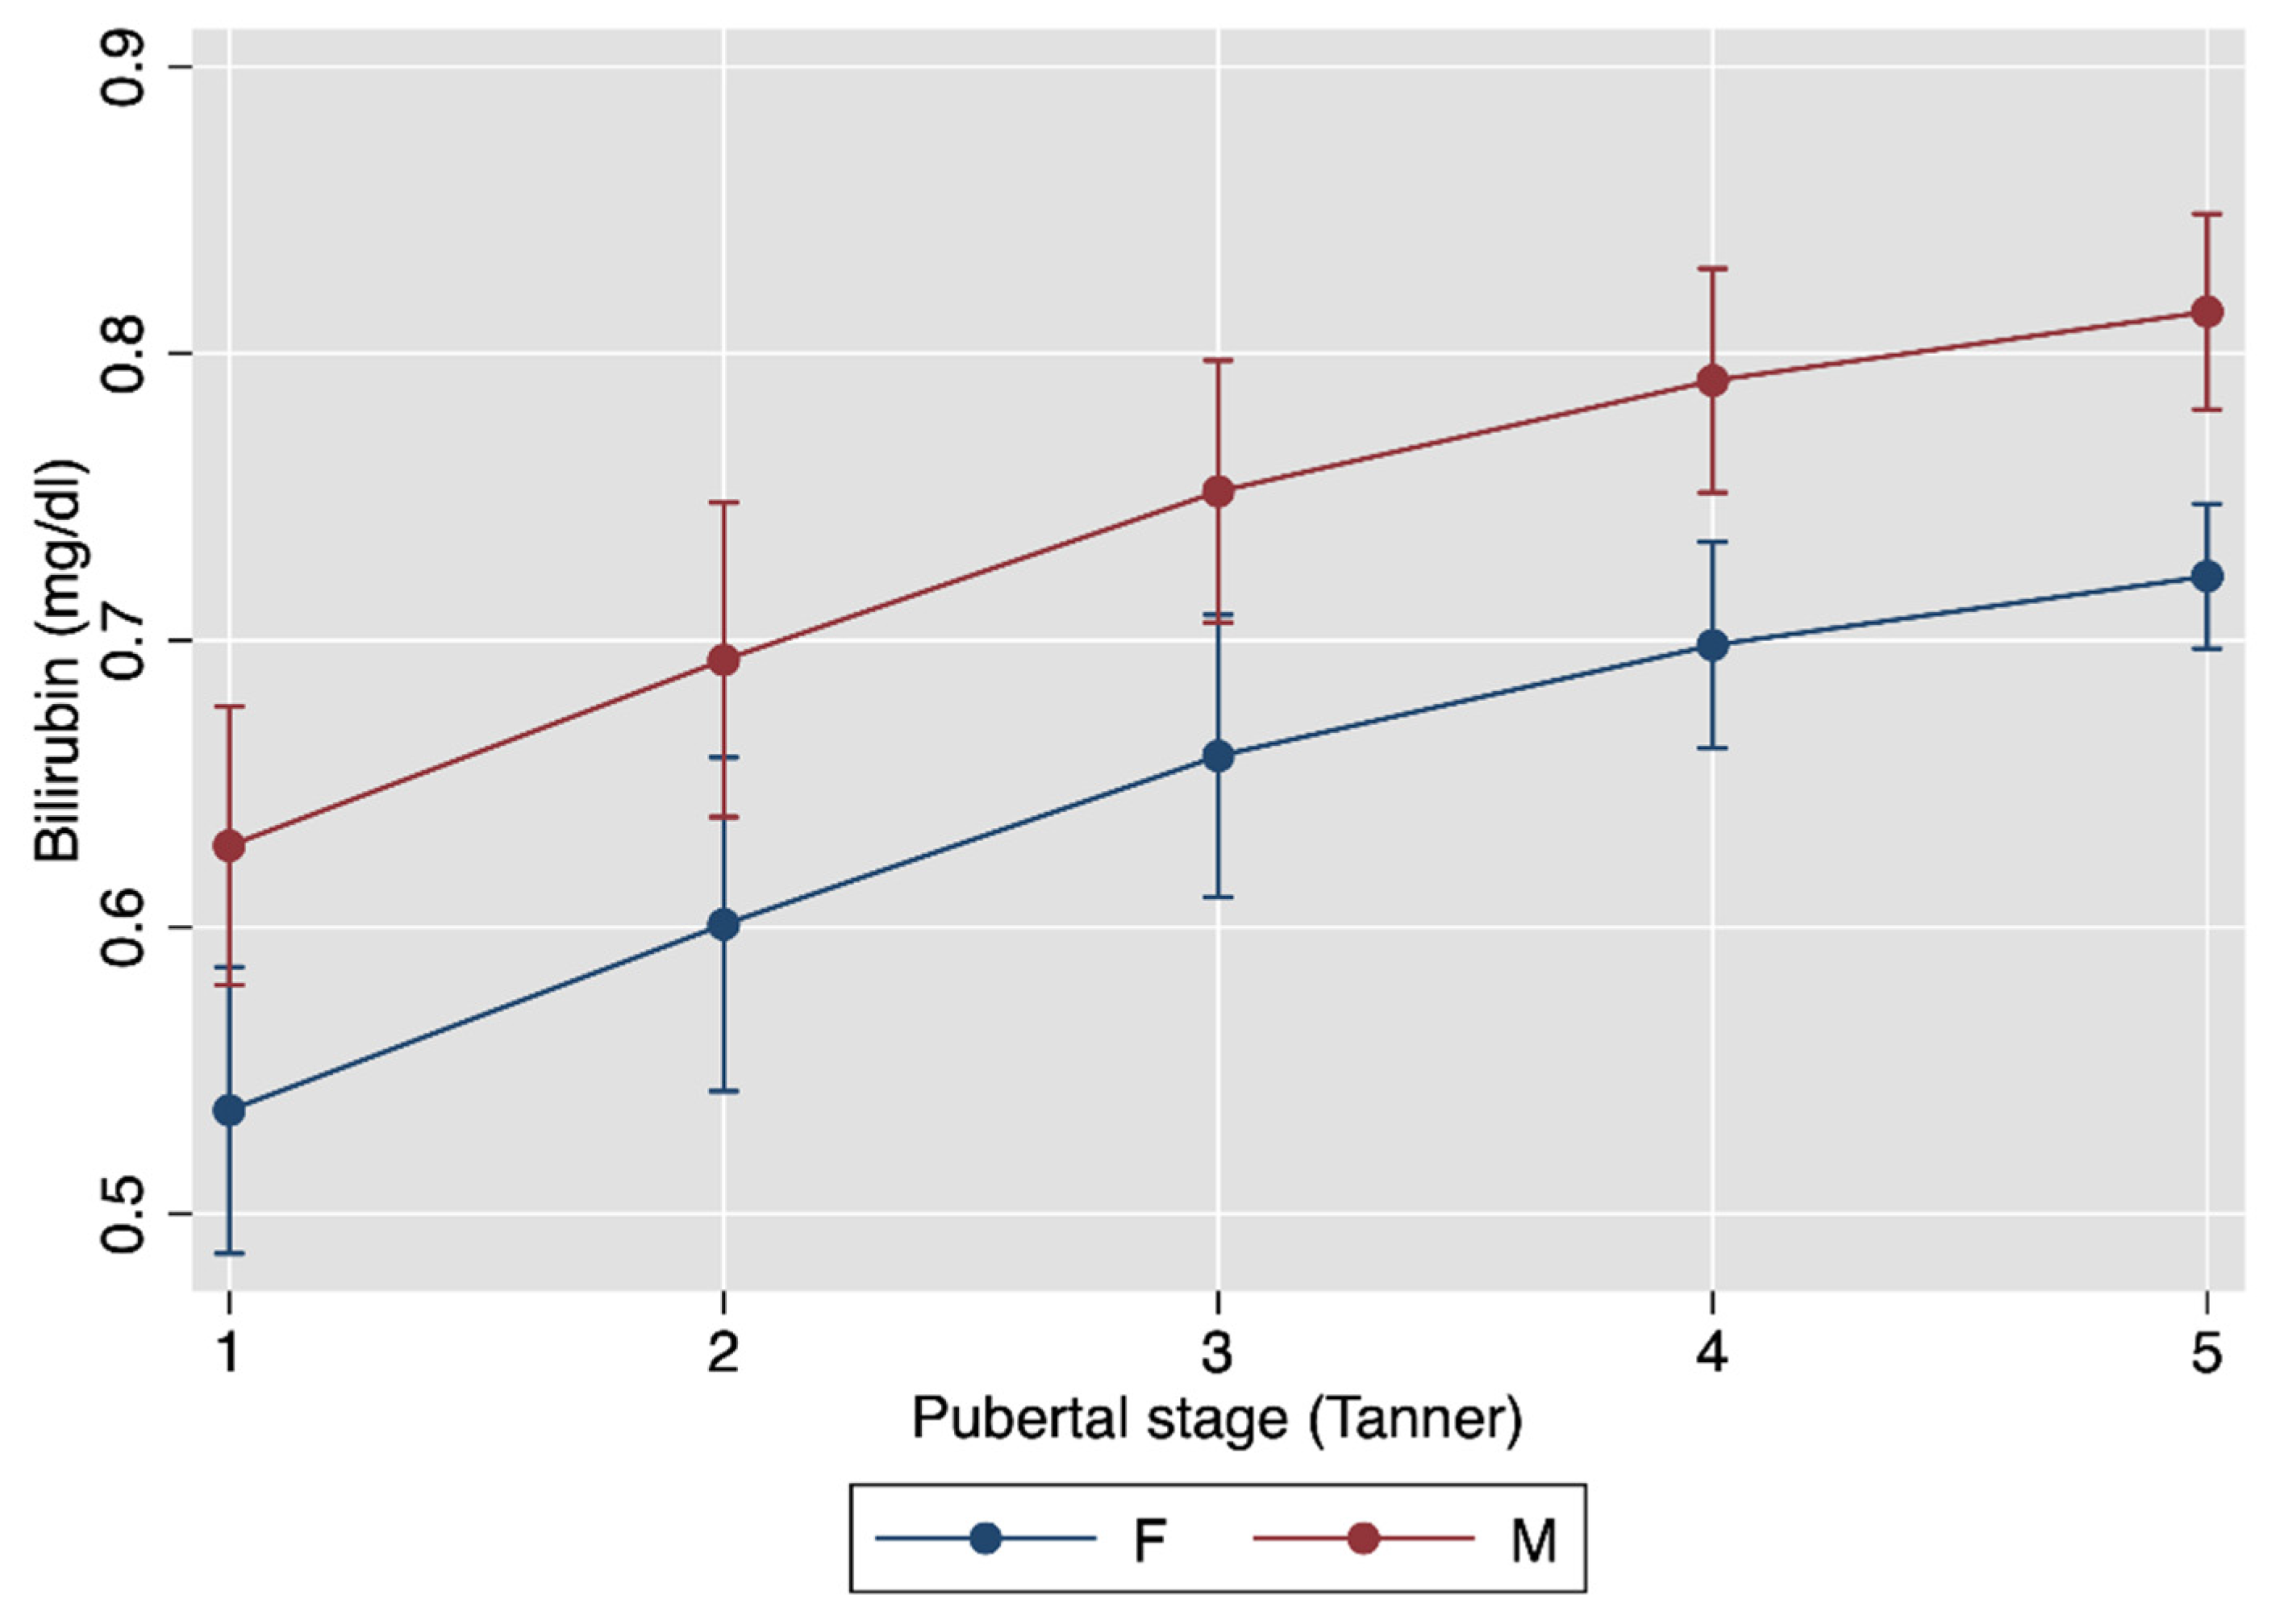
3.2. Multivariable Association between Bilirubin, Age, Pubertal Status and Sex
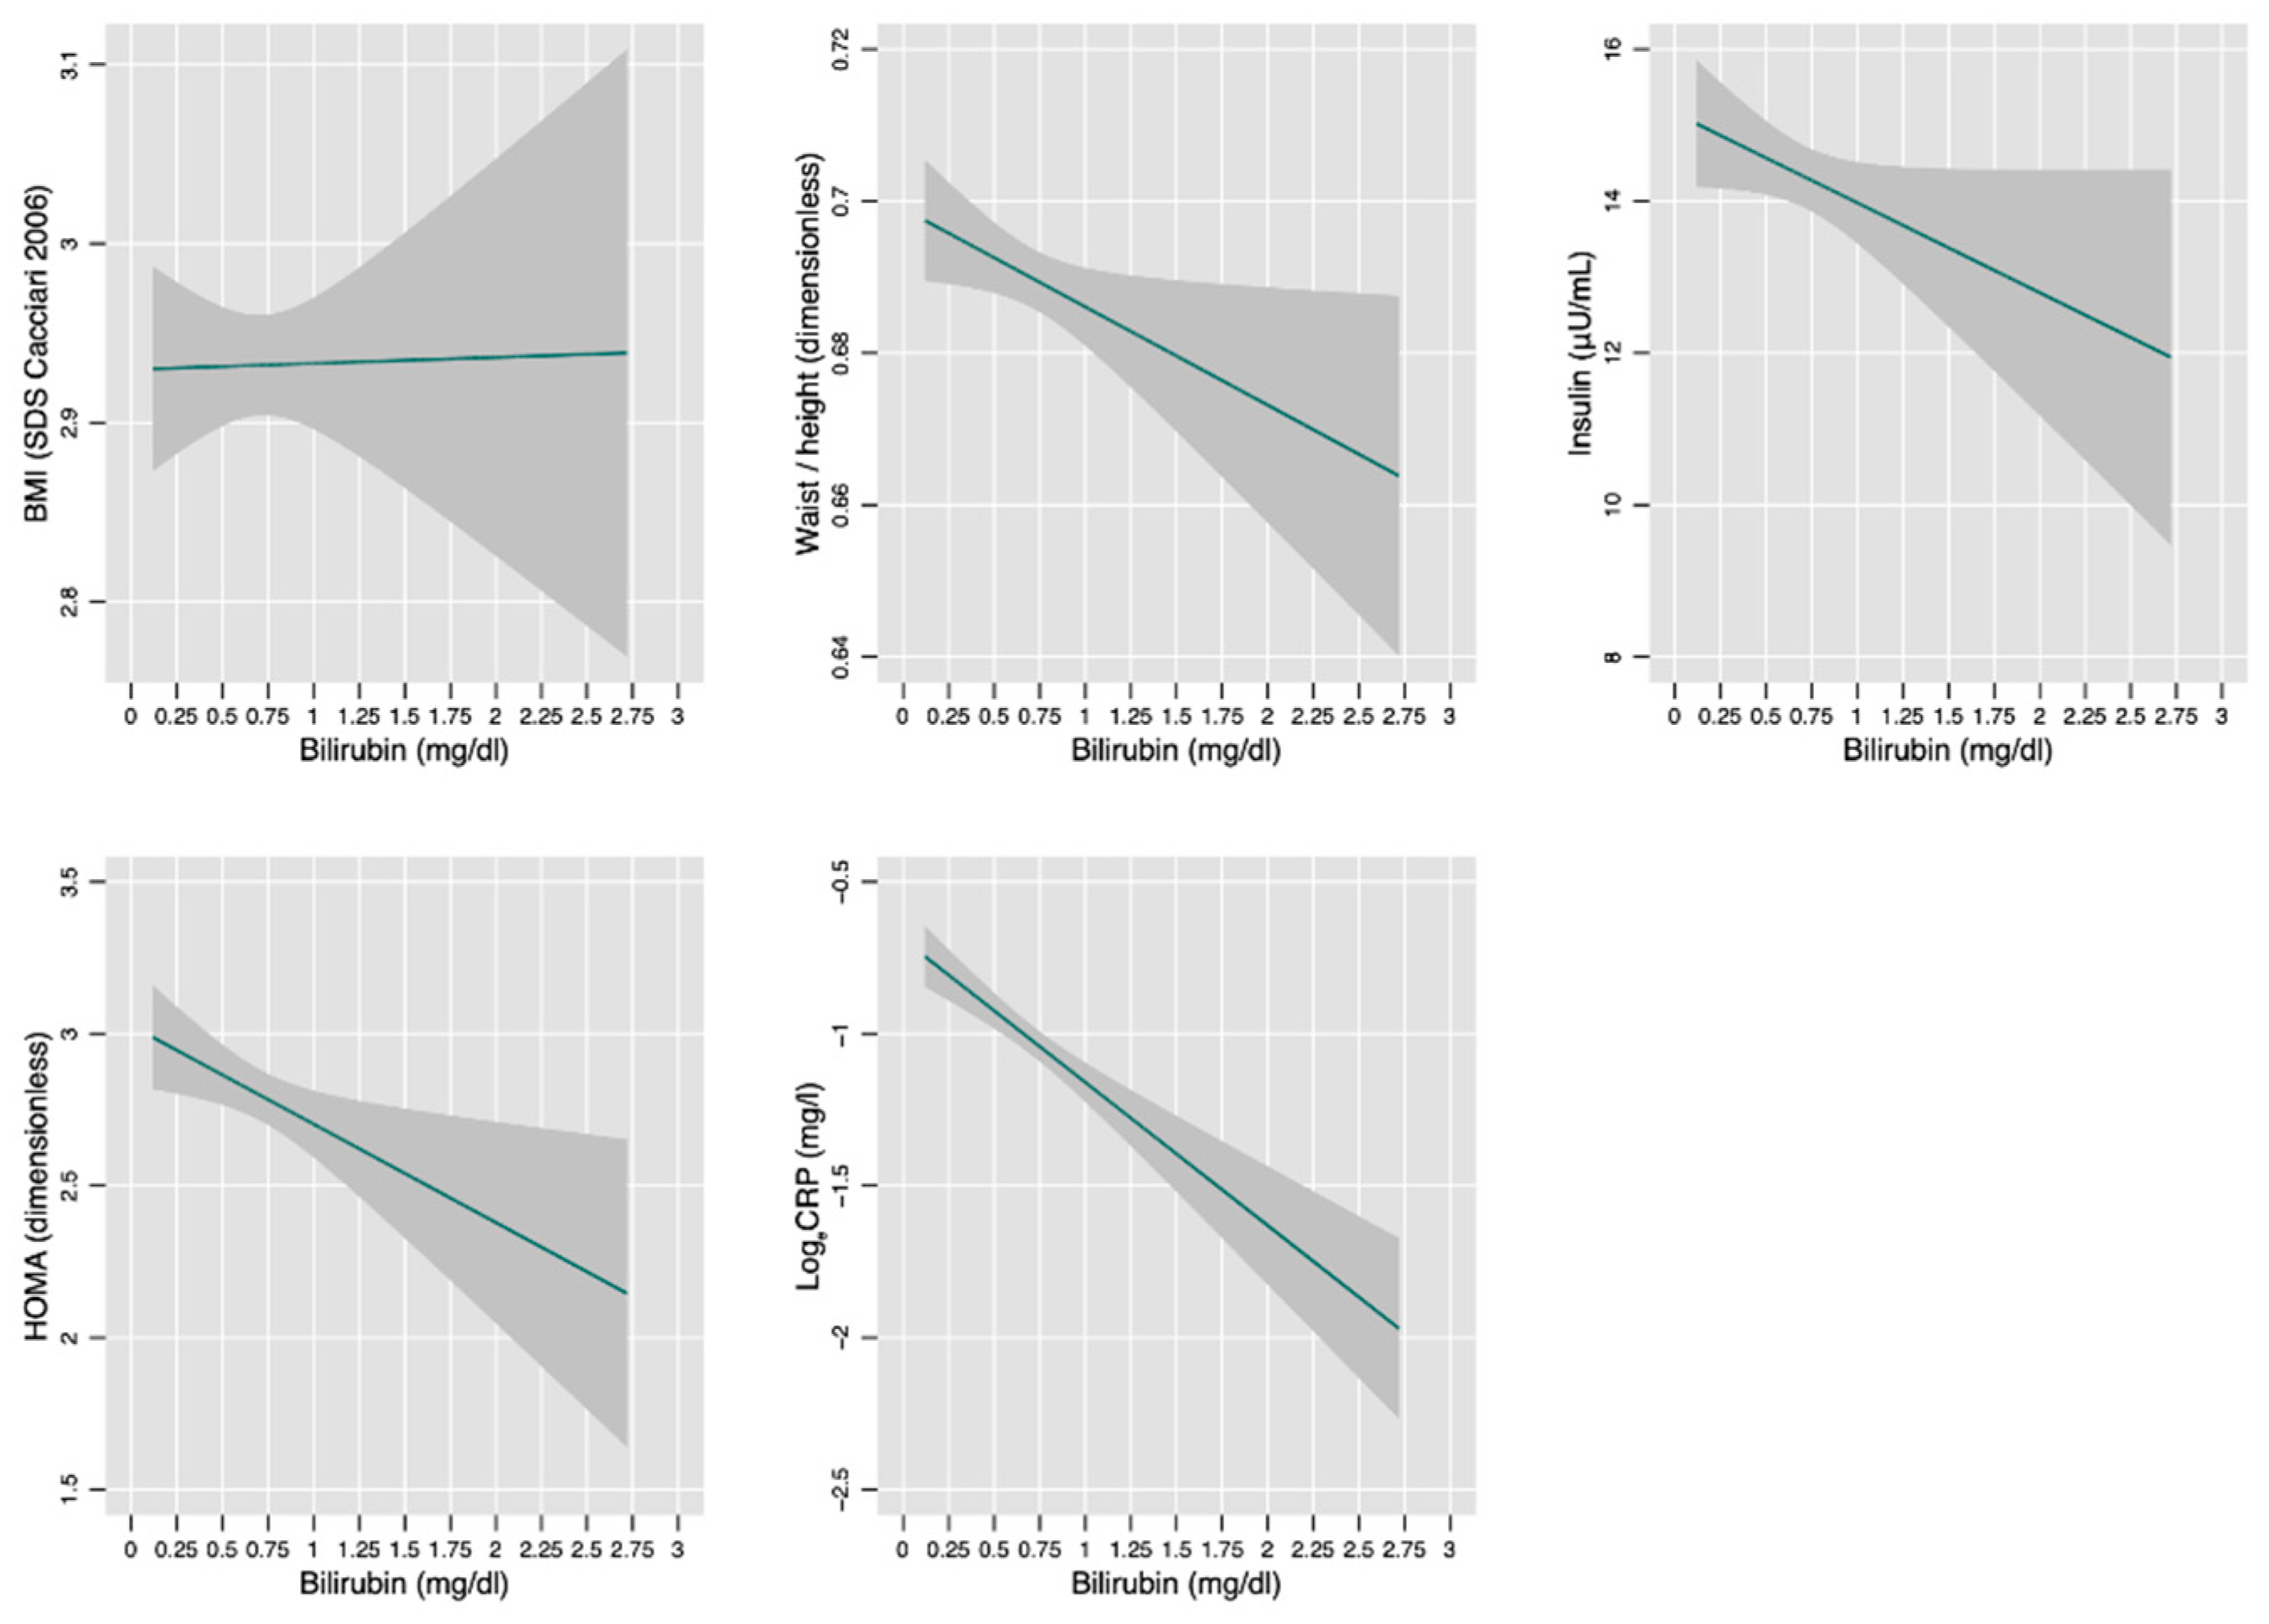
3.3. Univariable Associations between Bilirubin and Anthropometric and Laboratory Measurements
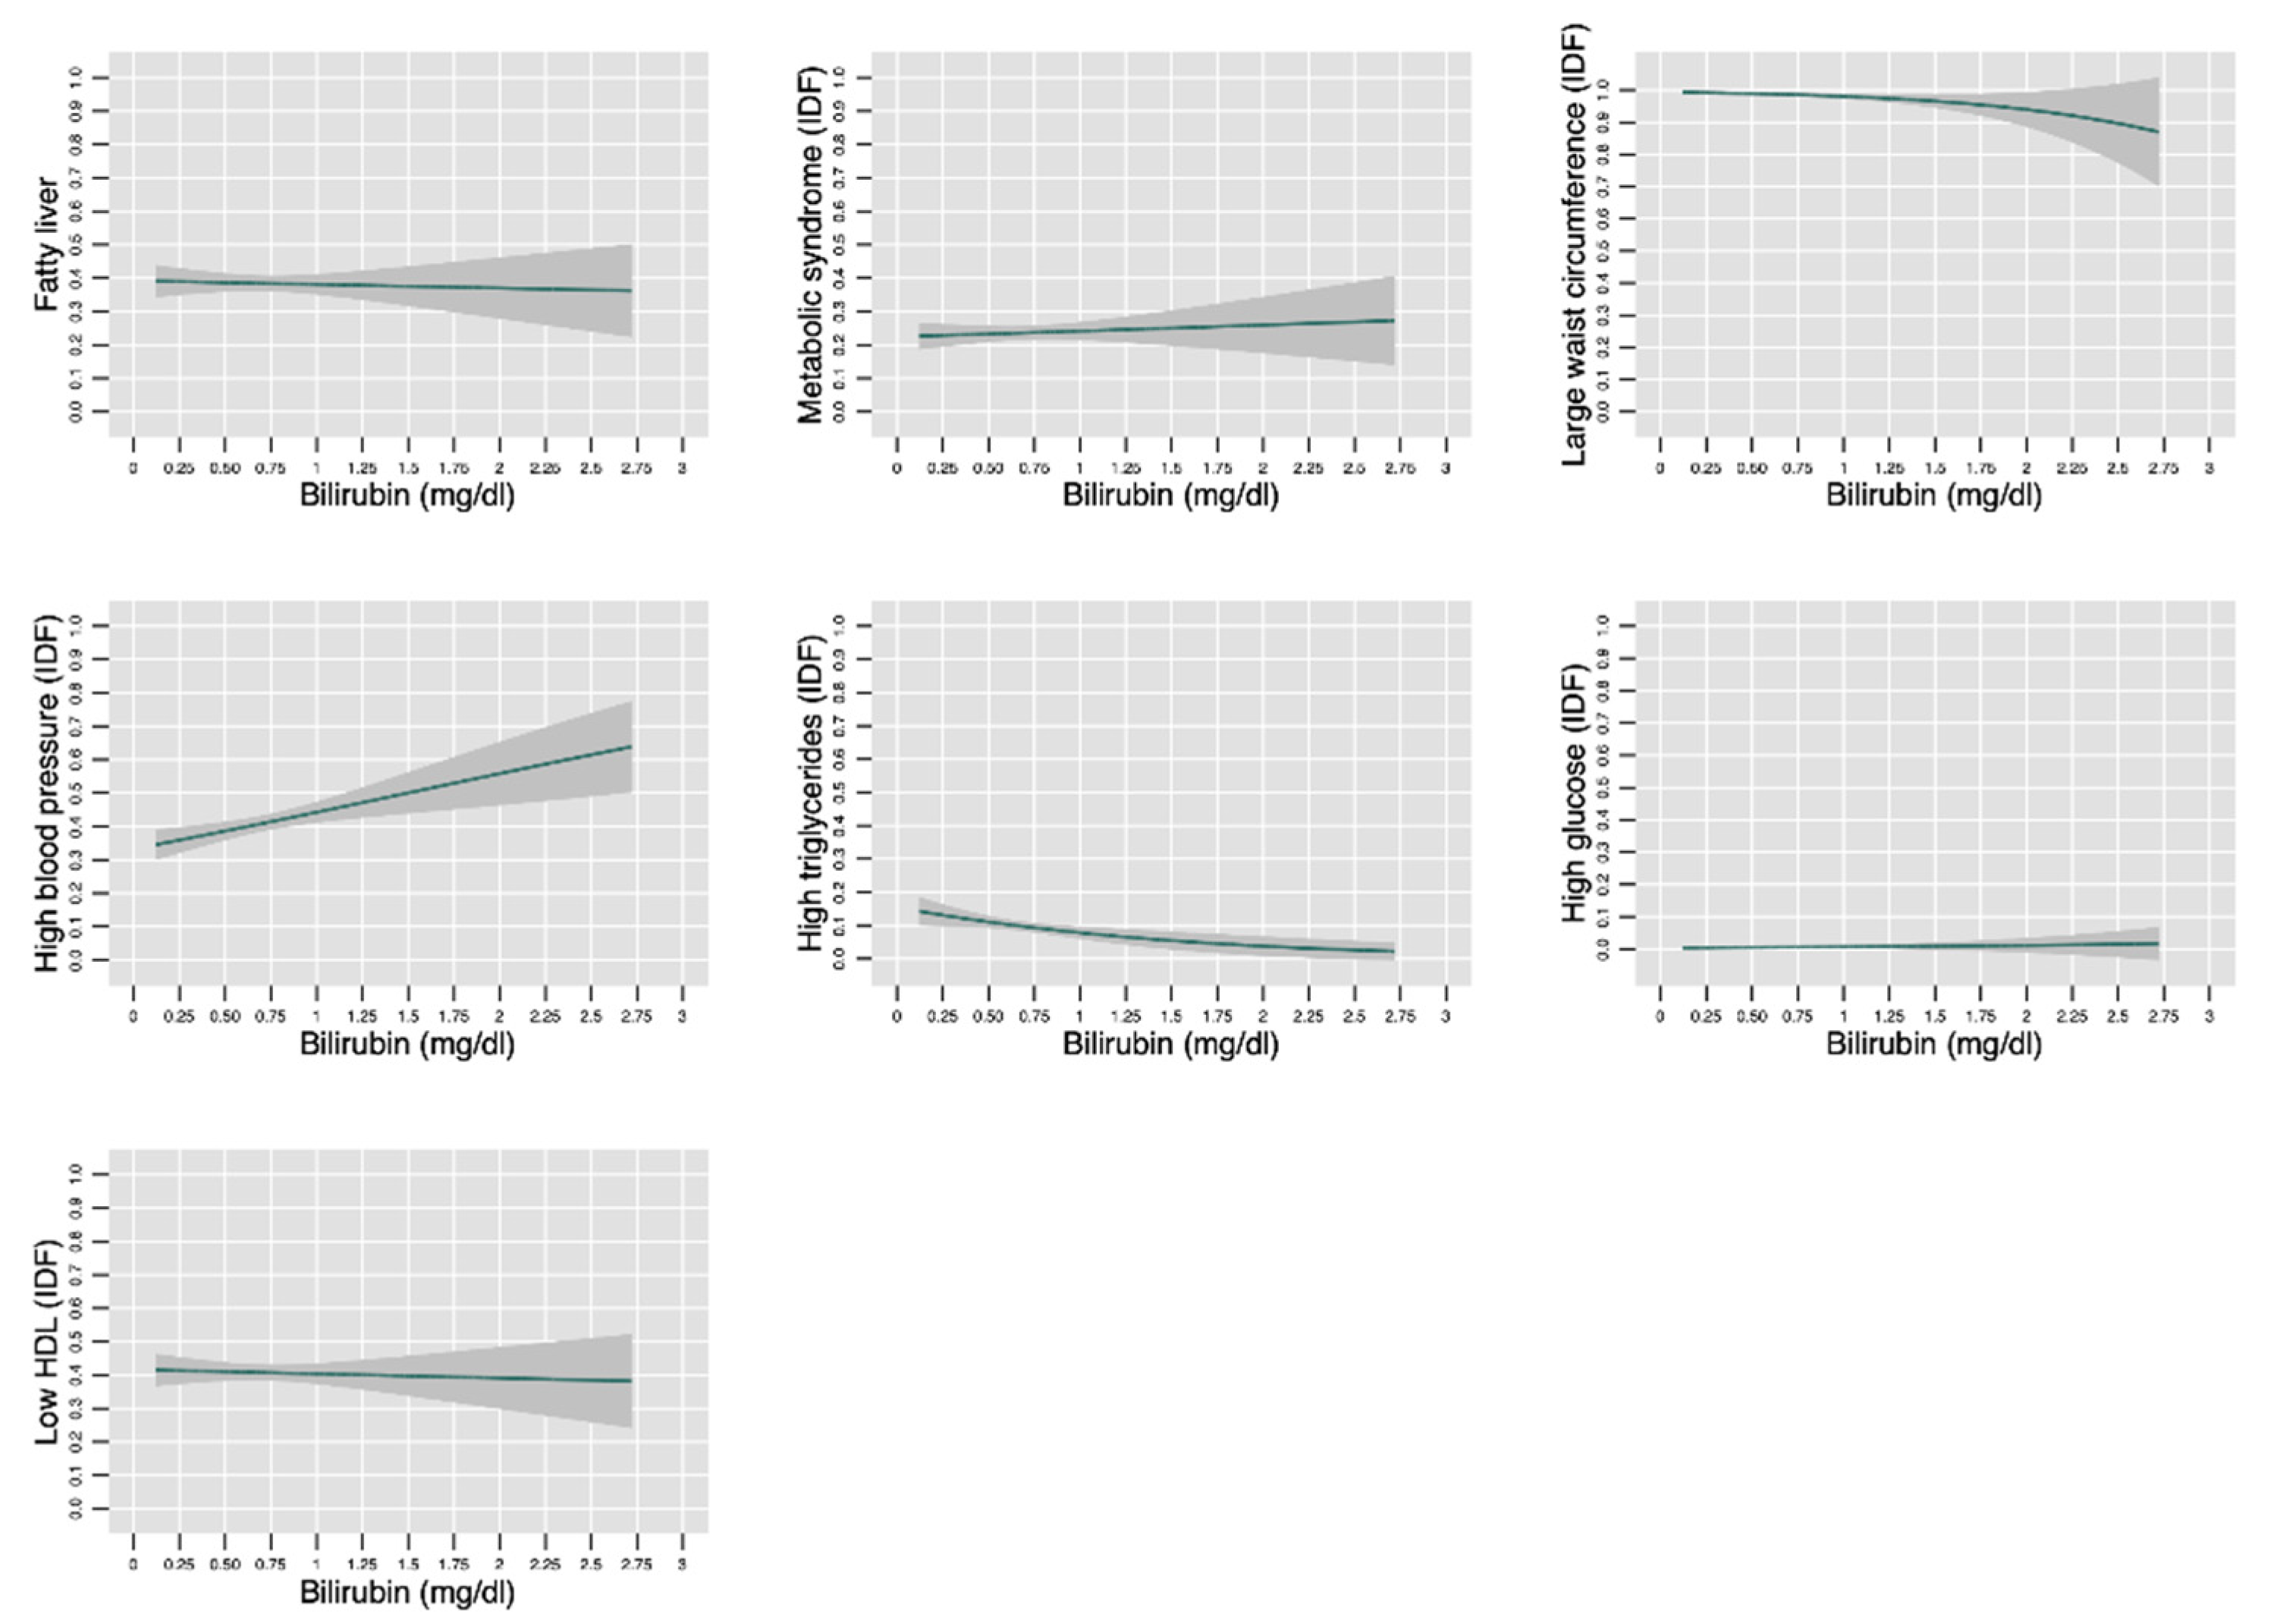
3.4. Univariable Associations between Bilirubin, Fatty Liver, Metabolic Syndrome and Its Components
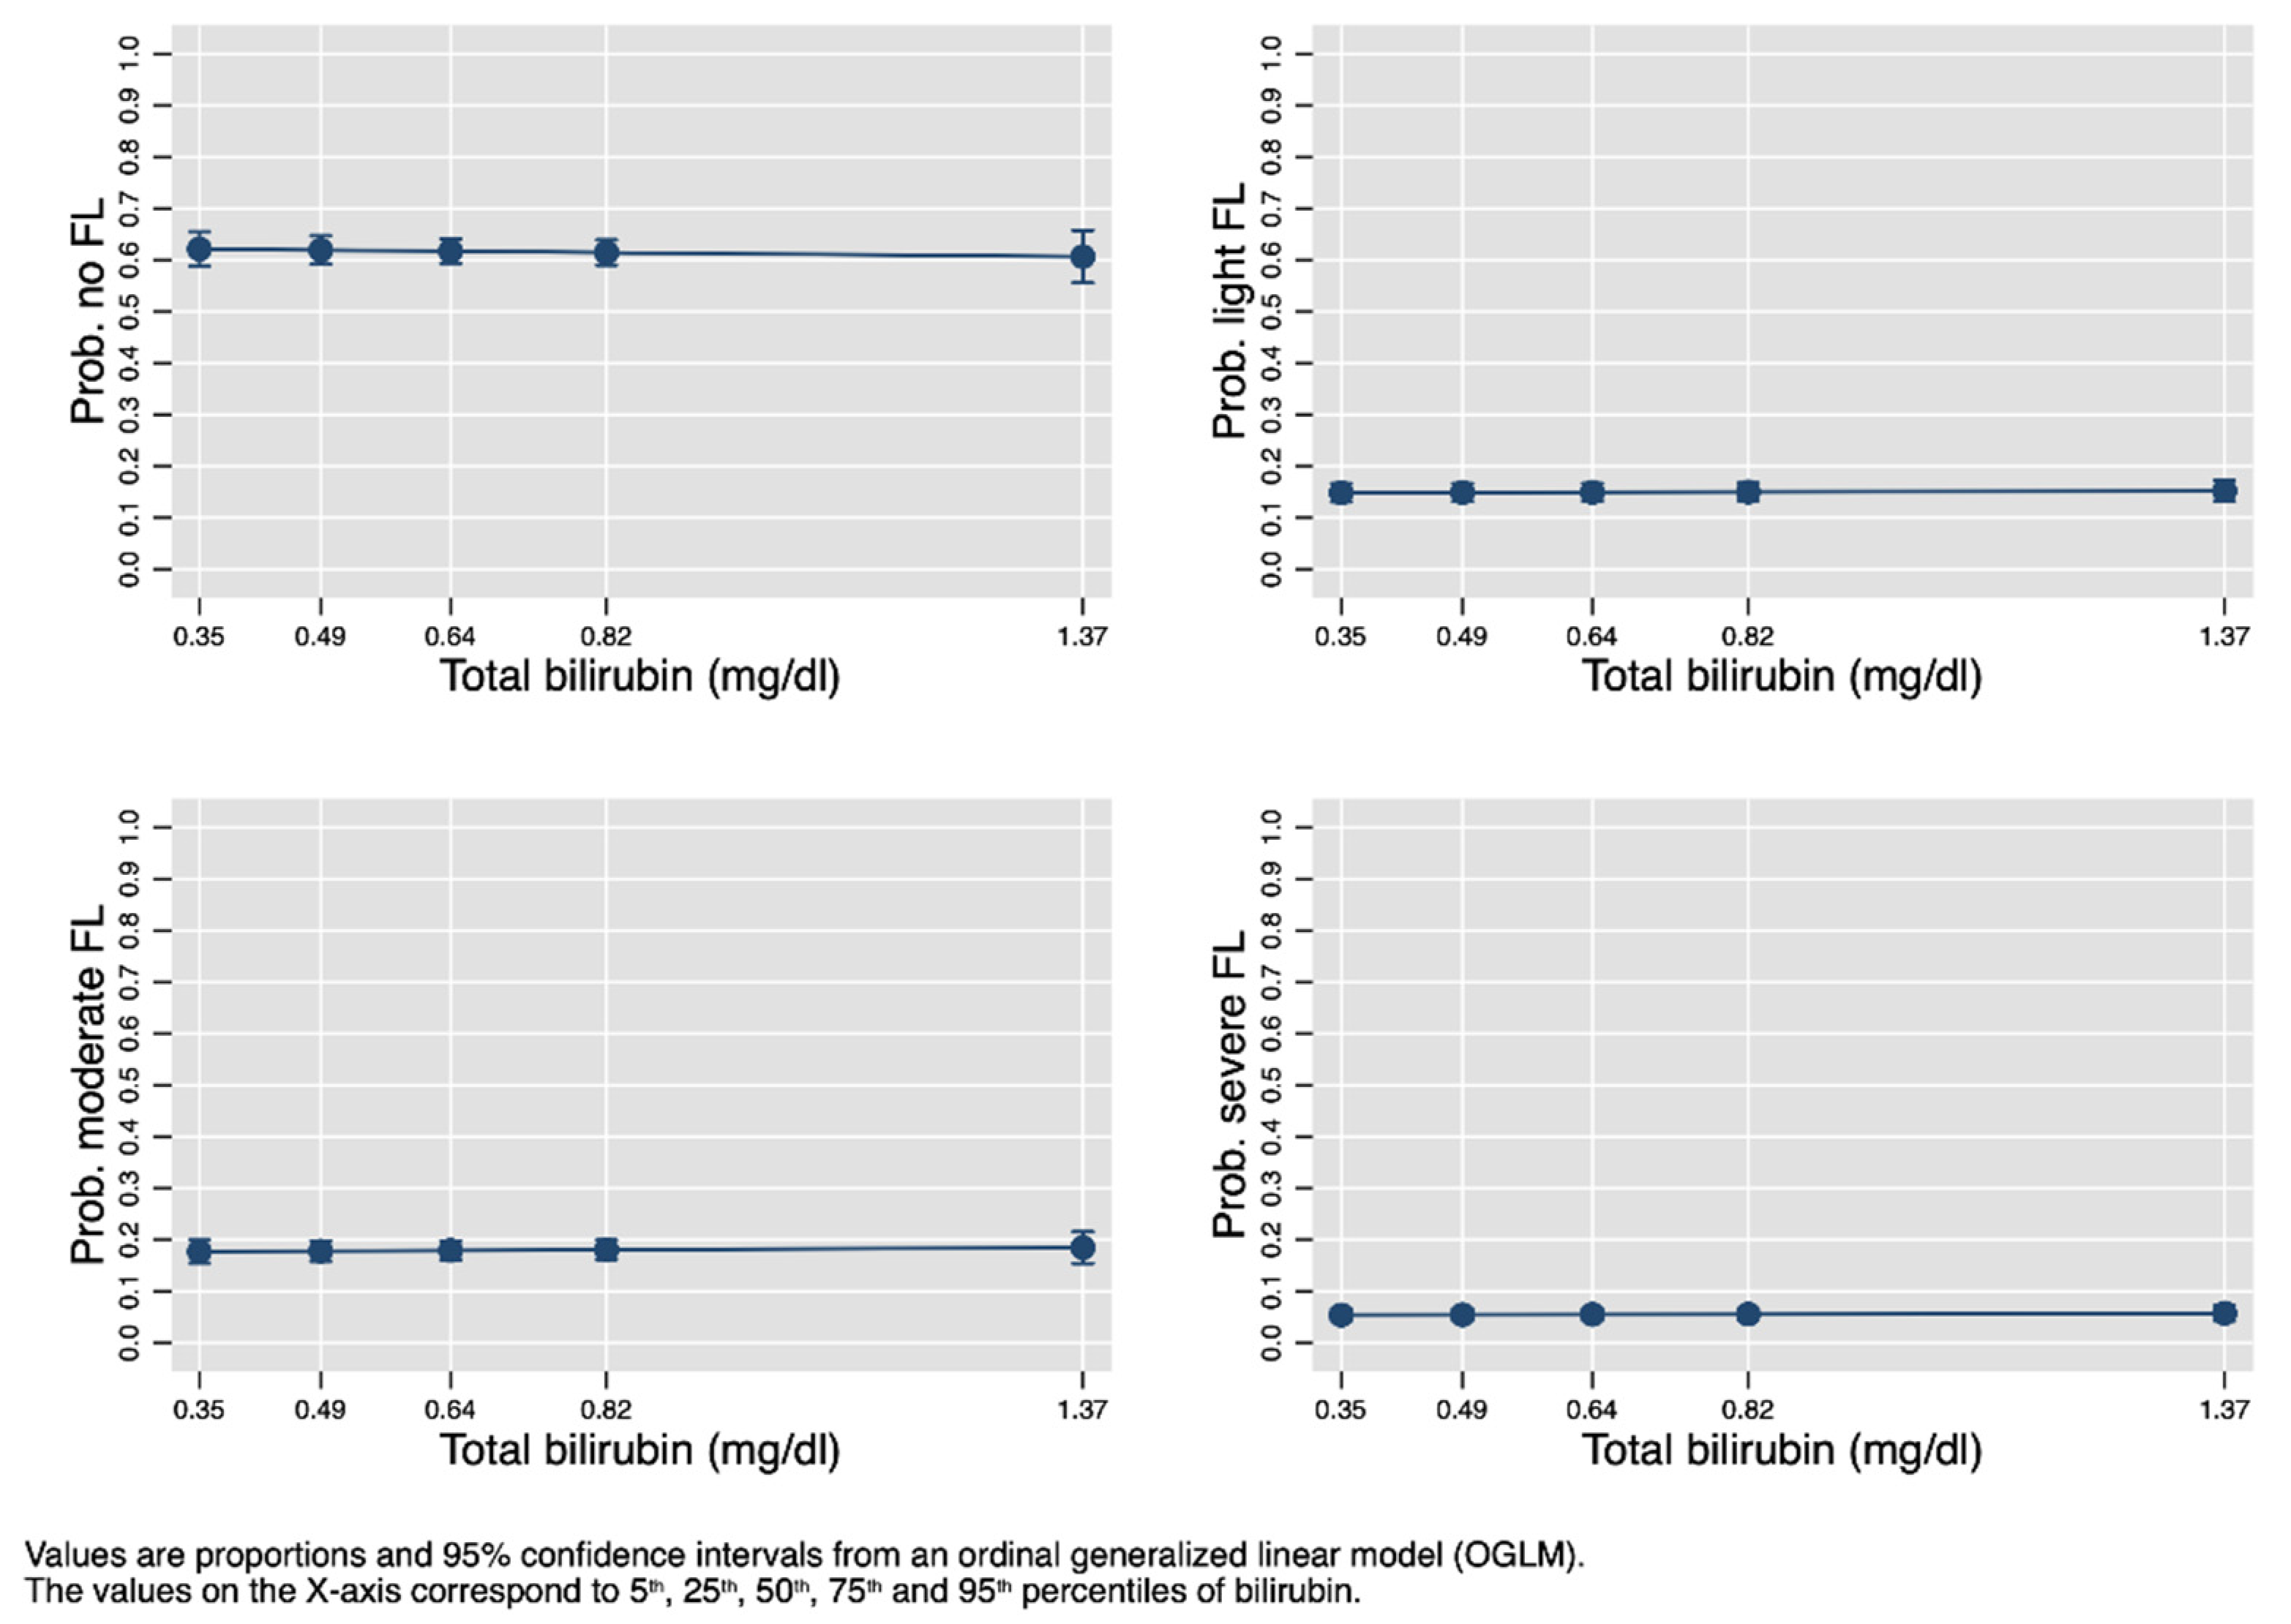
3.5. Univariable Association between Fatty Liver Degree and Bilirubin
4. Discussion
5. Conclusions
Author Contributions
Funding
Institutional Review Board Statement
Informed Consent Statement
Data Availability Statement
Conflicts of Interest
References
- Ng, M.; Fleming, T.; Robinson, M.; Thomson, B.; Graetz, N.; Margono, C.; Mullany, E.C.; Biryukov, S.; Abbafati, C.; Abera, S.F.; et al. Global, Regional, and National Prevalence of Overweight and Obesity in Children and Adults during 1980–2013: A Systematic Analysis for the Global Burden of Disease Study 2013. Lancet Lond. Engl. 2014, 384, 766–781. [Google Scholar] [CrossRef]
- Weiss, R.; Dziura, J.; Burgert, T.S.; Tamborlane, W.V.; Taksali, S.E.; Yeckel, C.W.; Allen, K.; Lopes, M.; Savoye, M.; Morrison, J.; et al. Obesity and the Metabolic Syndrome in Children and Adolescents. N. Engl. J. Med. 2004, 350, 2362–2374. [Google Scholar] [CrossRef]
- Calcaterra, V.; Klersy, C.; Muratori, T.; Telli, S.; Caramagna, C.; Scaglia, F.; Cisternino, M.; Larizza, D. Prevalence of Metabolic Syndrome (MS) in Children and Adolescents with Varying Degrees of Obesity. Clin. Endocrinol. 2008, 68, 868–872. [Google Scholar] [CrossRef]
- Ford, E.S. Risks for All-Cause Mortality, Cardiovascular Disease, and Diabetes Associated with the Metabolic Syndrome: A Summary of the Evidence. Diabetes Care 2005, 28, 1769–1778. [Google Scholar] [CrossRef] [PubMed]
- Ford, E.S.; Giles, W.H.; Mokdad, A.H. Increasing Prevalence of the Metabolic Syndrome among U.S. Adults. Diabetes Care 2004, 27, 2444–2449. [Google Scholar] [CrossRef]
- O’Neill, S.; O’Driscoll, L. Metabolic Syndrome: A Closer Look at the Growing Epidemic and Its Associated Pathologies. Obes. Rev. Off. J. Int. Assoc. Study Obes. 2015, 16, 1–12. [Google Scholar] [CrossRef]
- Nathan, B.M.; Moran, A. Metabolic Complications of Obesity in Childhood and Adolescence: More than Just Diabetes. Curr. Opin. Endocrinol. Diabetes Obes. 2008, 15, 21–29. [Google Scholar] [CrossRef]
- Zimmet, P.; Alberti, G.; Kaufman, F.; Tajima, N.; Silink, M.; Arslanian, S.; Wong, G.; Bennett, P.; Shaw, J.; Caprio, S.; et al. The Metabolic Syndrome in Children and Adolescents. Lancet Lond. Engl. 2007, 369, 2059–2061. [Google Scholar] [CrossRef]
- Lafortuna, C.L.; Adorni, F.; Agosti, F.; De Col, A.; Sievert, K.; Siegfried, W.; Sartorio, A. Prevalence of the Metabolic Syndrome among Extremely Obese Adolescents in Italy and Germany. Diabetes Res. Clin. Pract. 2010, 88, 14–21. [Google Scholar] [CrossRef] [PubMed]
- Santoro, N.; Amato, A.; Grandone, A.; Brienza, C.; Savarese, P.; Tartaglione, N.; Marzuillo, P.; Perrone, L.; Miraglia Del Giudice, E. Predicting Metabolic Syndrome in Obese Children and Adolescents: Look, Measure and Ask. Obes. Facts 2013, 6, 48–56. [Google Scholar] [CrossRef] [PubMed]
- Viggiano, D.; De Filippo, G.; Rendina, D.; Fasolino, A.; D’Alessio, N.; Avellino, N.; Verga, M.C.; Prisco, A.G.; Sorrentino, F.A.; Sabatini, P.; et al. Screening of Metabolic Syndrome in Obese Children: A Primary Care Concern. J. Pediatr. Gastroenterol. Nutr. 2009, 49, 329–334. [Google Scholar] [CrossRef] [PubMed]
- Brufani, C.; Fintini, D.; Giordano, U.; Tozzi, A.E.; Barbetti, F.; Cappa, M. Metabolic Syndrome in Italian Obese Children and Adolescents: Stronger Association with Central Fat Depot than with Insulin Sensitivity and Birth Weight. Int. J. Hypertens. 2011, 2011, 257168. [Google Scholar] [CrossRef] [PubMed][Green Version]
- Marchesini, G.; Bugianesi, E.; Forlani, G.; Cerrelli, F.; Lenzi, M.; Manini, R.; Natale, S.; Vanni, E.; Villanova, N.; Melchionda, N.; et al. Nonalcoholic Fatty Liver, Steatohepatitis, and the Metabolic Syndrome. Hepatology 2003, 37, 917–923. [Google Scholar] [CrossRef]
- Neuschwander-Tetri, B.A.; Caldwell, S.H. Nonalcoholic Steatohepatitis: Summary of an AASLD Single Topic Conference. Hepatology 2003, 37, 1202–1219. [Google Scholar] [CrossRef]
- Kawasaki, T.; Hashimoto, N.; Kikuchi, T.; Takahashi, H.; Uchiyama, M. The Relationship between Fatty Liver and Hyperinsulinemia in Obese Japanese Children. J. Pediatr. Gastroenterol. Nutr. 1997, 24, 317–321. [Google Scholar] [CrossRef] [PubMed]
- Schwimmer, J.B.; Behling, C.; Newbury, R.; Deutsch, R.; Nievergelt, C.; Schork, N.J.; Lavine, J.E. Histopathology of Pediatric Nonalcoholic Fatty Liver Disease. Hepatology 2005, 42, 641–649. [Google Scholar] [CrossRef]
- Schwimmer, J.B.; Deutsch, R.; Rauch, J.B.; Behling, C.; Newbury, R.; Lavine, J.E. Obesity, Insulin Resistance, and Other Clinicopathological Correlates of Pediatric Nonalcoholic Fatty Liver Disease. J. Pediatr. 2003, 143, 500–505. [Google Scholar] [CrossRef]
- Anderson, E.L.; Howe, L.D.; Jones, H.E.; Higgins, J.P.T.; Lawlor, D.A.; Fraser, A. The Prevalence of Non-Alcoholic Fatty Liver Disease in Children and Adolescents: A Systematic Review and Meta-Analysis. PLoS ONE 2015, 10, e0140908. [Google Scholar] [CrossRef] [PubMed]
- Fevery, J. Bilirubin in Clinical Practice: A Review. Liver Int. 2008, 28, 592–605. [Google Scholar] [CrossRef]
- Bosma, P.J.; Chowdhury, J.R.; Bakker, C.; Gantla, S.; de Boer, A.; Oostra, B.A.; Lindhout, D.; Tytgat, G.N.; Jansen, P.L.; Oude Elferink, R.P. The Genetic Basis of the Reduced Expression of Bilirubin UDP-Glucuronosyltransferase 1 in Gilbert’s Syndrome. N. Engl. J. Med. 1995, 333, 1171–1175. [Google Scholar] [CrossRef] [PubMed]
- Clementi, M.; Di Gianantonio, E.; Fabris, L.; Forabosco, P.; Strazzabosco, M.; Tenconi, R.; Okolicsanyi, L. Inheritance of Hyperbilirubinemia: Evidence for a Major Autosomal Recessive Gene. Dig. Liver Dis. 2007, 39, 351–355. [Google Scholar] [CrossRef] [PubMed]
- Yasar, U.; Greenblatt, D.J.; Guillemette, C.; Court, M.H. Evidence for Regulation of UDP-Glucuronosyltransferase (UGT) 1A1 Protein Expression and Activity via DNA Methylation in Healthy Human Livers. J. Pharm. Pharmacol. 2013, 65, 874–883. [Google Scholar] [CrossRef] [PubMed]
- Vitek, L.; Bellarosa, C.; Tiribelli, C. Induction of Mild Hyperbilirubinemia: Hype or Real Therapeutic Opportunity? Clin. Pharmacol. Ther. 2018. [Google Scholar] [CrossRef] [PubMed]
- Inoguchi, T.; Sonoda, N.; Maeda, Y. Bilirubin as an Important Physiological Modulator of Oxidative Stress and Chronic Inflammation in Metabolic Syndrome and Diabetes: A New Aspect on Old Molecule. Diabetol. Int. 2016, 7, 338–341. [Google Scholar] [CrossRef]
- Jangi, S.; Otterbein, L.; Robson, S. The Molecular Basis for the Immunomodulatory Activities of Unconjugated Bilirubin. Int. J. Biochem. Cell Biol. 2013, 45, 2843–2851. [Google Scholar] [CrossRef] [PubMed]
- Hwang, H.-J.; Kim, S.-H. Inverse Relationship between Fasting Direct Bilirubin and Metabolic Syndrome in Korean Adults. Clin. Chim. Acta 2010, 411, 1496–1501. [Google Scholar] [CrossRef]
- Jo, J.; Yun, J.E.; Lee, H.; Kimm, H.; Jee, S.H. Total, Direct, and Indirect Serum Bilirubin Concentrations and Metabolic Syndrome among the Korean Population. Endocrine 2011, 39, 182–189. [Google Scholar] [CrossRef]
- Wu, Y.; Li, M.; Xu, M.; Bi, Y.; Li, X.; Chen, Y.; Ning, G.; Wang, W. Low Serum Total Bilirubin Concentrations Are Associated with Increased Prevalence of Metabolic Syndrome in Chinese. J. Diabetes 2011, 3, 217–224. [Google Scholar] [CrossRef]
- Seyed Khoei, N.; Grindel, A.; Wallner, M.; Mölzer, C.; Doberer, D.; Marculescu, R.; Bulmer, A.; Wagner, K.-H. Mild Hyperbilirubinaemia as an Endogenous Mitigator of Overweight and Obesity: Implications for Improved Metabolic Health. Atherosclerosis 2018, 269, 306–311. [Google Scholar] [CrossRef]
- Nano, J.; Muka, T.; Cepeda, M.; Voortman, T.; Dhana, K.; Brahimaj, A.; Dehghan, A.; Franco, O.H. Association of Circulating Total Bilirubin with the Metabolic Syndrome and Type 2 Diabetes: A Systematic Review and Meta-Analysis of Observational Evidence. Diabetes Metab. 2016, 42, 389–397. [Google Scholar] [CrossRef] [PubMed]
- Vítek, L. The Role of Bilirubin in Diabetes, Metabolic Syndrome, and Cardiovascular Diseases. Front. Pharmacol. 2012, 3, 55. [Google Scholar] [CrossRef]
- Kwon, Y.-J.; Lee, Y.-J.; Park, B.-J.; Hong, K.-W.; Jung, D.-H. Total Serum Bilirubin and 8-Year Incident Type 2 Diabetes Mellitus: The Korean Genome and Epidemiology Study. Diabetes Metab. 2017. [Google Scholar] [CrossRef] [PubMed]
- Lippi, G.; Targher, G.; Montagnana, M.; Salvagno, G.L.; Guidi, G.C. Bilirubin Concentration and Cardiovascular Risk Profile. Liver Int. 2009, 29, 315–316. [Google Scholar] [CrossRef]
- Kunutsor, S.K.; Bakker, S.J.L.; Gansevoort, R.T.; Chowdhury, R.; Dullaart, R.P.F. Circulating Total Bilirubin and Risk of Incident Cardiovascular Disease in the General Population. Arterioscler. Thromb. Vasc. Biol. 2015, 35, 716–724. [Google Scholar] [CrossRef]
- Kunutsor, S.K. Serum Total Bilirubin Levels and Coronary Heart Disease—Causal Association or Epiphenomenon? Exp. Gerontol. 2015, 72, 63–66. [Google Scholar] [CrossRef] [PubMed][Green Version]
- Madhavan, M.; Wattigney, W.A.; Srinivasan, S.R.; Berenson, G.S. Serum Bilirubin Distribution and Its Relation to Cardiovascular Risk in Children and Young Adults. Atherosclerosis 1997, 131, 107–113. [Google Scholar] [CrossRef]
- Lin, L.-Y.; Kuo, H.-K.; Hwang, J.-J.; Lai, L.-P.; Chiang, F.-T.; Tseng, C.-D.; Lin, J.-L. Serum Bilirubin Is Inversely Associated with Insulin Resistance and Metabolic Syndrome among Children and Adolescents. Atherosclerosis 2009, 203, 563–568. [Google Scholar] [CrossRef]
- Belo, L.; Nascimento, H.; Kohlova, M.; Bronze-da-Rocha, E.; Fernandes, J.; Costa, E.; Catarino, C.; Aires, L.; Mansilha, H.F.; Rocha-Pereira, P.; et al. Body Fat Percentage Is a Major Determinant of Total Bilirubin Independently of UGT1A1*28 Polymorphism in Young Obese. PLoS ONE 2014, 9, e98467. [Google Scholar] [CrossRef]
- Kwak, M.-S.; Kim, D.; Chung, G.E.; Kang, S.J.; Park, M.J.; Kim, Y.J.; Yoon, J.-H.; Lee, H.-S. Serum Bilirubin Levels Are Inversely Associated with Nonalcoholic Fatty Liver Disease. Clin. Mol. Hepatol. 2012, 18, 383–390. [Google Scholar] [CrossRef]
- Salomone, F.; Li Volti, G.; Rosso, C.; Grosso, G.; Bugianesi, E. Unconjugated Bilirubin, a Potent Endogenous Antioxidant, Is Decreased in Patients with Non-Alcoholic Steatohepatitis and Advanced Fibrosis. J. Gastroenterol. Hepatol. 2013, 28, 1202–1208. [Google Scholar] [CrossRef] [PubMed]
- Puri, K.; Nobili, V.; Melville, K.; Corte, C.D.; Sartorelli, M.R.; Lopez, R.; Feldstein, A.E.; Alkhouri, N. Serum Bilirubin Level Is Inversely Associated with Nonalcoholic Steatohepatitis in Children. J. Pediatr. Gastroenterol. Nutr. 2013, 57, 114–118. [Google Scholar] [CrossRef]
- Luo, L.; An, P.; Jia, X.; Yue, X.; Zheng, S.; Liu, S.; Chen, Y.; An, W.; Winkler, C.A.; Duan, Z. Genetically Regulated Bilirubin and Risk of Non-Alcoholic Fatty Liver Disease: A Mendelian Randomization Study. Front. Genet. 2018, 9, 662. [Google Scholar] [CrossRef] [PubMed]
- Kunutsor, S.K.; Frysz, M.; Verweij, N.; Kieneker, L.M.; Bakker, S.J.L.; Dullaart, R.P.F. Circulating Total Bilirubin and Risk of Non-Alcoholic Fatty Liver Disease in the PREVEND Study: Observational Findings and a Mendelian Randomization Study. Eur. J. Epidemiol. 2020, 35, 123–137. [Google Scholar] [CrossRef] [PubMed]
- Cacciari, E.; Milani, S.; Balsamo, A.; Spada, E.; Bona, G.; Cavallo, L.; Cerutti, F.; Gargantini, L.; Greggio, N.; Tonini, G.; et al. Italian Cross-Sectional Growth Charts for Height, Weight and BMI (2 to 20 Yr). J. Endocrinol. Investig. 2006, 29, 581–593. [Google Scholar] [CrossRef] [PubMed]
- Tanner, J.M.; Whitehouse, R.H. Clinical Longitudinal Standards for Height, Weight, Height Velocity, Weight Velocity, and Stages of Puberty. Arch. Dis. Child. 1976, 51, 170–179. [Google Scholar] [CrossRef] [PubMed]
- Lohman, T.G.; Roche, A.F.; Martorell, R. Anthropometric Standardization Reference Manual; Human Kinetics Books: Champaign, IL, USA, 1988; ISBN 978-0-87322-121-4. [Google Scholar]
- World Health Organization. Waist Circumference and Waist-Hip Ratio: Report of a WHO Expert Consultation, Geneva, Switzerland, 8–11 December 2008; World Health Organization: Geneva, Switzerland, 2011; ISBN 978-92-4-150149-1. [Google Scholar]
- Bedogni, G.; Miglioli, L.; Masutti, F.; Tiribelli, C.; Marchesini, G.; Bellentani, S. Prevalence of and Risk Factors for Nonalcoholic Fatty Liver Disease: The Dionysos Nutrition and Liver Study. Hepatology 2005, 42, 44–52. [Google Scholar] [CrossRef]
- Alberti, K.G.M.M.; Eckel, R.H.; Grundy, S.M.; Zimmet, P.Z.; Cleeman, J.I.; Donato, K.A.; Fruchart, J.-C.; James, W.P.T.; Loria, C.M.; Smith, S.C.; et al. Harmonizing the Metabolic Syndrome: A Joint Interim Statement of the International Diabetes Federation Task Force on Epidemiology and Prevention; National Heart, Lung, and Blood Institute; American Heart Association; World Heart Federation; International Atherosclerosis Society; and International Association for the Study of Obesity. Circulation 2009, 120, 1640–1645. [Google Scholar] [CrossRef]
- Wallace, T.M.; Levy, J.C.; Matthews, D.R. Use and Abuse of HOMA Modeling. Diabetes Care 2004, 27, 1487–1495. [Google Scholar] [CrossRef] [PubMed]
- Saverymuttu, S.H.; Joseph, A.E.; Maxwell, J.D. Ultrasound Scanning in the Detection of Hepatic Fibrosis and Steatosis. Br. Med. J. Clin. Res. Ed. 1986, 292, 13–15. [Google Scholar] [CrossRef]
- Sartorio, A.; Del Col, A.; Agosti, F.; Mazzilli, G.; Bellentani, S.; Tiribelli, C.; Bedogni, G. Predictors of Non-Alcoholic Fatty Liver Disease in Obese Children. Eur. J. Clin. Nutr. 2007, 61, 877–883. [Google Scholar] [CrossRef]
- Kunutsor, S.K.; Kieneker, L.M.; Burgess, S.; Bakker, S.J.L.; Dullaart, R.P.F. Circulating Total Bilirubin and Future Risk of Hypertension in the General Population: The Prevention of Renal and Vascular End-Stage Disease (PREVEND) Prospective Study and a Mendelian Randomization Approach. J. Am. Heart Assoc. 2017, 6. [Google Scholar] [CrossRef] [PubMed]
- Zucker, S.D.; Horn, P.S.; Sherman, K.E. Serum Bilirubin Levels in the U.S. Population: Gender Effect and Inverse Correlation with Colorectal Cancer. Hepatology 2004, 40, 827–835. [Google Scholar] [CrossRef]
- Li, Y.Q.; Prentice, D.A.; Howard, M.L.; Mashford, M.L.; Desmond, P.V. The Effect of Hormones on the Expression of Five Isoforms of UDP-Glucuronosyltransferase in Primary Cultures of Rat Hepatocytes. Pharm. Res. 1999, 16, 191–197. [Google Scholar] [CrossRef]
- Muraca, M.; Fevery, J. Influence of Sex and Sex Steroids on Bilirubin Uridine Diphosphate-Glucuronosyltransferase Activity of Rat Liver. Gastroenterology 1984, 87, 308–313. [Google Scholar] [CrossRef]
- Guzek, M.; Jakubowski, Z.; Bandosz, P.; Wyrzykowski, B.; Smoczyński, M.; Jabloiska, A.; Zdrojewski, T. Inverse Association of Serum Bilirubin with Metabolic Syndrome and Insulin Resistance in Polish Population. Przegl. Epidemiol. 2012, 66, 495–501. [Google Scholar] [PubMed]
- Zhang, F.; Guan, W.; Fu, Z.; Zhou, L.; Guo, W.; Ma, Y.; Gong, Y.; Jiang, W.; Liang, H.; Zhou, H. Relationship between Serum Indirect Bilirubin Level and Insulin Sensitivity: Results from Two Independent Cohorts of Obese Patients with Impaired Glucose Regulation and Type 2 Diabetes Mellitus in China. Int. J. Endocrinol. 2020, 2020, 5681296. [Google Scholar] [CrossRef] [PubMed]
- Ridker Paul M Clinical Application of C-Reactive Protein for Cardiovascular Disease Detection and Prevention. Circulation 2003, 107, 363–369. [CrossRef]
- Hwang, H.-J.; Lee, S.-W.; Kim, S.-H. Relationship between Bilirubin and C-Reactive Protein. Clin. Chem. Lab. Med. 2011, 49, 1823–1828. [Google Scholar] [CrossRef]
- Ohnaka, K.; Kono, S.; Inoguchi, T.; Yin, G.; Morita, M.; Adachi, M.; Kawate, H.; Takayanagi, R. Inverse Associations of Serum Bilirubin with High Sensitivity C-Reactive Protein, Glycated Hemoglobin, and Prevalence of Type 2 Diabetes in Middle-Aged and Elderly Japanese Men and Women. Diabetes Res. Clin. Pract. 2010, 88, 103–110. [Google Scholar] [CrossRef]
- Yoshino, S.; Hamasaki, S.; Ishida, S.; Kataoka, T.; Yoshikawa, A.; Oketani, N.; Saihara, K.; Okui, H.; Shinsato, T.; Ichiki, H.; et al. Relationship between Bilirubin Concentration, Coronary Endothelial Function, and Inflammatory Stress in Overweight Patients. J. Atheroscler. Thromb. 2011, 18, 403–412. [Google Scholar] [CrossRef]
- Yu, K.; Kim, C.; Sung, E.; Shin, H.; Lee, H. Association of Serum Total Bilirubin with Serum High Sensitivity C-Reactive Protein in Middle-Aged Men. Korean J. Fam. Med. 2011, 32, 327–333. [Google Scholar] [CrossRef] [PubMed]
- Wallner, M.; Marculescu, R.; Doberer, D.; Wolzt, M.; Wagner, O.; Vitek, L.; Bulmer, A.C.; Wagner, K.-H. Protection from Age-Related Increase in Lipid Biomarkers and Inflammation Contributes to Cardiovascular Protection in Gilbert’s Syndrome. Clin. Sci. 2013, 125, 257–264. [Google Scholar] [CrossRef] [PubMed]
- Tapan, S.; Karadurmus, N.; Dogru, T.; Ercin, C.N.; Tasci, I.; Bilgi, C.; Kurt, I.; Erbil, M.K. Decreased Small Dense LDL Levels in Gilbert’s Syndrome. Clin. Biochem. 2011, 44, 300–303. [Google Scholar] [CrossRef]
- Očadlík, I.; Hlinštáková, S.; Oravec, S. Relationship between Unconjugated Hyperbilirubinemia and Lipoprotein Spectrum. Neuro Endocrinol. Lett. 2011, 32, 360–364. [Google Scholar] [PubMed]
- Vítek, L.; Kráslová, I.; Muchová, L.; Novotný, L.; Yamaguchi, T. Urinary Excretion of Oxidative Metabolites of Bilirubin in Subjects with Gilbert Syndrome. J. Gastroenterol. Hepatol. 2007, 22, 841–845. [Google Scholar] [CrossRef]
- Bulmer, A.C.; Blanchfield, J.T.; Toth, I.; Fassett, R.G.; Coombes, J.S. Improved Resistance to Serum Oxidation in Gilbert’s Syndrome: A Mechanism for Cardiovascular Protection. Atherosclerosis 2008, 199, 390–396. [Google Scholar] [CrossRef]
- Nascimento, H.; Alves, A.I.; Coimbra, S.; Catarino, C.; Gomes, D.; Bronze-da-Rocha, E.; Costa, E.; Rocha-Pereira, P.; Aires, L.; Mota, J.; et al. Bilirubin Is Independently Associated with Oxidized LDL Levels in Young Obese Patients. Diabetol. Metab. Syndr. 2015, 7, 4. [Google Scholar] [CrossRef]
- Hao, H.; Guo, H.; Ma, R.-L.; Yan, Y.-Z.; Hu, Y.-H.; Ma, J.-L.; Zhang, X.-H.; Wang, X.-P.; Wang, K.; Mu, L.-T.; et al. Association of Total Bilirubin and Indirect Bilirubin Content with Metabolic Syndrome among Kazakhs in Xinjiang. BMC Endocr. Disord. 2020, 20, 110. [Google Scholar] [CrossRef]
- Choi, S.H.; Yun, K.E.; Choi, H.J. Relationships between Serum Total Bilirubin Levels and Metabolic Syndrome in Korean Adults. Nutr. Metab. Cardiovasc. Dis. 2013, 23, 31–37. [Google Scholar] [CrossRef]
- Browning, J.D.; Szczepaniak, L.S.; Dobbins, R.; Nuremberg, P.; Horton, J.D.; Cohen, J.C.; Grundy, S.M.; Hobbs, H.H. Prevalence of Hepatic Steatosis in an Urban Population in the United States: Impact of Ethnicity. Hepatology 2004, 40, 1387–1395. [Google Scholar] [CrossRef]
- Weston, S.R.; Leyden, W.; Murphy, R.; Bass, N.M.; Bell, B.P.; Manos, M.M.; Terrault, N.A. Racial and Ethnic Distribution of Nonalcoholic Fatty Liver in Persons with Newly Diagnosed Chronic Liver Disease. Hepatology 2005, 41, 372–379. [Google Scholar] [CrossRef] [PubMed]
- Lin, Y.-C.; Chang, P.-F.; Hu, F.-C.; Chang, M.-H.; Ni, Y.-H. Variants in the UGT1A1 Gene and the Risk of Pediatric Nonalcoholic Fatty Liver Disease. Pediatrics 2009, 124, e1221–e1227. [Google Scholar] [CrossRef] [PubMed]
- Bedogni, G.; Bellentani, S. Fatty Liver: How Frequent Is It and Why? Ann. Hepatol. 2004, 3, 63–65. [Google Scholar] [CrossRef]


| Total | |
|---|---|
| N = 1672 | |
| Sex | |
| F | 980 (58.6%) |
| M | 692 (41.4%) |
| Age (years) | 15 (13; 16) |
| Pubertal stage (Tanner) | |
| 1 | 194 (11.6%) |
| 2 | 144 (8.6%) |
| 3 | 213 (12.7%) |
| 4 | 373 (22.3%) |
| 5 | 748 (44.7%) |
| Weight (kg) | 96 (83; 112) |
| Weight (SDS) | 3.01 (2.47; 3.57) |
| Height (m) | 1.63 (1.56; 1.69) |
| Height (SDS) | 0.33 (−0.30; 1.04) |
| BMI (kg/m2) | 36 (32; 40) |
| BMI (SDS) | 2.92 (2.50; 3.32) |
| Waist circumference (cm) | 111 (101; 122) |
| Large waist circumference (IDF) | 1646 (98.4%) |
| Waist/height (dimensionless) | 0.68 (0.63; 0.74) |
| ALT (U/L) | 23 (16; 35) |
| AST (U/L) | 21 (17; 26) |
| GGT (U/L) | 16 (12; 22) |
| Alkaline phosphatase (U/L) | 164 (91; 263) |
| Total bilirubin (mg/dL) | 0.64 (0.49; 0.82) |
| Glucose (mg/dL) | 79 (74; 83) |
| Insulin (μU/mL) | 13 (9; 18) |
| HOMA-IR (dimensionless) | 2.4 (1.6; 3.5) |
| Cholesterol (mg/dL) | 162 (142; 182) |
| HDL-cholesterol (mg/dL) | 43 (37; 51) |
| Low HDL (IDF) | 681 (40.7%) |
| LDL-cholesterol (mg/dL) | 102 (85; 122) |
| Triglycerides (mg/dL) | 87 (66; 114) |
| High triglycerides (IDF) | 163 (9.7%) |
| CRP (mg/L) | 0.4 (0.2; 0.7) |
| Systolic blood pressure (mm hg) | 120 (120; 130) |
| Diastolic blood pressure (mm hg) | 80 (70; 80) |
| High blood pressure (IDF) | 687 (41.1%) |
| Fatty liver | 642 (38.4%) |
| Fatty liver degree | |
| None | 1030 (61.6%) |
| Light | 250 (15.0%) |
| Moderate | 300 (17.9%) |
| Severe | 92 (5.5%) |
| Metabolic syndrome (IDF) | 395 (23.6%) |
| Total Bilirubin (mg/dL) | Total Bilirubin (mg/dL) | |
|---|---|---|
| Age (years) | 0.02 *** | |
| [0.02,0.03] | ||
| F | 0.00 | 0.00 |
| [0.00,0.00] | [0.00,0.00] | |
| M | 0.07 *** | 0.09 *** |
| [0.04,0.10] | [0.06,0.13] | |
| Tanner stage 1 | 0.00 | |
| [0.00,0.00] | ||
| Tanner stage 2 | 0.06 | |
| [−0.01,0.14] | ||
| Tanner stage 3 | 0.12 *** | |
| [0.06,0.19] | ||
| Tanner stage 4 | 0.16 *** | |
| [0.10,0.22] | ||
| Tanner stage 5 | 0.19 *** | |
| [0.13,0.24] | ||
| Intercept | 0.33 *** | 0.54 *** |
| [0.23,0.43] | [0.49,0.59] | |
| N | 1672 | 1672 |
| R-squared | 0.038 | 0.037 |
| BMI | Waist/Height | Insulin (μU/mL) | HOMA-IR (Dimensionless) | LogeCRP (U/mL) | |
|---|---|---|---|---|---|
| Total bilirubin (mg/dL) | 0.00 | −0.01 * | −1.18 | −0.32 * | −0.47 *** |
| [−0.08,0.09] | [−0.02,−0.00] | [−2.40,0.03] | [−0.57,−0.07] | [−0.62,−0.32] | |
| Constant | 2.93 *** | 0.70 *** | 15.16 *** | 3.03 *** | −0.69 *** |
| [2.86,3.00] | [0.69,0.71] | [14.20,16.12] | [2.83,3.22] | [−0.80,−0.57] | |
| Observations | 1672 | 1672 | 1672 | 1672 | 1672 |
| Adjusted R-squared | 0.001 | 0.002 | 0.002 | 0.003 | 0.023 |
| Fatty Liver | Metabolic Syndrome (IDF) | Large Waist Circumference (IDF) | High Blood Pressure (IDF) | High Triglycerides (IDF) | High Glucose (IDF) | Low HDL (IDF) | |
|---|---|---|---|---|---|---|---|
| Total bilirubin (mg/dL) | −0.05 | 0.10 | −1.17 ** | 0.46 ** | −0.77 ** | 0.53 | −0.05 |
| [−0.34,0.25] | [−0.24,0.43] | [−1.96,−0.38] | [0.17,0.76] | [−1.35,−0.18] | [−1.02,2.09] | [−0.35,0.24] | |
| Intercept | −0.44 *** | −1.24 *** | 5.08 *** | −0.69 *** | −1.70 *** | −5.51 *** | −0.34 ** |
| [−0.67,−0.21] | [−1.51,−0.98] | [4.27,5.89] | [−0.93,−0.46] | [−2.12,−1.28] | [−6.88,−4.14] | [−0.57,−0.11] | |
| N | 1672 | 1672 | 1672 | 1672 | 1672 | 1672 | 1672 |
Publisher’s Note: MDPI stays neutral with regard to jurisdictional claims in published maps and institutional affiliations. |
© 2021 by the authors. Licensee MDPI, Basel, Switzerland. This article is an open access article distributed under the terms and conditions of the Creative Commons Attribution (CC BY) license (https://creativecommons.org/licenses/by/4.0/).
Share and Cite
Bellarosa, C.; Bedogni, G.; Bianco, A.; Cicolini, S.; Caroli, D.; Tiribelli, C.; Sartorio, A. Association of Serum Bilirubin Level with Metabolic Syndrome and Non-Alcoholic Fatty Liver Disease: A Cross-Sectional Study of 1672 Obese Children. J. Clin. Med. 2021, 10, 2812. https://doi.org/10.3390/jcm10132812
Bellarosa C, Bedogni G, Bianco A, Cicolini S, Caroli D, Tiribelli C, Sartorio A. Association of Serum Bilirubin Level with Metabolic Syndrome and Non-Alcoholic Fatty Liver Disease: A Cross-Sectional Study of 1672 Obese Children. Journal of Clinical Medicine. 2021; 10(13):2812. https://doi.org/10.3390/jcm10132812
Chicago/Turabian StyleBellarosa, Cristina, Giorgio Bedogni, Annalisa Bianco, Sabrina Cicolini, Diana Caroli, Claudio Tiribelli, and Alessandro Sartorio. 2021. "Association of Serum Bilirubin Level with Metabolic Syndrome and Non-Alcoholic Fatty Liver Disease: A Cross-Sectional Study of 1672 Obese Children" Journal of Clinical Medicine 10, no. 13: 2812. https://doi.org/10.3390/jcm10132812
APA StyleBellarosa, C., Bedogni, G., Bianco, A., Cicolini, S., Caroli, D., Tiribelli, C., & Sartorio, A. (2021). Association of Serum Bilirubin Level with Metabolic Syndrome and Non-Alcoholic Fatty Liver Disease: A Cross-Sectional Study of 1672 Obese Children. Journal of Clinical Medicine, 10(13), 2812. https://doi.org/10.3390/jcm10132812