
Effect of Intermittent Theta Burst Stimulation on the Neural Processing of Emotional Stimuli in Healthy Volunteers

 , and
, and
Abstract
1. Introduction
2. Materials and Methods
2.1. Participants
2.2. Study Design
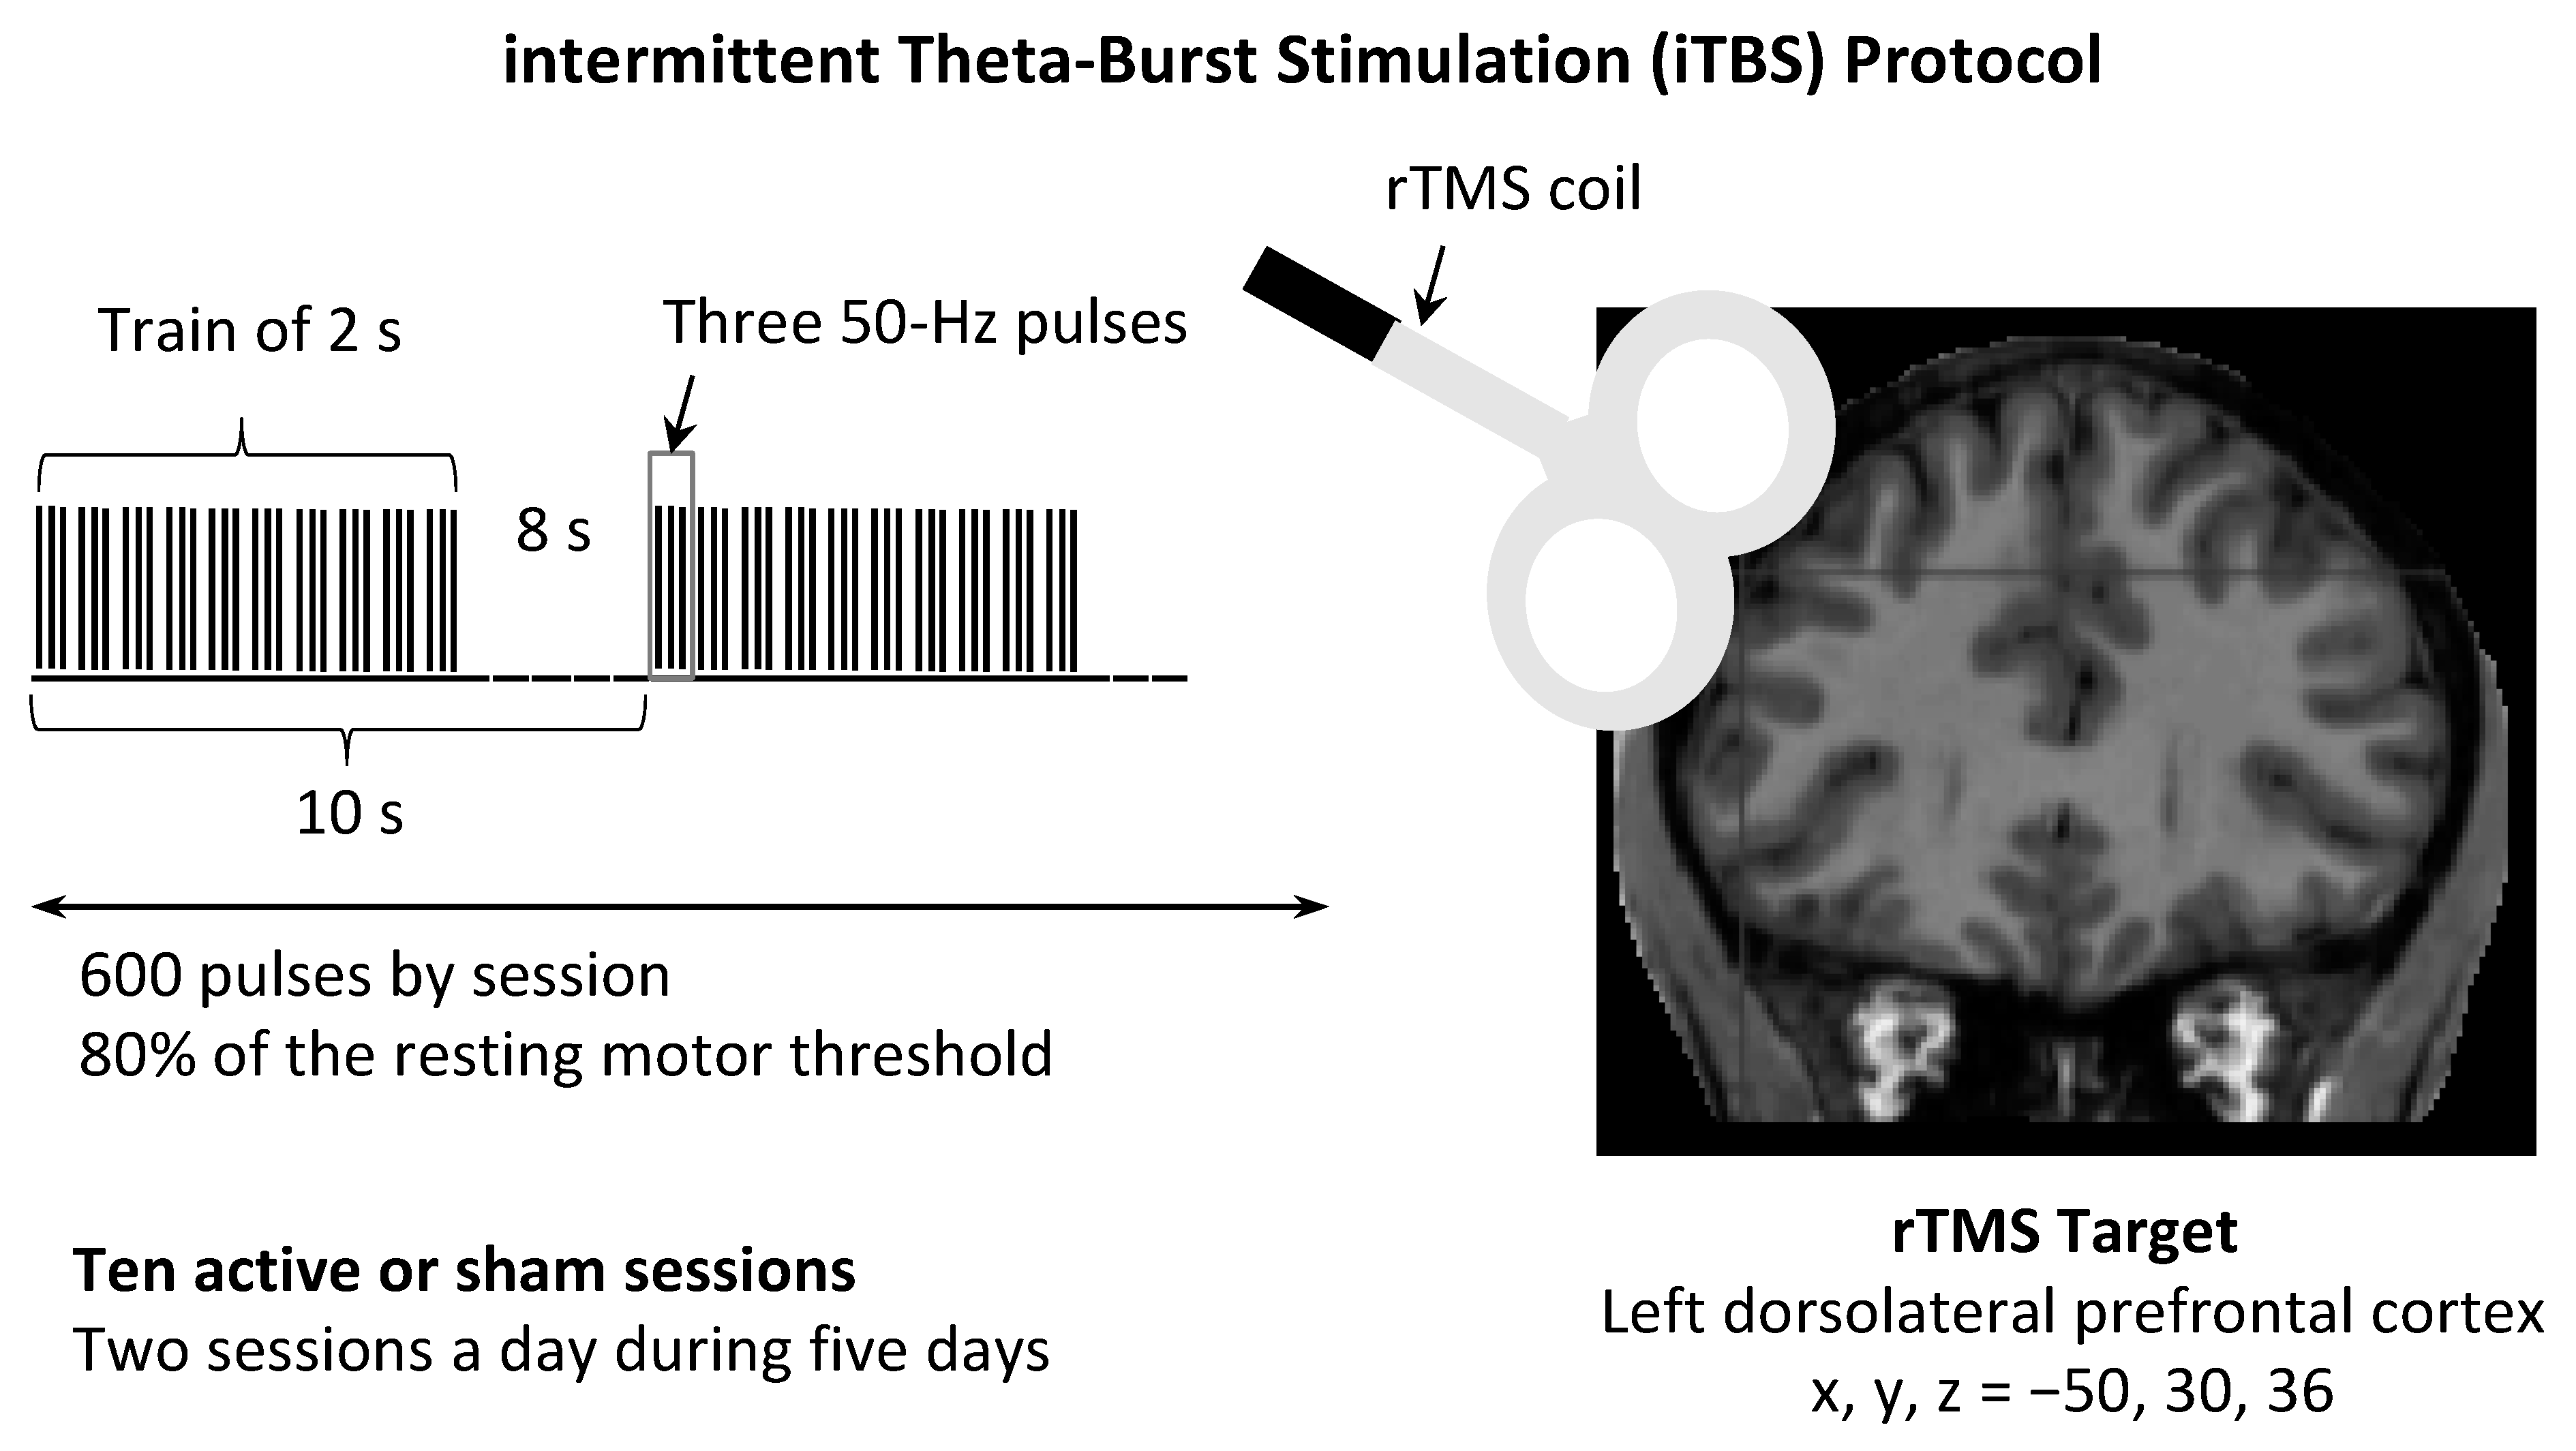
2.3. rTMS
2.4. Clinical Assessment
2.5. MRI Data Acquisition
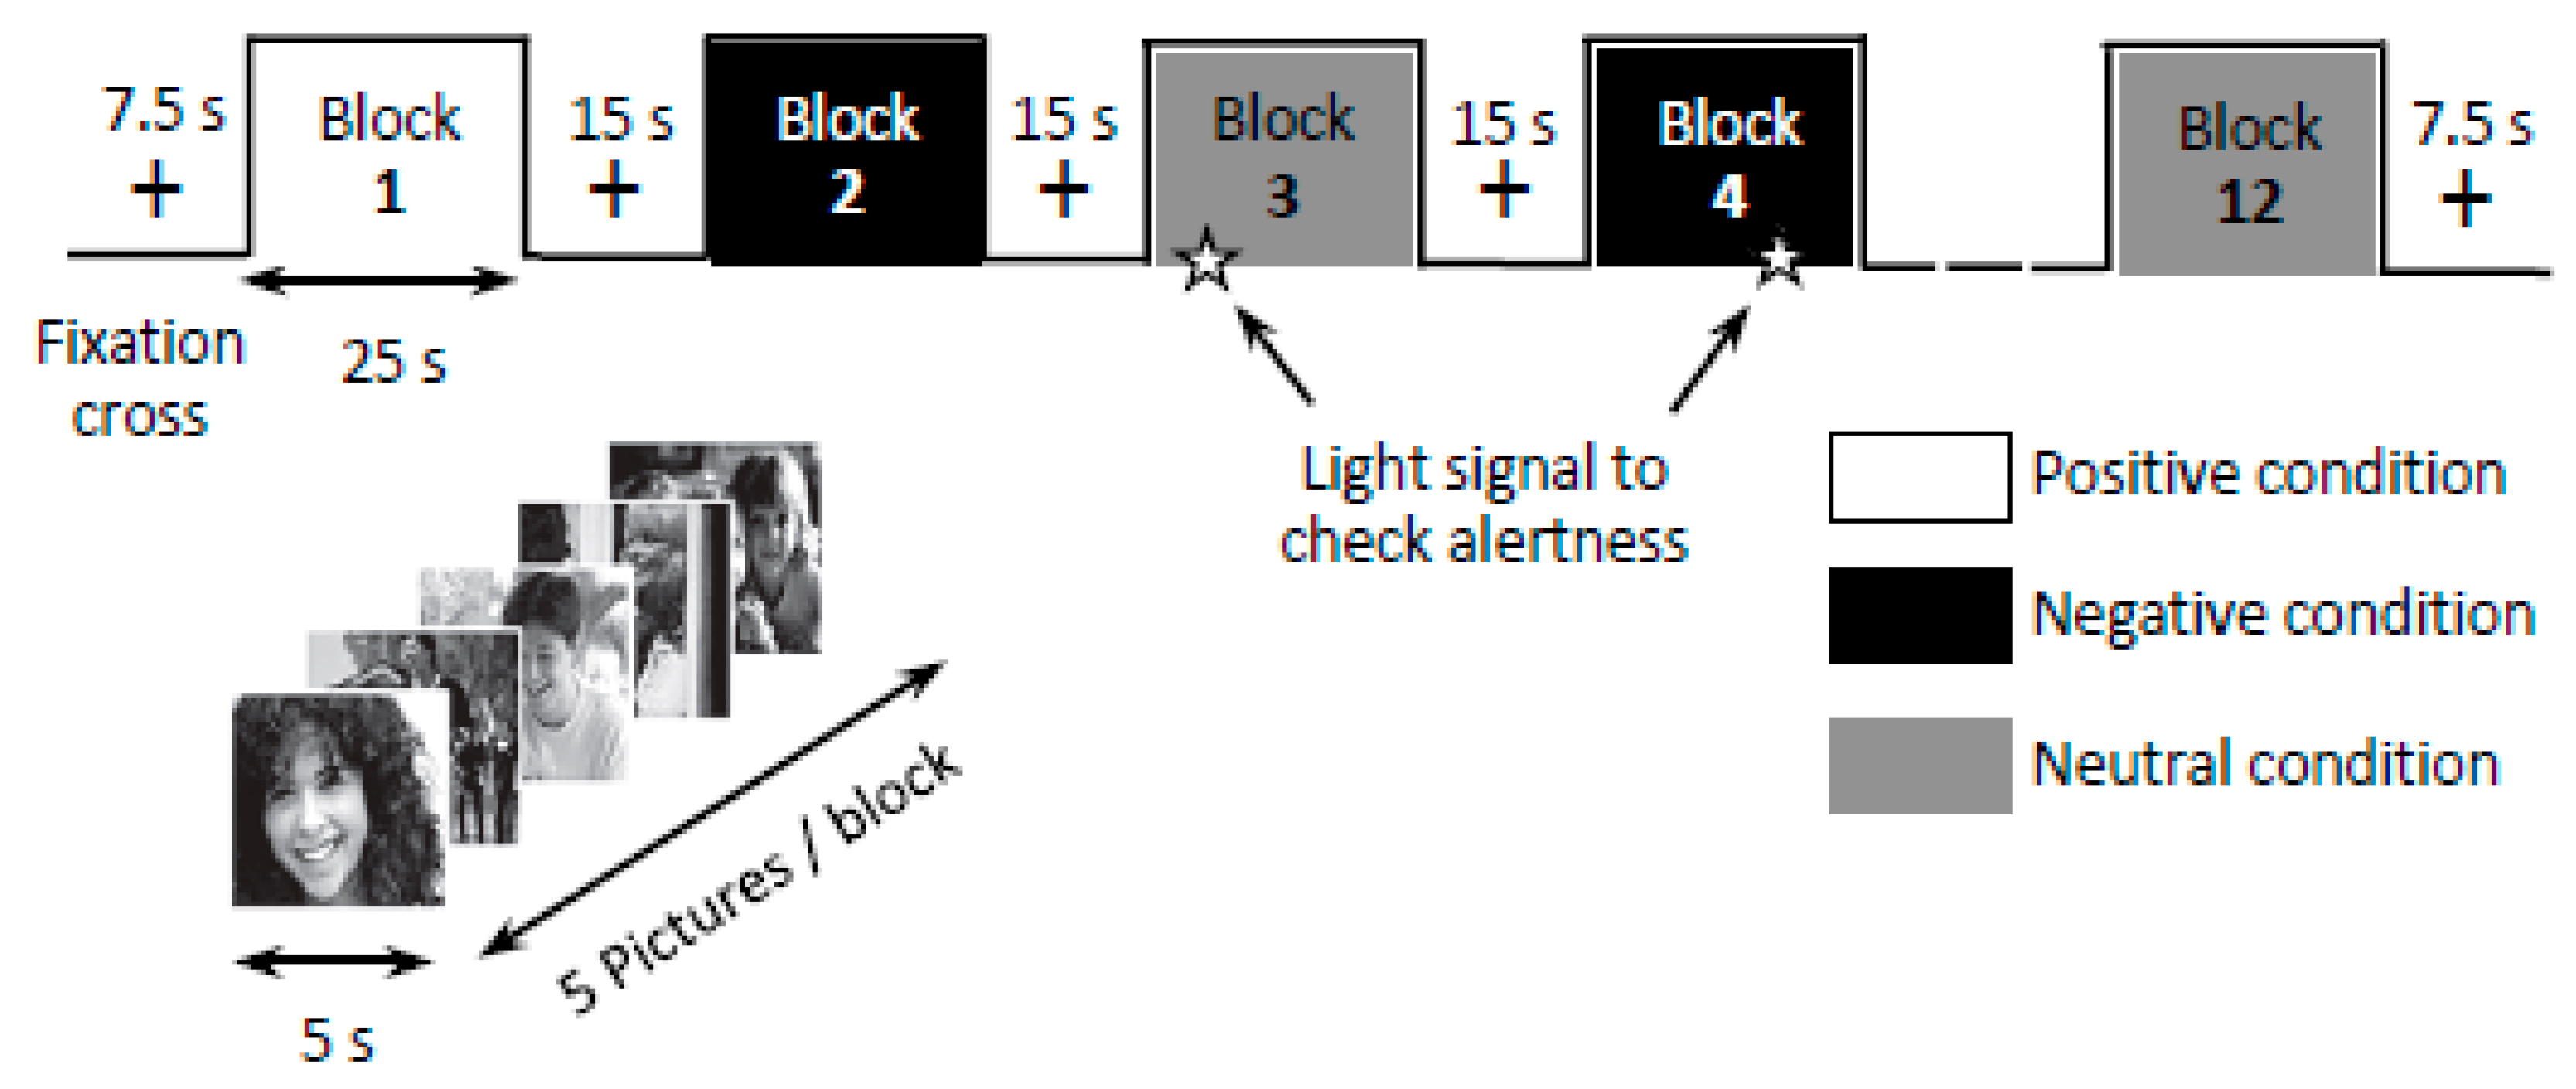
2.6. Experimental Task
2.7. Voxel-Based Morphometry (VBM)
2.8. Cortical Thickness
2.9. Functional MRI Data Preprocessing and Analysis
2.10. Sample Size Determination
2.11. Statistical Analyses
3. Results
3.1. Sociodemographic Characteristics
3.2. Clinical Measures
3.2.1. Mood Scales
3.2.2. Norris’ Visual Analogue Scales
3.2.3. Long-term Follow-Up
3.3. Magnetic Resonance Imaging
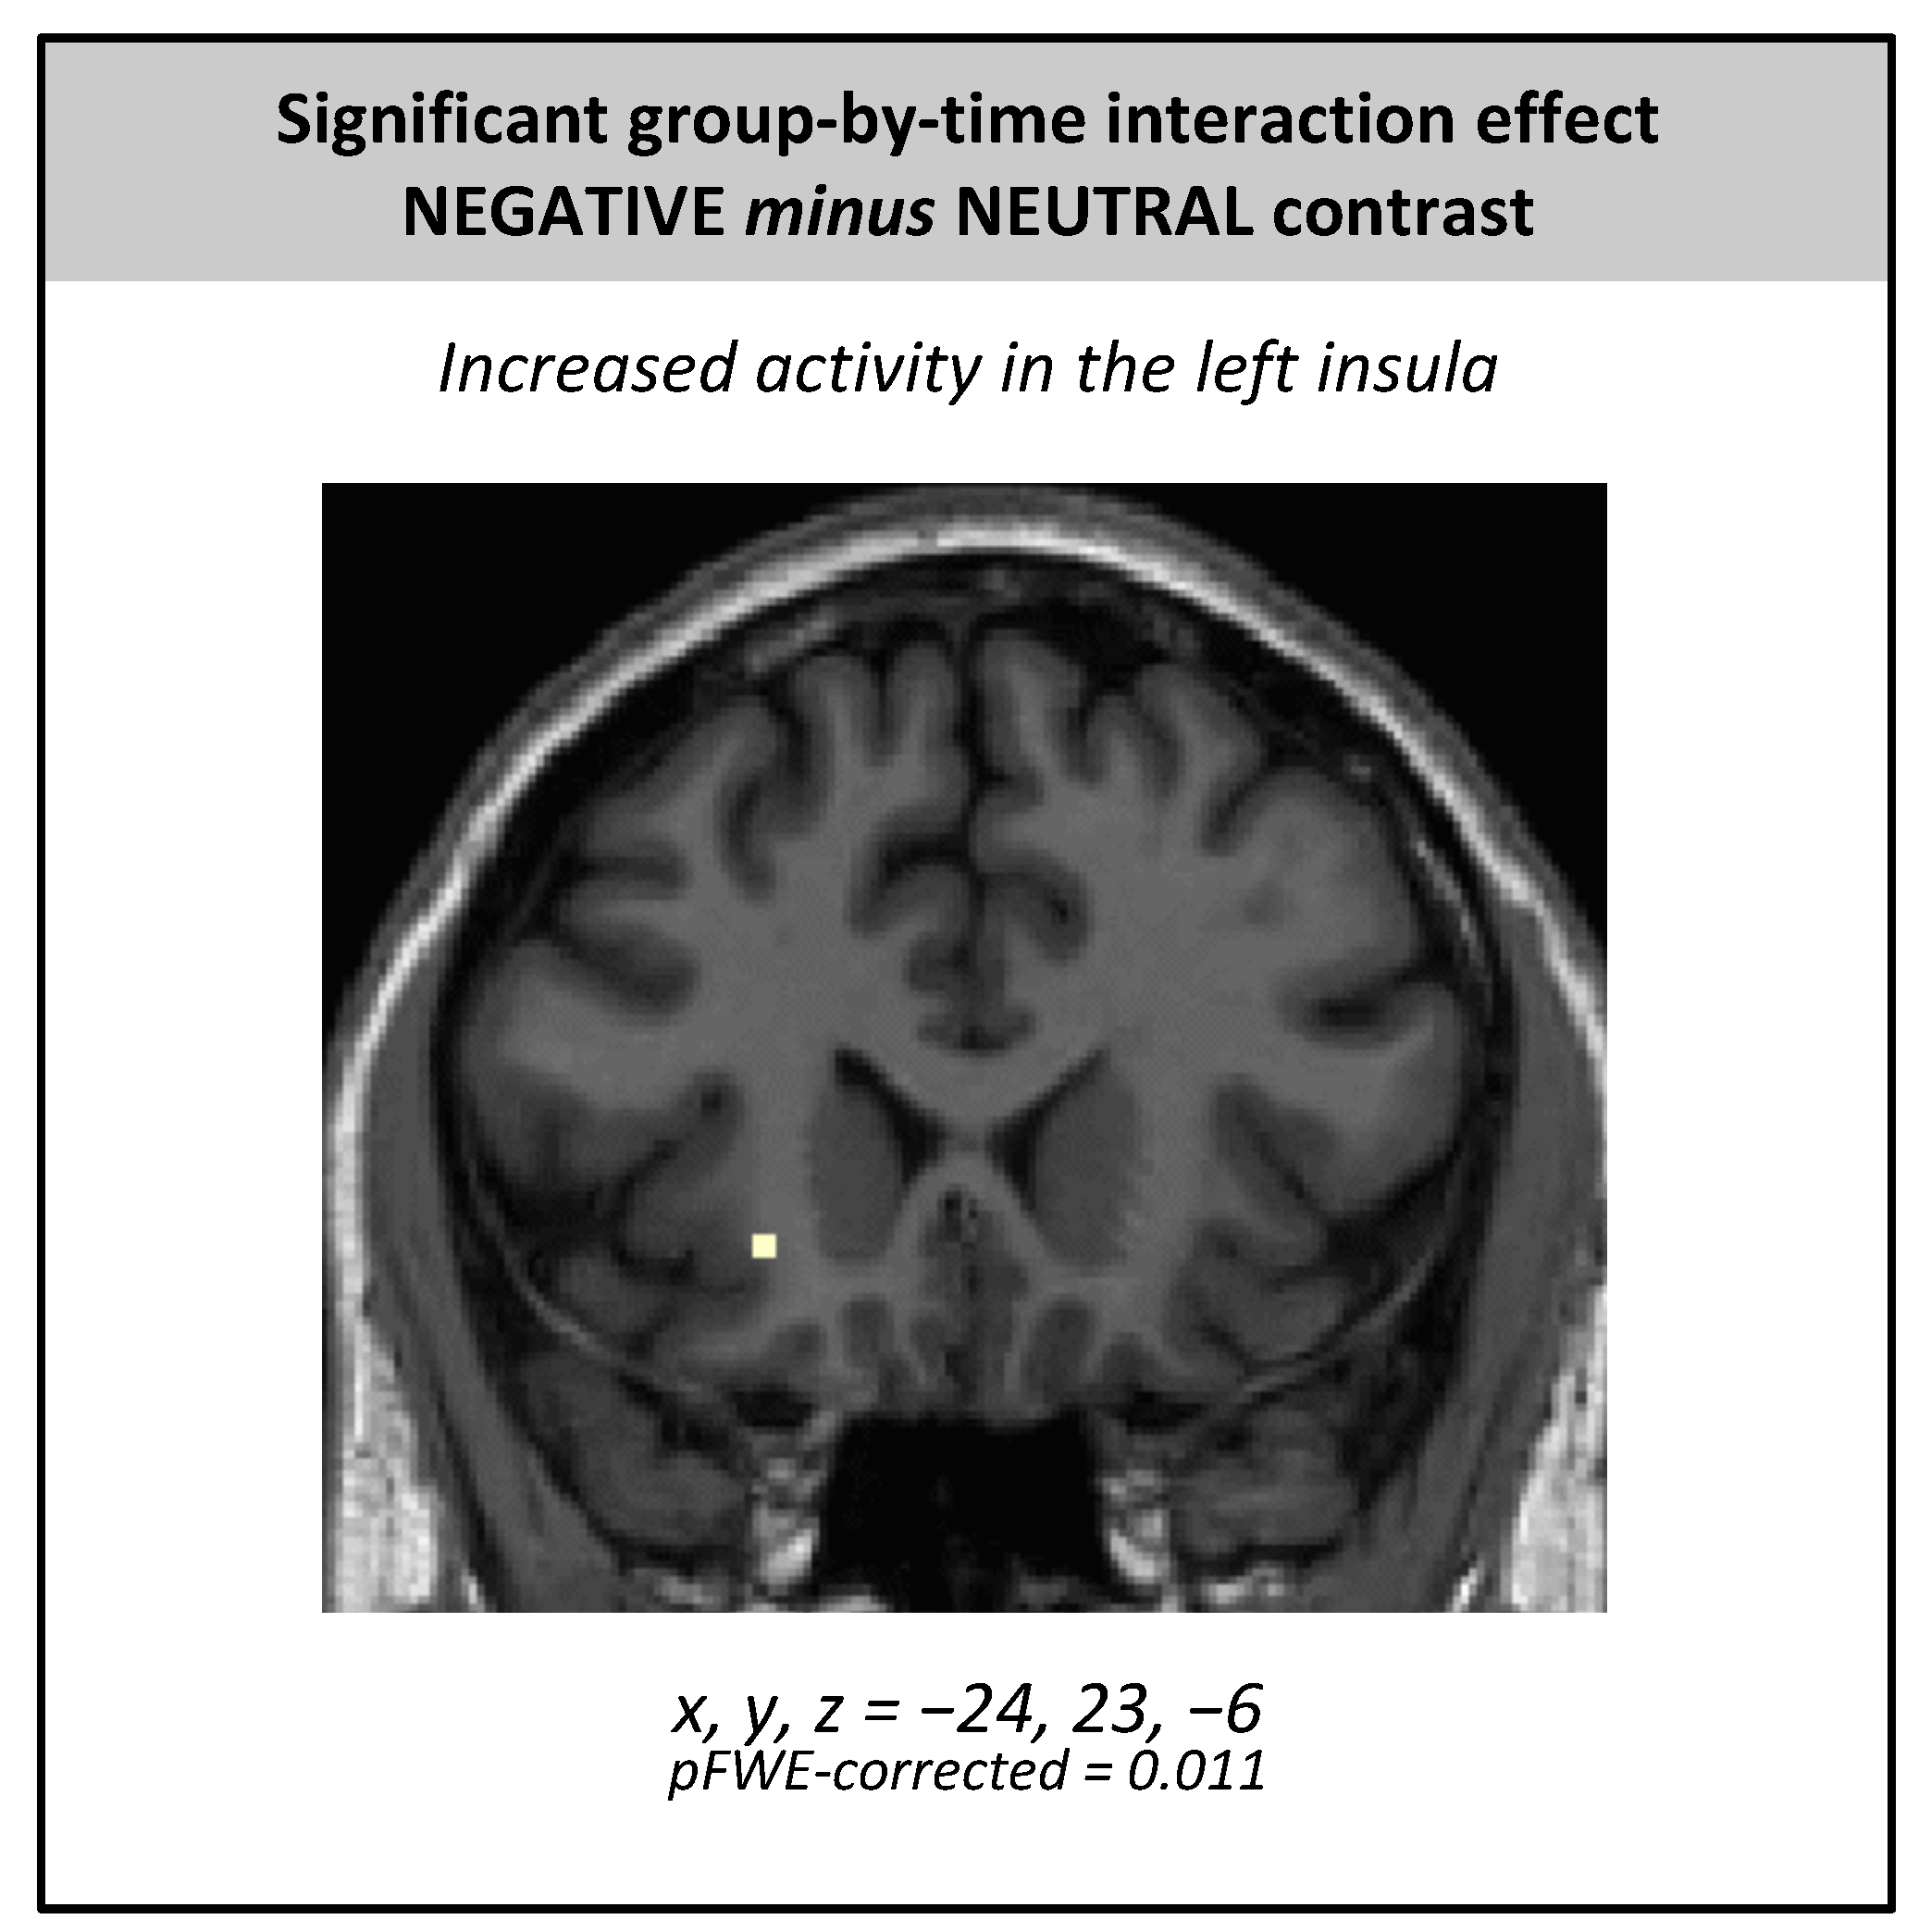
3.3.1. fMRI
3.3.2. Voxel-Based Morphometry
3.3.3. Cortical Thickness
3.4. Quality Control of the Experiment
3.5. Side Effects
4. Discussion
Limitations
5. Conclusions
Supplementary Materials
Author Contributions
Funding
Institutional Review Board Statement
Informed Consent Statement
Data Availability Statement
Acknowledgments
Conflicts of Interest
References
- Lefaucheur, J.-P. Transcranial magnetic stimulation. In Handbook of Clinical Neurology; Elsevier: Amsterdam, The Netherlands, 2019; Volume 160, pp. 559–580. ISBN 978-0-444-64032-1. [Google Scholar]
- Valero-Cabré, A.; Amengual, J.L.; Stengel, C.; Pascual-Leone, A.; Coubard, O.A. Transcranial magnetic stimulation in basic and clinical neuroscience: A Comprehensive Review of Fundamental Principles and Novel Insights. Neurosci. Biobehav. Rev. 2017, 83, 381–404. [Google Scholar] [CrossRef]
- Couturier, J.L. Efficacy of rapid-rate repetitive transcranial magnetic stimulation in the treatment of depression: A systematic review and meta-analysis. J. Psychiatry Neurosci. 2005, 30, 83–90. [Google Scholar]
- Huang, Y.-Z.; Edwards, M.J.; Rounis, E.; Bhatia, K.P.; Rothwell, J.C. Theta burst stimulation of the human motor cortex. Neuron 2005, 45, 201–206. [Google Scholar] [CrossRef]
- Di Lazzaro, V.; Dileone, M.; Pilato, F.; Capone, F.; Musumeci, G.; Ranieri, F.; Ricci, V.; Bria, P.; Di Iorio, R.; de Waure, C.; et al. Modulation of motor cortex neuronal networks by RTMS: Comparison of local and remote effects of six different protocols of stimulation. J. Neurophysiol. 2011, 105, 2150–2156. [Google Scholar] [CrossRef] [PubMed]
- Chung, S.W.; Hoy, K.E.; Fitzgerald, P.B. Theta-Burst stimulation: A new form of TMS treatment for depression? Depress. Anxiety 2015, 32, 182–192. [Google Scholar] [CrossRef] [PubMed]
- Barrett, J.; Della-Maggiore, V.; Chouinard, P.A.; Paus, T. Mechanisms of action underlying the effect of repetitive transcranial magnetic stimulation on mood: Behavioral and brain imaging studies. Neuropsychopharmacology 2004, 29, 1172–1189. [Google Scholar] [CrossRef] [PubMed]
- Dearing, J.; George, M.; Greenberg, B.; Wasserman, E.; Schlaepfer, T.; Murphy, D. Mood effects of prefrontal repetitive high frequency transcranial magnetic stimulation (RTMS) in healthy volunteers. CNS Spectr. 1997, 2, 53–68. [Google Scholar]
- George, M.S.; Wassermann, E.M.; Williams, W.A.; Steppel, J.; Pascual-Leone, A.; Basser, P.; Hallett, M.; Post, R.M. Changes in mood and hormone levels after rapid-rate transcranial magnetic stimulation (RTMS) of the prefrontal cortex. J. Neuropsychiatry Clin. Neurosci. 1996, 8, 172–180. [Google Scholar] [CrossRef]
- Padberg, F.; Juckel, G.; Präßl, A.; Zwanzger, P.; Mavrogiorgou, P.; Hegerl, U.; Hampel, H.; Möller, H.-J. Prefrontal cortex modulation of mood and emotionally induced facial expressions: A transcranial magnetic stimulation study. J. Neuropsychiatry Clin. Neurosci. 2001, 13, 206–212. [Google Scholar] [CrossRef] [PubMed]
- Pascual-Leone, A.; Catalá, M.D.; Pascual-Leone Pascual, A. Lateralized effect of rapid-rate transcranial magnetic stimulation of the prefrontal cortex on mood. Neurology 1996, 46, 499–502. [Google Scholar] [CrossRef]
- Baeken, C.; Leyman, L.; De Raedt, R.; Vanderhasselt, M.A.; D’haenen, H. Lack of impact of repetitive high frequency transcranial magnetic stimulation on mood in healthy female subjects. J. Affect. Disord. 2006, 90, 63–66. [Google Scholar] [CrossRef] [PubMed]
- Baeken, C.; Leyman, L.; De Raedt, R.; Vanderhasselt, M.A.; D’haenen, H. Left and right high frequency repetitive transcranial magnetic stimulation of the dorsolateral prefrontal cortex does not affect mood in female volunteers. Clin. Neurophysiol. 2008, 119, 568–575. [Google Scholar] [CrossRef] [PubMed]
- Baeken, C.; Vanderhasselt, M.A.; Remue, J.; Rossi, V.; Schiettecatte, J.; Anckaert, E.; De Raedt, R. One left dorsolateral prefrontal cortical HF-RTMS session attenuates HPA-system sensitivity to critical feedback in healthy females. Neuropsychologia 2014, 57, 112–121. [Google Scholar] [CrossRef] [PubMed]
- Baeken, C.; Vanderhasselt, M.A.; De Raedt, R. Baseline “state anxiety” influences HPA-axis sensitivity to one sham-controlled HF-RTMS session applied to the right dorsolateral prefrontal cortex. Psychoneuroendocrinology 2011, 36, 60–67. [Google Scholar] [CrossRef]
- Baeken, C.; Van Schuerbeek, P.; De Raedt, R.; De Mey, J.; Vanderhasselt, M.A.; Bossuyt, A.; Luypaert, R. The effect of one left-sided dorsolateral prefrontal sham-controlled HF-RTMS session on approach and withdrawal related emotional neuronal processes. Clin. Neurophysiol. 2011, 122, 2217–2226. [Google Scholar] [CrossRef]
- Grisaru, N.; Bruno, R.; Pridmore, S. Effect on the emotions of healthy individuals of slow repetitive transcranial magnetic stimulation applied to the prefrontal cortex. J. ECT 2001, 17, 184–189. [Google Scholar] [CrossRef]
- Habel, U.; Wild, B.; Topka, H.; Kircher, T.; Salloum, J.B.; Schneider, F. Transcranial magnetic stimulation: No effect on mood with single pulse during learned helplessness. Prog. Neuro Psychopharmacol. Biol. Psychiatry 2001, 25, 497–506. [Google Scholar] [CrossRef]
- Hoy, K.E.; Enticott, P.G.; Daskalakis, Z.J.; Fitzgerald, P.B. Can a behavioral intervention enhance the effect of repetitive transcranial magnetic stimulation on mood? Brain Stimul. 2010, 3, 200–206. [Google Scholar] [CrossRef]
- Remue, J.; Baeken, C.; De Raedt, R. Does a single neurostimulation session really affect mood in healthy individuals? A systematic review. Neuropsychologia 2016, 85, 184–198. [Google Scholar] [CrossRef]
- Schaller, G.; Lenz, B.; Friedrich, K.; Dygon, D.; Richter-Schmidinger, T.; Jacobi, A.; Mueller, S.E.; Maihöfner, C.; Sperling, W.; Kornhuber, J. Repetitive transcranial magnetic stimulation influences mood in healthy male volunteers. J. Psychiatr. Res. 2011, 45, 1178–1183. [Google Scholar] [CrossRef]
- Gaudeau-Bosma, C.; Moulier, V.; Allard, A.-C.; Sidhoumi, D.; Bouaziz, N.; Braha, S.; Volle, E.; Januel, D. Effect of two weeks of RTMS on brain activity in healthy subjects during an N-back task: A randomized double blind study. Brain Stimul. 2013, 6, 569–575. [Google Scholar] [CrossRef]
- Pulopulos, M.M.; De Witte, S.; Vanderhasselt, M.-A.; De Raedt, R.; Schiettecatte, J.; Anckaert, E.; Salvador, A.; Baeken, C. The influence of personality on the effect of itbs after being stressed on cortisol secretion. PLoS ONE 2019, 14, e0223927. [Google Scholar] [CrossRef]
- Mondino, M.; Thiffault, F.; Fecteau, S. Does non-invasive brain stimulation applied over the dorsolateral prefrontal cortex non-specifically influence mood and emotional processing in healthy individuals? Front. Cell. Neurosci. 2015, 9, 399. [Google Scholar] [CrossRef]
- Leyman, L.; De Raedt, R.; Vanderhasselt, M.-A.; Baeken, C. Influence of high-frequency repetitive transcranial magnetic stimulation over the dorsolateral prefrontal cortex on the inhibition of emotional information in healthy volunteers. Psychol. Med. 2009, 39, 1019–1028. [Google Scholar] [CrossRef] [PubMed]
- Moulier, V.; Gaudeau-Bosma, C.; Isaac, C.; Allard, A.-C.; Bouaziz, N.; Sidhoumi, D.; Braha-Zeitoun, S.; Benadhira, R.; Thomas, F.; Januel, D. Effect of repetitive transcranial magnetic stimulation on mood in healthy subjects. Socioaffect. Neurosci. Psychol. 2016, 6, 29672. [Google Scholar] [CrossRef]
- Balconi, M.; Cobelli, C. RTMS on left prefrontal cortex contributes to memories for positive emotional cues: A comparison between pictures and words. Neuroscience 2015, 287, 93–103. [Google Scholar] [CrossRef] [PubMed]
- De Raedt, R.; Leyman, L.; Baeken, C.; Van Schuerbeek, P.; Luypaert, R.; Vanderhasselt, M.-A.; Dannlowski, U. Neurocognitive effects of HF-RTMS over the dorsolateral prefrontal cortex on the attentional processing of emotional information in healthy women: An event-related FMRI study. Biol. Psychol. 2010, 85, 487–495. [Google Scholar] [CrossRef] [PubMed]
- Cao, D.; Li, Y.; Niznikiewicz, M.A.; Tang, Y.; Wang, J. The theta burst transcranial magnetic stimulation over the right PFC affects electroencephalogram oscillation during emotional processing. Prog. Neuropsychopharmacol. Biol. Psychiatry 2018, 82, 21–30. [Google Scholar] [CrossRef] [PubMed]
- Coan, J.A.; Allen, J.J. Frontal EEG asymmetry as a moderator and mediator of emotion. Biol. Psychol. 2004, 67, 7–49. [Google Scholar] [CrossRef]
- De Wandel, L.; Pulopulos, M.M.; Labanauskas, V.; de Witte, S.; Vanderhasselt, M.A.; Baeken, C. Individual resting-state frotocingular functional connectivity predicts the intermittent theta burst stimulation response to stress in healthy female volunteers. Hum. Brain Mapp. 2020, 41, 5301–5312. [Google Scholar] [CrossRef]
- De Witte, S.; Baeken, C.; Pulopulos, M.M.; Josephy, H.; Schiettecatte, J.; Anckaert, E.; De Raedt, R.; Vanderhasselt, M.A. The effect of neurostimulation applied to the left dorsolateral prefrontal cortex on post-stress adaptation as a function of depressive brooding. Prog. Neuropsychopharmacol. Biol. Psychiatry 2020, 96, 109687. [Google Scholar] [CrossRef]
- Dumitru, A.; Rocchi, L.; Saini, F.; Rothwell, J.C.; Roiser, J.P.; David, A.S.; Richieri, R.M.; Lewis, G.; Lewis, G. Influence of theta-burst transcranial magnetic stimulation over the dorsolateral prefrontal cortex on emotion processing in healthy volunteers. Cogn. Affect. Behav. Neurosci. 2020, 20, 1278–1293. [Google Scholar] [CrossRef]
- Singh, A.; Erwin-Grabner, T.; Sutcliffe, G.; Paulus, W.; Dechent, P.; Antal, A.; Goya-Maldonado, R. Default mode network alterations after intermittent theta burst stimulation in healthy subjects. Transl. Psychiatry 2020, 10, 75. [Google Scholar] [CrossRef]
- Harmer, C.J.; O’Sullivan, U.; Favaron, E.; Massey-Chase, R.; Ayres, R.; Reinecke, A.; Goodwin, G.M.; Cowen, P.J. Effect of acute antidepressant administration on negative affective bias in depressed patients. Am. J. Psychiatry 2009, 166, 1178–1184. [Google Scholar] [CrossRef] [PubMed]
- Beck, A.T.; Ward, C.H.; Mendelson, M.; Mock, J.; Erbaugh, J. An inventory for measuring depression. Arch. Gen. Psychiatry 1961, 4, 561–571. [Google Scholar] [CrossRef]
- Hamilton, M.A. Rating scale for depression. J. Neurol. Neurosurg. Psychiatry 1960, 23, 56–62. [Google Scholar] [CrossRef] [PubMed]
- Oldfield, R.C. The assessment and analysis of handedness: The Edinburgh inventory. Neuropsychologia 1971, 9, 97–113. [Google Scholar] [CrossRef]
- Laplanche, A.; Com-Nougué, C.; Flamant, R. Méthodes Statistiques Appliquées à la Recherche Clinique; Médecine-Sciences Flammarion: Paris, France, 1993. [Google Scholar]
- Rossi, S.; Ferro, M.; Cincotta, M.; Ulivelli, M.; Bartalini, S.; Miniussi, C.; Giovannelli, F.; Passero, S. A real electro-magnetic placebo (REMP) device for sham transcranial magnetic stimulation (TMS). Clin. Neurophysiol. 2007, 118, 709–716. [Google Scholar] [CrossRef] [PubMed]
- Rusjan, P.M.; Barr, M.S.; Farzan, F.; Arenovich, T.; Maller, J.J.; Fitzgerald, P.B.; Daskalakis, Z.J. Optimal transcranial magnetic stimulation coil placement for targeting the dorsolateral prefrontal cortex using novel magnetic resonance image-guided neuronavigation. Hum. Brain Mapp. 2010, 31, 1643–1652. [Google Scholar] [CrossRef] [PubMed]
- Blumberger, D.M.; Vila-Rodriguez, F.; Thorpe, K.E.; Feffer, K.; Noda, Y.; Giacobbe, P.; Knyahnytska, Y.; Kennedy, S.H.; Lam, R.W.; Daskalakis, Z.J.; et al. Effectiveness of theta burst versus high-frequency repetitive transcranial magnetic stimulation in patients with depression (THREE-D): A randomised non-inferiority trial. Lancet 2018, 391, 1683–1692. [Google Scholar] [CrossRef]
- Rossini, P.M.; Burke, D.; Chen, R.; Cohen, L.G.; Daskalakis, Z.; Di Iorio, R.; Di Lazzaro, V.; Ferreri, F.; Fitzgerald, P.B.; George, M.S.; et al. Non-Invasive electrical and magnetic stimulation of the brain, spinal cord, roots and peripheral nerves: Basic principles and procedures for routine clinical and research application. An updated report from an I.F.C.N. Committee. Clin. Neurophysiol. 2015, 126, 1071–1107. [Google Scholar] [CrossRef] [PubMed]
- Bunse, T.; Wobrock, T.; Strube, W.; Padberg, F.; Palm, U.; Falkai, P.; Hasan, A. Motor cortical excitability assessed by transcranial magnetic stimulation in psychiatric disorders: A systematic review. Brain Stimul. 2014, 7, 158–169. [Google Scholar] [CrossRef] [PubMed]
- Zigmond, A.S.; Snaith, R.P. The hospital anxiety and depression scale. Acta Psychiatr. Scand. 1983, 67, 361–370. [Google Scholar] [CrossRef]
- Bech, P.; Bolwig, T.G.; Kramp, P.; Rafaelsen, O.J. The Bech-Rafaelsen mania scale and the Hamilton depression scale: Evaluation of homogeneity and inter-observer reliability. Acta Psychiatr. Scand. 1979, 59, 420–430. [Google Scholar] [CrossRef]
- Guelfi, J.; Caille, P. The Norris VAS and the ADA inventory: A factor analysis in outpatients. In Proceedings of the VIII World Congress of Psychiatry, Athens, Greece, 12–19 October 1989; Volume 899, p. 484. [Google Scholar]
- Norris, H. The action of sedatives on brain stem oculomotor systems in man. Neuropharmacology 1971, 10, 181–191. [Google Scholar] [CrossRef]
- Lang, P.; Bradley, M.; Cuthbert, B. International Affective Picture System (IAPS): Affective Ratings of Pictures and Instruction Manual; University of Florida: Gainesville, FL, USA, 2008. [Google Scholar]
- Fischl, B.; Dale, A.M. Measuring the thickness of the human cerebral cortex from magnetic resonance images. Proc. Natl. Acad. Sci. USA 2000, 97, 11050–11055. [Google Scholar] [CrossRef] [PubMed]
- Desikan, R.S.; Ségonne, F.; Fischl, B.; Quinn, B.T.; Dickerson, B.C.; Blacker, D.; Buckner, R.L.; Dale, A.M.; Maguire, R.P.; Hyman, B.T.; et al. An automated labeling system for subdividing the human cerebral cortex on MRI scans into gyral based regions of interest. Neuroimage 2006, 31, 968–980. [Google Scholar] [CrossRef]
- Friston, K.J.; Holmes, A.P.; Worsley, K.J.; Poline, J.B.; Frith, C.D.; Frackowiak, R.S.J. Statistical parametric maps in functional imaging: A general linear approach. Hum. Brain Mapp. 1995, 2, 189–210. [Google Scholar] [CrossRef]
- Brett, M.; Anton, J.; Valabregue, R.; Poline, J. Region of interest analysis using an SPM toolbox. In Proceedings of the 8th International Conference on Functional Mapping of the Human Brain, Sendai, Japan, 2–6 June 2002. [Google Scholar]
- Fritz, C.O.; Morris, P.E.; Richler, J.J. Effect size estimates: Current use, calculations, and interpretation. J. Exp. Psychol. Gen. 2012, 141, 2–18. [Google Scholar] [CrossRef]
- Menon, V. Salience network. In Brain Mapping: An Encyclopedic Reference; Academic Press Elsevier: Amsterdam, The Netherlands, 2015; Volume 2, pp. 597–611. [Google Scholar]
- Critchley, H.D.; Eccles, J.; Garfinkel, S.N. Interaction between cognition, emotion, and the autonomic nervous system. In Handbook of Clinical Neurology; Elsevier: Amsterdam, The Netherlands, 2013; Volume 117, pp. 59–77. ISBN 978-0-444-53491-0. [Google Scholar]
- Sterzer, P.; Kleinschmidt, A. Anterior insula activations in perceptual paradigms: Often observed but barely understood. Brain Struct. Funct. 2010, 214, 611–622. [Google Scholar] [CrossRef]
- Diener, C.; Kuehner, C.; Brusniak, W.; Ubl, B.; Wessa, M.; Flor, H. A Meta-Analysis of neurofunctional imaging studies of emotion and cognition in major depression. Neuroimage 2012, 61, 677–685. [Google Scholar] [CrossRef]
- Fitzgerald, P.B.; Laird, A.R.; Maller, J.; Daskalakis, Z.J. A meta-analytic study of changes in brain activation in depression. Hum. Brain Mapp. 2008, 29, 683–695. [Google Scholar] [CrossRef]
- Graham, J.; Salimi-Khorshidi, G.; Hagan, C.; Walsh, N.; Goodyer, I.; Lennox, B.; Suckling, J. Meta-Analytic evidence for neuroimaging models of depression: State or trait? J. Affect. Disord. 2013, 151, 423–431. [Google Scholar] [CrossRef] [PubMed]
- Hamilton, J.P.; Etkin, A.; Furman, D.J.; Lemus, M.G.; Johnson, R.F.; Gotlib, I.H. Functional neuroimaging of major depressive disorder: A meta-analysis and new integration of base line activation and neural response data. Am. J. Psychiatry 2012, 169, 693–703. [Google Scholar] [CrossRef]
- Janiri, D.; Moser, D.A.; Doucet, G.E.; Luber, M.J.; Rasgon, A.; Lee, W.H.; Murrough, J.W.; Sani, G.; Eickhoff, S.B.; Frangou, S. Shared neural phenotypes for mood and anxiety disorders: A meta-analysis of 226 task-related functional imaging studies. JAMA Psychiatry 2020, 77, 172. [Google Scholar] [CrossRef]
- Ma, Y. Neuropsychological mechanism underlying antidepressant effect: A systematic meta-analysis. Mol. Psychiatry 2015, 20, 311–319. [Google Scholar] [CrossRef] [PubMed]
- Nahas, Z.; Teneback, C.C.; Kozel, A.; Speer, A.M.; DeBrux, C.; Molloy, M.; Stallings, L.; Spicer, K.M.; Arana, G.; Bohning, D.E.; et al. Brain effects of TMS delivered over prefrontal cortex in depressed adults: Role of stimulation frequency and coil–cortex distance. J. Neuropsychiatry Clin. Neurosci 2001, 13, 459–470. [Google Scholar] [CrossRef] [PubMed]
- Speer, A.M.; Kimbrell, T.A.; Wassermann, E.M.; Repella, J.D.; Willis, M.W.; Herscovitch, P.; Post, R.M. Opposite effects of high and low frequency RTMS on regional brain activity in depressed patients. Biol. Psychiatry 2000, 48, 1133–1141. [Google Scholar] [CrossRef]
- Salomons, T.V.; Dunlop, K.; Kennedy, S.H.; Flint, A.; Geraci, J.; Giacobbe, P.; Downar, J. Resting-State cortico-thalamic-striatal connectivity predicts response to dorsomedial prefrontal RTMS in major depressive disorder. Neuropsychopharmacology 2014, 39, 488–498. [Google Scholar] [CrossRef]
- Iwabuchi, S.J.; Raschke, F.; Auer, D.P.; Liddle, P.F.; Lankappa, S.T.; Palaniyappan, L. Targeted transcranial theta-burst stimulation alters fronto-insular network and prefrontal GABA. Neuroimage 2017, 146, 395–403. [Google Scholar] [CrossRef]
- Gerrards-Hesse, A.; Spies, K.; Hesse, F.W. Experimental inductions of emotional states and their effectiveness: A review. Br. J. Psychol. 1994, 85, 55–78. [Google Scholar] [CrossRef]
- Westermann, R.; Spies, K.; Stahl, G.; Hesse, F. Relative effectiveness and validity of mood induction procedures: A meta-analysis. Eur. J. Soc. Psychol. 1996, 26, 557–580. [Google Scholar] [CrossRef]
- Fernández-Aguilar, L.; Navarro-Bravo, B.; Ricarte, J.; Ros, L.; Latorre, J.M. How effective are films in inducing positive and negative emotional states? A meta-analysis. PLoS ONE 2019, 14, e0225040. [Google Scholar] [CrossRef] [PubMed]
- Cazala, F.; Fonteille, V.; Moulier, V.; Pélégrini-Issac, M.; De Beaurepaire, C.; Abondo, M.; Bodon-Bruzel, M.; Cano, J.; Cochez, F.; Fouli, T.; et al. Brain responses to pictures of children in men with pedophilic disorder: A functional magnetic resonance imaging study. Eur. Arch. Psychiatry Clin. Neurosci. 2019, 269, 713–729. [Google Scholar] [CrossRef] [PubMed]


| Study [reference] | Sample Size (M/F) | Mean Age (SD) | iTBS Protocol | Measures | Results | Side Effects | ||
|---|---|---|---|---|---|---|---|---|
| Number of Sessions | Number of Pulses by Session | Intensity | ||||||
| Pulopulos et al. (2019) [23] | 35 (0/35) | 23.6 (2.9) years | 2 | 1620 | 110% of the resting MT | Temperament and character inventory, mood with VAS, cortisol, Trier Social Stress Test | - No effect of iTBS on mood or cortisol secretion. Higher scores on cooperativeness were associated with lower cortisol secretion, when active iTBS was administered after the social stressor. | Not reported |
| De Wandel et al. (2020) [31] | 34 (0/34) | 23.4 (3.1) years | 2 | 1620 | 110% of the resting MT | Resting state fMRI, mood with VAS, cortisol, Trier Social Stress Test | - A stronger negative correlation between the left DLPFC and the caudal ACC was linked to a larger attenuation of stress-system sensitivity during active iTBS. | Not reported |
| De Witte et al. 2020 [32] | 38 (0/38) | 23.5 (3.0) years | 2 | 1620 | 110% of the resting MT | Rumination, cortisol, mood with VAS, Trier Social Stress Test | - No effect of iTBS on mood. In subjects with higher levels of brooding, iTBS seemed to prevent an increase in momentary ruminative thinking and induced a reduction in cortisol secretion from a social-evaluative stressor. | Not reported |
| Dumitru et al. 2020 [33] | 28 (17/11) | 27 (6.52) years | 1 | 600 | 80% of the active MT | Emotion processing tasks | - iTBS increased the recall of positive words- No effect of iTBS on negative words recall, reaction time, or accuracy in categorizing positive and negative words. | Not reported |
| Singh et al. (2020) [34] | 26 (17/09) | 28 (8) years | 1 | 1800 | 80% of the active MT | Clinical assessment, mood, structural MRI, resting state fMRI | - 25 min after iTBS: reduced FC of the DMN (mainly with the rACC and dACC) - 45 min after iTBS: reduced FC of rACC and DACC; reduced FC of the DMN with right AI - Positive correlation between the FC decrease in the rACC and the harm avoidance personality trait. | No side effects |
| Active Group Mean (SD) | Placebo Group Mean (SD) | Statistic Value | p | |
|---|---|---|---|---|
| Age (years) | 24.57 (6.65) | 25.75 (6.19) | t28 = 0.502 | 0.619 |
| Gender | 7 W/7 M | 8 W/8 M | Χ2 = 0.000 | 1.00 |
| Education Level (years) | 15.36 (1.69) | 14.50 (1.63) | t28 = 1.410 | 0.169 |
| Estimated IQ | 109.59 (5.49) | 106.47 (4.64) | t28 = 1.654 | 0.110 |
| Handedness | 86.00 (9.27) | 87.00 (15.04) | t28 = 0.209 | 0.836 |
| Active Group | Placebo Group | Statistics | |||||
|---|---|---|---|---|---|---|---|
| Before iTBS Mean (SD) | After iTBS Mean (SD) | Before iTBS Mean (SD) | After iTBS Mean (SD) | U | p | η2 | |
| BDI | 0.57 (0.85) | 0.50 (0.76) | 0.25 (0.45) | 0.13 (0.34) | 108 | 0.886 | 0.0017 |
| HAD | 5.00 (3.40) | 4.86 (2.45) | 5.25 (3.53) | 3.88 (2.90) | 80 | 0.193 | 0.0600 |
| HDRS | 0.43 (0.65) | 1.00 (1.96) | 0.31 (0.70) | 0.69 (1.14) | 118 | 0.822 | 0.0030 |
| MAS | 0.29 (1.07) | 0.36 (0.93) | 0.44 (1.32) | 0.94 (2.79) | 131 | 0.448 | 0.0494 |
Publisher’s Note: MDPI stays neutral with regard to jurisdictional claims in published maps and institutional affiliations. |
© 2021 by the authors. Licensee MDPI, Basel, Switzerland. This article is an open access article distributed under the terms and conditions of the Creative Commons Attribution (CC BY) license (https://creativecommons.org/licenses/by/4.0/).
Share and Cite
Moulier, V.; Gaudeau-Bosma, C.; Thomas, F.; Isaac, C.; Thomas, M.; Durand, F.; Schenin-King Andrianisaina, P.; Valabregue, R.; Laidi, C.; Benadhira, R.; et al. Effect of Intermittent Theta Burst Stimulation on the Neural Processing of Emotional Stimuli in Healthy Volunteers. J. Clin. Med. 2021, 10, 2449. https://doi.org/10.3390/jcm10112449
Moulier V, Gaudeau-Bosma C, Thomas F, Isaac C, Thomas M, Durand F, Schenin-King Andrianisaina P, Valabregue R, Laidi C, Benadhira R, et al. Effect of Intermittent Theta Burst Stimulation on the Neural Processing of Emotional Stimuli in Healthy Volunteers. Journal of Clinical Medicine. 2021; 10(11):2449. https://doi.org/10.3390/jcm10112449
Chicago/Turabian StyleMoulier, Virginie, Christian Gaudeau-Bosma, Fanny Thomas, Clémence Isaac, Maxence Thomas, Florence Durand, Palmyre Schenin-King Andrianisaina, Romain Valabregue, Charles Laidi, René Benadhira, and et al. 2021. "Effect of Intermittent Theta Burst Stimulation on the Neural Processing of Emotional Stimuli in Healthy Volunteers" Journal of Clinical Medicine 10, no. 11: 2449. https://doi.org/10.3390/jcm10112449
APA StyleMoulier, V., Gaudeau-Bosma, C., Thomas, F., Isaac, C., Thomas, M., Durand, F., Schenin-King Andrianisaina, P., Valabregue, R., Laidi, C., Benadhira, R., Bouaziz, N., & Januel, D. (2021). Effect of Intermittent Theta Burst Stimulation on the Neural Processing of Emotional Stimuli in Healthy Volunteers. Journal of Clinical Medicine, 10(11), 2449. https://doi.org/10.3390/jcm10112449