Volatile Organic Compounds in Exhaled Breath as Fingerprints of Lung Cancer, Asthma and COPD

 ,
, 

Abstract
1. Introduction
2. Study Design
2.1. Articles Selection
2.2. Criteria for Selection of Articles
- No investigation of the VOCs profile, but non-volatile markers;
- Targeted diseases caused by exposure to harmful VOCs;
- VOCs related to the effects of therapy;
- Sampling and/or analyses methods only;
- Sensitivity, specificity, or accuracy of existing methods, with no focus on clinical studies;
- Sensor development used for validation standards of previously reported markers of certain diseases;
- Risk assessment and occupational exposure studies;
- Nanomaterials with application in clinical diagnosis;
- Smoking and/or exposure to tobacco products;
- Predictive models constructed using VOCs targets collected from the literature;
- Non-clinical, in vitro and animals’ studies.
2.3. Data Structuring
- Table 1 presents details on the type of sample that is collected, participants’ number, and place (hospital, country) where the samples were collected;
- Table 2 summarizes the analytical platforms used, key outputs, statistical approach and diagnosis accuracy;
- Table 3 reports the VOCs that have been identified to be associated with the three respiratory diseases.
3. Statistics of Included Studies
4. Analytical Platforms Used for Investigating Breath Volatiles Associated with Asthma, COPD, and Lung Cancer
4.1. GC-MS Instrumentation
4.2. PTR-MS and SESI-MS Instrumentation
4.3. IMS Based Instrumentation
4.4. Sensors and Electronic Noses
4.5. Fourier-Transform Ion Cyclotron Resonance Mass Spectrometry
4.6. Trained Dogs
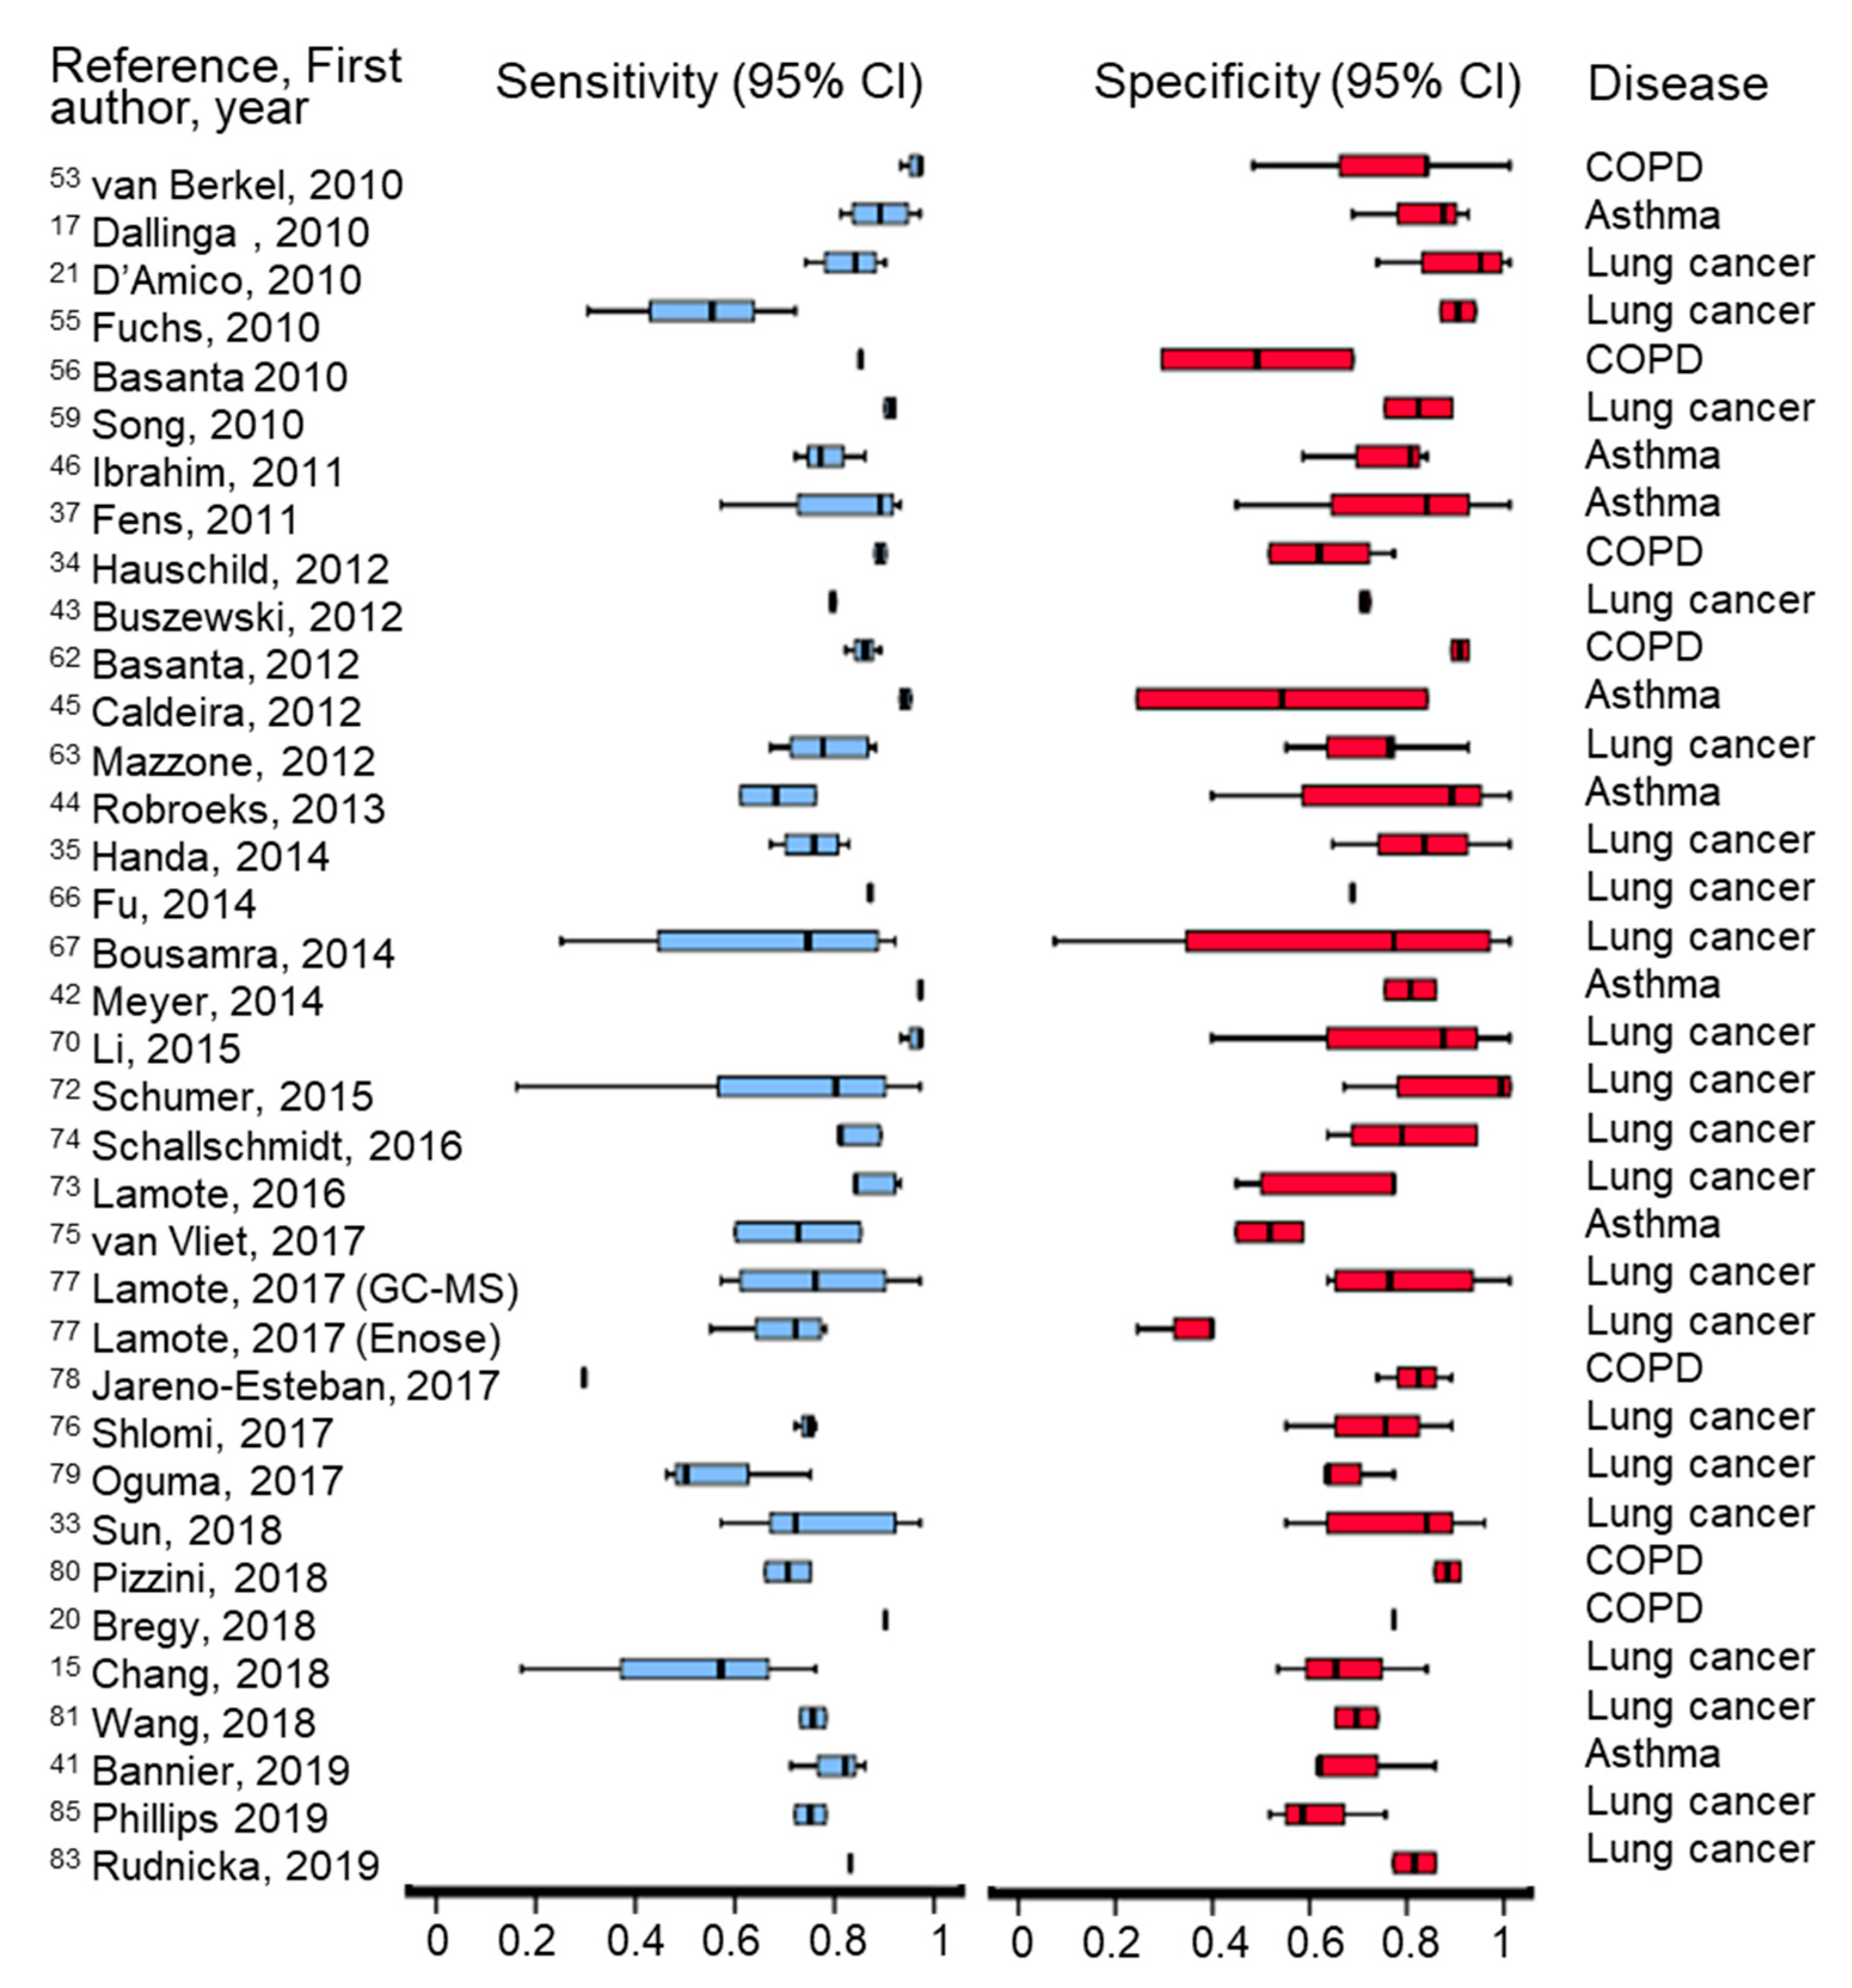
4.7. Features and Performance of Analytical Platforms
5. Diagnosis of Investigated Respiratory Diseases
5.1. Asthma
Diagnosis of Asthma Based on Specific VOCs
5.2. COPD
Diagnosis of COPD Based on Specific VOCs
5.3. Lung Cancer
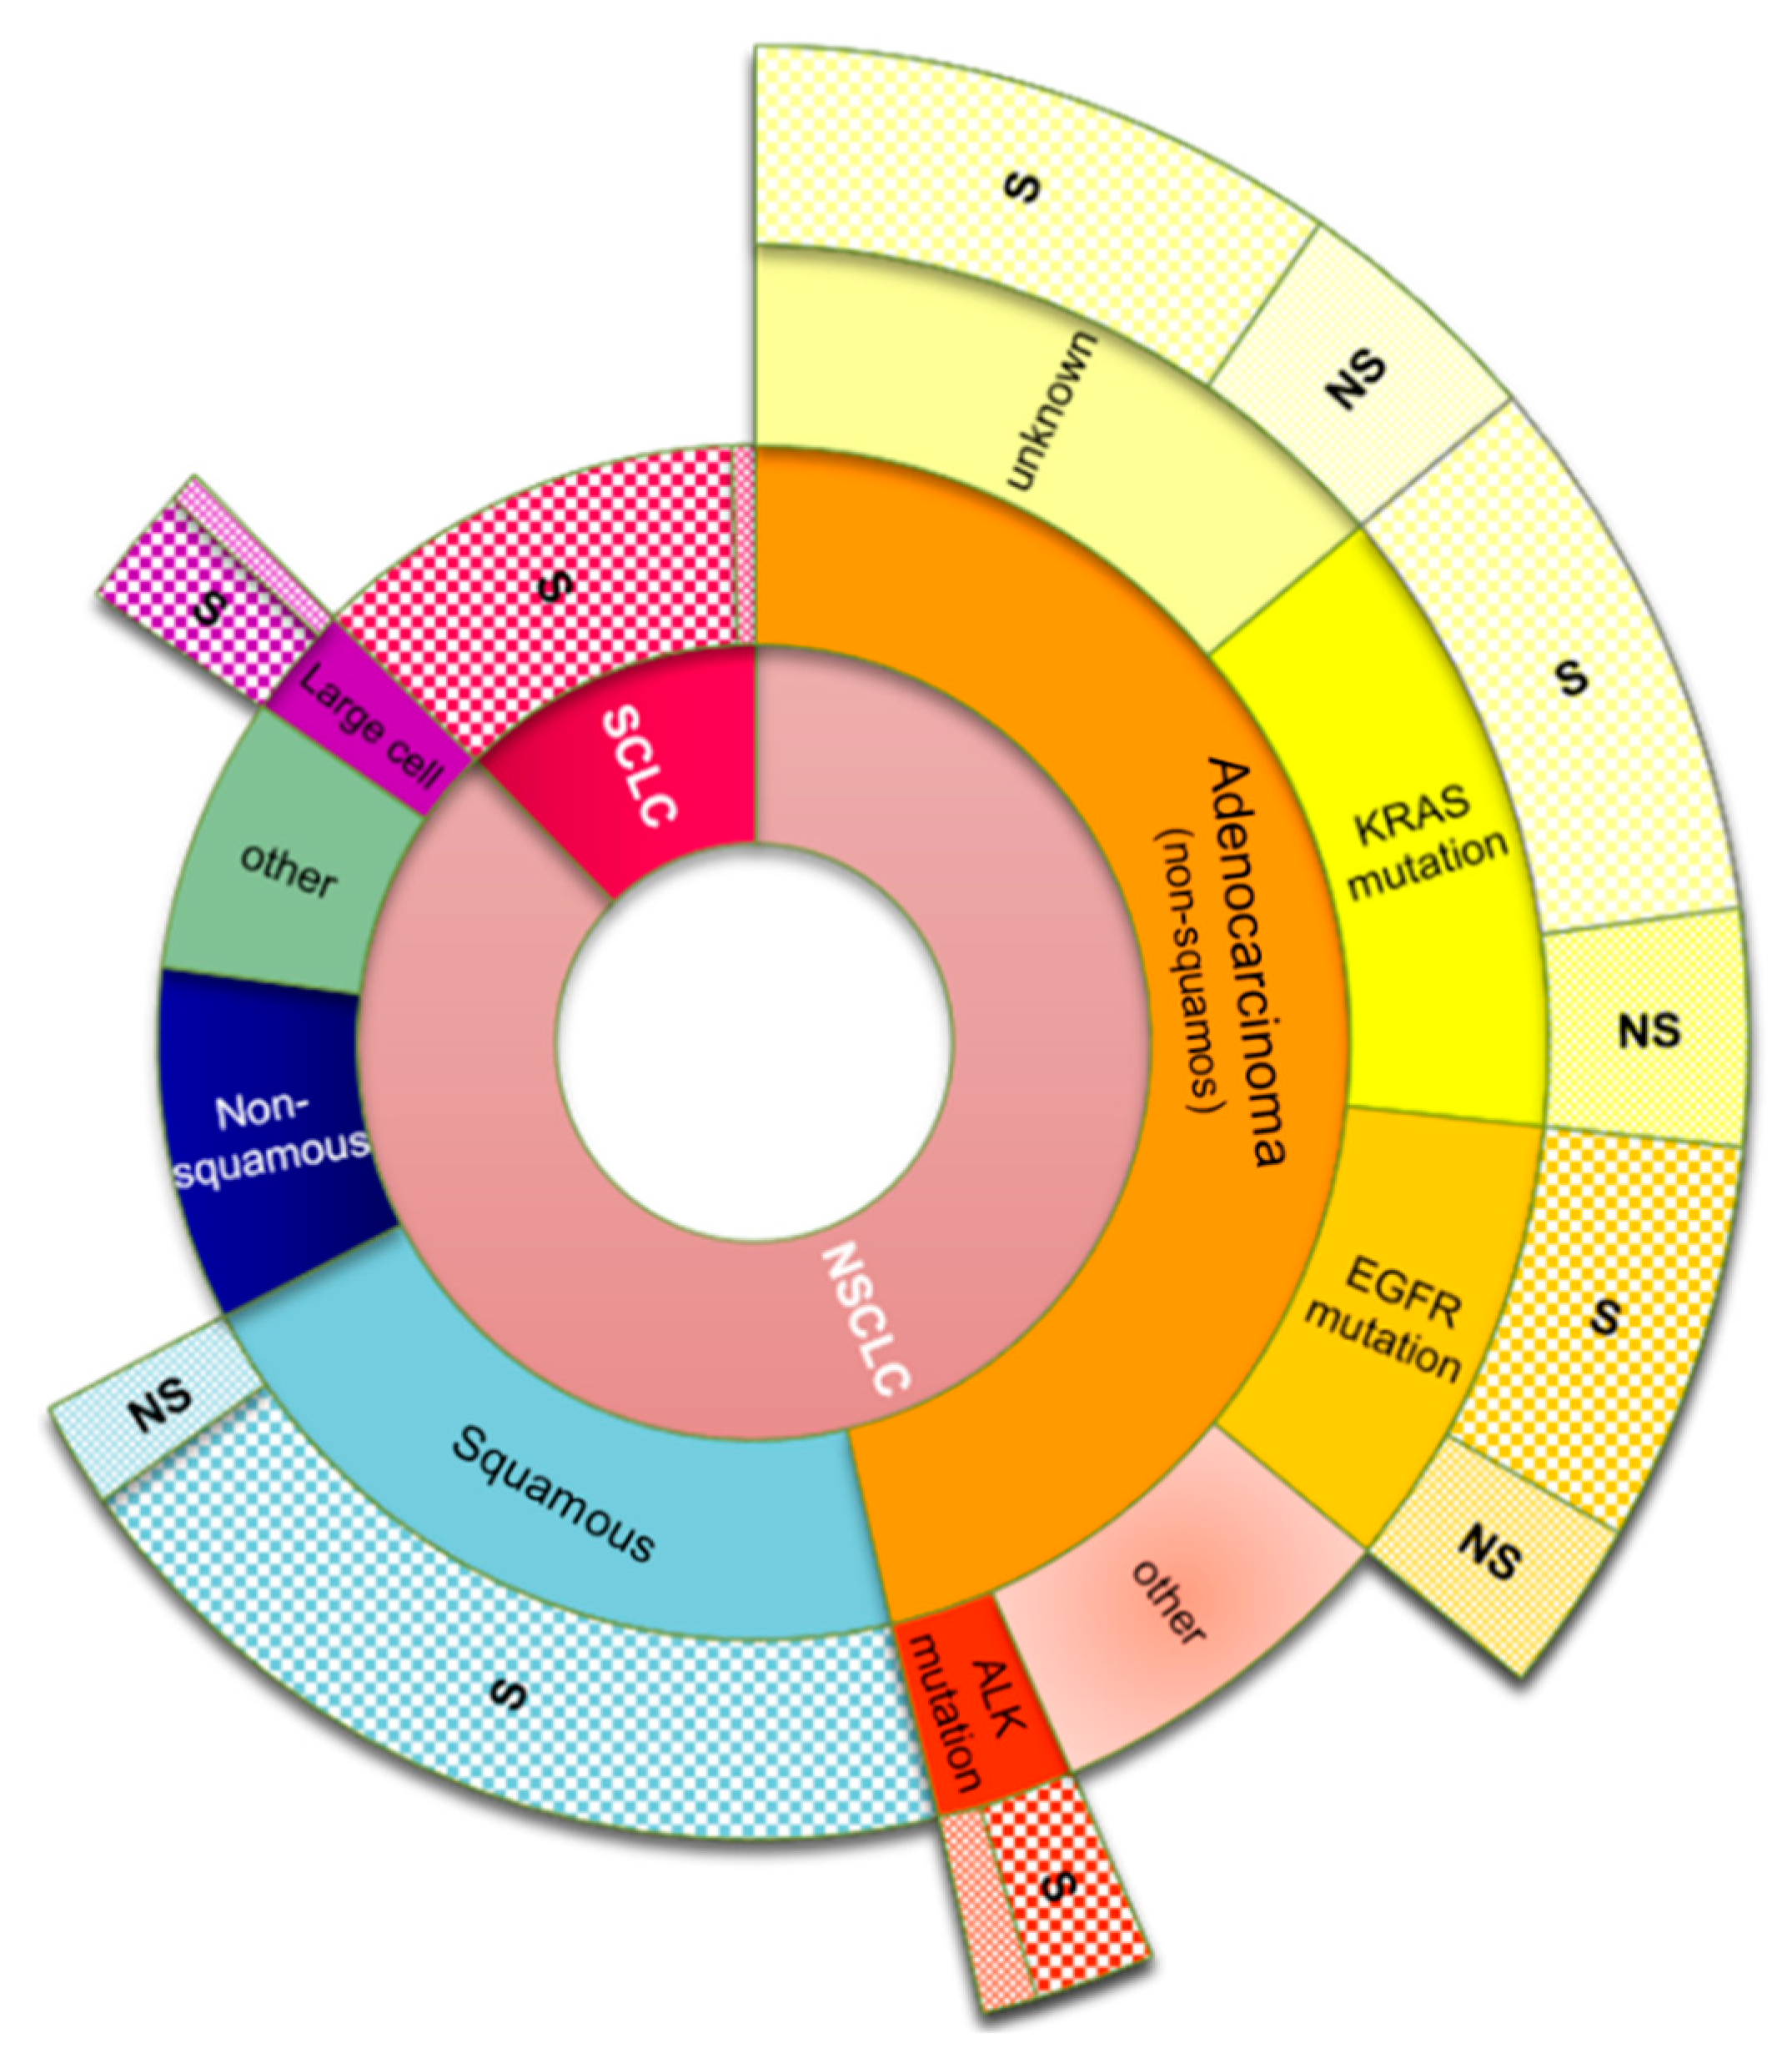
5.3.1. Types of Lung Cancer
5.3.2. Diagnosis of Lung Cancer Based on Specific VOCs
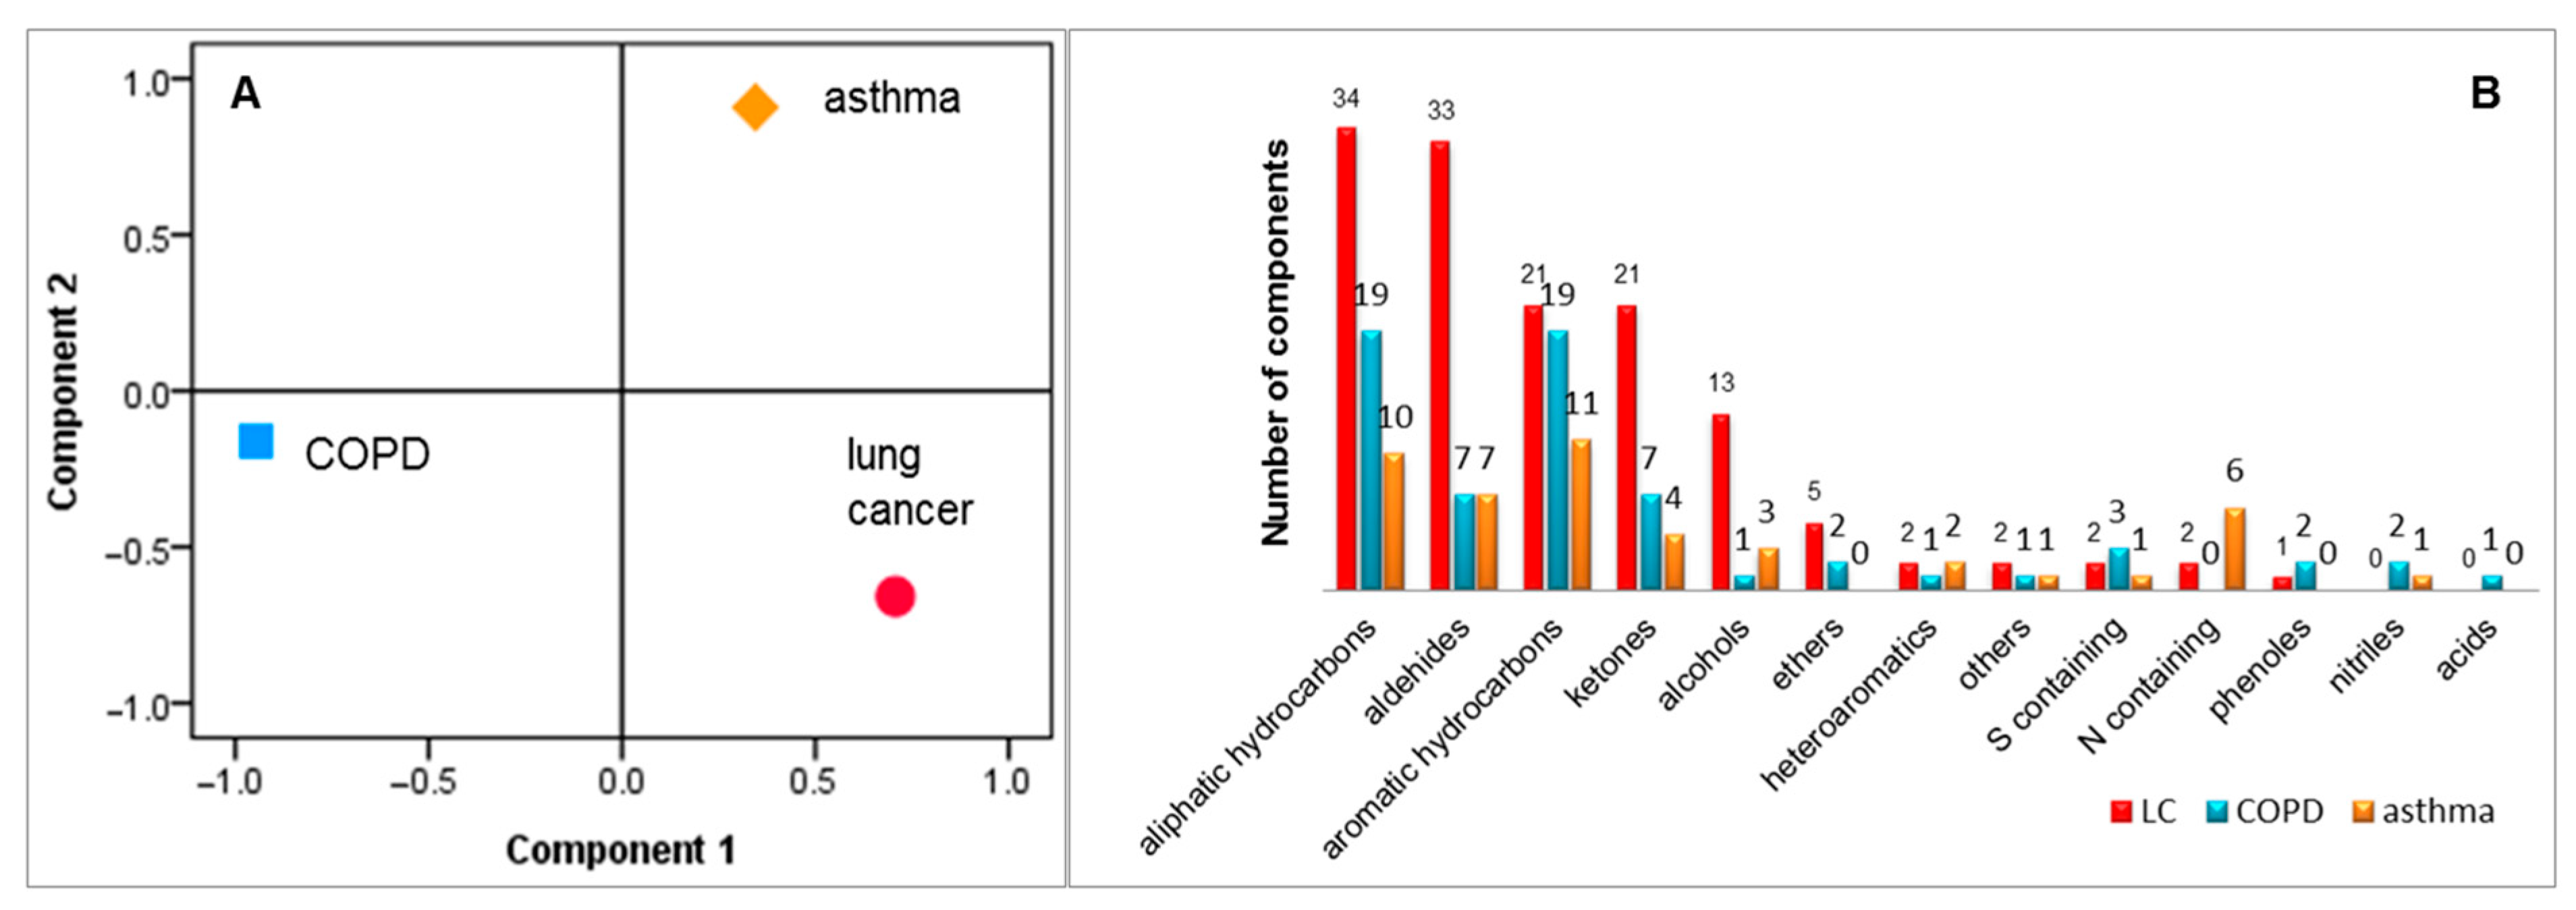
5.4. Discrimination between Asthma, COPD and Lung Cancer
6. The Origin of VOCs Related to the Investigated Diseases and a Sum Up of the Diagnostic Prediction Using the Markers Reported in the Reviewed Studies
7. Limitations, Excluding Criteria and Standardization
7.1. Current Status of VOCs Based Diagnosis
7.2. Overall Proposed Solutions
- Breath sampling needs highly standardized conditions to include certain breath fraction, well-defined excluding criteria, given conditions for preparation of volunteers for sample collection, and the volume and duration of sampling;
- In the absence of a “perfect” breath reference material, routine breath control measurements should be performed at certain time spans;
- Operating of instruments according to well-defined protocols and standardized criteria;
- Monitoring of background air that can impact the performance of the methods;
- Calibration of instruments (especially sensors) with standardized samples that mimic breath is highly desired;
- Data processing workflow should be also standardized including for examples: peaks alignment, normalization, and statistical analyses.
- Utilization of standardized methods for data processing (statistical tools, thresholds used for extraction parameters);
- Creation of databases of markers obtained using standardized methods that can be accessed and completed by researchers.
8. Concluding Remarks and Future Perspectives
Author Contributions
Funding
Institutional Review Board Statement
Informed Consent Statement
Data Availability Statement
Acknowledgments
Conflicts of Interest
References
- Garwood, P. World No Tobacco Day 2019: Don’t Let Tobacco Take Your Breath Away; News Release; World Health Organization: Geneva, Switzerland, 2019. [Google Scholar]
- Wang, H.; Naghavi, M.; Allen, C.; Barber, R.M.; Carter, A.; Casey, D.C.; Charlson, F.J.; Chen, A.Z.; Coates, M.M.; Coggeshall, M.; et al. Global, regional, and national life expectancy, all-cause mortality, and cause-specific mortality for 249 causes of death, 1980–2015: A systematic analysis for the Global Burden of Disease Study 2015. Lancet 2016, 388, 1459–1544. [Google Scholar] [CrossRef]
- Vos, T.; Allen, C.; Arora, M.; Barber, R.M.; Brown, A.; Carter, A.; Casey, D.C.; Charlson, F.J.; Chen, A.Z.; Coggeshall, M.; et al. Global, regional, and national incidence, prevalence, and years lived with disability for 310 diseases and injuries, 1990–2015: A systematic analysis for the Global Burden of Disease Study 2015. Lancet 2016, 388, 1545–1602. [Google Scholar] [CrossRef]
- Van de Kant, K.D.G.; van der Sande, L.J.T.M.; Jöbsis, Q.; van Schayck, O.C.P.; Dompeling, E. Clinical use of exhaled volatile organic compounds in pulmonary diseases: A systematic review. Respir. Res. 2012, 13. [Google Scholar] [CrossRef]
- Pajewska-Szmyt, M.; Sinkiewicz-Darol, E.; Bernatowicz-Łojko, U.; Kowalkowski, T.; Gadzała-Kopciuch, R.; Buszewski, B. QuEChERS extraction coupled to GC-MS for a fast determination of polychlorinated biphenyls in breast milk from Polish women. Environ. Sci. Pollut. Res. 2019, 26, 30988–30999. [Google Scholar] [CrossRef] [PubMed]
- Pajewska-Szmyt, M.; Sinkiewicz-Darol, E.; Gadzała-Kopciuch, R. The impact of environmental pollution on the quality of mother’s milk. Environ. Sci. Pollut. Res. 2019, 26, 7405–7427. [Google Scholar] [CrossRef] [PubMed]
- Tavares, L.; Monedeiro, F.; Bordin, D.M.; De Martinis, B.S. Investigation of Ayahuasca β-Carboline Alkaloids and Tryptamine in Sweat Samples from Religious Community Participants by GC-MS. J. Anal. Toxicol. 2020, 1–9. [Google Scholar] [CrossRef] [PubMed]
- Monedeiro, F.; dos Reis, R.B.; Peria, F.M.; Sares, C.T.G.; De Martinis, B.S. Investigation of sweat VOC profiles in assessment of cancer biomarkers using HS-GC-MS. J. Breath Res. 2020, 14, 026009. [Google Scholar] [CrossRef] [PubMed]
- Milanowski, M.; Monedeiro, F.; Złoch, M.; Ratiu, I.A.; Pomastowski, P.; Ligor, T.; De Martinis, B.S.; Buszewski, B. Profiling of VOCs released from different salivary bacteria treated with non-lethal concentrations of silver nitrate. Anal. Biochem. 2019, 578, 36–44. [Google Scholar] [CrossRef]
- Ratiu, I.A.; Ligor, T.; Bocos-Bintintan, V.; Szeliga, J.; MacHała, K.; Jackowski, M.; Buszewski, B. GC-MS application in determination of volatile profiles emitted by infected and uninfected human tissue. J. Breath Res. 2019, 13. [Google Scholar] [CrossRef] [PubMed]
- Westenbrink, E.; Arasaradnam, R.P.; O’Connell, N.; Bailey, C.; Nwokolo, C.; Bardhan, K.D.; Covington, J.A. Development and application of a new electronic nose instrument for the detection of colorectal cancer. Biosens. Bioelectron. 2015, 67, 733–738. [Google Scholar] [CrossRef]
- Aathithan, S.; Plant, J.C.; Chaudry, A.N.; French, G.L. Diagnosis of Bacteriuria by Detection of Volatile Organic Compounds in Urine Using an Automated Headspace Analyzer with Multiple Conducting Polymer Sensors. J. Clin. Microbiol. 2001, 39, 2590–2593. [Google Scholar] [CrossRef] [PubMed]
- Pesesse, R.; Stefanuto, P.H.; Schleich, F.; Louis, R.; Focant, J.F. Multimodal chemometric approach for the analysis of human exhaled breath in lung cancer patients by TD-GC × GC-TOFMS. J. Chromatogr. B Anal. Technol. Biomed. Life Sci. 2019, 1114–1115, 146–153. [Google Scholar] [CrossRef] [PubMed]
- Phillips, C.O.; Syed, Y.; Mac Parthaláin, N.; Zwiggelaar, R.; Claypole, T.C.; Lewis, K.E. Machine learning methods on exhaled volatile organic compounds for distinguishing COPD patients from healthy controls. J. Breath Res. 2012, 6. [Google Scholar] [CrossRef] [PubMed]
- Chang, J.E.; Lee, D.S.; Ban, S.W.; Oh, J.; Jung, M.Y.; Kim, S.H.; Park, S.J.; Persaud, K.; Jheon, S. Analysis of volatile organic compounds in exhaled breath for lung cancer diagnosis using a sensor system. Sens. Actuators B Chem. 2018, 255, 800–807. [Google Scholar] [CrossRef]
- Sakumura, Y.; Koyama, Y.; Tokutake, H.; Hida, T.; Sato, K.; Itoh, T.; Akamatsu, T.; Shin, W. Diagnosis by volatile organic compounds in exhaled breath from lung cancer patients using support vector machine algorithm. Sensors (Switzerland) 2017, 17, 287. [Google Scholar] [CrossRef]
- Dallinga, J.W.; Robroeks, C.M.H.H.T.; Van Berkel, J.J.B.N.; Moonen, E.J.C.; Godschalk, R.W.L.; Jöbsis, Q.; Dompeling, E.; Wouters, E.F.M.; Van Schooten, F.J. Volatile organic compounds in exhaled breath as a diagnostic tool for asthma in children. Clin. Exp. Allergy 2010, 40, 68–76. [Google Scholar] [CrossRef]
- Besa, V.; Teschler, H.; Kurth, I.; Khan, A.M.; Zarogoulidis, P.; Baumbach, J.I.; Sommerwerck, U.; Freitag, L.; Darwiche, K. Exhaled volatile organic compounds discriminate patients with chronic obstructive pulmonary disease from healthy subjects. Int. J. COPD 2015, 10, 399–406. [Google Scholar] [CrossRef]
- Gaida, A.; Holz, O.; Nell, C.; Schuchardt, S.; Lavae-Mokhtari, B.; Kruse, L.; Boas, U.; Langejuergen, J.; Allers, M.; Zimmermann, S.; et al. A dual center study to compare breath volatile organic compounds from smokers and non-smokers with and without COPD. J. Breath Res. 2016, 10. [Google Scholar] [CrossRef]
- Bregy, L.; Nussbaumer-Ochsner, Y.; Martinez-Lozano Sinues, P.; García-Gómez, D.; Suter, Y.; Gaisl, T.; Stebler, N.; Gaugg, M.T.; Kohler, M.; Zenobi, R. Real-time mass spectrometric identification of metabolites characteristic of chronic obstructive pulmonary disease in exhaled breath. Clin. Mass Spectrom. 2018, 7, 29–35. [Google Scholar] [CrossRef]
- D’Amico, A.; Pennazza, G.; Santonico, M.; Martinelli, E.; Roscioni, C.; Galluccio, G.; Paolesse, R.; Di Natale, C. An investigation on electronic nose diagnosis of lung cancer. Lung Cancer 2010, 68, 170–176. [Google Scholar] [CrossRef]
- Ulanowska, A.; Kowalkowski, T.; Trawińska, E.; Buszewski, B. The application of statistical methods using VOCs to identify patients with lung cancer. J. Breath Res. 2011, 5. [Google Scholar] [CrossRef] [PubMed]
- Risby, T.H.; Sehnert, S.S. Clinical application of breath biomarkers of oxidative stress status. Free Radic. Biol. Med. 1999, 27, 1182–1192. [Google Scholar] [CrossRef]
- Cao, W.; Duan, Y. Breath analysis: Potential for clinical diagnosis and exposure assessment. Clin. Chem. 2006, 52, 800–811. [Google Scholar] [CrossRef] [PubMed]
- Hashoul, D.; Haick, H. Sensors for detecting pulmonary diseases from exhaled breath. Eur. Respir. Rev. 2019, 28. [Google Scholar] [CrossRef] [PubMed]
- Sánchez, C.; Santos, J.P.; Lozano, J. Use of electronic noses for diagnosis of digestive and respiratory diseases through the breath. Biosensors 2019, 9, 35. [Google Scholar] [CrossRef]
- Neerincx, A.H.; Vijverberg, S.J.H.; Bos, L.D.J.; Brinkman, P.; van der Schee, M.P.; de Vries, R.; Sterk, P.J.; Maitland-van der Zee, A.H. Breathomics from exhaled volatile organic compounds in pediatric asthma. Pediatr. Pulmonol. 2017, 52, 1616–1627. [Google Scholar] [CrossRef]
- Hakim, M.; Broza, Y.Y.; Barash, O.; Peled, N.; Phillips, M.; Amann, A.; Haick, H. Volatile organic compounds of lung cancer and possible biochemical pathways. Chem. Rev. 2012, 112, 5949–5966. [Google Scholar] [CrossRef]
- Bruderer, T.; Gaisl, T.; Gaugg, M.T.; Nowak, N.; Streckenbach, B.; Müller, S.; Moeller, A.; Kohler, M.; Zenobi, R. On-Line Analysis of Exhaled Breath. Chem. Rev. 2019, 119, 10803–10828. [Google Scholar] [CrossRef]
- Scarlata, S.; Pennazza, G.; Santonico, M.; Pedone, C.; Antonelli Incalzi, R. Exhaled breath analysis by electronic nose in respiratory diseases. Expert Rev. Mol. Diagn. 2015, 15, 933–956. [Google Scholar] [CrossRef]
- Lubes, G.; Goodarzi, M. Analysis of Volatile Compounds by Advanced Analytical Techniques and Multivariate Chemometrics. Chem. Rev. 2017, 117, 6399–6422. [Google Scholar] [CrossRef]
- Cristescu, S.M.; Gietema, H.A.; Blanchet, L.; Kruitwagen, C.L.J.J.; Munnik, P.; Van Klaveren, R.J.; Lammers, J.W.J.; Buydens, L.; Harren, F.J.M.; Zanen, P. Screening for emphysema via exhaled volatile organic compounds. J. Breath Res. 2011, 5. [Google Scholar] [CrossRef] [PubMed]
- Feinberg, T.; Alkoby-Meshulam, L.; Herbig, J.; Cancilla, J.C.; Torrecilla, J.S.; Gai Mor, N.; Bar, J.; Ilouze, M.; Haick, H.; Peled, N. Cancerous glucose metabolism in lung cancer—Evidence from exhaled breath analysis. J. Breath Res. 2016, 10. [Google Scholar] [CrossRef] [PubMed]
- Sun, Y.; Chen, Y.; Sun, C.; Liu, H.; Wang, Y.; Jiang, X. Analysis of volatile organic compounds from patients and cell lines for the validation of lung cancer biomarkers by proton-transfer-reaction mass spectrometry. Anal. Methods 2019, 11, 3188–3197. [Google Scholar] [CrossRef]
- Hauschild, A.C.; Baumbach, J.I.; Baumbach, J. Integrated statistical learning of metabolic ion mobility spectrometry profiles for pulmonary disease identification. Genet. Mol. Res. 2012, 11, 2733–2744. [Google Scholar] [CrossRef] [PubMed]
- Handa, H.; Usuba, A.; Maddula, S.; Baumbach, J.I.; Mineshita, M.; Miyazawa, T. Exhaled breath analysis for lung cancer detection using ion mobility spectrometry. PLoS ONE 2014, 9, e114555. [Google Scholar] [CrossRef]
- Allers, M.; Langejuergen, J.; Gaida, A.; Holz, O.; Schuchardt, S.; Hohlfeld, J.M.; Zimmermann, S. Measurement of exhaled volatile organic compounds from patients with chronic obstructive pulmonary disease (COPD) using closed gas loop GC-IMS and GC-APCI-MS. J. Breath Res. 2016, 10. [Google Scholar] [CrossRef]
- Fens, N.; Roldaan, A.C.; van der Schee, M.P.; Boksem, R.J.; Zwinderman, A.H.; Bel, E.H.; Sterk, P.J. External validation of exhaled breath profiling using an electronic nose in the discrimination of asthma with fixed airways obstruction and chronic obstructive pulmonary disease. Clin. Exp. Allergy 2011, 41, 1371–1378. [Google Scholar] [CrossRef]
- Hattesohl, A.D.M.; Jörres, R.A.; Dressel, H.; Schmid, S.; Vogelmeier, C.; Greulich, T.; Noeske, S.; Bals, R.; Koczulla, A.R. Discrimination between COPD patients with and without alpha 1-antitrypsin deficiency using an electronic nose. Respirology 2011, 16, 1258–1264. [Google Scholar] [CrossRef]
- Timms, C.; Thomas, P.S.; Yates, D.H. Detection of gastro-oesophageal reflux disease (GORD) in patients with obstructive lung disease using exhaled breath profiling. J. Breath Res. 2012, 6. [Google Scholar] [CrossRef]
- Cai, X.; Chen, L.; Kang, T.; Tang, Y.; Lim, T.; Xu, M.; Hui, H. A prediction model with a combination of variables for diagnosis of lung cancer. Med. Sci. Monit. 2017, 23, 5620–5629. [Google Scholar] [CrossRef]
- Bannier, M.A.G.E.; Van De Kant, K.D.G.; Jöbsis, Q.; Dompeling, E. Feasibility and diagnostic accuracy of an electronic nose in children with asthma and cystic fibrosis. J. Breath Res. 2019, 13. [Google Scholar] [CrossRef] [PubMed]
- Meyer, N.; Dallinga, J.W.; Nuss, S.J.; Moonen, E.J.C.; van Berkel, J.J.B.N.; Akdis, C.; van Schooten, F.J.; Menz, G. Defining adult asthma endotypes by clinical features and patterns of volatile organic compounds in exhaled air. Respir. Res. 2014, 15, 1–9. [Google Scholar] [CrossRef] [PubMed]
- Buszewski, B.; Ligor, T.; Jezierski, T.; Wenda-Piesik, A.; Walczak, M.; Rudnicka, J. Identification of volatile lung cancer markers by gas chromatography-mass spectrometry: Comparison with discrimination by canines. Anal. Bioanal. Chem. 2012, 404, 141–146. [Google Scholar] [CrossRef] [PubMed]
- Robroeks, C.M.; Van Berkel, J.J.; Jöbsis, Q.; Van Schooten, F.J.; Dallinga, J.W.; Wouters, E.F.; Dompeling, E. Exhaled volatile organic compounds predict exacerbations of childhood asthma in a 1-year prospective study. Eur. Respir. J. 2013, 42, 98–106. [Google Scholar] [CrossRef]
- Caldeira, M.; Perestrelo, R.; Barros, A.S.; Bilelo, M.J.; Morête, A.; Câmara, J.S.; Rocha, S.M. Allergic asthma exhaled breath metabolome: A challenge for comprehensive two-dimensional gas chromatography. J. Chromatogr. A 2012, 1254, 87–97. [Google Scholar] [CrossRef]
- Ibrahim, B.; Basanta, M.; Cadden, P.; Singh, D.; Douce, D.; Woodcock, A.; Fowler, S.J. Non-invasive phenotyping using exhaled volatile organic compounds in asthma. Thorax 2011, 66, 804–809. [Google Scholar] [CrossRef]
- Kischkel, S.; Miekisch, W.; Sawacki, A.; Straker, E.M.; Trefz, P.; Amann, A.; Schubert, J.K. Breath biomarkers for lung cancer detection and assessment of smoking related effects—confounding variables, influence of normalization and statistical algorithms. Clin. Chim. Acta 2010, 411, 1637–1644. [Google Scholar] [CrossRef]
- Sagandykova, G.N.; Alimzhanova, M.B.; Nurzhanova, Y.T.; Kenessov, B. Determination of semi-volatile additives in wines using SPME and GC–MS. Food Chem. 2017, 220, 162–167. [Google Scholar] [CrossRef]
- Ratiu, I.A.; Ligor, T.; Bocos-Bintintan, V.; Al-Suod, H.; Kowalkowski, T.; Rafińska, K.; Buszewski, B. The effect of growth medium on an Escherichia coli pathway mirrored into GC/MS profiles. J. Breath Res. 2017, 11. [Google Scholar] [CrossRef]
- Al-Suod, H.; Ratiu, I.A.; Ligor, M.; Ligor, T.; Buszewski, B. Determination of sugars and cyclitols isolated from various morphological parts of Medicago sativa L. J. Sep. Sci. 2018, 41, 1118–1128. [Google Scholar] [CrossRef]
- Ratiu, I.A.; Al-Suod, H.; Ligor, M.; Ligor, T.; Railean-Plugaru, V.; Buszewski, B. Complex investigation of extraction techniques applied for cyclitols and sugars isolation from different species of Solidago genus. Electrophoresis 2018, 39, 1966–1974. [Google Scholar] [CrossRef] [PubMed]
- Giannoukos, S.; Brkić, B.; Taylor, S.; Marshall, A.; Verbeck, G.F. Chemical Sniffing Instrumentation for Security Applications. Chem. Rev. 2016, 116, 8146–8172. [Google Scholar] [CrossRef] [PubMed]
- Van Berkel, J.J.B.N.; Dallinga, J.W.; Möller, G.M.; Godschalk, R.W.L.; Moonen, E.J.; Wouters, E.F.M.; Van Schooten, F.J. A profile of volatile organic compounds in breath discriminates COPD patients from controls. Respir. Med. 2010, 104, 557–563. [Google Scholar] [CrossRef] [PubMed]
- Montuschi, P.; Santonico, M.; Mondino, C.; Pennazza, G.; Maritini, G.; Martinelli, E.; Capuano, R.; Ciabattoni, G.; Paolesse, R.; Di Natale, C.; et al. Diagnostic performance of an electronic nose, fractional exhaled nitric oxide, and lung function testing in asthma. Chest 2010, 137, 790–796. [Google Scholar] [CrossRef]
- Fuchs, P.; Loeseken, C.; Schubert, J.K.; Miekisch, W. Breath gas aldehydes as biomarkers of lung cancer. Int. J. Cancer 2010, 126, 2663–2670. [Google Scholar] [CrossRef]
- Basanta, M.; Jarvis, R.M.; Xu, Y.; Blackburn, G.; Tal-Singer, R.; Woodcock, A.; Singh, D.; Goodacre, R.; Paul Thomas, C.L.; Fowler, S.J. Non-invasive metabolomic analysis of breath using differential mobility spectrometry in patients with chronic obstructive pulmonary disease and healthy smokers. Analyst 2010, 135, 315–320. [Google Scholar] [CrossRef]
- Peng, G.; Hakim, M.; Broza, Y.Y.; Billan, S.; Abdah-Bortnyak, R.; Kuten, A.; Tisch, U.; Haick, H. Detection of lung, breast, colorectal, and prostate cancers from exhaled breath using a single array of nanosensors. Br. J. Cancer 2010, 103, 542–551. [Google Scholar] [CrossRef]
- Poli, D.; Goldoni, M.; Corradi, M.; Acampa, O.; Carbognani, P.; Internullo, E.; Casalini, A.; Mutti, A. Determination of aldehydes in exhaled breath of patients with lung cancer by means of on-fiber-derivatisation SPME-GC/MS. J. Chromatogr. B Anal. Technol. Biomed. Life Sci. 2010, 878, 2643–2651. [Google Scholar] [CrossRef]
- Song, G.; Qin, T.; Liu, H.; Xu, G.B.; Pan, Y.Y.; Xiong, F.X.; Gu, K.S.; Sun, G.P.; Chen, Z.D. Quantitative breath analysis of volatile organic compounds of lung cancer patients. Lung Cancer 2010, 67, 227–231. [Google Scholar] [CrossRef]
- Caldeira, M.; Barros, A.S.; Bilelo, M.J.; Parada, A.; Câmara, J.S.; Rocha, S.M. Profiling allergic asthma volatile metabolic patterns using a headspace-solid phase microextraction/gas chromatography based methodology. J. Chromatogr. A 2011, 1218, 3771–3780. [Google Scholar] [CrossRef]
- Rudnicka, J.; Kowalkowski, T.; Ligor, T.; Buszewski, B. Determination of volatile organic compounds as biomarkers of lung cancer by SPME-GC-TOF/MS and chemometrics. J. Chromatogr. B Anal. Technol. Biomed. Life Sci. 2011, 879, 3360–3366. [Google Scholar] [CrossRef]
- Basanta, M.; Ibrahim, B.; Dockry, R.; Douce, D.; Morris, M.; Singh, D.; Woodcock, A.; Fowler, S.J. Exhaled volatile organic compounds for phenotyping chronic obstructive pulmonary disease: A cross-sectional study. Respir. Res. 2012, 13, 1. [Google Scholar] [CrossRef] [PubMed]
- Mazzone, P.J.; Wang, X.F.; Xu, Y.; Mekhail, T.; Beukemann, M.C.; Na, J.; Kemling, J.W.; Suslick, K.S.; Sasidhar, M. Exhaled breath analysis with a colorimetric sensor array for the identification and characterization of lung cancer. J. Thorac. Oncol. 2012, 7, 137–142. [Google Scholar] [CrossRef] [PubMed]
- Gahleitner, F.; Guallar-Hoyas, C.; Beardsmore, C.S.; Pandya, H.C.; Thomas, C.P. Metabolomics pilot study to identify volatile organic compound markers of childhood asthma in exhaled breath. Bioanalysis 2013, 5, 2239–2247. [Google Scholar] [CrossRef]
- Schmekel, B.; Winquist, F.; Vikström, A. Analysis of breath samples for lung cancer survival. Anal. Chim. Acta 2014, 840, 82–86. [Google Scholar] [CrossRef] [PubMed]
- Fu, X.-A.; Li, M.; Knipp, R.J.; Nantz, M.H.; Bousamra, M. Noninvasive detection of lung cancer using exhaled breath. Cancer Med. 2014, 3, 174–181. [Google Scholar] [CrossRef]
- Bousamra, M.; Schumer, E.; Li, M.; Knipp, R.J.; Nantz, M.H.; Van Berkel, V.; Fu, X.A. Quantitative analysis of exhaled carbonyl compounds distinguishes benign from malignant pulmonary disease. J. Thorac. Cardiovasc. Surg. 2014, 148, 1074–1081. [Google Scholar] [CrossRef]
- Ma, H.; Li, X.; Chen, J.; Wang, H.; Cheng, T.; Chen, K.; Xu, S. Analysis of human breath samples of lung cancer patients and healthy controls with solid-phase microextraction (SPME) and flow-modulated comprehensive two-dimensional gas chromatography (GC × GC). Anal. Methods 2014, 6, 6841–6849. [Google Scholar] [CrossRef]
- Zou, Y.; Zhang, X.; Chen, X.; Hu, Y.; Ying, K.; Wang, P. Optimization of volatile markers of lung cancer to exclude interferences of non-malignant disease. Cancer Biomarkers 2014, 14, 371–379. [Google Scholar] [CrossRef]
- Li, M.; Yang, D.; Brock, G.; Knipp, R.J.; Bousamra, M.; Nantz, M.H.; Fu, X.A. Breath carbonyl compounds as biomarkers of lung cancer. Lung Cancer 2015, 90, 92–97. [Google Scholar] [CrossRef]
- Ma, W.; Gao, P.; Fan, J.; Hashi, Y.; Chen, Z. Determination of breath gas composition of lung cancer patients using gas chromatography/mass spectrometry with monolithic material sorptive extraction. Biomed. Chromatogr. 2015, 29, 961–965. [Google Scholar] [CrossRef] [PubMed]
- Schumer, E.M.; Trivedi, J.R.; Van Berkel, V.; Black, M.C.; Li, M.; Fu, X.A.; Bousamra, M. High sensitivity for lung cancer detection using analysis of exhaled carbonyl compounds Read at the 95th Annual Meeting of the American Association for Thoracic Surgery, Seattle, Washington, April 25–29, 2015. J. Thorac. Cardiovasc. Surg. 2015, 150, 1517–1524. [Google Scholar] [CrossRef] [PubMed]
- Lamote, K.; Vynck, M.; Van Cleemput, J.; Thas, O.; Nackaerts, K.; Van Meerbeeck, J.P. Detection of malignant pleural mesothelioma in exhaled breath by multicapillary column/ion mobility spectrometry (MCC/IMS). J. Breath Res. 2016, 10. [Google Scholar] [CrossRef]
- Schallschmidt, K.; Becker, R.; Jung, C.; Bremser, W.; Walles, T.; Neudecker, J.; Leschber, G.; Frese, S.; Nehls, I. Comparison of volatile organic compounds from lung cancer patients and healthy controls—Challenges and limitations of an observational study. J. Breath Res. 2016, 10. [Google Scholar] [CrossRef] [PubMed]
- Van Vliet, D.; Smolinska, A.; Jöbsis, Q.; Rosias, P.; Muris, J.; Dallinga, J.; Dompeling, E.; Van Schooten, F.J. Can exhaled volatile organic compounds predict asthma exacerbations in children? J. Breath Res. 2017, 11. [Google Scholar] [CrossRef] [PubMed]
- Shlomi, D.; Abud, M.; Liran, O.; Bar, J.; Gai-Mor, N.; Ilouze, M.; Onn, A.; Ben-Nun, A.; Haick, H.; Peled, N. Detection of Lung Cancer and EGFR Mutation by Electronic Nose System. J. Thorac. Oncol. 2017, 12, 1544–1551. [Google Scholar] [CrossRef] [PubMed]
- Lamote, K.; Brinkman, P.; Vandermeersch, L.; Vynck, M.; Sterk, P.J.; Van Langenhove, H.; Thas, O.; Van Cleemput, J.; Nackaerts, K.; van Meerbeeck, J.P. Breath analysis by gas chromatography-mass spectrometry and electronic nose to screen for pleural mesothelioma: A crosssectional case-control study. Oncotarget 2017, 8, 91593–91602. [Google Scholar] [CrossRef]
- Jareño-Esteban, J.J.; Muñoz-Lucas, M.Á.; Gómez-Martín, Ó.; Utrilla-Trigo, S.; Gutiérrez-Ortega, C.; Aguilar-Ros, A.; Collado-Yurrita, L.; Callol-Sánchez, L.M. Study of 5 Volatile Organic Compounds in Exhaled Breath in Chronic Obstructive Pulmonary Disease. Arch. Bronconeumol. (Engl. Ed.) 2017, 53, 251–256. [Google Scholar] [CrossRef]
- Oguma, T.; Nagaoka, T.; Kurahashi, M.; Kobayashi, N.; Yamamori, S.; Tsuji, C.; Takiguchi, H.; Niimi, K.; Tomomatsu, H.; Tomomatsu, K.; et al. Clinical contributions of exhaled volatile organic compounds in the diagnosis of lung cancer. PLoS ONE 2017, 12, e0174802. [Google Scholar] [CrossRef]
- Pizzini, A.; Filipiak, W.; Wille, J.; Ager, C.; Wiesenhofer, H.; Kubinec, R.; Blaško, J.; Tschurtschenthaler, C.; Mayhew, C.A.; Weiss, G.; et al. Analysis of volatile organic compounds in the breath of patients with stable or acute exacerbation of chronic obstructive pulmonary disease. J. Breath Res. 2018, 12. [Google Scholar] [CrossRef]
- Wang, M.; Sheng, J.; Wu, Q.; Zou, Y.; Hu, Y.; Ying, K.; Wan, H.; Wang, P. Confounding effect of benign pulmonary diseases in selecting volatile organic compounds as markers of lung cancer. J. Breath Res. 2018, 12. [Google Scholar] [CrossRef] [PubMed]
- Guirao, A.; Molins, L.; Ramón, I.; Sunyer, G.; Viñolas, N.; Marrades, R.; Sánchez, D.; Fibla, J.J.; Boada, M.; Hernández, J.; et al. Trained dogs can identify malignant solitary pulmonary nodules in exhaled gas. Lung Cancer 2019, 135, 230–233. [Google Scholar] [CrossRef] [PubMed]
- Rudnicka, J.; Kowalkowski, T.; Buszewski, B. Searching for selected VOCs in human breath samples as potential markers of lung cancer. Lung Cancer 2019, 135, 123–129. [Google Scholar] [CrossRef] [PubMed]
- Rodríguez-Aguilar, M.; Ramírez-García, S.; Ilizaliturri-Hernández, C.; Gómez-Gómez, A.; Van-Brussel, E.; Díaz-Barriga, F.; Medellín-Garibay, S.; Flores-Ramírez, R. Ultrafast gas chromatography coupled to electronic nose to identify volatile biomarkers in exhaled breath from chronic obstructive pulmonary diseases patients: A pilot study. Biomed. Chromatogr. 2019, 33, e4684. [Google Scholar] [CrossRef]
- Phillips, M.; Bauer, T.L.; Pass, H.I. Reply to Comment on “Volatile biomarker in breath predicts lung cancer and pulmonary nodules”. J. Breath Res. 2020, 14. [Google Scholar] [CrossRef] [PubMed]
- Phillips, M.; Bauer, T.L.; Cataneo, R.N.; Lebauer, C.; Mundada, M.; Pass, H.I.; Ramakrishna, N.; Rom, W.N.; Vallières, E. Blinded validation of breath biomarkers of lung cancer, a potential ancillary to chest CT screening. PLoS ONE 2015, 10, e0142484. [Google Scholar] [CrossRef] [PubMed]
- Ratiu, I.A.; Ligor, T.; Monedeiro, F.; Al-Suod, H.; Bocos-Bintintan, V.; Szeliga, J.; Jackowski, M.; Buszewski, B. Features of infected versus uninfected chemical profiles released from human exudates. Stud. Univ. Babes-Bolyai Chem. 2019, 64, 207–216. [Google Scholar] [CrossRef]
- Ratiu, I.A.; Bocos-Bintintan, V.; Monedeiro, F.; Milanowski, M.; Ligor, T.; Buszewski, B. An Optimistic Vision of Future: Diagnosis of Bacterial Infections by Sensing Their Associated Volatile Organic Compounds. Crit. Rev. Anal. Chem. 2019, 50, 501–512. [Google Scholar] [CrossRef]
- Mametov, R.; Ratiu, I.A.; Monedeiro, F.; Ligor, T.; Buszewski, B. Evolution and Evaluation of GC Columns. Crit. Rev. Anal. Chem. 2019, 1–24. [Google Scholar] [CrossRef]
- Ratiu, I.A.; Ligor, T.; Bocos-Bintintan, V.; Buszewski, B. Mass spectrometric techniques for the analysis of volatile organic compounds emitted from bacteria. Bioanalysis 2017, 9, 1069–1092. [Google Scholar] [CrossRef]
- Ratiu, I.A.; Al-Suod, H.; Ligor, M.; Ligor, T.; Krakowska, A.; Górecki, R.; Buszewski, B. Simultaneous Determination of Cyclitols and Sugars Following a Comprehensive Investigation of 40 Plants. Food Anal. Methods 2019, 12, 1466–1478. [Google Scholar] [CrossRef]
- Buszewski, B.; Raiu, I.A.; Milanowski, M.; Pomastowski, P.; Ligor, T. The effect of biosilver nanoparticles on different bacterial strains’ metabolism reflected in their VOCs profiles. J. Breath Res. 2018, 12, 027105. [Google Scholar] [CrossRef] [PubMed]
- Ratiu, I.A.; Bocos-Bintintan, V.; Turner, M.; Moll, V.H.; Lawrence Paul Thomas, C. Discrimination of chemical profiles of some bacterial species by analysing culture headspace air samples using TD-GC/MS. Curr. Anal. Chem. 2014, 10, 488–497. [Google Scholar] [CrossRef]
- Monedeiro, F.; Milanowski, M.; Ratiu, I.A.; Zmysłowski, H.; Ligor, T.; Buszewski, B. VOC profiles of saliva in assessment of halitosis and submandibular abscesses using HS-SPME-GC/MS technique. Molecules 2019, 24, 2977. [Google Scholar] [CrossRef]
- Malásková, M.; Henderson, B.; Chellayah, P.D.; Ruzsanyi, V.; Mochalski, P.; Cristescu, S.M.; Mayhew, C.A. Proton transfer reaction time-of-flight mass spectrometric measurements of volatile compounds contained in peppermint oil capsules of relevance to real-time pharmacokinetic breath studies. J. Breath Res. 2019, 13. [Google Scholar] [CrossRef]
- Malásková, M.; Olivenza-León, D.; Chellayah, P.D.; Martini, J.; Lederer, W.; Ruzsanyi, V.; Unterkofler, K.; Mochalski, P.; Märk, T.D.; Watts, P.; et al. Studies pertaining to the monitoring of volatile halogenated anaesthetics in breath by proton transfer reaction mass spectrometry. J. Breath Res. 2020, 14. [Google Scholar] [CrossRef]
- Ager, C.; Mochalski, P.; King, J.; Mayhew, C.A.; Unterkofler, K. Effect of inhaled acetone concentrations on exhaled breath acetone concentrations at rest and during exercise. J. Breath Res. 2020, 14. [Google Scholar] [CrossRef]
- Mochalski, P.; Shuster, G.; Leja, M.; Unterkofler, K.; Jaeschke, C.; Skapars, R.; Gasenko, E.; Polaka, I.; Vasiljevs, E.; Shani, G.; et al. Non-contact breath sampling for sensor-based breath analysis. J. Breath Res. 2019, 13. [Google Scholar] [CrossRef]
- Ghira, G.B.; Raţiu, I.A.; Bocoş-Binţinţan, V. Fast characterization of pyridine using ion mobility spectrometry and photoionization detection. Environ. Eng. Manag. J. 2013, 12, 251–256. [Google Scholar]
- Bocos-Bintintan, V.; Thomas, C.L.P.; Ratiu, I.A. Sensors’ array of aspiration ion mobility spectrometer as a tool for bacteria discrimination. Talanta 2020, 206, 120233. [Google Scholar] [CrossRef]
- Ratiu, I.A.; Bocos-Bintintan, V.; Patrut, A.; Moll, V.H.; Turner, M.; Thomas, C.L.P. Discrimination of bacteria by rapid sensing their metabolic volatiles using an aspiration-type ion mobility spectrometer (a-IMS) and gas chromatography-mass spectrometry GC-MS. Anal. Chim. Acta 2017, 982, 209–217. [Google Scholar] [CrossRef]
- Moll, V.; Bocoş-Binţinţan, V.; Raţiu, I.A.; Ruszkiewicz, D.; Thomas, C.L.P. Control of dopants/modifiers in differential mobility spectrometry using a piezoelectric injector. Analyst 2012, 137, 1458–1465. [Google Scholar] [CrossRef][Green Version]
- Ruszkiewicz, D.M.; Sanders, D.; O’Brien, R.; Hempel, F.; Reed, M.J.; Riepe, A.C.; Bailie, K.; Brodrick, E.; Darnley, K.; Ellerkmann, R.; et al. Diagnosis of COVID-19 by analysis of breath with gas chromatography-ion mobility spectrometry—a feasibility study. EClinicalMedicine 2020, 000, 100609. [Google Scholar] [CrossRef]
- Bocos-Bintintan, V.; Smolenschi, A.; Ratiu, I.-A. Rapid Determination of Indoor Air Contaminants in Shoe Shops using Photoionization Detectors. Stud. Univ. Babes-Bolyai Chem. 2016, 61, 203–212. [Google Scholar]
- Dragonieri, S.; Schot, R.; Mertens, B.J.A.; Le Cessie, S.; Gauw, S.A.; Spanevello, A.; Resta, O.; Willard, N.P.; Vink, T.J.; Rabe, K.F.; et al. An electronic nose in the discrimination of patients with asthma and controls. J. Allergy Clin. Immunol. 2007, 120, 856–862. [Google Scholar] [CrossRef]
- Dragonieri, S.; Annema, J.T.; Schot, R.; van der Schee, M.P.C.; Spanevello, A.; Carratú, P.; Resta, O.; Rabe, K.F.; Sterk, P.J. An electronic nose in the discrimination of patients with non-small cell lung cancer and COPD. Lung Cancer 2009, 64, 166–170. [Google Scholar] [CrossRef] [PubMed]
- Scarlata, S.; Finamore, P.; Santangelo, S.; Giannunzio, G.; Pennazza, G.; Grasso, S.; Santonico, M.; Incalzi, R.A. Cluster analysis on breath print of newly diagnosed COPD patients: Effects of therapy. J. Breath Res. 2018, 12. [Google Scholar] [CrossRef] [PubMed]
- Finamore, P.; Pedone, C.; Scarlata, S.; Di Paolo, A.; Grasso, S.; Santonico, M.; Pennazza, G.; Incalzi, R.A. Validation of exhaled volatile organic compounds analysis using electronic nose as index of COPD severity. Int. J. COPD 2018, 13, 1441–1448. [Google Scholar] [CrossRef]
- Bikov, A.; Lázár, Z.; Horvath, I. Established methodological issues in electronic nose research: How far are we from using these instruments in clinical settings of breath analysis? J. Breath Res. 2015, 9. [Google Scholar] [CrossRef] [PubMed]
- Scarlata, S.; Finamore, P.; Meszaros, M.; Dragonieri, S.; Bikov, A. The Role of Electronic Noses in Phenotyping Patients with Chronic Obstructive Pulmonary Disease. Biosensors 2020, 10, 171. [Google Scholar] [CrossRef] [PubMed]
- Mazzola, S.M.; Pirrone, F.; Sedda, G.; Gasparri, R.; Romano, R.; Spaggiari, L.; Mariangela, A. Two-step investigation of lung cancer detection by sniffer dogs. J. Breath Res. 2020, 14, 026011. [Google Scholar] [CrossRef] [PubMed]
- Reynolds, J.C.; Jimoh, M.A.; Guallar-Hoyas, C.; Creaser, C.S.; Siddiqui, S.; Thomas, C.L.P. Analysis of human breath samples using a modified thermal desorption: Gas chromatography electrospray ionization interface. J. Breath Res. 2014, 8. [Google Scholar] [CrossRef] [PubMed]
- Martinez, F.D. Genes, environments, development and asthma: A reappraisal. Eur. Respir. J. 2007, 29, 179–184. [Google Scholar] [CrossRef] [PubMed]
- Nathell, L.; Nathell, M.; Malmberg, P.; Larsson, K. COPD diagnosis related to different guidelines and spirometry techniques. Respir. Res. 2007, 8, 1–7. [Google Scholar] [CrossRef] [PubMed]
- Vogelmeier, C.F.; Criner, G.J.; Martinez, F.J.; Anzueto, A.; Barnes, P.J.; Bourbeau, J.; Celli, B.R.; Chen, R.; Decramer, M.; Fabbri, L.M.; et al. Global Strategy for the Diagnosis, Management and Prevention of Chronic Obstructive Lung Disease 2017 Report: GOLD Executive Summary. Respirology 2017, 22, 575–601. [Google Scholar] [CrossRef]
- Thun, M.J.; Hannan, L.M.; Adams-Campbell, L.L.; Boffetta, P.; Buring, J.E.; Feskanich, D.; Flanders, W.D.; Sun, H.J.; Katanoda, K.; Kolonel, L.N.; et al. Lung cancer occurrence in never-smokers: An analysis of 13 cohorts and 22 cancer registry studies. PLoS Med. 2008, 5, e185. [Google Scholar] [CrossRef]
- Rosti, G.; Bevilacqua, G.; Bidoli, P.; Portalone, L.; Santo, A.; Genestreti, G. Small cell lung cancer. Ann. Oncol. 2006, 17, ii5–ii10. [Google Scholar] [CrossRef]
- Kenfield, S.A.; Wei, E.K.; Stampfer, M.J.; Rosner, B.A.; Colditz, G.A. Comparison of aspects of smoking among the four histological types of lung cancer. Tob. Control 2008, 17, 198–204. [Google Scholar] [CrossRef]
- Denisenko, T.V.; Budkevich, I.N.; Zhivotovsky, B. Cell death-based treatment of lung adenocarcinoma article. Cell Death Dis. 2018, 9. [Google Scholar] [CrossRef]
- Naidoo, J.; Drilon, A. Molecular Diagnostic testing in Non-small Cell Lung Cancer. Am. J. Hematol. Oncol. 2014, 10, 1–11. [Google Scholar]
- Zago, G.; Muller, M.; Van Den Heuvel, M.; Baas, P. New targeted treatments for non-small-cell lung cancer- Role of nivolumab. Biol. Targets Ther. 2016, 10, 103–117. [Google Scholar] [CrossRef]
- Popper, H.H. Large cell carcinoma of the lung—A vanishing entity? Memo—Mag. Eur. Med. Oncol. 2011, 4, 4–9. [Google Scholar] [CrossRef]
- Aghdassi, E.; Allard, J.P. Breath alkanes as a marker of oxidative stress in different clinical conditions. Free Radic. Biol. Med. 2000, 28, 880–886. [Google Scholar] [CrossRef]
- Stefanuto, P.H.; Zanella, D.; Vercammen, J.; Henket, M.; Schleich, F.; Louis, R.; Focant, J.F. Multimodal combination of GC × GC-HRTOFMS and SIFT-MS for asthma phenotyping using exhaled breath. Sci. Rep. 2020, 10, 1–11. [Google Scholar] [CrossRef]
- Schleich, F.N.; Zanella, D.; Stefanuto, P.H.; Bessonov, K.; Smolinska, A.; Dallinga, J.W.; Henket, M.; Paulus, V.; Guissard, F.; Graff, S.; et al. Exhaled volatile organic compounds are able to discriminate between neutrophilic and eosinophilic asthma. Am. J. Respir. Crit. Care Med. 2019, 200, 444–453. [Google Scholar] [CrossRef]
- Lloyd, C.M.; Hessel, E.M. Functions of T cells in asthma: More than just TH2 cells. Nat. Rev. Immunol. 2010, 10, 838–848. [Google Scholar] [CrossRef]
- Kokoszka, J.; Nelson, R.L.; Swedler, W.I.; Skosey, J.; Abcarian, H. Determination of inflammatory bowel disease activity by breath pentane analysis. Dis. Colon Rectum 1993, 36, 597–601. [Google Scholar] [CrossRef]
- Chard, M.D.; Calvin, J.; Price, C.P.; Cawston, T.E.; Hazleman, B.L. Serum α1 antichymotrypsin concentration as a marker of disease activity in rheumatoid arthritis. Ann. Rheum. Dis. 1988, 47, 665–671. [Google Scholar] [CrossRef]
- Cailleux, A.; Cogny, M.; Allain, P. Blood isoprene concentrations in humans and in some animal species. Biochem. Med. Metab. Biol. 1992, 47, 157–160. [Google Scholar] [CrossRef]
- Ueta, I.; Mizuguchi, A.; Okamoto, M.; Sakamaki, H.; Hosoe, M.; Ishiguro, M.; Saito, Y. Determination of breath isoprene and acetone concentration with a needle-type extraction device in gas chromatography-mass spectrometry. Clin. Chim. Acta 2014, 430, 156–159. [Google Scholar] [CrossRef]
- King, J.; Koc, H.; Unterkofler, K.; Mochalski, P.; Kupferthaler, A.; Teschl, G.; Teschl, S.; Hinterhuber, H.; Amann, A. Physiological modeling of isoprene dynamics in exhaled breath. J. Theor. Biol. 2010, 267, 626–637. [Google Scholar] [CrossRef] [PubMed]
- Karl, T.; Prazeller, P.; Mayr, D.; Jordan, A.; Rieder, J.; Fall, R.; Lindinger, W. Human breath isoprene and its relation to blood cholesterol levels: New measurements and modeling. J. Appl. Physiol. 2001, 91, 762–770. [Google Scholar] [CrossRef] [PubMed]
- Friedman, M.I.; Preti, G.; Deems, R.O.; Friedman, L.S.; Munoz, S.J.; Maddrey, W.C. Limonene in expired lung air of patients with liver disease. Dig. Dis. Sci. 1994, 39, 1672–1676. [Google Scholar] [CrossRef] [PubMed]
- O’Hara, M.E.; Fernández Del Río, R.; Holt, A.; Pemberton, P.; Shah, T.; Whitehouse, T.; Mayhew, C.A. Limonene in exhaled breath is elevated in hepatic encephalopathy. J. Breath Res. 2016, 10. [Google Scholar] [CrossRef]
- Fernández del Río, R.; O’Hara, M.E.; Holt, A.; Pemberton, P.; Shah, T.; Whitehouse, T.; Mayhew, C.A. Volatile Biomarkers in Breath Associated With Liver Cirrhosis—Comparisons of Pre- and Post-liver Transplant Breath Samples. EBioMedicine 2015, 2, 1243–1250. [Google Scholar] [CrossRef]
- Amal, H.; Leja, M.; Broza, Y.Y.; Tisch, U.; Funka, K.; Liepniece-Karele, I.; Skapars, R.; Xu, Z.Q.; Liu, H.; Haick, H. Geographical variation in the exhaled volatile organic compounds. J. Breath Res. 2013, 7. [Google Scholar] [CrossRef]
- Janssens, E.; van Meerbeeck, J.P.; Lamote, K. Volatile organic compounds in human matrices as lung cancer biomarkers: A systematic review. Crit. Rev. Oncol. Hematol. 2020, 153, 103037. [Google Scholar] [CrossRef]
- Harshman, S.W.; Pitsch, R.L.; Davidson, C.N.; Scott, A.M.; Hill, E.M.; Smith, Z.K.; Strayer, K.E.; Schaeublin, N.M.; Wiens, T.L.; Brothers, M.C.; et al. Characterization of standardized breath sampling for off-line field use. J. Breath Res. 2020, 14. [Google Scholar] [CrossRef]


| Approach/ Comparison | Matrix/Sample | Cohort Size * | Patients (Smokers/Former/ Never) | Controls (Smokers/Former/ Never) | Organization | Reference |
|---|---|---|---|---|---|---|
| COPD vs. controls | mixed breath | 66 + 45 | 40/20/6 | 12/10/23 | University Hospital Maastricht; Centre for Integrated Rehabilitation Organ Failure, Horn, The Netherlands | [54] |
| Asthma vs. controls (children) | mixed breath | 63 + 57 | na | na | Department of Pediatric Pulmonology of University Hospital, Maastricht, Netherlands | [17] |
| Asthma vs. controls | mixed + alveolar breath | 27 + 24 | all non-smokers | all non-smokers | Istituto Dermopatico dell’ Immacolata, Rome (Italy) | [55] |
| Lung cancer vs. controls | mixed breath | 28 + 36 | 0/17/11 | 36 ^ | Forlanini Hospital, Roma, Italy. | [21] |
| Lung cancer vs. never vs. smoker vs. controls | alveolar breath | 12 + 12 + 12 | 0/12/0 | 12//0/12 | Department of pulmonology, University Rostock, Rostock, Germany | [56] |
| COPD vs. controls | alveolar breath | 20 + 6 | 18/2 ^ | 0/6 ^ | Medicines Evaluation Unit, Wythenshawe Hospital, Manchester, UK | [57] |
| Lung cancer vs. never vs. smoker vs. controls | alveolar breath | 31 + 31 + 31 | 0/29/2 | 31/0/31 | Department of pneumology of local hospitals from Rostock, Germany and Innsbruck, Austria | [48] |
| Lung cancer vs. controls | alveolar breath | 30 + 22 | not specified | not specified | Oncology Division, Rambam Health Care Campus, Haifa, Israel | [58] |
| Lung cancer vs. non-smokers | mixed breath | 40 + 38 | 21/12/7 | 0/10/28 | Thoracic Surgery Section of the University Hospital of Parma, Italy | [59] |
| Lung cancer vs. controls | mixed breath | 43 + 41 | 0/21/22 | 0/0/41 | Affiliated Hospital of Anhui Medical University, Hefei, Anhui, China. | [60] |
| Asthma vs. control (children) | mixed breath | 35 + 15 | na | na | Department of Paediatric Immunoalergology of Hospital D. Pedro, Aveiro, Portugal | [61] |
| Asthma vs. controls | mixed breath + sputum | 35 + 23 | 0/1/34 | 0/0/23 | Medicines Evaluation Unit, Wythenshawe Hospital, Manchester, UK | [47] |
| Emphysema/COPD vs. controls | alveolar breath | 43 + 161 | ns | ns | Institute for Molecules and Materials, Radboud University, Nijmegen, the Netherlands | [32] |
| Asthma vs. COPD | mixed breath | 60 + 40 | No healthy controls | 5/51/4 COPD:13/0/27 | Academic MC Amsterdam; Haga Teaching Hospital; Albert Schweitzer Hospital, Dordrecht, the Netherlands | [38] |
| COPD with AATD vs. COPD vs. controls | exhaled breath condensate | 10 + 23 + 10 | 3/30/0 | 0/2/8 | Philipps University Marburg; Ludwig Maximilians University Munich; Saarland University Hospital, Homburg/Saar, Germany | [39] |
| Lung cancer vs. controls | mixed breath | 23 + 30 | 2/0/21 | 6/0/24 | Department of Lung Disease, Collegium Medicum, Nicolaus Copernicus University, Torun, Poland | [62] |
| Lung cancer vs. controls | alveolar breath | 137 + 143 | ns/ns/ns | 102/ns/41 | Department of Lung Disease, Collegium Medicum, Nicolaus Copernicus University, Torun, Poland | [22] |
| Asthma vs. controls (children) | mixed breath | 32 + 27 | na | na | The Hospital Infante D. Pedro E.P.E, Aveiro, Portugal | [46] |
| COPD vs. controls | breath + sputum | 39 + 32 | 12/27/0 | 10/0/22 | Medicines Evaluation Unit, University Hospital of South Manchester, UK. | [63] |
| COPD vs. COPD with BC vs. controls | alveolar breath | 30 + 54 + 35 | ns/ns/ns | ns/ns/ns | KIST Europe; Max Planck Institute; Cluster of Excellence for Multimodel Computing and Interaction; Saarland University, Germany | [35] |
| COPD vs. controls | alveolar breath | 119 + 63 | 41/78/0 | 6/18/39 | Respiratory Unit, Prince Philip Hospital, Llanelli, UK | [14] |
| COPD vs. asthma vs. controls | exhaled breath condensate | 17 + 20 + 7 | 5/16/16 | 0/3/4 | Patients recruited from hospital out-patient clinics; controls from the community in Sydney, Australia. | [40] |
| Lung cancer vs. controls | alveolar breath | 29 + 44 | ns/ns/ns | ns/ns/ns | Department of Lung Disease, Collegium Medicum, Nicolaus Copernicus University, Torun, Poland | [44] |
| Lung cancer vs. controls | mixed breath | 92 + 137 | 25/58/9 | 28/71/35 | Outpatient clinic from Cleveland Clinic, Cleveland, Ohio | [64] |
| Asthma vs. controls (children) | alveolar breath | 11 + 12 | na | na | Inaccessible for authors; study developed in UK | [65] |
| Asthma with exacerbation vs. asthma (children) | mixed breath | 16 + 26 | na | na | Outpatient clinic, Department of Pediatric Pulmonology, Maastricht University Medical Centre, Maastricht, the Netherlands | [45] |
| Lung cancer vs. controls | mixed breath | 22 + 10 | 19 #/3 | 0/10 ^ | Local hospitals from Linköping, Sweden. | [66] |
| Lung cancer vs. BPD vs. controls | mixed breath | 97 + 32 + 88 | ns/ns/ns | 45/43 ^ | James Graham Brown Cancer Center, University of Louisville, Louisville, Kentucky | [67] |
| Asthma vs. controls | mixed breath | 195 + 40 | ns/ns/ns | ns/ns/ns | High Altitude Clinic, Davos-Wolfgang, Switzerland | [43] |
| Lung cancer vs. BPD vs. controls | mixed breath | 107 + 40 + 88 | 56/65/12 | 45/0/43 | Unmentioned; study developed in Louisville, Kentucky | [68] |
| Lung cancer vs. controls | mixed breath | 50 + 39 | 33 #/17 | 7 #/32 | St. Marianna University School of Medicine, Kanagawa, Japan | [36] |
| Lung cancer vs. controls | mixed breath | 13 + 25 | ns/ns/ns | ns/ns/ns | Shanghai Chest Hospital, Shanghai, China | [69] |
| Lung cancer vs. BPD vs. controls | alveolar breath | 79 + 54 + 38 | 15/40/24 | 9/20/9 12/25/17 (BPD) | Sir Run Run Shaw Hospital, Hangzhou, China | [70] |
| COPD vs. smoker vs. non-smoker controls | alveolar breath | 45 + 23 + 28 | 5/40/0 | 11/12/28 | Department of Pneumology, Ruhrlandklinik, University Hospital of Essen, Germany | [18] |
| Lung cancer vs. BPD vs. smoker vs. non-smoker controls | mixed breath | 85 + 34 + 45 + 40 | 45/34/2/4 λ | 45/0/40 10/7/7/10 λ (BPD) | James Graham Brown Cancer Center, University of Louisville, Louisville, Kentucky | [71] |
| Lung cancer vs. controls | mixed breath | 13 + 25 | 5/8 ^ | 8/17 ^ | Shanghai Chest Hospital, Shanghai, China | [72] |
| Lung cancer vs. BPD vs. controls | mixed breath | 165 + 65 + 194 | 69/80/7 | 25/20/20 (BPD) 73/41/80 | Unmentioned; study developed in Louisville, Kentucky | [73] |
| COPD vs. controls | mixed breath | 89 + 101 | 37/52/0 | 49/52 ^ | Local hospitals in Marburg & Hannover, Germany. | [19] |
| COPD vs. controls | alveolar breath | 79 + 73 | 42/37 ^ | 41/32 ^ | Unmentioned; study developed in Germany | [37] |
| MPM vs. AEx vs. controls | alveolar breath | 23 + 22 + 21 | 9/5/9 (MPM) | 5/5/12 (AEx) 13/0/8 | University Hospitals of Ghent, Leuven and Antwerp, Belgium | [74] |
| Lung cancer vs. controls | mixed breath | 21 + 22 | 4/7/10 | 9/5/8 | Unmentioned; study developed (probably) in Israel | [33] |
| Lung cancer vs. controls | mixed breath | 37 + 23 | 21/14/2 | 4/7/12 | ELK Berlin Chest Hospital and Charité Universitäts Medizin, Visceral, Vascular and Thoracic Surgery, Berlin, Germany | [75] |
| Asthma vs. asthma with exacerbations (children) | mixed breath | 49 + 45 | na | na | Outpatient clinic of 2 specialized pediatric pulmonology centers in the Netherlands | [76] |
| Lung cancer vs. BPD | alveolar breath | 89 + 30 | 16/56/17 | 14/10/6 | Sheba Medical Center, Tel Hashomer, Israel. | [77] |
| MPM vs. AEx vs. controls | mixed breath | 14 + 19 + 16 | 1/9/4 | 6/7/6 (AEx) 0/8/8 | Three participating university hospitals from Belgium | [78] |
| COPD vs. never vs. former vs. smokers | alveolar breath | 57+ 33 + 28 + 39 | 8/49/0 | 32/28/39 | Hospital Central de la Defensa “Gomez Ulla”, Madrid, Spain | [79] |
| Lung cancer vs. controls | mixed breath | 116 + 37 | 42/51/23 | 2/5/30 | Tokai University Hospital, Kanagawa, Japan | [80] |
| Lung cancer vs. controls | alveolar breath | 107 + 29 | 47/15/45 | 5/3/21 | Aichi Cancer center, Nagoya Japan | [16] |
| AECOPD vs. COPD vs. controls | alveolar breath | 14 + 16 + 24 | 6/7/1 (AECOP) | 3/13/0 (COPD) 7/0/17 | Department of Internal Medicine II, Medical University of Innsbruck, Austria | [81] |
| COPD vs. controls | exhaled breath condensate | 22 + 14 | 10/11/1 | 5/8/1 | Unmentioned; study developed in Switzerland | [20] |
| Lung cancer vs. BPD vs. controls | alveolar breath | 233+ 111 + 140 | 102/45/86 | 41/16/54 (BPD) 69/16/55 | Sir Run Run Shaw Hospital, Hangzhou, China | [82] |
| Lung cancer vs. controls | alveolar breath | 37 + 48 | 9/15/13 | 4/10/34 | Seoul National University Bundang Hospital, Republic of Korea | [15] |
| Lung cancer vs. controls | mixed breath | 57 + 72 | 22/35 ^ | 25/47 ^ | First Affiliated Hospital of Jinan University, Guangdong, China | [41] |
| Lung cancer vs. COPD vs. controls | mixed breath | 30 + 18 + 61 | 12/16/2 | 10/8/0 (COPD) 13/21/27 | Hospital Clinic and Hospital Universitari Sagrat Cor of Barcelona, Spain. | [83] |
| Lung cancer vs. controls | mixed breath | 30 +30 | 19/11 ^ | 5/25 ^ | Chinese People’s Liberation Army General Hospital, Beijing, China | [34] |
| Lung cancer vs. controls | alveolar breath | 108 + 121 | 69/39 ^ | 50/71 ^ | Department of Lung Disease, Collegium Medicum, Nicolaus Copernicus University, Torun, Poland | [84] |
| Asthma vs. CF vs. controls (children) | mixed breath | 20 + 13 + 22 | na | na | Maastricht UMC & Department of Paediatric Respiratory Medicine, Maastricht, Netherlands | [42] |
| COPD vs. controls | mixed breath | 25 + 33 | 4/10/11 | 3/7/23 | Outpatient clinic in Hospital Central “Dr. Ignacio Morones Prieto”, San Luis Potosi, Mexico | [85] |
| Lung cancer vs. controls | alveolar breath | 462 | ns/ns/ns | ns/ns/ns | five medical centers in USA | [86] |
| Lung cancer vs. controls | mixed breath | 15 + 14 | 3/12/0 | 1/6/7 | University hospital of Liège, Belgium | [13] |
| First Author/ Year [Ref] | Diseases | Observations and Details of Diseases | Analytical Platform | Outcomes | Statistical Approach/Representation | Accuracy (%) * |
|---|---|---|---|---|---|---|
| Van Berkel, 2010 [54] | COPD | steroid-naïve patients | TD-GC-ToF-MS | 1179 VOCs; 12 identified markers | SVMs; John Platt’s SMO; RF | - |
| Dallinga, 2010 [17] | Asthma | children; atopy; allergy | GC-MS | 945 VOCs; 10 discriminative VOCs | DA | 92–100 |
| Montuschi, 2010 [55] | Asthma | intermittent & persistent mild; atopy | GC-MS + E-nose | FENO monitoring | t test; Mann-Whitney U test; feed-forward neural network; PCA | DP: 70.8–95.8 |
| D’Amico, 2010 [21] | Lung cancer | Adenocarcinoma, SCLC, bronchio-alveolar & squamous cell carcinoma | E-nose + GC-MS | pattern of VOCs | PLS-DA; PLS-LVs | 79–86 |
| Fuchs, 2010 [56] | Lung cancer | SCLC & NSCLC | SPME-OFD—GC-MS | 10 discriminative aldehydes | Kruskal–Wallis one-way ANOVA; Box plot. | - |
| Basanta 2010 [57] | COPD | GOLD I to IV, exacerbation, eosinophilia | GC-DMS | VOCs profile | Pearson chi square, students t-test, Mann Whitney U, PCA, ROC, DFA, Pearson’s correlation coefficient | 76–84 AUC: 79–92 |
| Kischkel, 2010 [48] | Lung cancer | SCLC & NSCLC | GC-MS | 42 VOCs, 4 identified markers | Mann–Whitney Rank test; ANOVA; post hoc Student–Newman–Keuls; Dunn’s Method; PCA, | - |
| Peng, 2010 [58] | Lung cancer | Stage I to IV | GC-MS & GNPs nanosensor array | pattern of VOCs | PCA | - |
| Poli, 2010 [59] | Lung cancer | Stage I or II; NSCLC | SPME-OFD–GC-MS | 7 identified markers (aldehydes) | ANOVA; ANCOVA; Tukey’s post hoc test; DA (Wilks’ Lambda). | AC: 93–97 OCC:92 |
| Song, 2010 [60] | Lung cancer | Stage I to IV; squamous cell, adenocarcinoma | GC-MS | VOCs profile; 2 selected markers | Wilcoxon rank sum test; ROC | AUC: 94–96 |
| Caldeira, 2011 [61] | Asthma | Children; allergic & allergic rhinitis | GC–qMS | 44 VOCs; 28 discriminative VOCs | ANOVA; PLS; PLS–DA; | CVA: 88 |
| Ibrahim, 2011 [47] | Asthma | Eosinophilia; neutrophilia | GC-MS | 47 discriminative VOCs | MLR, PCA, Box plot; ROC | CVA: 82 AUC: 90–98 |
| Cristescu, 2011 [32] | COPD | GOLD I to III; emphysema | PTR-MS | 31 discriminative VOCs | logistic regression, ROC | AUC: 0.56 |
| Fens 2011 [38] | Asthma & COPD | fixed & classic asthma; COPD GOLD stages II & III | E-nose | pattern of VOCs | CDA; PCA, ROC | AUC: 93–95 |
| Hattesohl 2011 [39] | COPD | with & without alpha 1-antitrypsin deficiency | E-nose | pattern of VOCs | LDA, Mahalanobis distance, Mann–Whitney U-test, Wilcoxon signed rank | CVA: 58.5–80.5 |
| Rudnicka 2011 [62] | Lung cancer | SCLC, squamous cell, adenocarcinoma | GC–TOF/MS | 55 VOCs | Mann–Whitney U test DA, FA | - |
| Ulanowska, 2011 [22] | Lung cancer | Adenocarcinoma; Planoepitheliale. | GC/MS | VOCs profile; 14 identified markers | DA, FA, CHAID tree | - |
| Caldeira, 2012 [46] | Asthma | Children; allergic & allergic rhinitis | GC×GC–ToF-MS | 134 VOCs; 6 identified markers | PLS-DA, MCCV | - |
| Basanta 2012 [63] | COPD | GOLD I to IV | GC-ToF-MS | 487 VOCs 11 discriminative VOCs | Mann Whitney U, DFA, LOOCV, PCA, ROC | 69; AUC:74–95 |
| Hauschild 2012 [35] | COPD & BC | ns | MCC/IMS | VOCs profile; 20 discriminative VOCs | Decision tree, linear SVM, naive Bayes, neural net, radial SVM, RF | 82–94; AUC: 80–92 |
| Phillips, 2012 [14] | COPD | GOLD I to IV, emphysema | GC-MS | VOCs profile | 12 automatic classifier methods; with 8 stand-alone classifiers, and 2 ensemble techniques | 71–82; AUC: 71–82 |
| Timms 2012 [40] | Asthma & COPD | both with & without gastro-oesophageal reflux | E-nose | pattern of VOCs | PCA, Mahalanobis distance, Mann–Whitney, Kruskal–Wallis & t tests | 65–85 |
| Buszewski, 2012 [44] | Lung cancer | SCLC & NSCLC | GC-ToF-MS & canine recognition | VOCs profile | Kruskal–Wallis test, chi2 test, factor analysis, PCA | - |
| Mazzone, 2012 [64] | Lung cancer | Stage I to IV; SCLC, NSCLC, squamous cell, adenocarcinoma | colorimetric sensor array | bio-signatures of lung cancer | ROC, t-tests, Pearson test, four logistic prediction models | 46–89; AUC:81–85 |
| Gahleitner, 2013 [65] | Asthma | Children; | GC-MS | VOCs profile; 8 identified markers; | PLS-DA, PCA, Whisker box plots, two-tailed t-test, | - |
| Robroeks, 2013 [45] | Asthma | Children; atopy, exacerbations | GC-TOF-MS | VOCs profile; 6 discriminative VOCs | SMV, t-test, Friedman test | 64–100 |
| Schmekel, 2014 [66] | Lung cancer | Stage III & IV; SCLC, NSCLC, adenocarcinoma, squamous cell | E-nose | pattern of VOCs | AAN, PLS | CVA:98 |
| Fu, 2014 [67] | Lung cancer | Stage I to IV; SCLC, NSCLC, adenocarcinoma, squamous cell | FT-ICR-MS | Detection of C1 to C12 carbonyls; 4 identified markers | Wilcoxon test, box plot | - |
| Meyer, 2014 [43] | Asthma | asthma endotypes & phenotypes | GC-MS | 945 detected VOCs; 16 discriminative VOCs | cluster analyses | 83–95; DP: 98–99 |
| Bousamra, 2014 [68] | Lung cancer | BPD & cancer stage 0, I, II | FT-ICR-MS | Detection of carbonyls; 4 identified markers | Wilcoxon test, box plot | - |
| Handa, 2014 [36] | Lung cancer | Stage I to IV; squamous cell, adenocarcinoma, SCLC | MCC-IMS | 115 VOCs, 9 identified markers | Box-and-Whisker plots, Wilcoxon-Mann-Whitney test, | - |
| Ma, 2014 [69] | Lung cancer | Stage III & IV | GC×GC-FID | quantification of benzene series; 5 identified markers | Mann–Whitney U Test, Wilcoxon W test, PLS-DA | - |
| Zou, 2014 [70] | Lung cancer | Stage I to IV; SCLC, NSLC, adenocarcinoma, squamous cell, Adeno-squamous carcinoma | GC-MS | 5 identified markers | Pearson’s χ2 test, Mann–Whitney test, ROC, PCA | AUC: 0.67–0.88 |
| Besa, 2015 [18] | COPD | GOLD I to IV | MCC/IMS | 224 VOCs; 6 discriminative VOCs | Kolmogorov–Smirnov test, one way ANOVA, Kruskal–Wallis test, t-test, Mann–Whitney U-tests | 67–71 |
| Li, 2015 [71] | Lung cancer | SCLC, NSLC, squamous cell, adenocarcinoma, | FT-ICR-MS | Detection of C1 to C10 carbonyls; 6 identified markers | Kruskal–Wallis test, boxplot, PLS, SVM, RF, LDA, ROC | 89–97 |
| Ma, 2015 [72] | Lung cancer | ns | TD-GC-MS; | 5 identified markers | quantification with standards | - |
| Schumer, 2015 [73] | Lung cancer | Stage I to IV; SCLC, NSLC, squamous cell, carcinoid, large cell, adenocarcinoma in situ, adenocarcinoma | FT-ICR-MS | 4 identified markers (carbonyls) | Not specified | 69 |
| Gaida, 2016 [19] | COPD | GOLD III & IV | GC-MS | 134 VOCs; 14 identified markers | t-test, ANOVA, Newman–Keuls test, LDA, | CVA: 78–86 |
| Allers, 2016 [37] | COPD | Not specified | GC-IMS & GC-APCI-MS | 45 VOCs (by GC-IMS) & 102 (by GC-APCI-MS); | Welch’s t-test, Welch’s t-test, Box-and-whisker plots | - |
| Lamote, 2016 [74] | Lung cancer | MPM; AEx | MCC-IMS | pattern of VOCs | Fisher’s exact-test, Kruskall–Wallis test, One-way ANOVA, ROC, LOOCV | 76–87; AUC:17–94 |
| Feinberg, 2016 [33] | Lung cancer | Naïve LC patients; Stage III & IV; SCLC, squamous cell, adenocarcinoma | PTR-MS | pattern of VOCs | paired two-tailed Student t-test, box plot | - |
| Schallschmidt 2016 [75] | Lung cancer | Not specified | GC-MS | 24 quantified VOCs; 7 markers | Mann–Whitney U-test, LDA, LOOCV, Box plot, Cluster analysis, | - |
| van Vliet, 2017 [76] | Asthma | Children, exacerbation, atopy | GC-ToF-MS | 7 identified markers | RF, ROC, PCA | OCC: 82 AUC: 90 |
| Shlomi, 2017 [77] | Lung cancer | Stage: I to IV; | E-nose | pattern of VOCs | DFA, LOOCV, Wilcoxon test, ANOVA, chi-square test | 76-87 |
| Lamote, 2017 [78] | Lung cancer | Naïve MPM, pleural plaques | GC-MS, E-nose | VOCs profile; 6 identified markers; | DA, ROC | 50–97; AUC: 36–98 |
| Jareno-Esteban, 2017 [79] | COPD | Not specified | GC-MS | 5 VOCs with discriminative features | Kolmogorov–Smirnov test | - |
| Oguma, 2017 [80] | Lung cancer | Stage: I to IV; SCLC, NSLC, squamous cell, adenocarcinoma | GC-MS | Quantification of 14 pre-stabilized VOCs; 2 markers | ROC, Mann–Whitney U-test, Kruskal–Wallis test, Wilcoxon’s rank test, Jonckheere–Terpstra test | AUC: 67–71 |
| Sakumura, 2017 [16] | Lung cancer | Stage: I to IV | GC-MS | 63 VOCs, 20 discriminative VOCs | Wilcoxon test, Kolmogorov–Smirnov test, SVM, LOOCV | AC: 89; DP: 84.6 |
| Pizzini, 2018 [81] | COPD | GOLD: II, III & IV; AECOPD, stable COPD | GC-MS | 105 VOCs; 12 identified markers | One way ANOVA, post hoc analysis, RF | AUC: 92–97 |
| Bregy, 2018 [20] | COPD | GOLD: I to IV | SESI-HRMS | 1441 detected VOCs; 43 discriminative VOCs | LOOCV, PCA, Venn diagram, ROC | 89 |
| Wang, 2018 [82] | Lung cancer | Not specified | TD-GC-MS SPME-GC-MS | pattern of VOCs; 12 identified markers | chi-square, ROC | 77–83 AUC: 73–88 |
| Chang, 2018 [15] | Lung cancer | Stage: I to IV; squamous cell; adenocarcinoma | seven metal oxide gas sensors | pattern of VOCs | SVM, LDA, PCA | 61–75 |
| Cai, 2018 [41] | Lung cancer | SCLC & NSLC | E-nose | pattern of VOCs | Mann-Whitney U test, chi-square test, ANOVA, ROC, | 76/94/83 |
| Guirao, 2019 [83] | Lung cancer & COPD | Stage: I & II; SCLC, NSLC, lepidic adenocarcinoma, adenocarcinoma, squamous cell | Trained dogs | Pattern recognition | ROC | AUC: 0.98 |
| Sun, 2019 [34] | Lung cancer | squamous cell, adenocarcinoma | PTR-MS | 5 discriminative VOCs | Mann–Whitney U test, LDA, whisker box plot, ROC | AUC: 0.74–0.99 |
| Rudnicka, 2019 [84] | Lung cancer | Stage: I to IV; SCLC, NSLC | GC–TOF/MS | 86 VOCs; | Mann–Whitney U test, DFA, FA, AAN, BOX PLOT, ROC | AUC: 0.86 |
| Bannier, 2019 [42] | asthma | moderate to severe asthma & children with CF | E-nose | pattern of VOCs | AAN, ROC, LOOCV, | AUC: 0.79–90 |
| Rodríguez-Aguilar 2019 [85] | COPD | GOLD: I to IV | FCG E-nose | 62 VOCs; 17 discriminative VOCs; | Student test t, Mann–Whitney U-test, Fisher test, SPCA, ROC, LOOCV | OCC: 82; |
| Phillips, 2019 [86] | Lung cancer | Not specified | GC-MS | pattern of VOCs | ROC | 80-88; AUC: 77–88; |
| Pesesse, 2019 [13] | Lung cancer | Not specified | TD-GC-GC×GC-ToF-MS | 37 VOCs with discriminative features | Fisher test, PCA, RF | - |
| No | First Author/ Reference | Marker of | Detected Markers | Concentration in Patients * | Concentration in Controls * | Unit | p-Value | ||||
|---|---|---|---|---|---|---|---|---|---|---|---|
| Smokers | Former | Never | Smokers | Former | Never | ||||||
| 1 | Van Berkel, [54] | COPD | 12 VOCs (nq) | 2,4,6-trimethyl-decane; 2,6-dimethyl-heptane; 3,7-dimethyl 1,3,6 octatriene; 4,7-dimethyl-undecane; 4-methyl-octane; benzonitrile; hexadecane; hexanal; isoprene; octadecane; terpineol; undecane | |||||||
| 2 | Fuchs, [56] | LC | hexanal | - | 1.632 | - | 0 | - | 0.172 | ng/L | - |
| nonanal | - | 1.768 | - | 0 | - | 0 | - | ||||
| octanal | - | 6.652 | - | 0.768 | - | 1.407 | - | ||||
| pentanal | - | 33.957 | - | 12.077 | - | 4.689 | - | ||||
| 3 | Kischkel, [48] | LC | dimethyl sulphide | - | 0.27 | - | 0.27 | - | 0.3 | nmol/L | =0.002 |
| dimethyl formamide | - | 5589.5 | - | 1403 | - | 558.5 | counts | =0.003 | |||
| propanal | - | 0.34 | - | 0 | - | 0 | nmol/L | <0.001 | |||
| butanal | - | 6.47 | - | 1.06 | - | 1.41 | nmol/L | <0.001 | |||
| 4 | Poli, [59] | LC | propanal | - | 49.8 | 66.3 | - | - | 24.4 | pM1 | =0.006 |
| butanal | - | 23.6 | 28.6 | - | - | 10.8 | <0.001 | ||||
| pentanal | - | 17.1 | 20.3 | - | - | 8.2 | <0.001 | ||||
| hexanal | - | 38.2 | 35.9 | - | - | 10.3 | <0.001 | ||||
| heptanal | - | 15.4 | 17.0 | - | - | 6.9 | <0.001 | ||||
| octanal | - | 26.9 | 22.4 | - | - | 11.6 | <0.001 | ||||
| nonanal | - | 51.7 | 36.5 | - | - | 13.3 | <0.001 | ||||
| 5 | Song, [60] | LC | 1-butanol | 2.21–30.31 | - | - | - | - | 0.32–13.97 | ng/L | <0.005 |
| 3-hydroxy-2-butanone | 1.95–50.3 | - | - | - | - | >6.21 | <0.005 | ||||
| 6 | Cristescu, [32] | asthma | 30 proposed VOCs (nq) | 1-(3-pyridinyl)-ethanone; 1-(4-pyridinyl)-ethanone; 1,2,3,5-tetramethylbenzene; 3-pentanone; 1,2,3-trimethylbenzene; 1,2,4,5-tetramethylbenzene; 1,2,-diethylbenzene; 1,3,-diethylbenzene; 1,4,-diethylbenzene; 2-(1-methylethyl)-pyridine; 2,3-butanedione; 2,6-dimethyl-benzenamine; 2-methyl-3-buten-2-ol; 2-methylbutanal; 2-pentanone; 2-propyl-pyridine; 3-methyl-2-butanone; 3-methyl-2-buten-1-ol; 3-methyl-3-buten-1-ol; sec-butylbenzene; pentanal; 3-methylbutanal; 4-aminobenzenecarbonal; benzamide; benzeneethanamine; chloramine; N,N-dimethyl-benzenamine; butylbenzene; n-ethyl-benzenamine; propiolonitrile; | |||||||
| 7 | Ulanowska, [22] | LC # | ethanol | 466.9 | - | - | 286.4 | - | 188.5 | ppb | <0.005 |
| acetone | 358.6 | - | - | 330.2 | - | 225.7 | |||||
| butane | 90.3 | - | - | 25.8 | - | 56.2 | |||||
| dimethyl sulfide | 11.9 | - | - | 9.2 | - | 9.3 | |||||
| isoprene | 100.3 | - | - | 61.5 | - | 70.8 | |||||
| propanal | 7.8 | - | - | 6.7 | - | 6.9 | |||||
| 1-propanol | 54.8 | - | - | 17.0 | - | 6.6 | |||||
| 2-pentanone | 7.5 | - | - | 5.3 | - | 4.8 | |||||
| furan | 4.7 | - | - | 4.3 | - | 3.7 | |||||
| o-xylene | 22.1 | - | - | 18.7 | - | 17.4 | |||||
| ethylbenzene | 19.6 | - | - | 10.4 | - | 10.4 | |||||
| pentanal | 5.9 | - | - | 0 | - | 0 | |||||
| hexanal | 4.5 | - | - | 0 | - | 0 | |||||
| nonane | Not quantified | ||||||||||
| 8 | Caldeira, [46] | asthma | 6 proposed VOCs (Nq) | 2,2,4,6,6-pentamethylheptane, 3,6-dimethyldecane, decane, dodecane, nonane, tetradecane | |||||||
| 9 | Phillips, [14] | COPD | isoprene | 97.6 | 92.3 | - | - | - | 96.5 | Occurrence rate (%) | - |
| acetic acid | 92.2 | 96.2 | - | - | - | 94.7 | |||||
| benzaldehyde | 100 | 100 | - | - | - | 100 | |||||
| benzene | 100 | 98.7 | - | - | - | 100 | |||||
| carbon dioxide | 100 | 100 | - | - | - | 100 | |||||
| hexanal | 90.2 | 94.9 | - | - | - | 0 | |||||
| toluene | 100 | 93.6 | - | - | - | 0 | |||||
| 1-heptenal | 46.3 | 1.3 | - | - | - | 0 | |||||
| sulphur dioxide | 71.1 | 80.3 | - | - | - | 63.2 | |||||
| 1,3,5-cycloheptatriene | 4.9 | 28.2 | - | - | - | 0 | |||||
| 10 | Buszewski, [44] | LC | acetone | 44.2–53.45 | - | - | 34.57–390 | - | - | ppb | <0.005 |
| benzene | 1.38–14.97 | - | - | 1.29–3.82 | - | - | <0.005 | ||||
| butanal | 1.35–1.87 | - | - | 1.32–2.55 | - | - | <0.001 | ||||
| 2-butanone | 1.35–3.18 | - | - | 1.35–2.86 | - | - | <0.001 | ||||
| ethyl acetate | 1.12–8.22 | - | - | 3.98 -22.89 | - | - | <0.001 | ||||
| ethylbenzene | 2.22–18.38 | - | - | 1.45–3.16 | - | - | <0.001 | ||||
| furan | 1.67–3.25 | - | - | 1.53–2.81 | - | - | <0.005 | ||||
| 2-pentanone | 1.80–4.11 | - | - | 3.25–8.77 | - | - | <0.001 | ||||
| propanal | 1.56–3.44 | - | - | 1.56–3.74 | - | - | <0.001 | ||||
| 1-propanol | 0 | - | - | 4.37–13.15 | - | - | <0.001 | ||||
| 2-propanol | 3.21–4.17 | - | - | 3.32–7.19 | - | - | <0.001 | ||||
| 2-propenal | 5.10–9.57 | 6.84–94.36 | <0.005 | ||||||||
| 11 | Gahleitner, [65] | asthma | 8 proposed markers (nq) | 1-(methylsulfanyl)propane; octadecyne; 1,4-dichlorobenzene; 1,7-dimethylnaphtalene; 1-isopropyl-3-methylbenzene; 2-octenal; 4-isopropenyl-1-methylcyclohexene; ethylbenzene; | |||||||
| 12 | Fu, [67] | LC # | 2-butanone | 1.78–8.38 | - | - | 0.45–2.34 | - | nmol/L | <0.001 | |
| 3-hydroxy-2-butanone | 0.13–077 | - | - | 0.02–0.15 | - | - | <0.001 | ||||
| 2-hydroxyacetaldehyde | 0.23–1.13 | - | - | 0.03–0.45 | - | - | <0.001 | ||||
| 4-hydroxyhexenal | 0.005–0.05 | - | - | 0.007–0.09 | - | - | <0.005 | ||||
| 13 | Bousamra, [68] | LC # | 2-butanone | ~ 3.3 | - | - | ~ 1.8 | - | - | nmol/L | <0.001 |
| 3-hydroxy-2-butanone | ~ 0.25 | - | - | ~ 0.1 | - | - | <0.001 | ||||
| 2-hydroxyacetaldehyde | ~ 0.3 | - | - | ~ 0.2 | - | - | <0.001 | ||||
| 4-hydroxyhexenal | ~ 0.3 | - | - | ~ 0.15 | - | - | <0.001 | ||||
| 14 | Handa, [36] | LC | 9 proposed markers (nq) | 2-metylbutylacetat; 3-methyl-1-butanol; ethylbenzol; heptanal; hexanal; iso-propylamin; n-dodecane; cyclohexanone | <0.01 to <0.001 | ||||||
| 15 | Ma, [69] | LC # | Toluene | 22.01–291.6 | - | - | 18.86–99.8 | - | - | ng/L | - |
| ethylbenzene | 14–85.67 | - | - | 3.76–218.1 | - | - | - | ||||
| p-xylene + m-xylene | 9.33–82.5 | - | - | 0.82–55.39 | - | - | - | ||||
| o-xylene | 2.93–14.8 | - | - | 1.31–23.0 | - | - | - | ||||
| isopropyl benzene | 0.24–0.86 | - | - | 0.19–0.67 | - | - | - | ||||
| 16 | Zou, [70] | LC | 5 proposed markers (nq) | 2, 6, 11-trimethyl-dodecane; 5-(2-methyl-) propyl- nonane; hexadecanal; 8-hexyl- pentadecane; 2,6-di-tert-butyl-, 4-methyl- phenol | <0.001 to 0.022 | ||||||
| 17 | Li, [71] | LC | 2-butanone | ~3.5 | - | - | ~0.8 | - | ~ 0.7 | nmol/L | 95% CI |
| 4-hydroxy-2-hexenal | ~0.0005 | - | - | ~0.0003 | - | ~ 0.0003 | |||||
| 3-hydroxy-2-butanone | ~0.03 | - | - | ~0.01 | - | ~ 0.01 | |||||
| hydroxyacetaldehyde | ~0.04 | - | - | ~0.02 | - | ~ 0.02 | |||||
| 4-hydroxy-2-nonenal | ~0.002 | - | - | ~0.001 | - | ~ 0.001 | |||||
| 2-pentanone | ~1.2 | - | - | ~0.9 | - | ~ 0.8 | |||||
| 18 | Ma, [72] | LC # | propanol | 7415.3 | - | - | 1975.3 | - | - | ng/L | - |
| acetone | 1811.6 | - | - | 579.9 | - | - | - | ||||
| methanol | 225 | - | - | 76.7 | - | - | - | ||||
| 19 | Schumer [73] | LC | 2-butanone | 3.4 | 2.47 ^ | - | 1.4 | 1.26 ^ | - | nmol/L | - |
| 3-hydroxy-2-butanone | 0.31 | 0.15 ^ | - | 0.09 | 0.07 ^ | - | - | ||||
| 2-hydroxyacetaldehyde | 0.33 | 0.29 ^ | - | 0.17 | 0.019 ^ | - | - | ||||
| 4-hydroxyhexenal | 0.007 | 0.007 ^ | - | 0.002 | 0.001 ^ | - | - | ||||
| 20 | Gaida A, [19] | COPD λ | benzene | 96–100 | 96 | - | 100 | 96 ^ | - | Occurrence rate (%) | <0.005 to <0.02 |
| acetic acid | 96–100 | 96–100 | - | 100 | 96–100 ^ | - | |||||
| toluene | 100 | 96–100 | - | 100 | 100 ^ | - | |||||
| m,p-xylene | 96–100 | 74–93 | - | 96-100 | 80–85 ^ | - | |||||
| 1,6-dimethyl-1,3,5-heptatriene | 74–100 | 7–19 | - | 40–71 | 0 ^ | - | |||||
| o-xylene | 93–100 | 33–50 | - | 57–96 | 26–36 ^ | - | |||||
| 1-ethyl-3-methyl benzene | 89–100 | 33–61 | - | 60–92 | 26–28 ^ | - | |||||
| linalyl acetate | 9–89 | 11–96 | - | 3–88 | 24–89 ^ | - | |||||
| tridecane | 100 | 85–100 | - | 77–100 | 88–100 ^ | - | |||||
| phenole | 100 | 96–100 | - | 100 | 100 ^ | - | |||||
| m/p-cresol | 36–48 | 7–50 | - | 30–71 | 44–48 ^ | - | |||||
| indole | 64–100 | 67–100 | - | 87–96 | 96–100 ^ | - | |||||
| vinyl acetate | 96–100 | 7–9 | - | 57–88 | 0–8 ^ | - | |||||
| butanone | 78–100 | 82–85 | - | 63–71 | 22–60 ^ | - | |||||
| 21 | Allers, [37] | COPD | acetonitrile | ~25 | ~1 ^ | - | ~33 | ~6 ^ | - | Intensity (arbitral units) | =0.01 |
| 2-butanone | ~2.3 | ~1.9 ^ | - | ~3.1 | ~1.8 | =0.05 | |||||
| 2-pentanone | Intensity not specified | - | |||||||||
| 22 | Schallschmidt [75] | LC | n-hexane | 1.3 | 0.8 ˄ | - | 2.1 | 0.7 ˄ | - | ng/L | <0.001 to <0.05 |
| 3-methylpentane | 0.8 | 0.8 ˄ | - | 1.6 | 0.5 ˄ | - | |||||
| cyclohexane | 1.5 | 1.9 ˄ | - | 4.4 | 4.8 ˄ | - | |||||
| n-nonanal | 1.9 | 2.4 ˄ | - | 2.8 | 1.3 ˄ | - | |||||
| 1-butanol | 5.1 | 10.1 | - | 2.2 | 1.9 ˄ | - | |||||
| 2-butanone | 6.9 | 6.6 | - | 19.3 ˄ | 4.6 ˄ | - | |||||
| 2-pentanone | 2.9 | 2.7 | - | 10.8 ˄ | 3.0 ˄ | - | |||||
| 23 | van Vliet, [76] | asthma | 7 proposed markers (nq) | 1, 2-dimethylcyclohexane; 2-ethylhexanal; 2-methylfuran; 6, 10-dimethyl-5,9-undecadien-2-one; nonanal; octanal | |||||||
| 24 | Lamote, [78] | LC | 6 proposed markers (nq) | diethyl ether, methylcyclopentane, nonanal, limonene, cyclohexan, isothiocyanatocyclohexane | |||||||
| 25 | Jareno-Esteban, [79] | COPD | 5 proposed markers (nq) | hexanal; heptanal; nonanal; propanoic acid; nonanoic acid | |||||||
| 26 | Oguma, [80] | LC # | Cyclohexane | 0.1 | - | - | 0.2 | - | - | ppb | =0.002 |
| Xylene | 0.16 | - | - | 0.07 | - | - | ppb | =0.0001 | |||
| 27 | Sakumura, [16] | LC | 5 proposed markers (nq) | hydrogen isocyanide; methanol; acetonitrile; isoprene; 1-propanol | |||||||
| 28 | Pizzini, [81] | COPD # | cyclohexanone | 35 | - | - | - | - | - | Occurrence rate (%) | <0.001 to =0.006 |
| n-butane | 96 | - | - | - | - | - | |||||
| 4-heptanone | 48 | - | - | - | - | - | |||||
| 2-pentanone | 79 | - | - | - | - | - | |||||
| n-heptane | 99 | - | - | - | - | - | |||||
| methyl propyl sulfide | 77 | - | - | - | - | - | |||||
| dimethyl disulfide | 93 | - | - | - | - | - | |||||
| 6-methyl-5-heptene-2-one | 98 | - | - | - | - | - | |||||
| 2,4-dimethylheptane | 90 | - | - | - | - | - | |||||
| 2,6-dimethyloctane | 70 | - | - | - | - | - | |||||
| cyclohexane | 95 | - | - | - | - | - | |||||
| 2-methylhexane | 82 | - | - | - | - | - | |||||
| 29 | Wang, [82] | LC | 12 proposed markers (nq) | heneicosane; 3-ethyltoluene; 1,2,3-trimethylbenzene, N-propylbenzene; indan; methylcyclohexane 1-methyl-3 propylbenzene; propylcyclohexane; o-xylene; 4-methyl-2-pentanone; 5-methylindan; | <0.001 | ||||||
| 30 | Cai, [41] | LC | 23 proposed markers (nq) | dimethylmethane; ethanol; methane; isoprene; hexane; heptane methyl-cyclopentane; 2-methylheptane; octane; 3-methyloctane; 1,4-dimethylbenzene; ethenylbenzene; dodecane; tetradecane; tridecane; 2.2.4.6.6-pentamethyl-heptane; 2,5,5-trimethyl-2,6-heptadien-4-one; limonene; benzene;; 2-phenyl-propylbutyrate; 1,2,6-trimethylnaphthalene; 3-methylnonane; | |||||||
Publisher’s Note: MDPI stays neutral with regard to jurisdictional claims in published maps and institutional affiliations. |
© 2020 by the authors. Licensee MDPI, Basel, Switzerland. This article is an open access article distributed under the terms and conditions of the Creative Commons Attribution (CC BY) license (http://creativecommons.org/licenses/by/4.0/).
Share and Cite
Ratiu, I.A.; Ligor, T.; Bocos-Bintintan, V.; Mayhew, C.A.; Buszewski, B. Volatile Organic Compounds in Exhaled Breath as Fingerprints of Lung Cancer, Asthma and COPD. J. Clin. Med. 2021, 10, 32. https://doi.org/10.3390/jcm10010032
Ratiu IA, Ligor T, Bocos-Bintintan V, Mayhew CA, Buszewski B. Volatile Organic Compounds in Exhaled Breath as Fingerprints of Lung Cancer, Asthma and COPD. Journal of Clinical Medicine. 2021; 10(1):32. https://doi.org/10.3390/jcm10010032
Chicago/Turabian StyleRatiu, Ileana Andreea, Tomasz Ligor, Victor Bocos-Bintintan, Chris A Mayhew, and Bogusław Buszewski. 2021. "Volatile Organic Compounds in Exhaled Breath as Fingerprints of Lung Cancer, Asthma and COPD" Journal of Clinical Medicine 10, no. 1: 32. https://doi.org/10.3390/jcm10010032
APA StyleRatiu, I. A., Ligor, T., Bocos-Bintintan, V., Mayhew, C. A., & Buszewski, B. (2021). Volatile Organic Compounds in Exhaled Breath as Fingerprints of Lung Cancer, Asthma and COPD. Journal of Clinical Medicine, 10(1), 32. https://doi.org/10.3390/jcm10010032