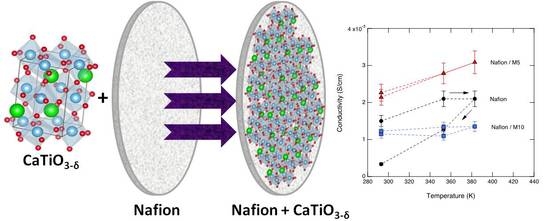
Composite Nafion Membranes with CaTiO3−δ Additive for Possible Applications in Electrochemical Devices


 , ,
, ,  ,
, 


Abstract
:
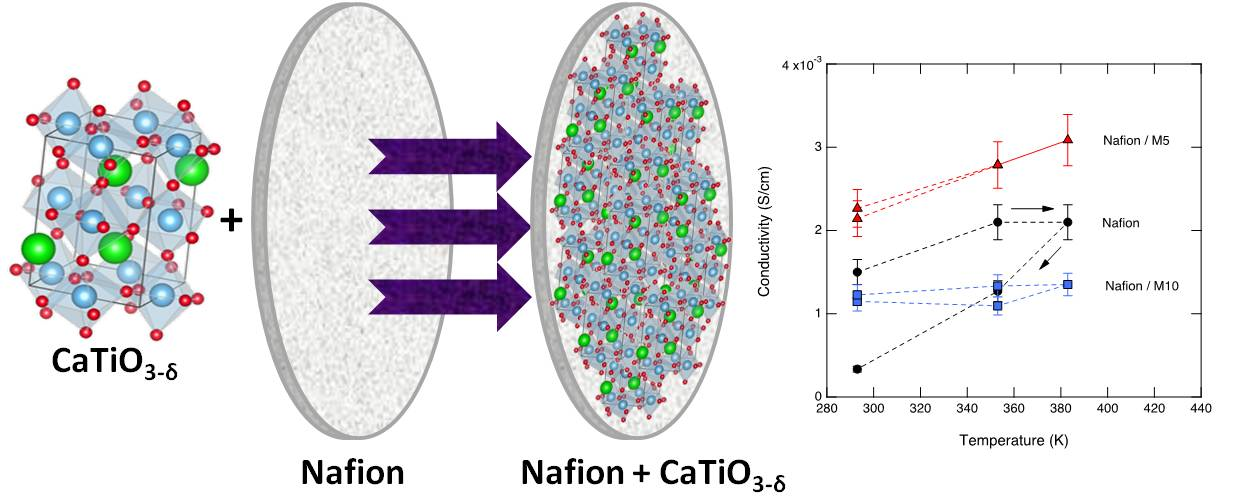
1. Introduction
2. Materials and Methods
3. Results and Discussion
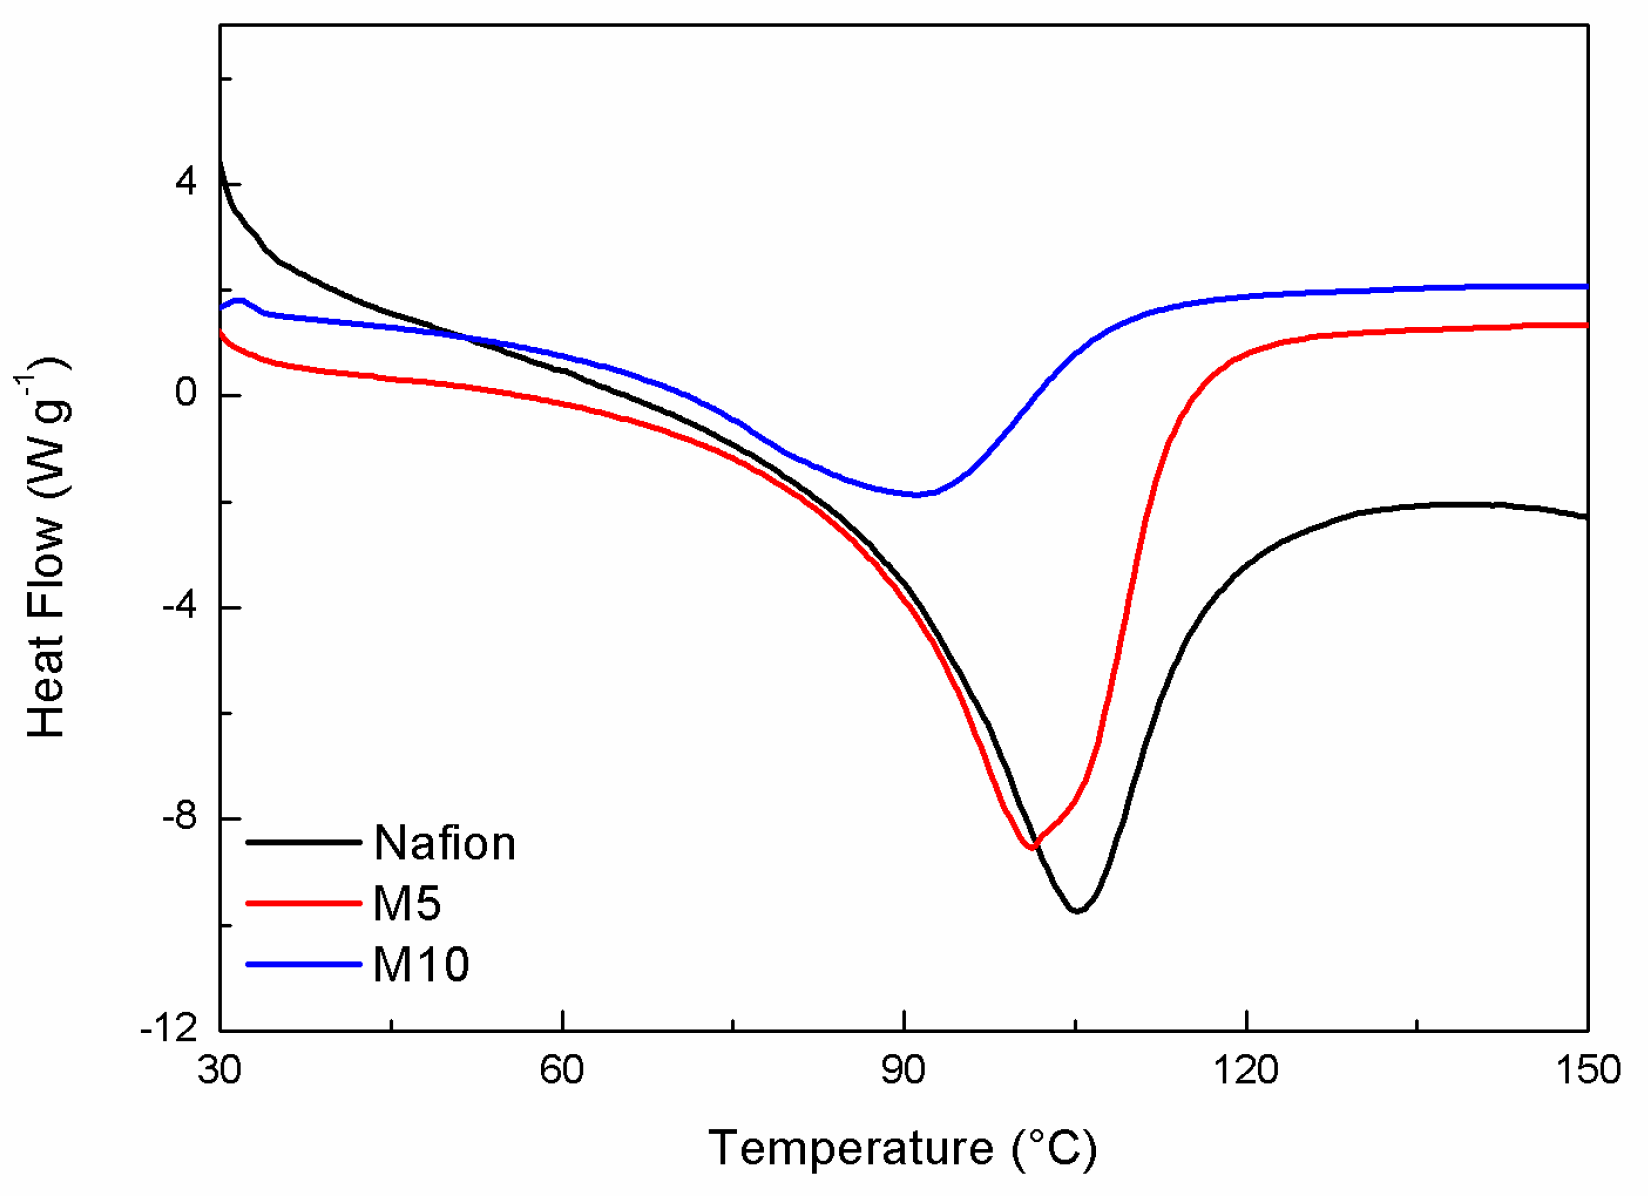
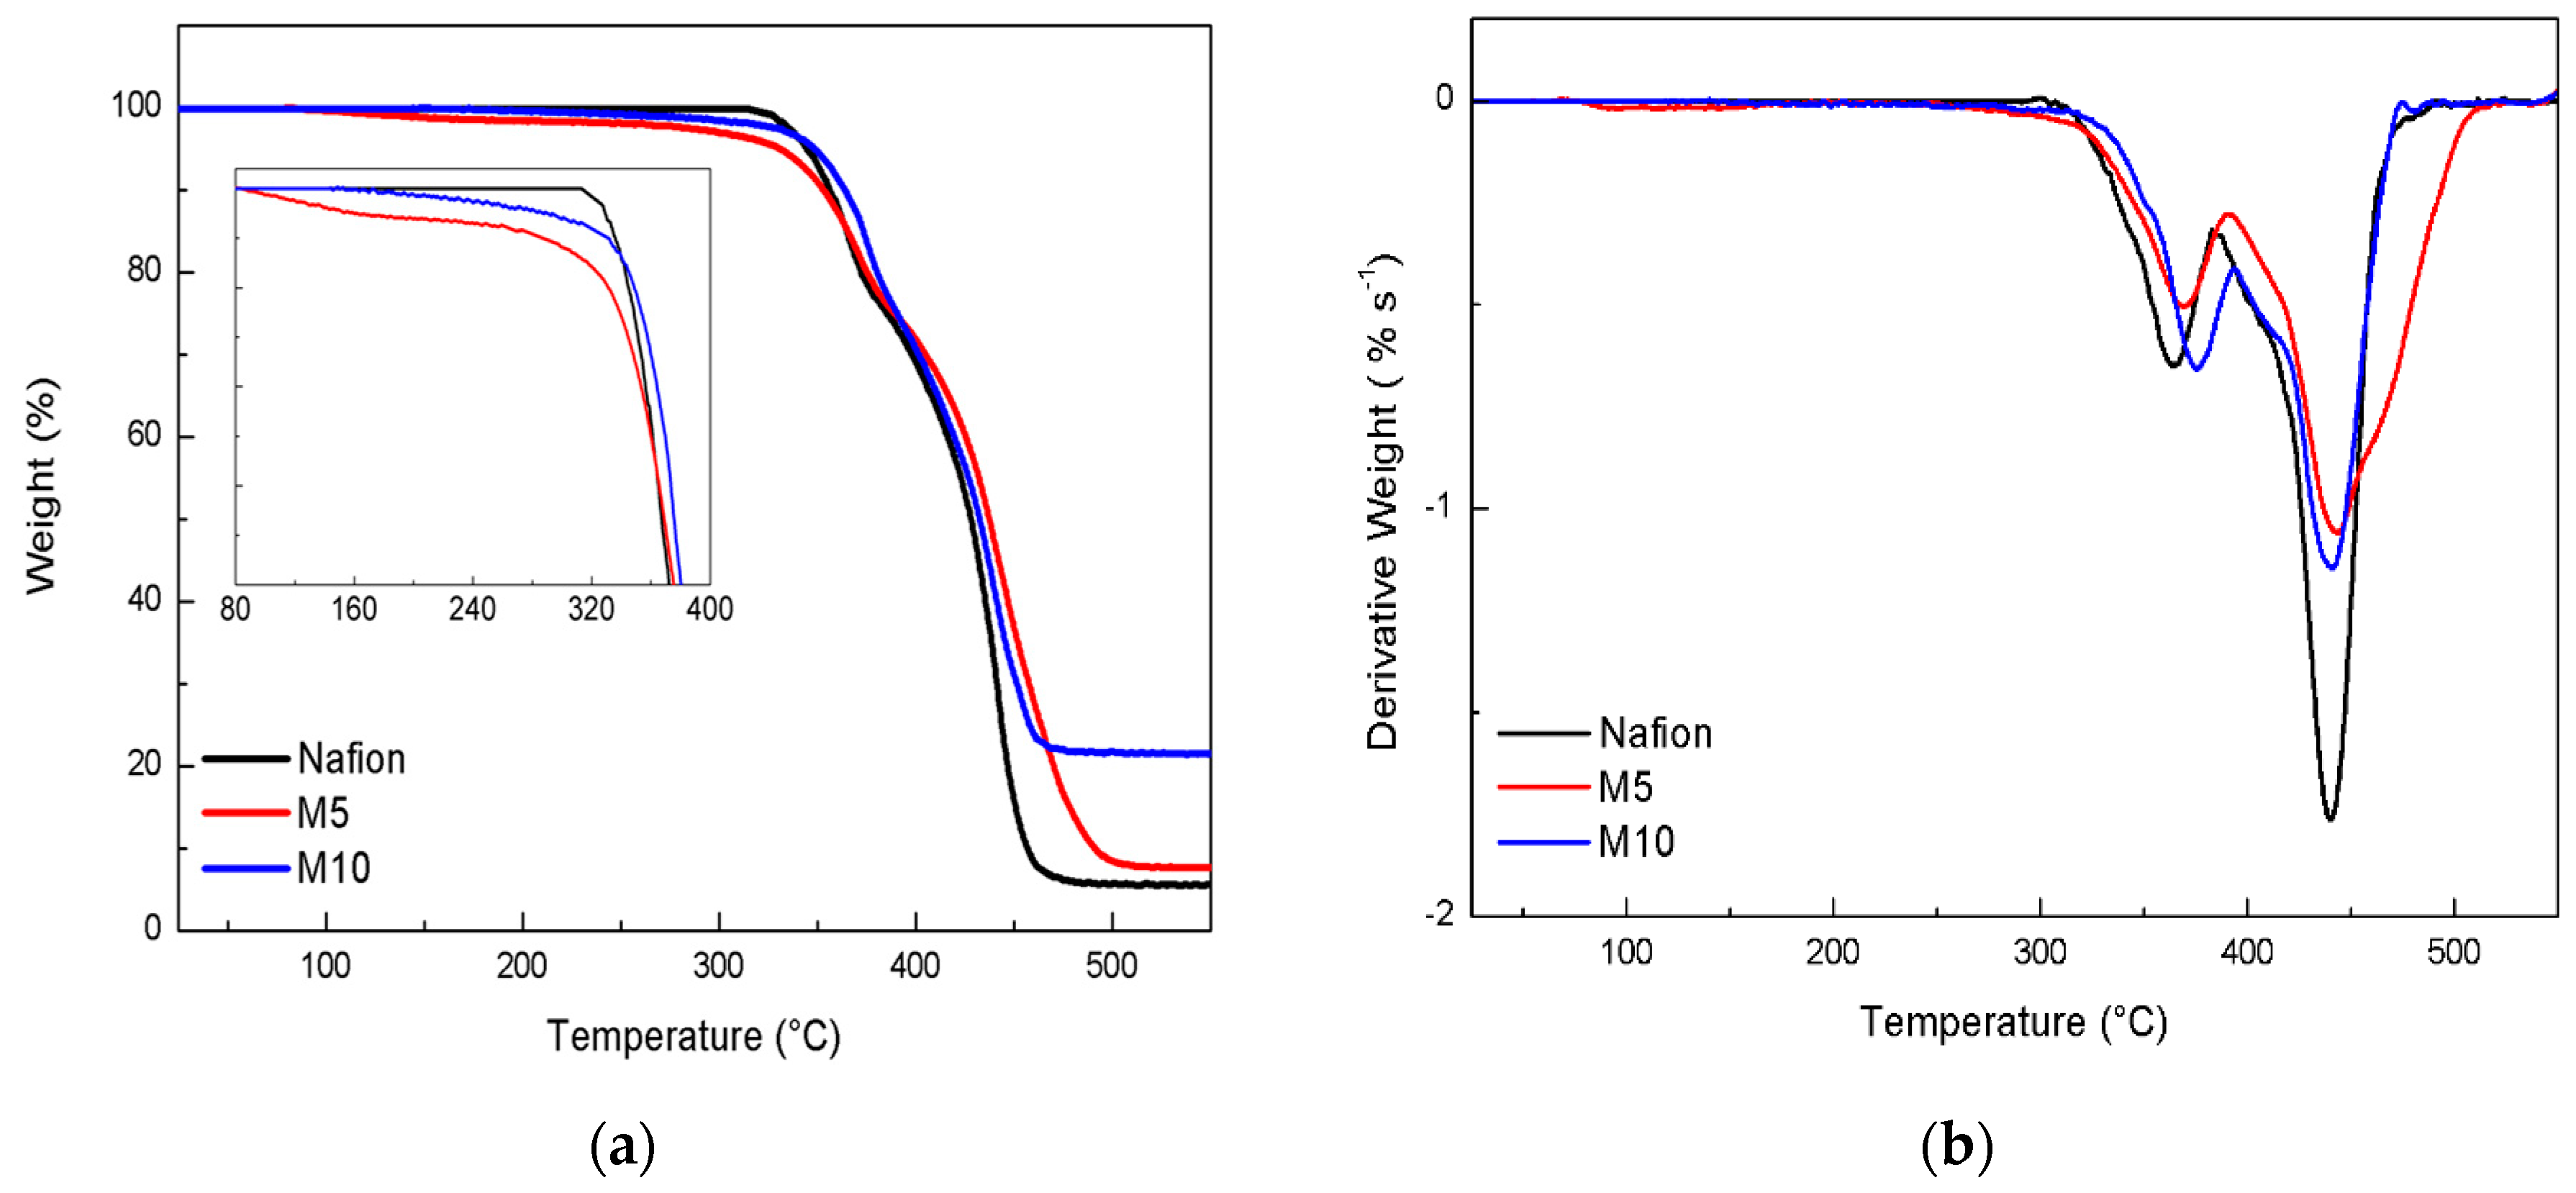
3.1. Differential Scanning Calorimetry and Thermal Gravimetric Analysis
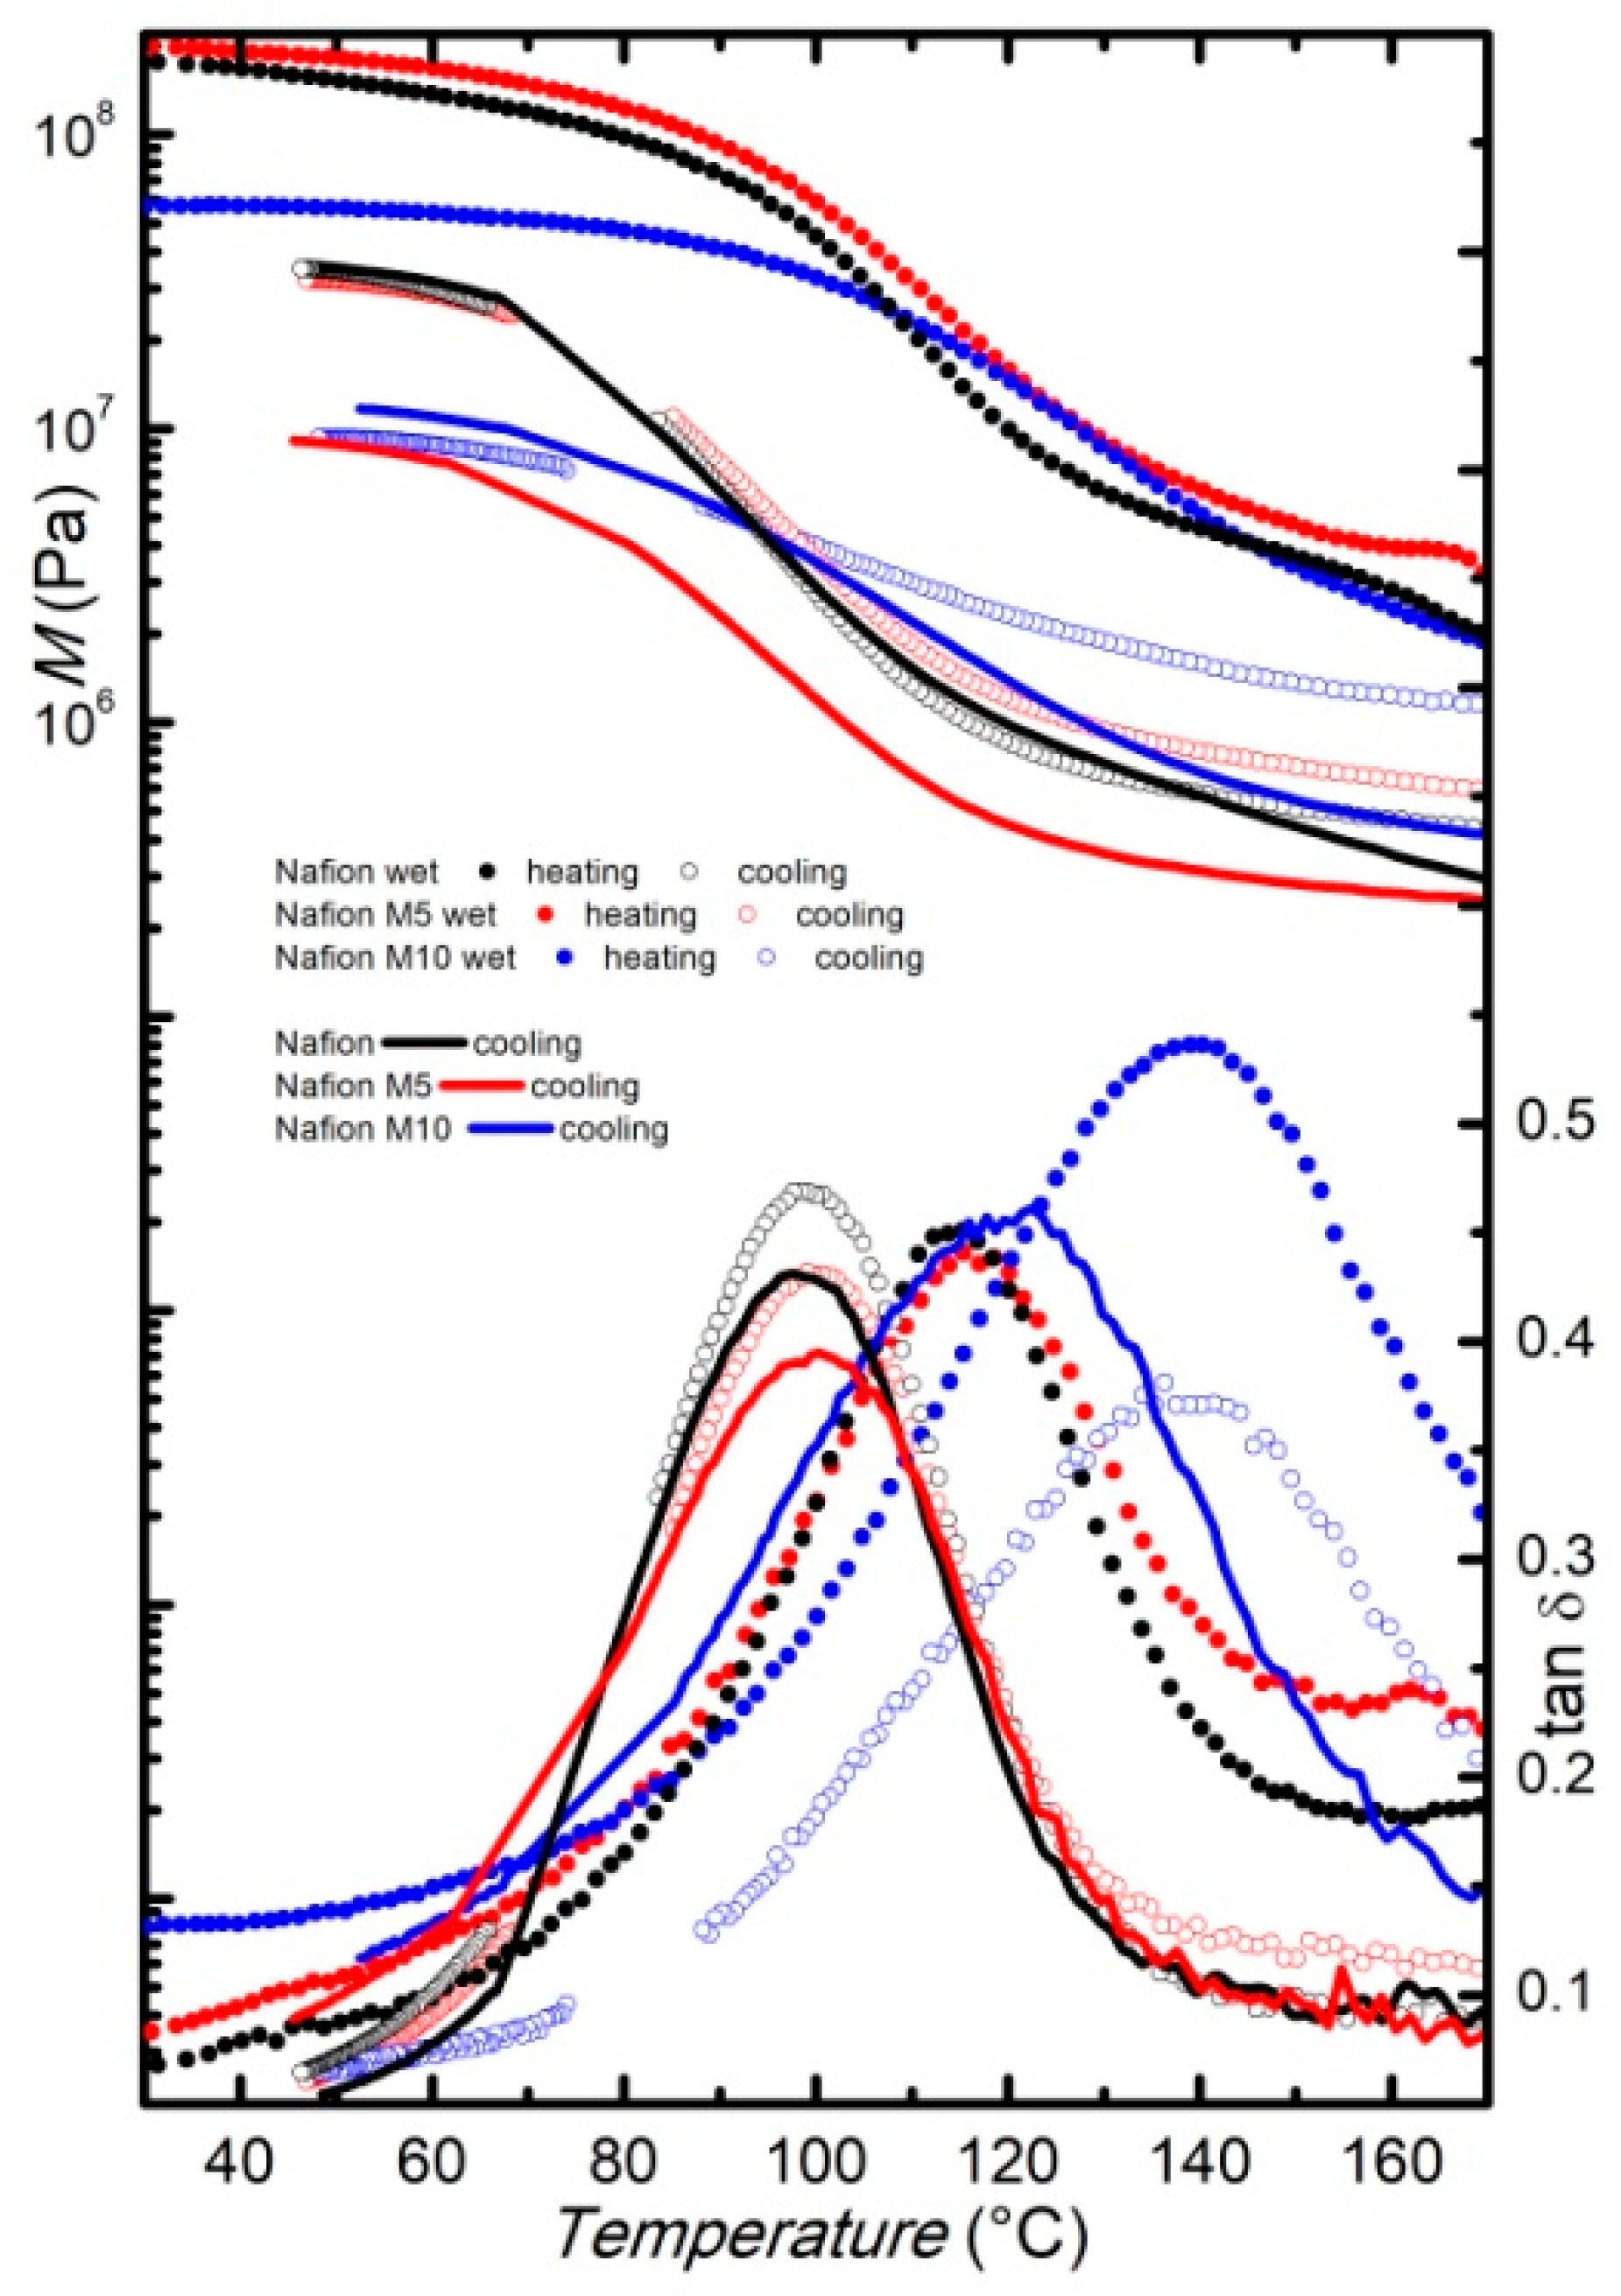
3.2. Dynamical Mechanical Analysis
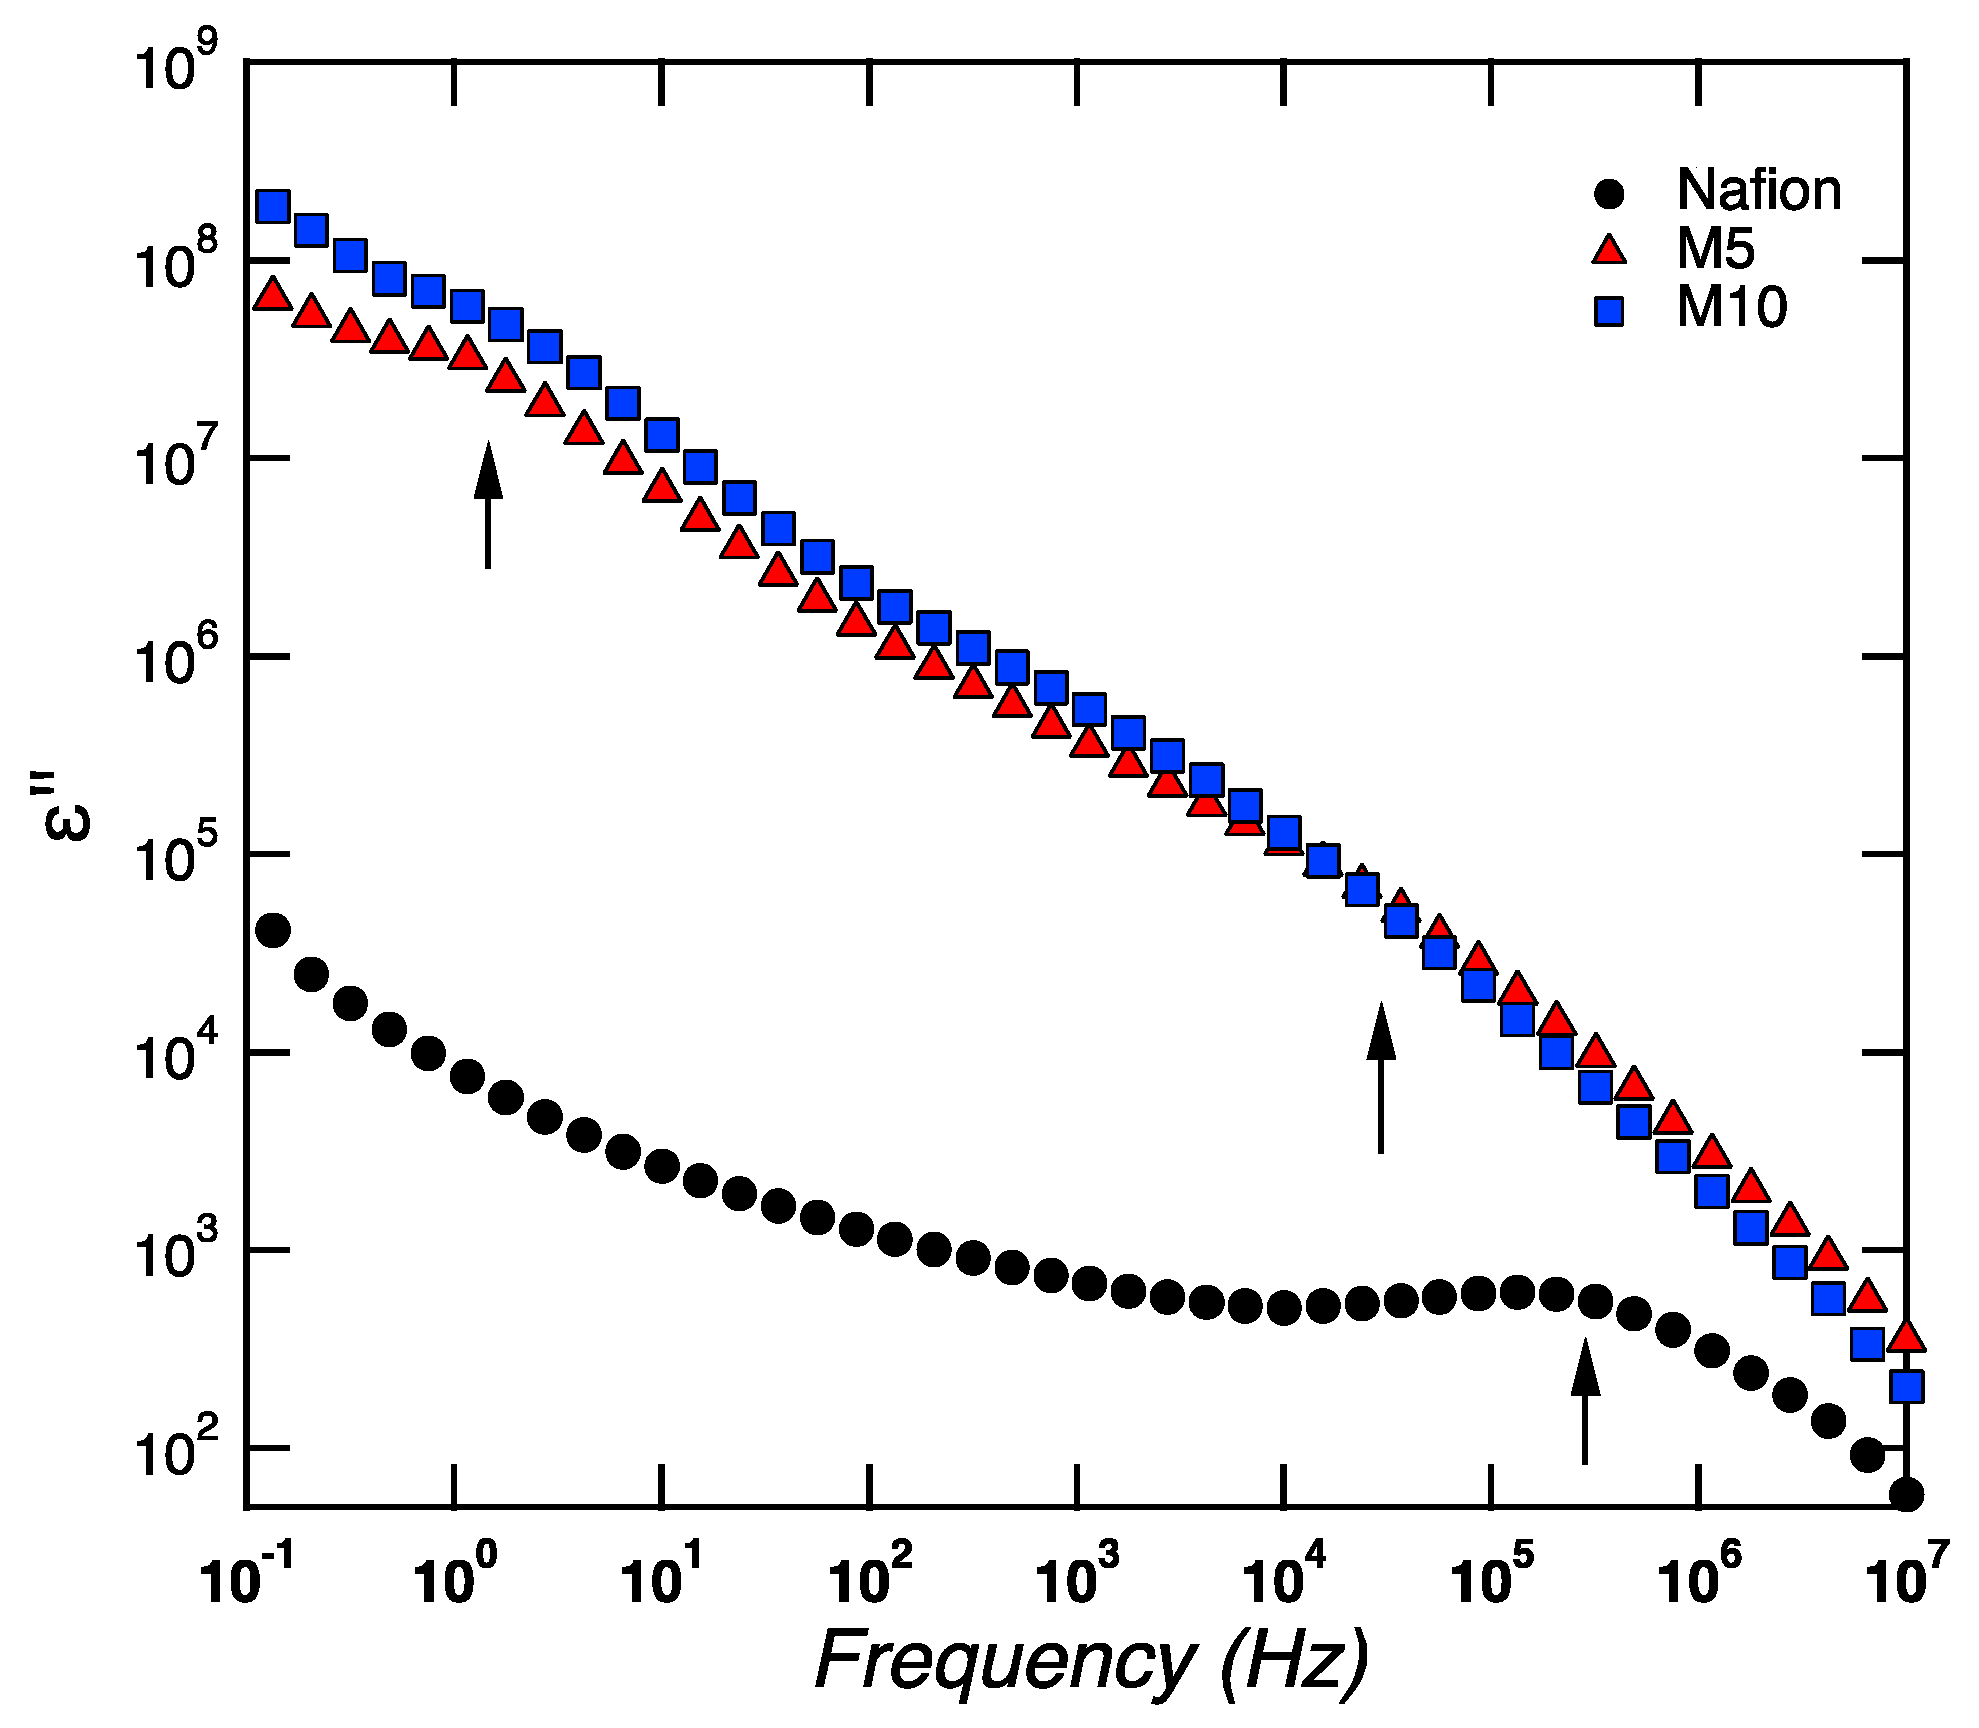
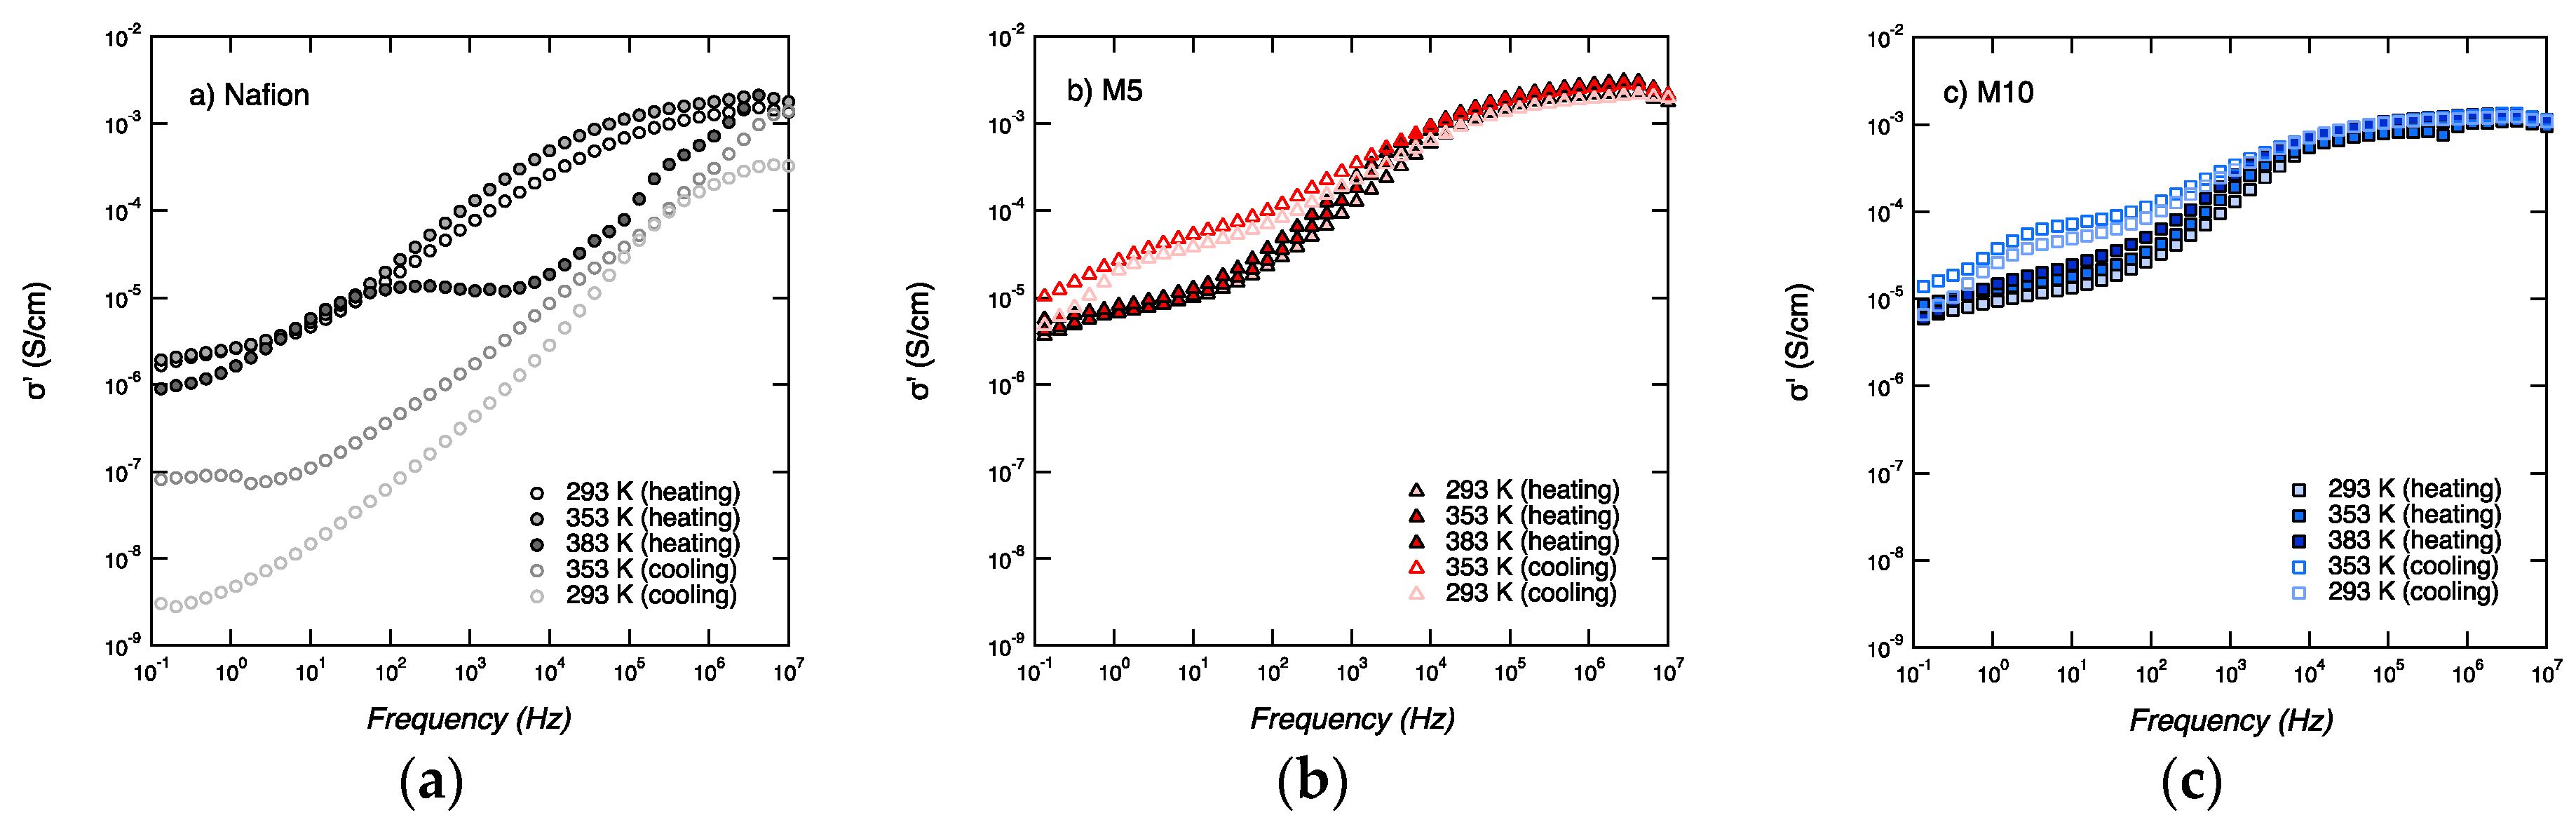
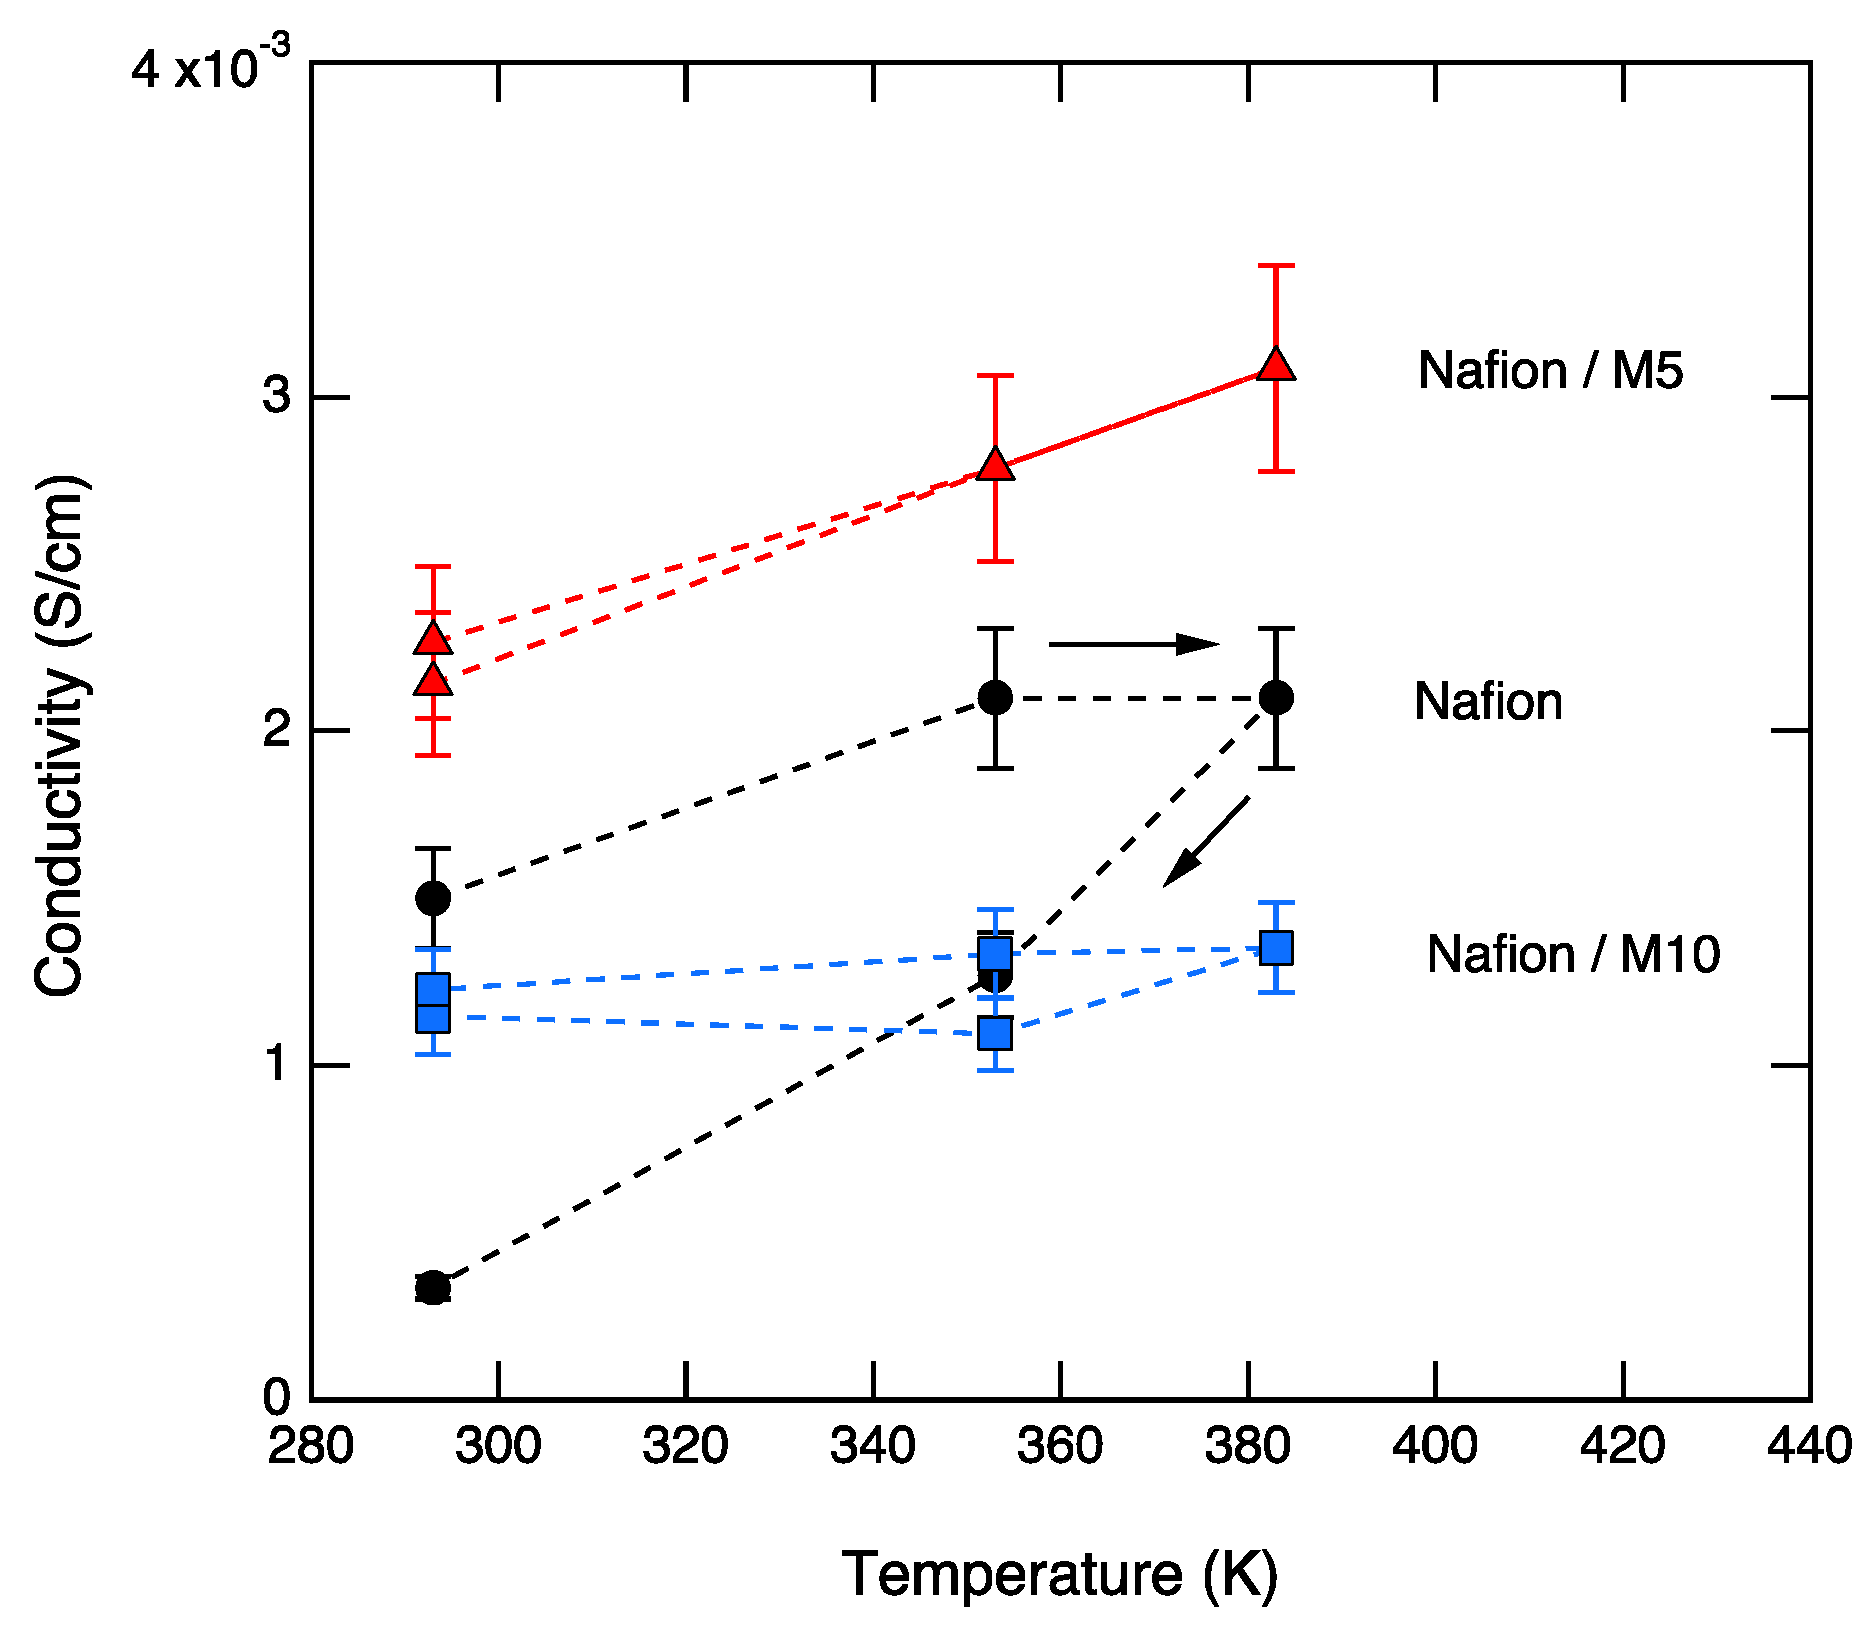
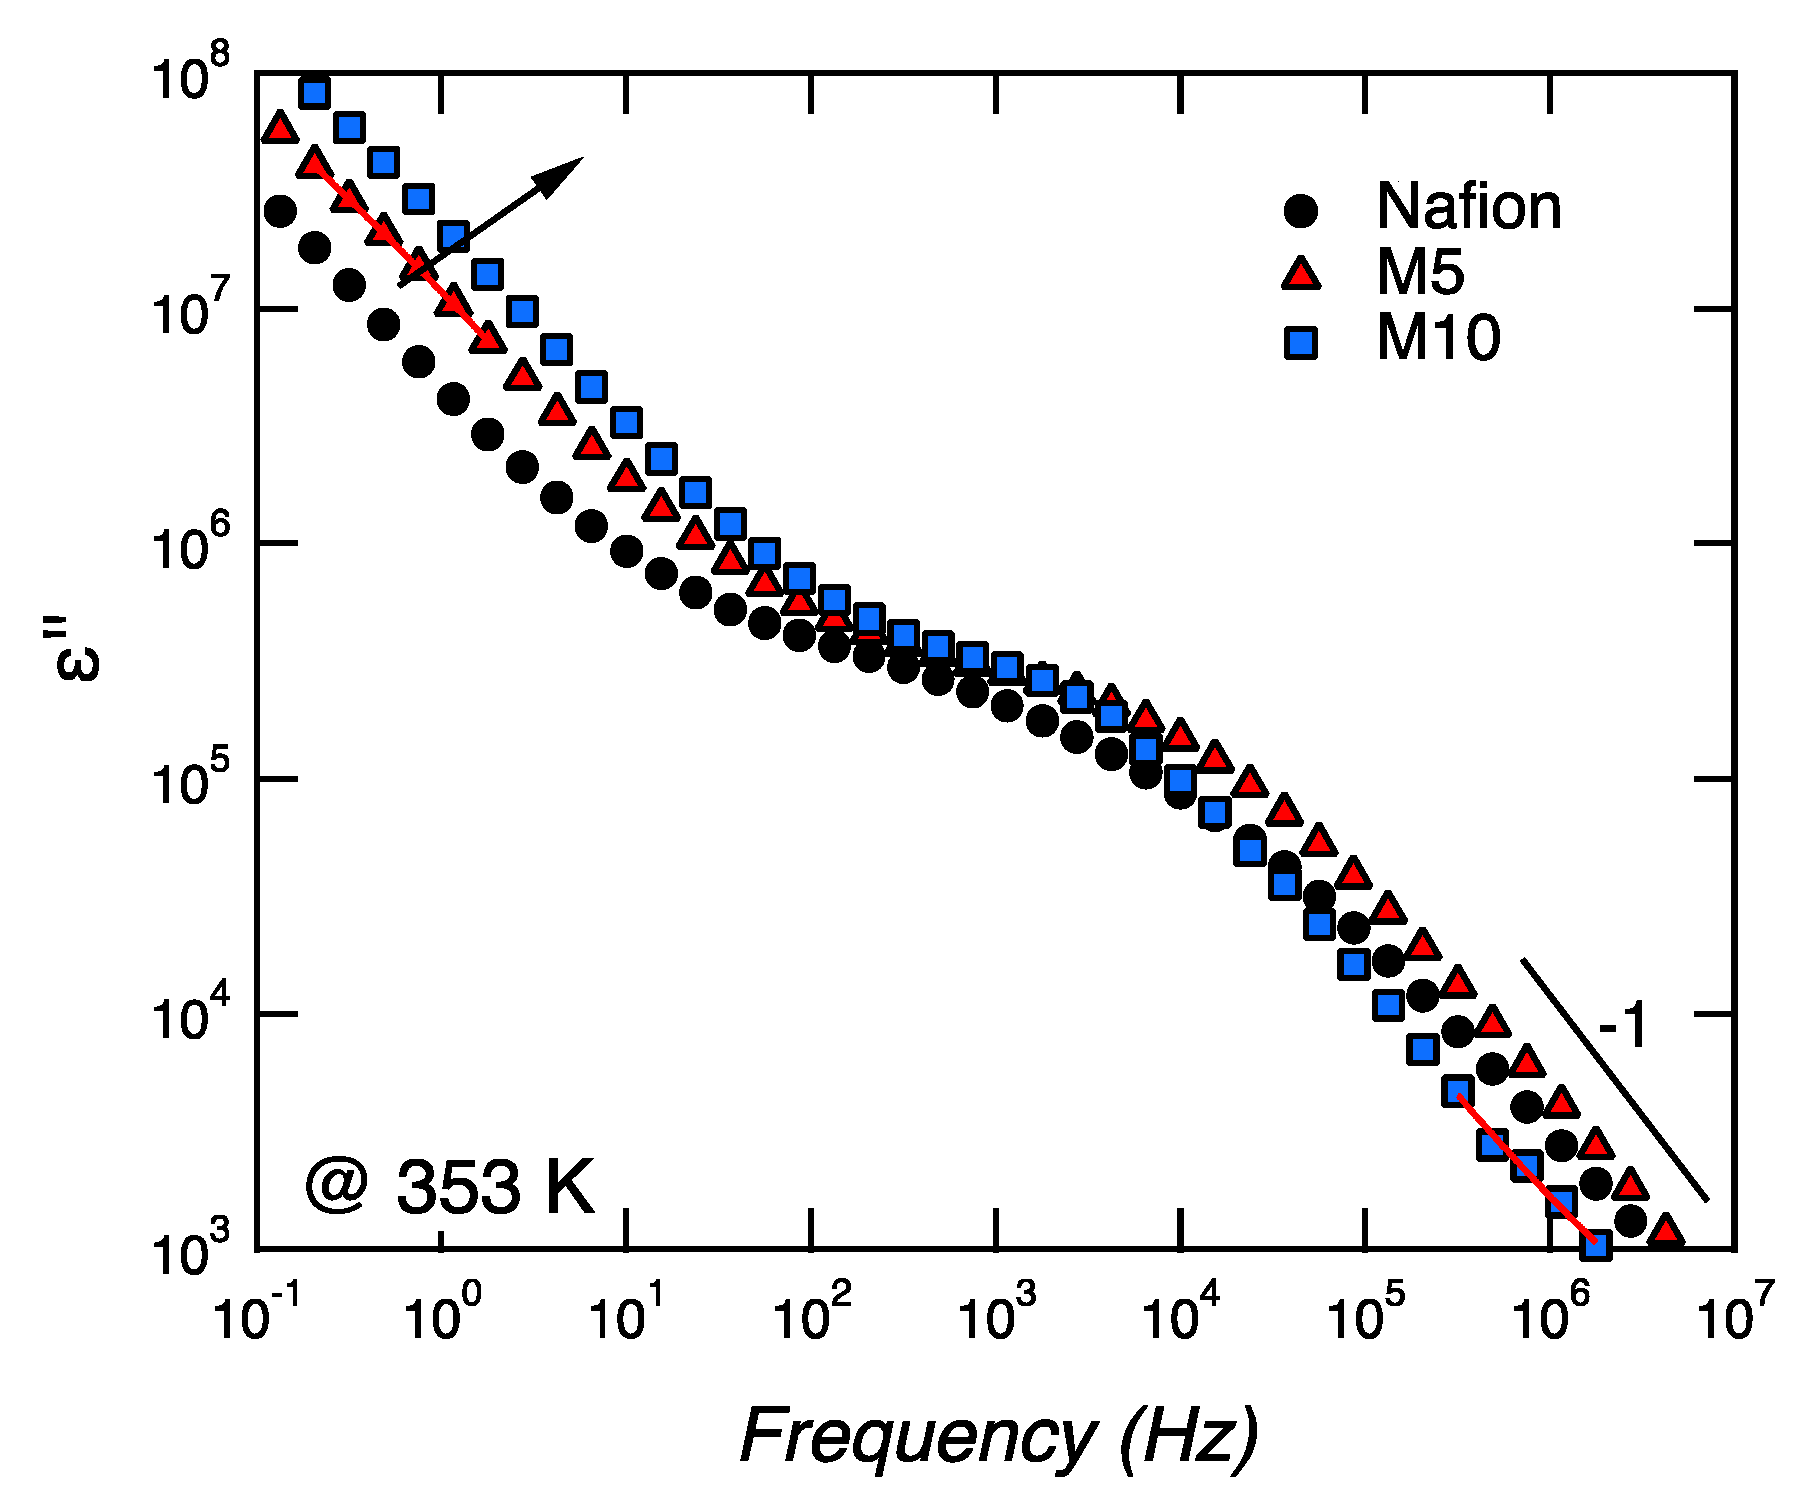
3.3. Dielectric Spectroscopy Studies
4. Conclusions
Author Contributions
Funding
Acknowledgments
Conflicts of Interest
References
- Rosli, R.E.; Sulong, A.B.; Daud, W.R.W.; Zulkifley, M.A.; Husaini, T.; Rosli, M.I.; Majlan, E.H.; Haque, M.A. A review of high-temperature proton exchange membrane fuel cell (HT-PEMFC) system. Int. J. Hydrogen Energy 2017, 42, 9293–9314. [Google Scholar] [CrossRef]
- Bose, S.; Kuila, T.; Nguyen, T.X.H.; Kim, N.H.; Lau, K.T.; Lee, J.H. Polymer membranes for high temperature proton exchange membrane fuel cell: Recent advances and challenges. Prog. Polym. Sci. 2011, 36, 813–843. [Google Scholar] [CrossRef]
- Kundu, S.; Simon, L.C.; Flowler, M.; Grot, S. Mechanical Properties of NafionTM Electrolyte Membranes under Hydrated Conditions. Polymer 2005, 46, 11707–11715. [Google Scholar] [CrossRef]
- Peighambardoust, S.J.; Rowshanzamir, S.; Amjadi, M. Review of the proton exchange membranes for fuel cell applications. Int. J. Hydrogen. Energy 2010, 35, 9349–9384. [Google Scholar] [CrossRef]
- Brutti, S.; Scipioni, R.; Navarra, M.A.; Panero, S.; Allodi, V.; Giarola, M.; Mariotto, G. SnO2-Nafion® nanocompositepolymerelectrolytes for fuelcellapplications. Int. J. Nanotechnol. 2014, 11, 882–896. [Google Scholar] [CrossRef]
- Allodi, V.; Brutti, S.; Giarola, M.; Sgambetterra, M.; Navarra, M.A.; Panero, S.; Mariotto, G. Structural and spectroscopic characterization of a nanosized sulfated TiO2 filler and of nanocomposite nafion membranes. Polymers 2016, 8, 68. [Google Scholar] [CrossRef] [PubMed]
- Navarra, M.A.; Croce, F.; Scrosati, B. New, high temperature superacid zirconia-doped Nafion™ composite membranes. J. Mater. Chem. 2007, 17, 3210–3215. [Google Scholar] [CrossRef]
- Siracusano, S.; Baglio, V.; Navarra, M.A.; Panero, S.; Antonucci, V.; Aricò, A.S. Investigation of Composite Nafion/Sulfated Zirconia Membrane for Solid Polymer Electrolyte Electrolyzer Applications. Int. J. Electrochem. Sci. 2012, 7, 1532–1542. [Google Scholar]
- Goodenough, J.B.; Zhou, J.S. Localized to Itinerant Electronic Transition in Perovskite Oxides; Springer: Berlin, Germany, 2001; Volume 98, pp. 17–113. [Google Scholar]
- Fabbri, E.; Mohamed, R.; Levecque, P.; Conrad, O.; Kötza, R.; Schmidt, T.J. Unraveling the Oxygen Reduction Reaction Mechanism and Activity of d-Band Perovskite Electrocatalysts for Low Temperature Alkaline Fuel Cells. ECS Trans. 2014, 64, 1081–1093. [Google Scholar] [CrossRef]
- Du, J.; Zhang, T.; Cheng, F.; Chu, W.; Wu, Z.; Chen, J. Nonstoichiometric Perovskite CaMnO3−δ for Oxygen Electrocatalysis with High Activity. Inorg. Chem. 2014, 53, 9106–9114. [Google Scholar] [CrossRef]
- Li, Q.; Yin, Q.; Zheng, Y.S.; Sui, Z.J.; Zhou, X.G.; Chen, D.; Zhu, Y.A. Insights into Hydrogen Transport Behavior on Perovskite Surfaces: Transition from the Grotthuss Mechanism to the Vehicle Mechanism. Langmuir 2019, 35, 9962–9969. [Google Scholar] [CrossRef] [PubMed]
- Stølen, S.; Bakkenw, E.; Mohn, C.E. Oxygen-deficient perovskites: Linking structure, energetics and ion transport. Phys. Chem. Chem. Phys. 2006, 8, 429–447. [Google Scholar] [CrossRef] [PubMed]
- Mazzapioda, L.; Lo Vecchio, C.; Paolone, A.; Aricò, A.S.; Baglio, V.; Navarra, M.A. Enhancing Oxygen Reduction Reaction Catalytic Activity Using CaTiO3-δ Additive. Chem. Electro. Chem. 2019. [Google Scholar] [CrossRef]
- Siracusano, S.; Baglio, V.; Nicotera, I.; Mazzapioda, L.; Aricò, A.S.; Panero, S.; Navarra, M.A. Sulfated titania as additive in Nafion membranes for water electrolysis applications. Int. J. Hydrogen Energy 2017, 42, 27851–27858. [Google Scholar] [CrossRef]
- Branchi, M.; Sgambetterra, M.; Pettiti, I.; Panero, S.; Navarra, M.A. Functionalized Al2O3 particles as additives in proton-conducting polymer electrolyte membranes for fuel cell applications. Int. J. Hydrogen Energy 2015, 40, 14757–14767. [Google Scholar] [CrossRef]
- Nicotera, I.; Kosma, V.; Simari, C.; Ranieri, G.A.; Sgambetterra, M.; Panero, S.; Navarra, M.A. An NMR study on the molecular dynamic and exchange effects in composite Nafion/sulfated titania membranes for PEMFCs. Int. J. Hydrogen Energy 2015, 40, 14651–14660. [Google Scholar] [CrossRef]
- Teocoli, F.; Paolone, A.; Palumbo, O.; Navarra, M.A.; Casciola, M.; Donnadio., A. Effects of water freezing on the mechanical properties of Nafion membranes. J. Polym. Sci. Pol. Phys. 2012, 50, 1421–1425. [Google Scholar] [CrossRef]
- Scipioni, R.; Gazzoli, D.; Teocoli, F.; Palumbo, O.; Paolone, A.; Ibris, N.; Brutti, S.; Navarra, M.A. Preparation and characterization of nanocomposite polymer membranes containing functionalized SnO2 additives. Membranes 2014, 4, 123–142. [Google Scholar] [CrossRef]
- Trequattrini, F.; Palumbo, O.; Vitucci, F.M.; Miriametro, A.; Croce, F.; Paolone, A. Hot pressing of electrospun PVdF-CTFE membranes as separators for lithium batteries: A delicate balance between mechanical properties and retention. Mater. Res. 2018, 21. [Google Scholar] [CrossRef]
- Paolone, A.; Palumbo, O.; Teocoli, F.; Cantelli, R.; Hassoun, J. Phase transitions in polymers for lithium batteries. Solid State Phenom. 2012, 184, 351–354. [Google Scholar] [CrossRef]
- Lage, L.G.; Delgado, P.G.; Kawano, Y. Thermal stability and decomposition of Nafion® membranes with different cations. J. Therm. Anal. Calorim. 2004, 75, 521–530. [Google Scholar] [CrossRef]
- Sgambetterra, M.; Brutti, S.; Allodi, V.; Mariotto, G.; Panero, S.; Navarra, M.A. Critical Filler Concentration in Sulfated Titania-Added Nafion™ Membranes for Fuel Cell Applications. Energies 2016, 9, 272. [Google Scholar] [CrossRef]
- Mazzapioda, L.; Panero, S.; Navarra, M.A. Polymer Electrolyte Membranes Based on Nafion and a Superacidic Inorganic Additive for Fuel Cell Applications. Polymers 2019, 11, 914. [Google Scholar] [CrossRef] [PubMed]
- Di Noto, V.; Boaretto, N.; Negro, E.; Giffin, G.A.; Lavina, S.; Polizzi, S. Inorganic-organic membranes based on Nafion, [(ZrO2)*(HfO2)0.25] and [(SiO2)*(HfO2)0.28]. Part I: Synthesis, thermal stability and performance in a single PEMFC. Int. J. Hydrogen. Energy 2012, 37, 6199–6214. [Google Scholar] [CrossRef]
- Kyu, T.; Eisenberg, A. Perfluorinated Ionomer Membranes; Eisenberg, A., Yeager, H.L., Eds.; ACS Symposium Series l80; American Chemical Society: Washington, DC, USA, 1982; pp. 79–84. [Google Scholar]
- Nørgaard, C.F.; Nielsen, U.G.; Skou, E.M. Preparation of Nafion 117™-SnO2 Composite Membranes using an Ion-Exchange Method. Solid State Ionics 2012, 213, 76–82. [Google Scholar] [CrossRef]
- Di Noto, V.; Piga, M.; Pace, G.; Negro, E.; Lavina, S. Dielectric Relaxations and Conductivity Mechanism of Nafion: Studies Based on Broadband Dielectric Spectroscopy. ECS Trans. 2008, 16, 1183–1193. [Google Scholar]
- Guinevere, A.G.; Piga, M.; Lavina, S.; Navarra, M.A.; D’Epifanio, A.; Scrosati, B.; Di Noto, V. Characterization of sulfated-zirconia/Nafion® composite membranes for proton exchange membrane fuel cells. J. Power. Source 2012, 198, 66–75. [Google Scholar]
- Chen, F.; Mecheri, B.; D’Epifanio, A.; Traversa, E.; Licoccia, S. Development of Nafion/Tin oxide composite MEA for DMFC applications. Fuel Cells 2010, 10, 790–797. [Google Scholar] [CrossRef]
- Lin, B.; Cheng, S.; Qiu, L.; Yan, F.; Shang, S.; Lu, J. Protic Ionic Liquid-Based Hybrid Proton-Conducting Membranes for Anhydrous Proton Exchange Membrane Application. Chem. Mater. 2010, 225, 1807–1813. [Google Scholar] [CrossRef]


| Samples | Tonset (°C) | ΔH (J·g−1) |
|---|---|---|
| N | 82 | 738 |
| M5 | 81 | 747 |
| M10 | 55 | 380 |
© 2019 by the authors. Licensee MDPI, Basel, Switzerland. This article is an open access article distributed under the terms and conditions of the Creative Commons Attribution (CC BY) license (http://creativecommons.org/licenses/by/4.0/).
Share and Cite
Mazzapioda, L.; Navarra, M.A.; Trequattrini, F.; Paolone, A.; Elamin, K.; Martinelli, A.; Palumbo, O. Composite Nafion Membranes with CaTiO3−δ Additive for Possible Applications in Electrochemical Devices. Membranes 2019, 9, 143. https://doi.org/10.3390/membranes9110143
Mazzapioda L, Navarra MA, Trequattrini F, Paolone A, Elamin K, Martinelli A, Palumbo O. Composite Nafion Membranes with CaTiO3−δ Additive for Possible Applications in Electrochemical Devices. Membranes. 2019; 9(11):143. https://doi.org/10.3390/membranes9110143
Chicago/Turabian StyleMazzapioda, Lucia, Maria Assunta Navarra, Francesco Trequattrini, Annalisa Paolone, Khalid Elamin, Anna Martinelli, and Oriele Palumbo. 2019. "Composite Nafion Membranes with CaTiO3−δ Additive for Possible Applications in Electrochemical Devices" Membranes 9, no. 11: 143. https://doi.org/10.3390/membranes9110143
APA StyleMazzapioda, L., Navarra, M. A., Trequattrini, F., Paolone, A., Elamin, K., Martinelli, A., & Palumbo, O. (2019). Composite Nafion Membranes with CaTiO3−δ Additive for Possible Applications in Electrochemical Devices. Membranes, 9(11), 143. https://doi.org/10.3390/membranes9110143