Application of Physical and Chemical Enhanced Backwashing to Reduce Membrane Fouling in the Water Treatment Process Using Ceramic Membranes


Abstract
:1. Introduction
2. Materials and Methods
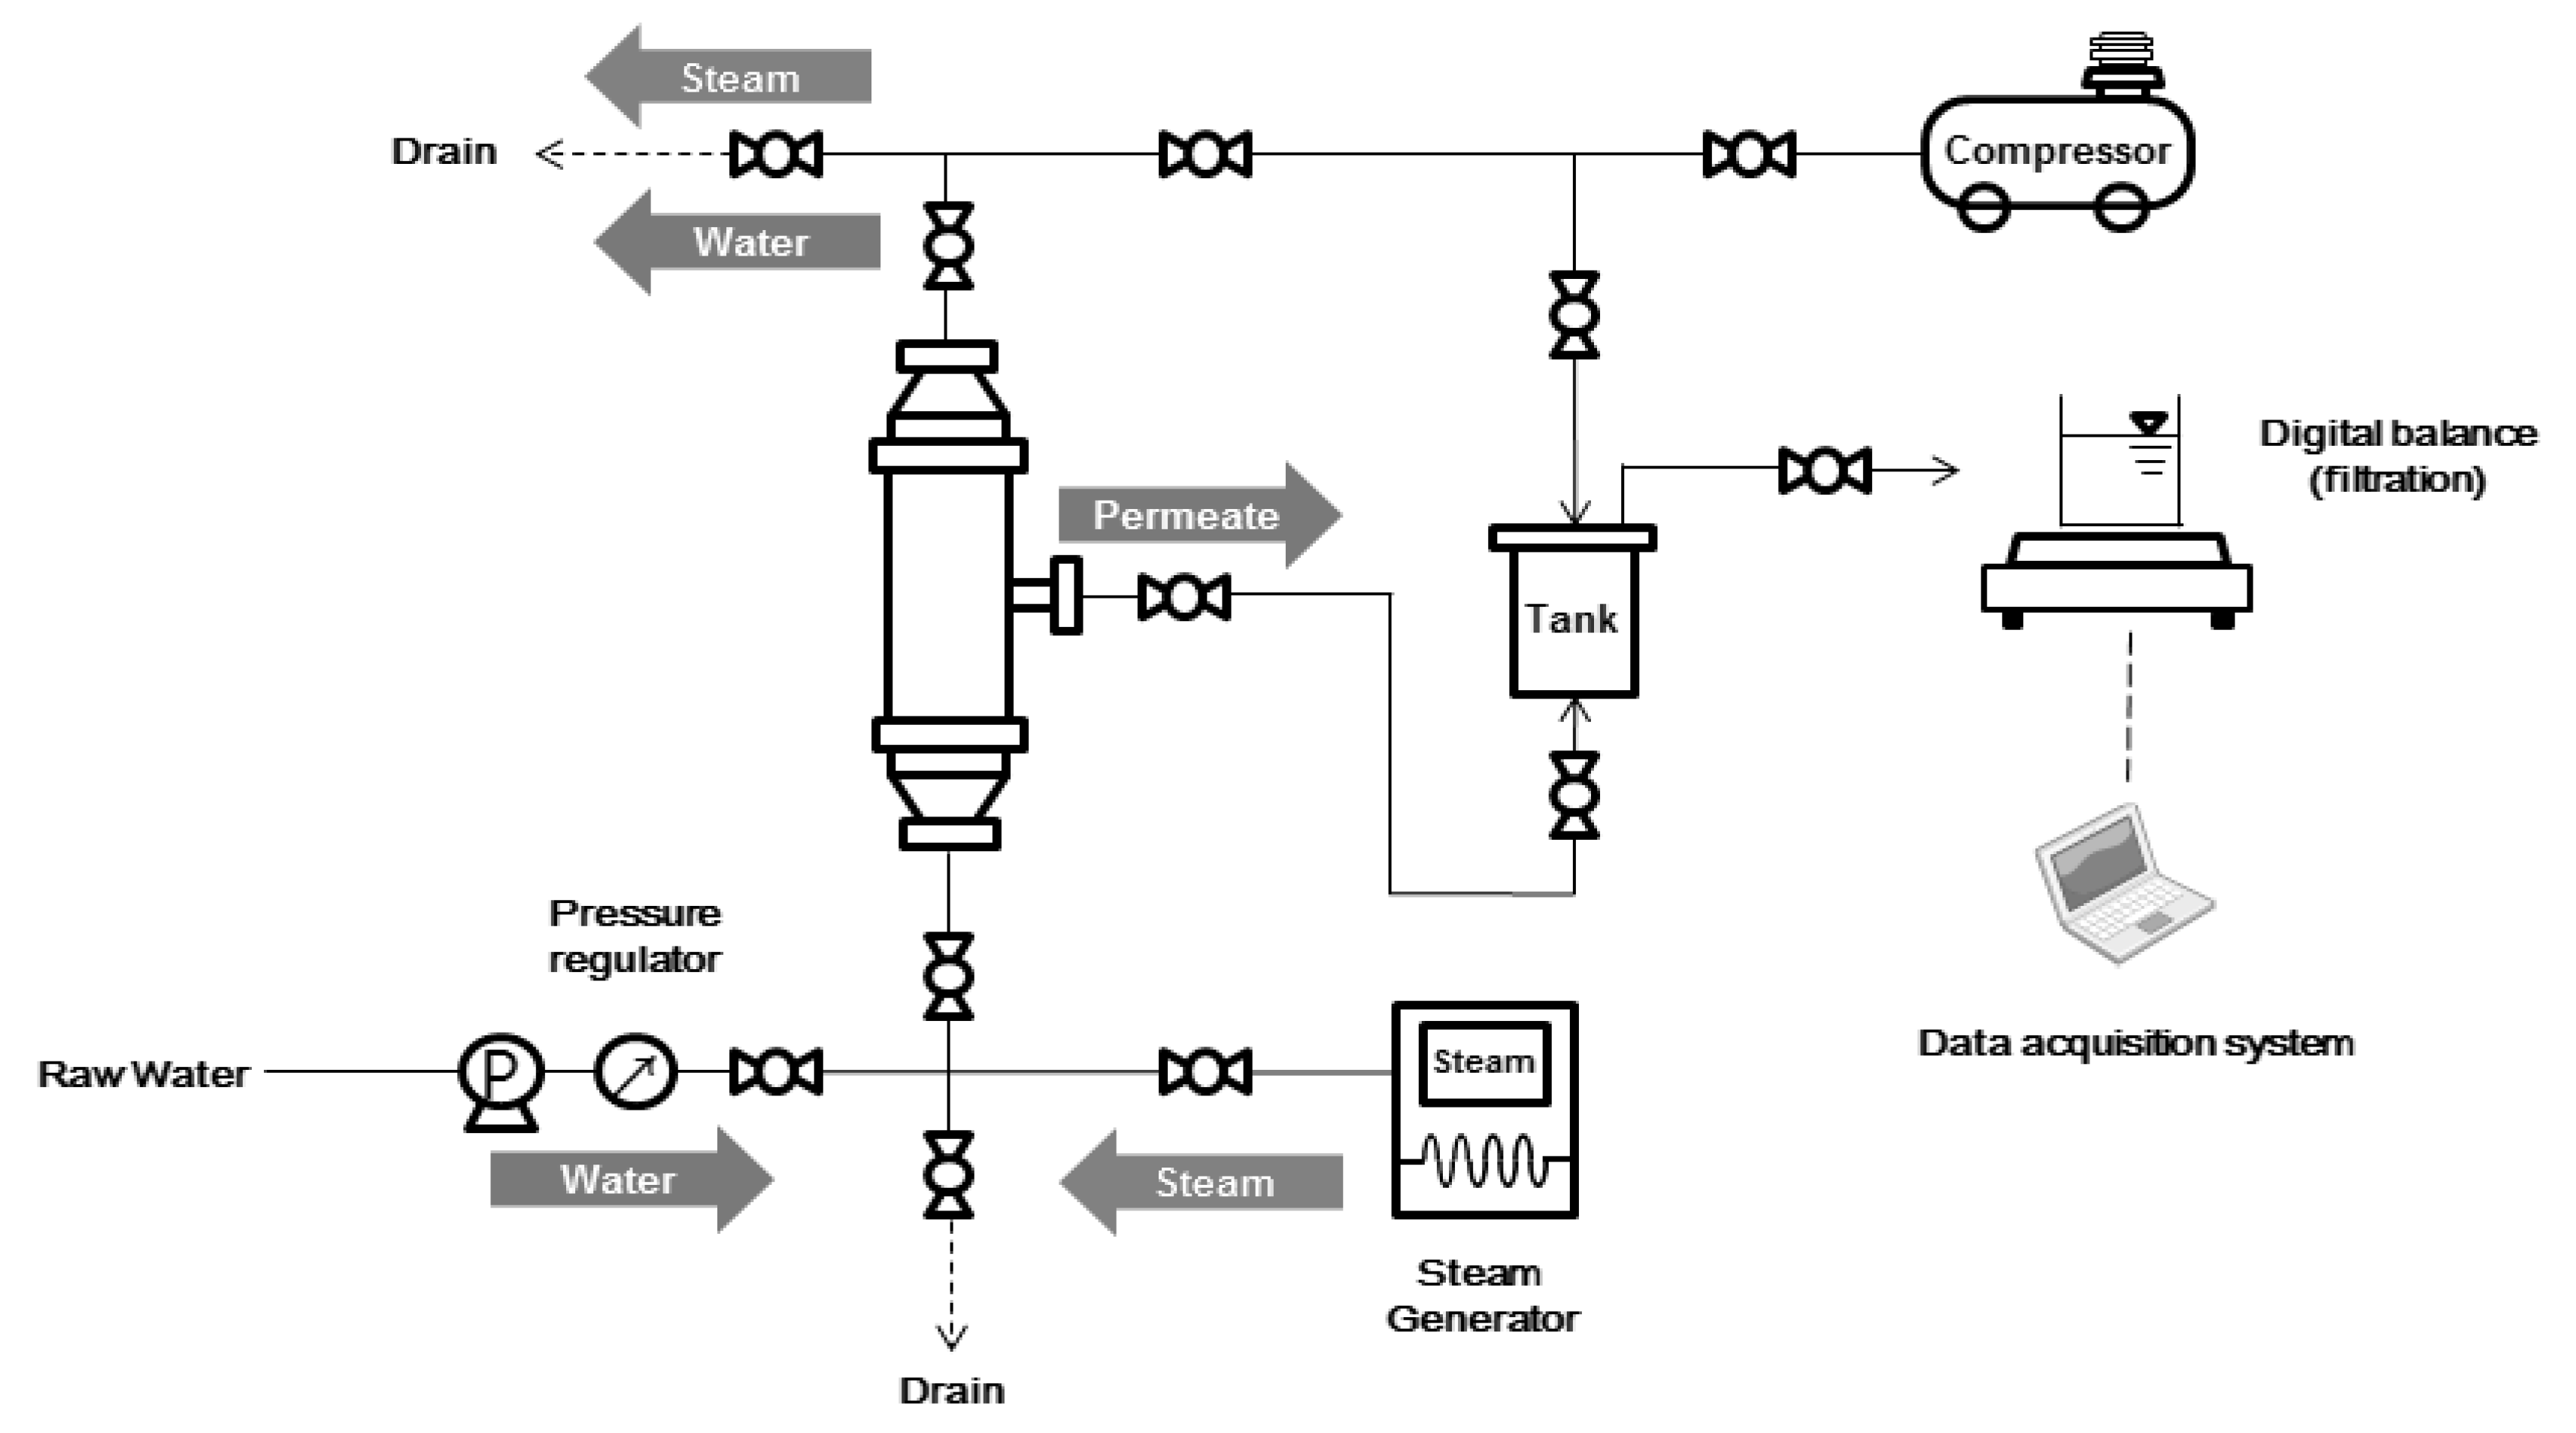
2.1. Ceramic Membrane Filtration Process
2.2. Method of Washing
2.2.1. Physical Cleaning
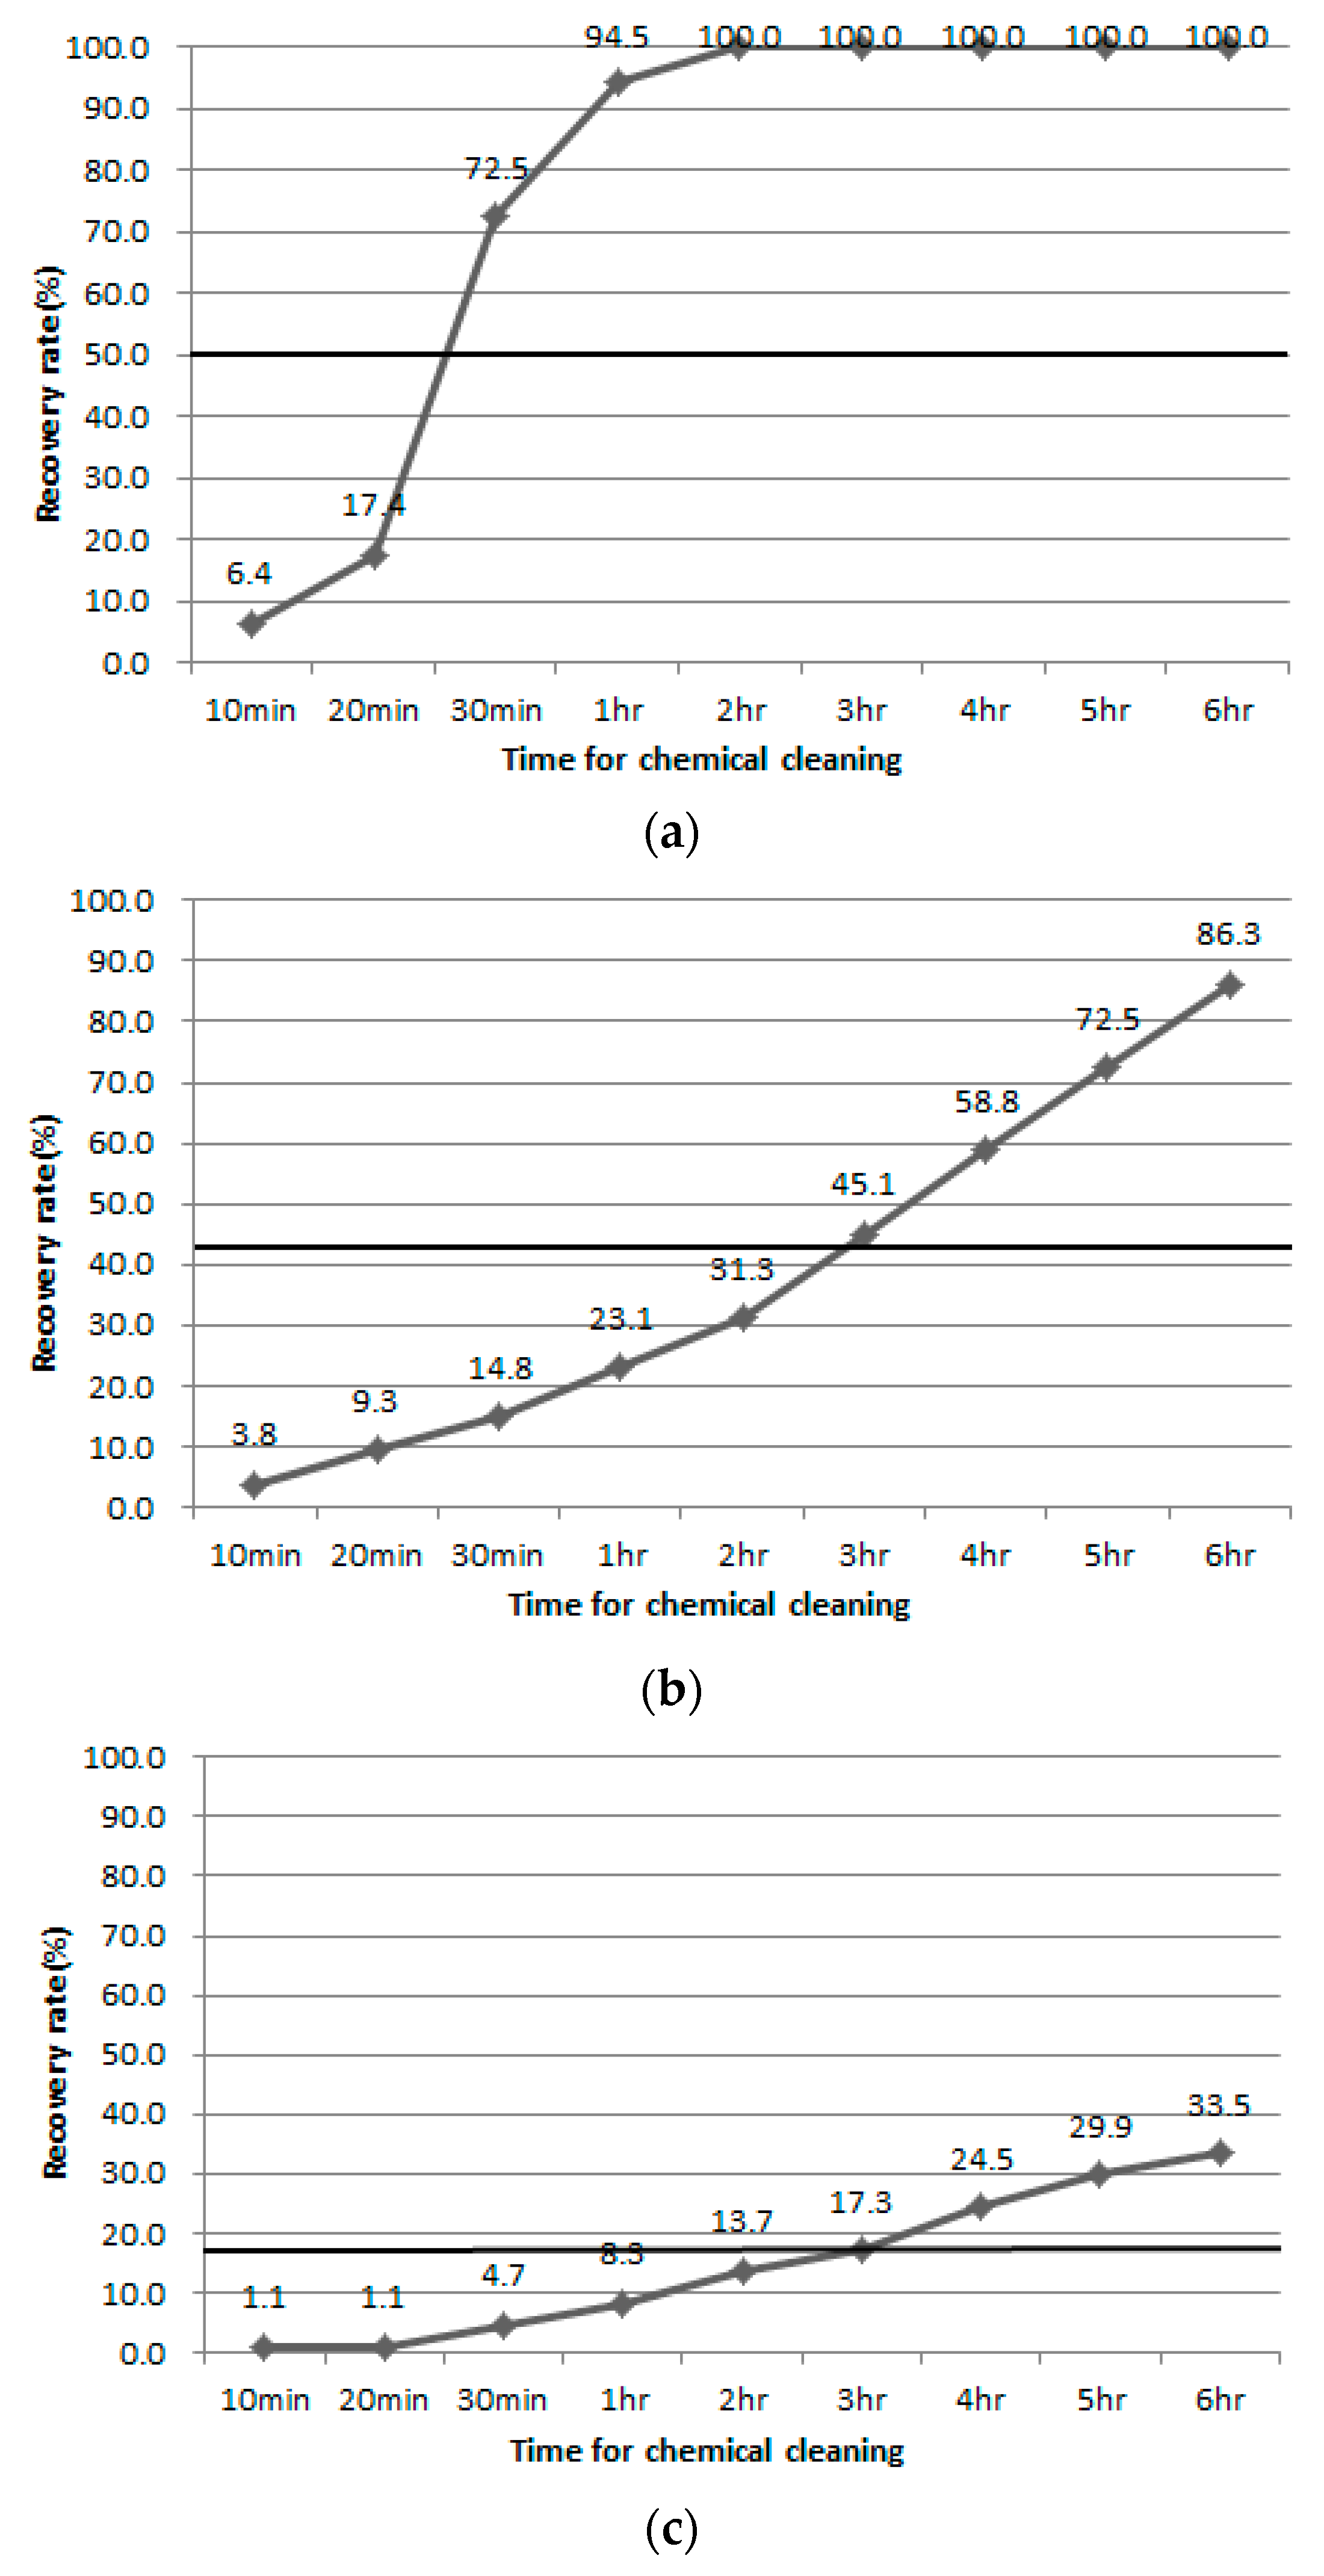
2.2.2. Chemical Cleaning
2.2.3. Steam Cleaning
2.3. Evaluation of Cleaning Recovery
2.3.1. JT/J0 and VT/VA
2.3.2. Membrane Recovery Rate
- J0: flux during DI filtration before raw water filtration
- J1: flux at the end of raw water filtration
- J2: flux during DI filtration after raw water filtration
3. Results and Discussion
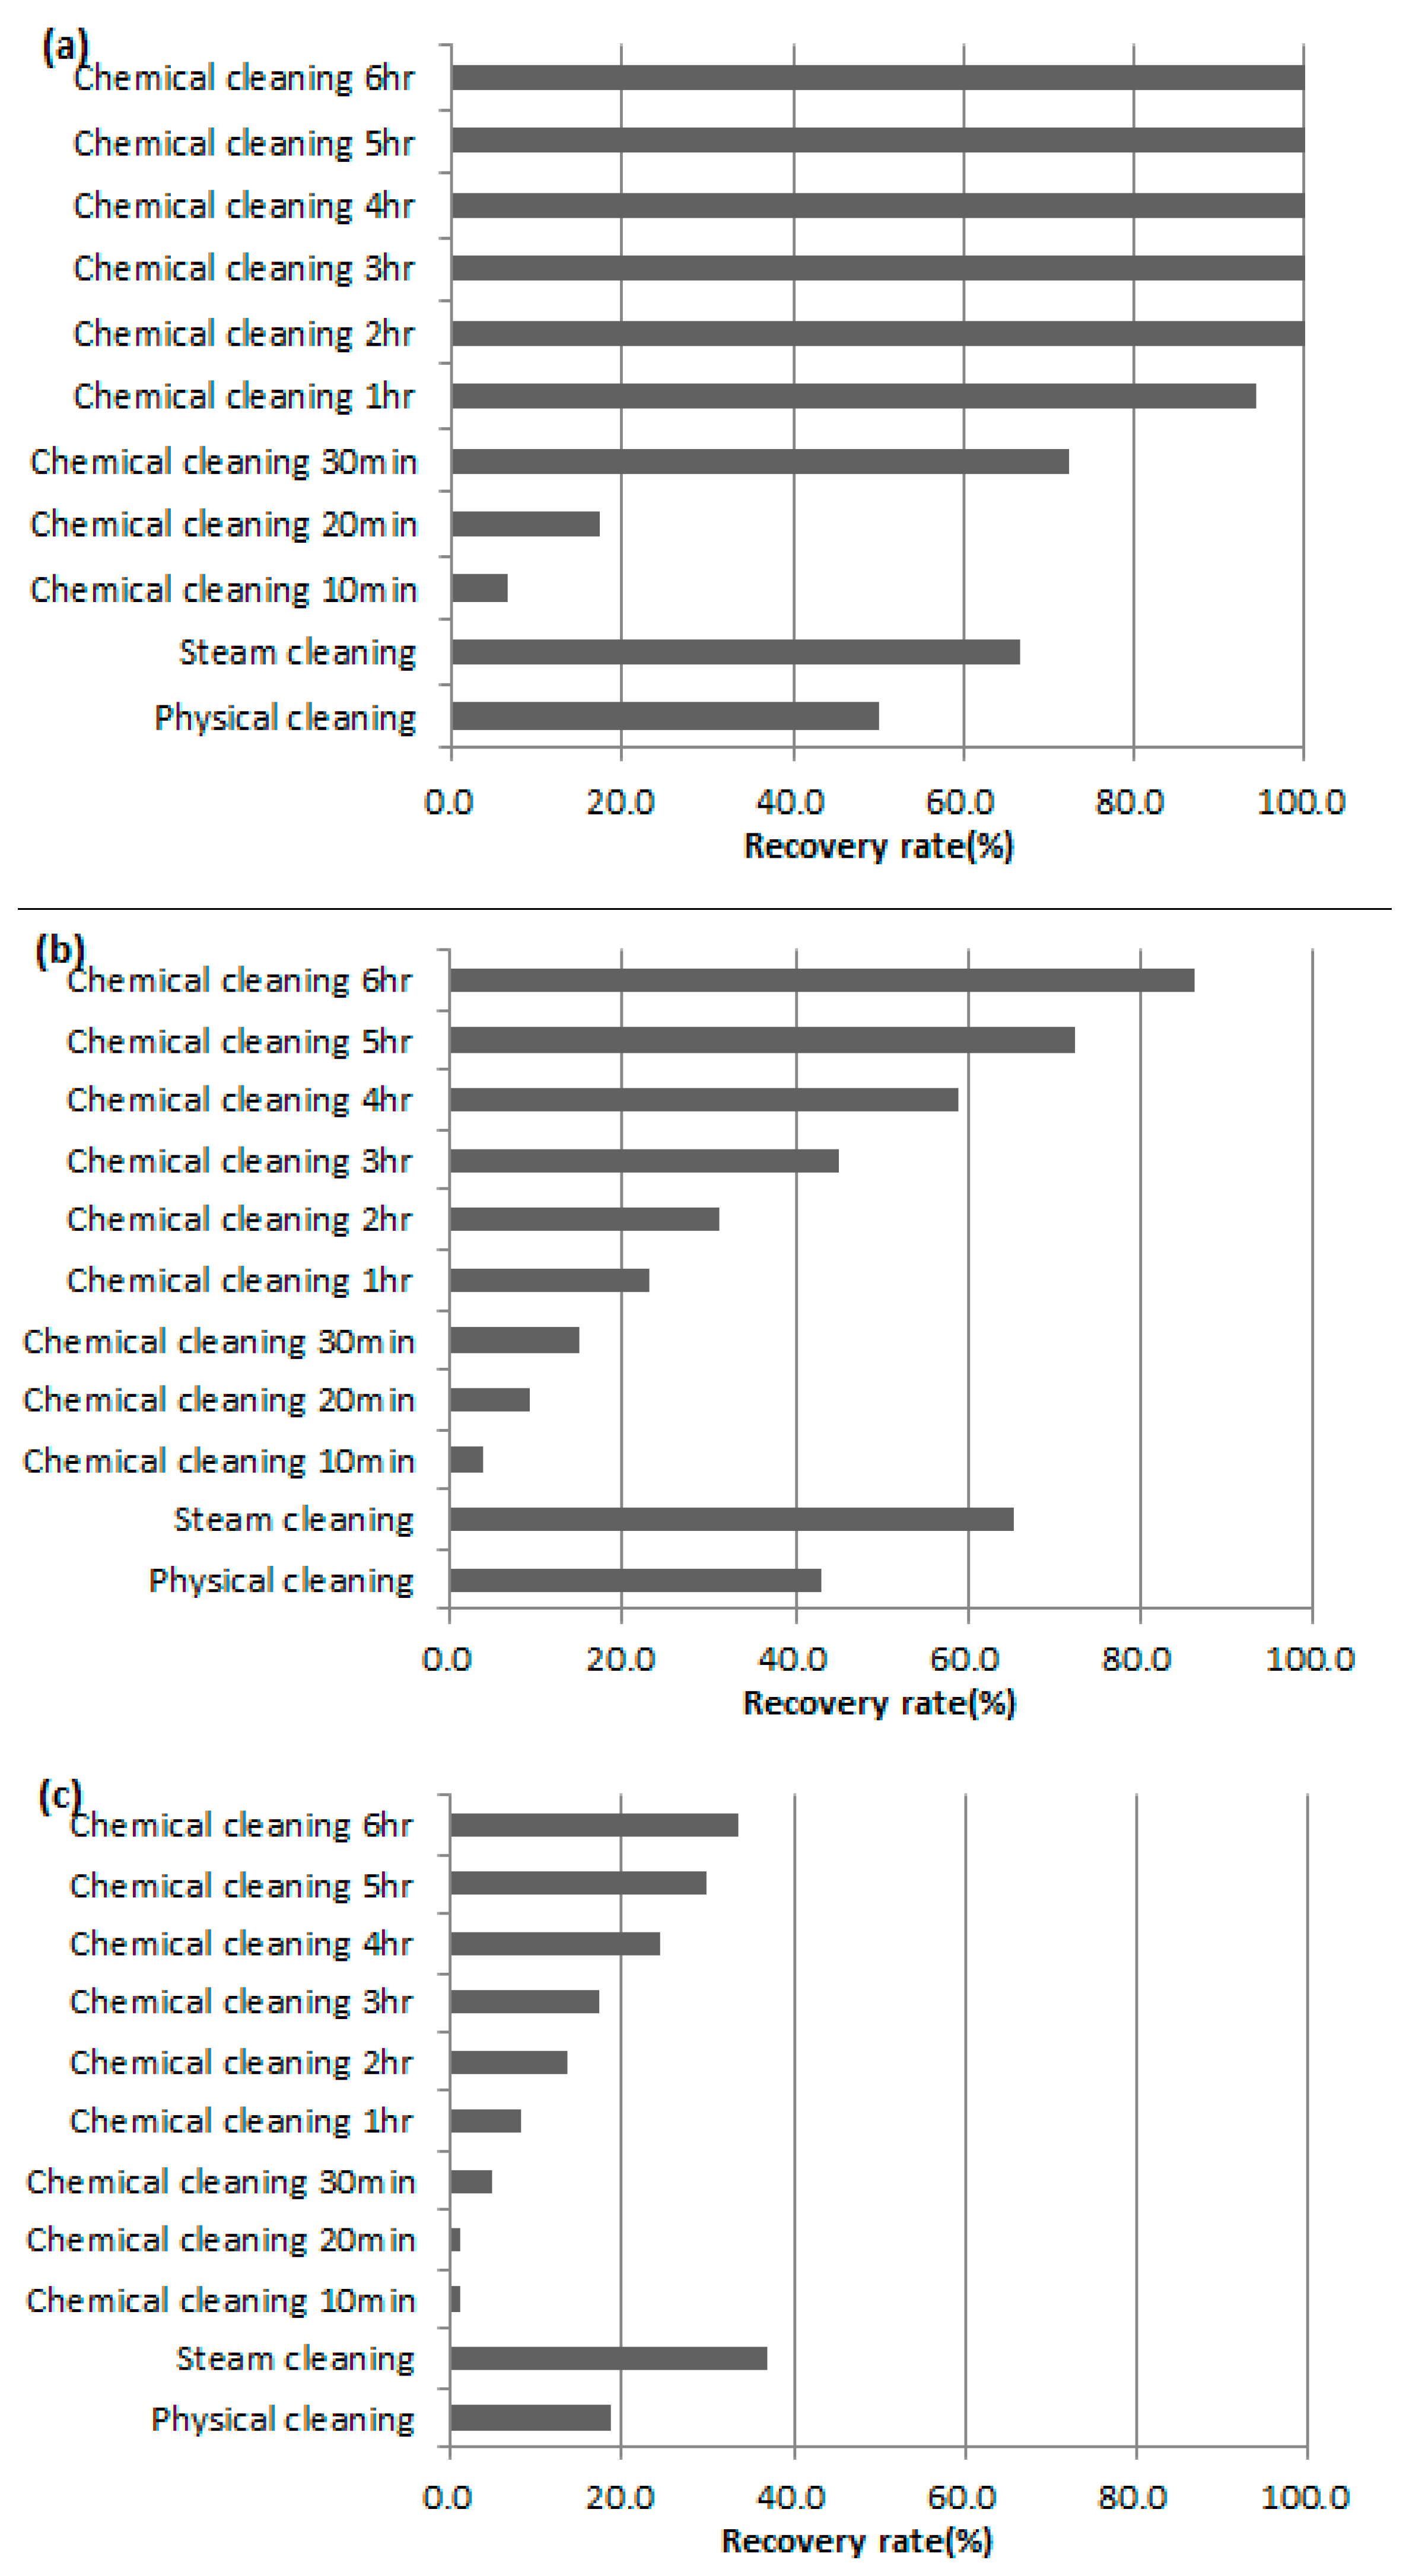
3.1. Comparison of Membrane Recovery Rate after Physical and Chemical Cleaning
3.2. Difference of Contamination According to Raw Water Characteristics
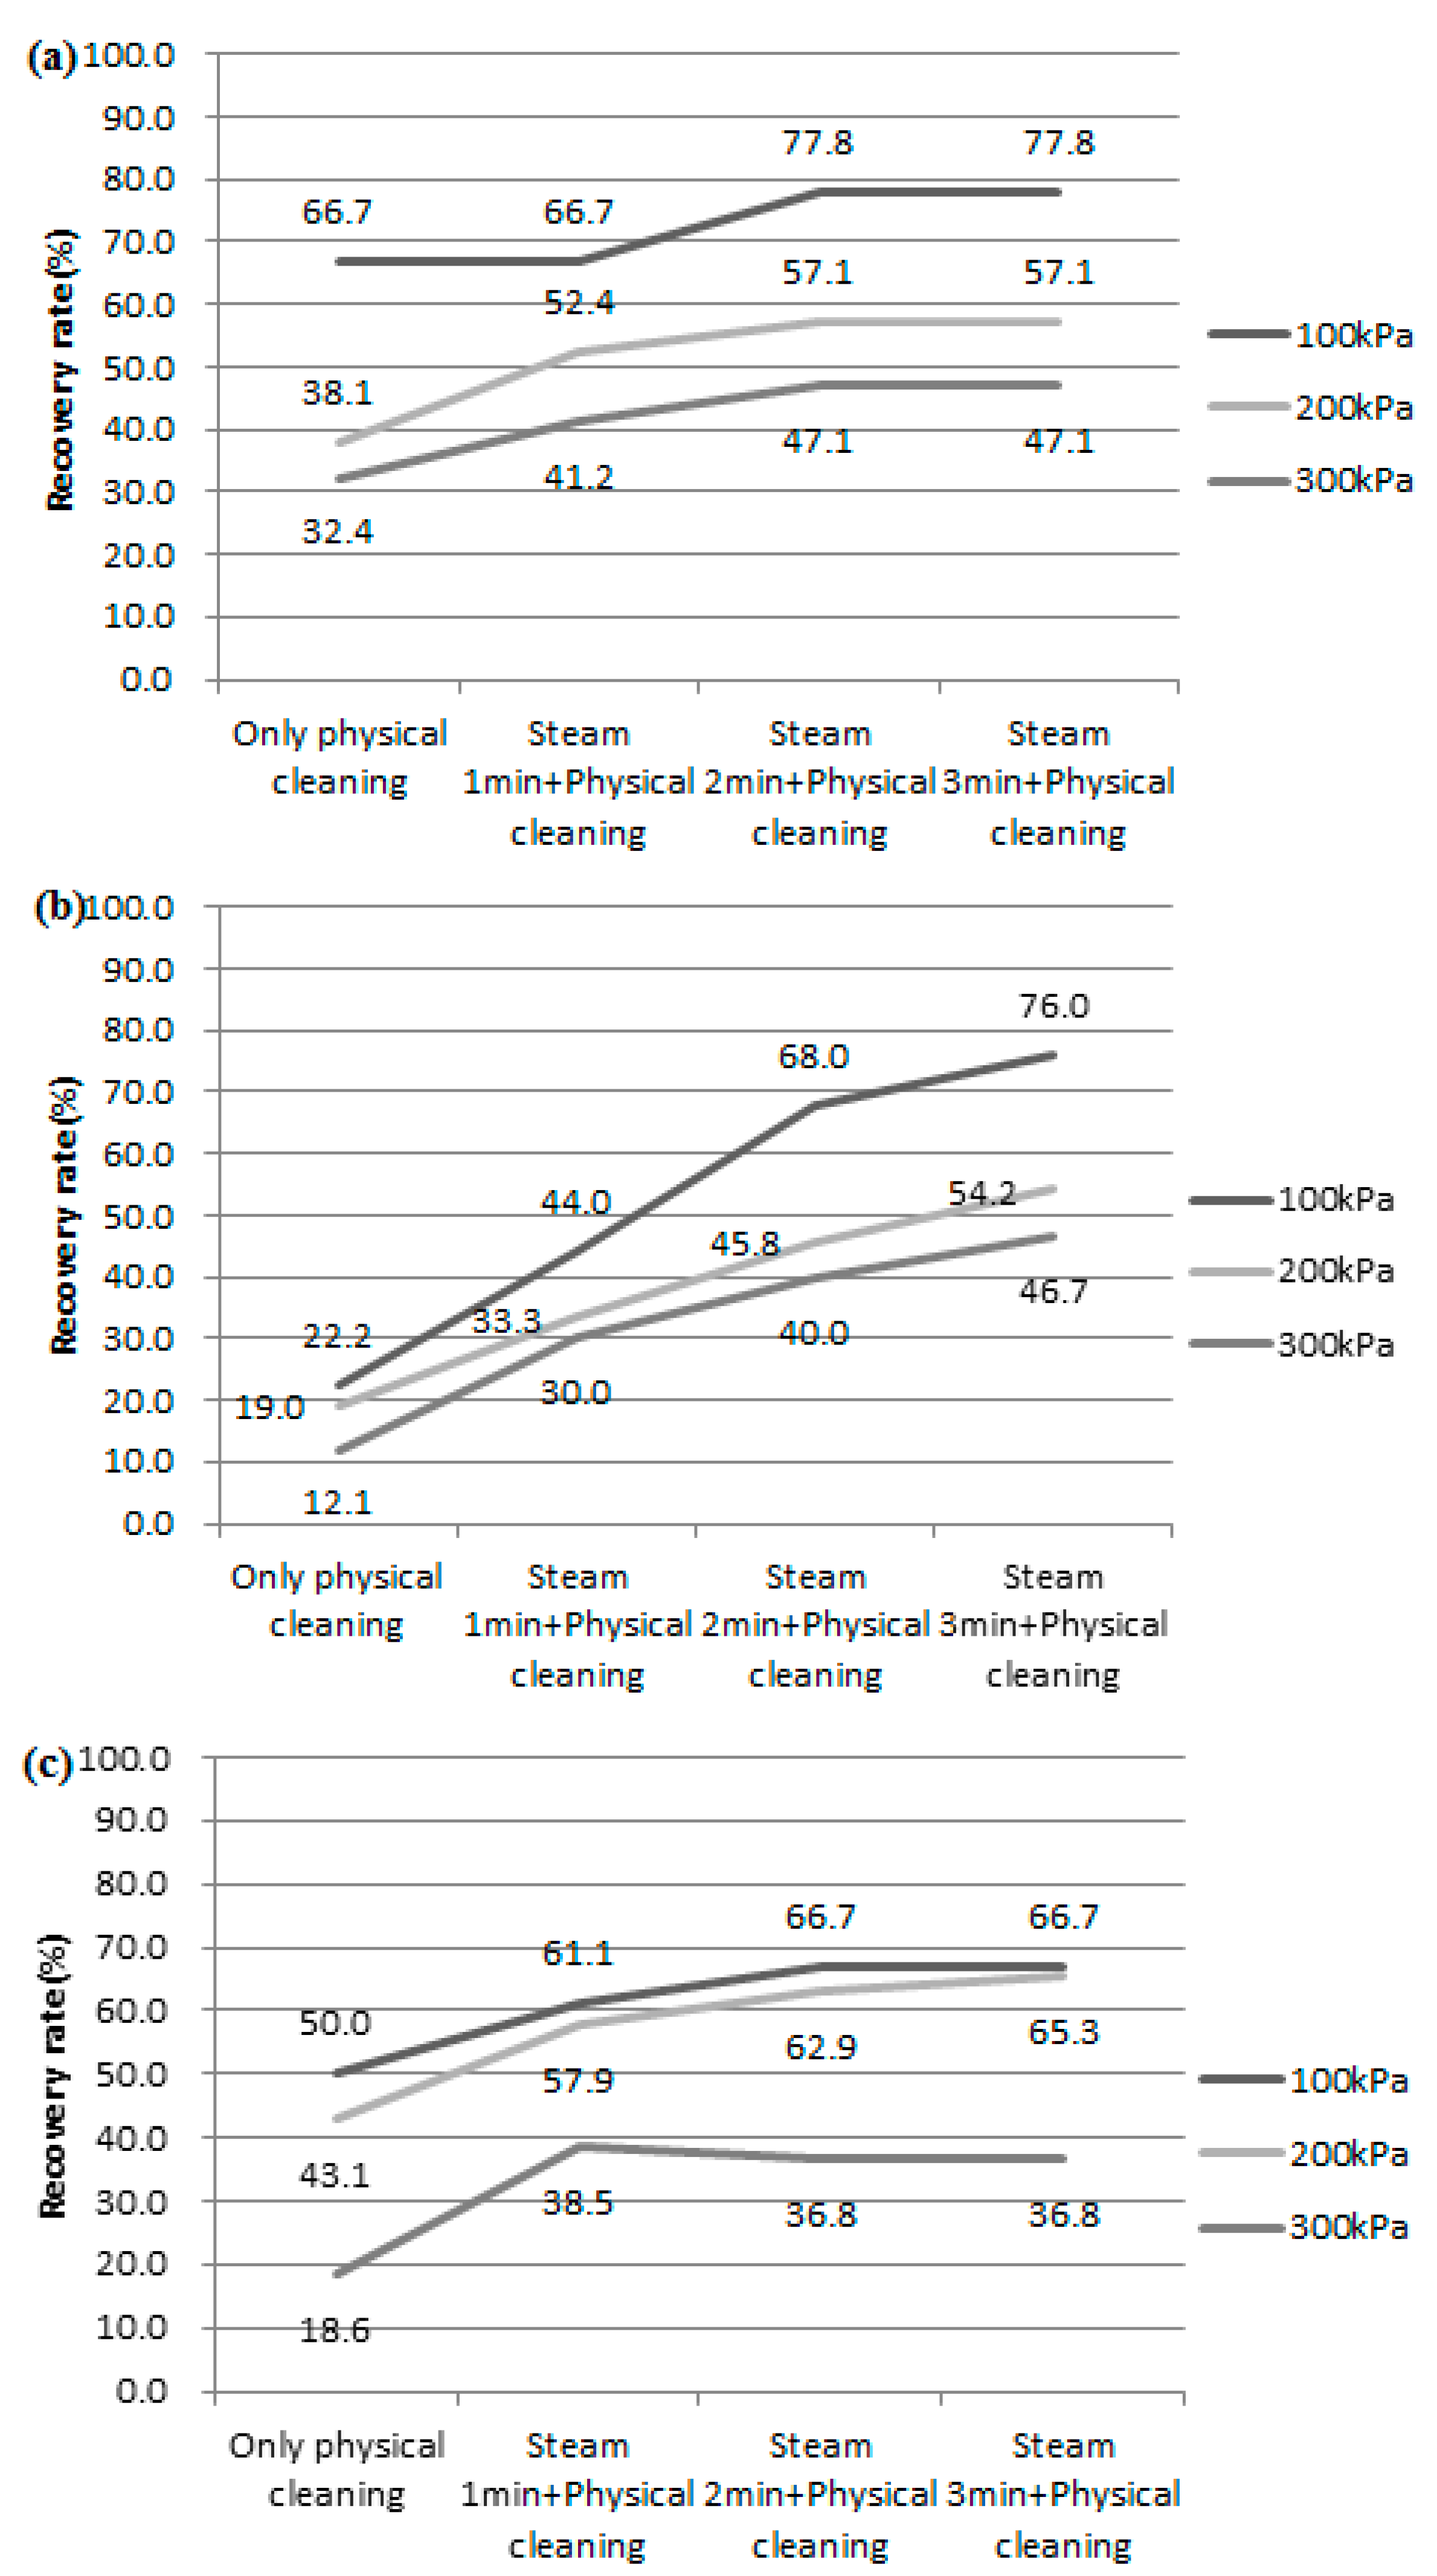
3.3. Application of Steam Cleaning
3.4. The Role of Steam Washing
4. Conclusions
Author Contributions
Funding
Conflicts of Interest
References
- Park, J.Y.; Kim, J.H.; Nam, J.W.; Kim, G.Y.; Kim, M.J.; Jang, A.; Kim, H.S. Evaluation of Maintenance Chemical Cleaning in SWRO Desalination Process. J. Korean Soc. Water Environ. 2014, 2014, 364–365. [Google Scholar]
- Lee, H.W.; An, K.H.; Cho Lee, Y.T.; Jung-Kyo, O. A Study on the Opimization of Process and Operation Condition for Membrane System in Tap Water Treatment. Membr. J. 1999, 9, 193–201. [Google Scholar] [CrossRef]
- Choksuchart, P.; Héran, M.; Grasmick, A. Ultrafiltration enhanced by coagulation in an immersed membrane system. Desalination 2002, 145, 265–272. [Google Scholar] [CrossRef]
- Lee, H.W.; An, K.H.; Choi, J.S.; Kim, S.K.; Oh, H.J. Effect of Trans-Membrane Pressure on Reversible and Irreversible Fouling Formation of Ceramic Membrane. J. Korean Soc. Environ. Eng. 2012, 34, 637–643. [Google Scholar] [CrossRef]
- In-Hyuck, S.; Jang-Hoon, H.; Byungseo, B.; Young-Jo, P.; Jae-Woong, K.; Youn-Kyoung, B.; Young-Kuk, K.; Jung-Goo, L.; Yoo-Dong, H. Research trend of ceramic filter for water treatment. J. Korean Powder Metall. Inst. 2014, 21, 62–71. [Google Scholar] [CrossRef]
- Kyu-Seob, C. Application of membrane separation process to fermented food. Food Sci. Ind. 1999, 32, 2–13. [Google Scholar]
- Seoul Water Research Institute. Seoul Water 2015-II; Seoul Water Research Institute: Seoul, Korea, 2015; pp. 291–332. [Google Scholar]
- Lateef, S.K.; Soh, B.Z.; Kimura, K. Direct membrane filtration of municipal wastewater with chemically enhanced backwash for recovery of organic matter. Bioresour. Technol. 2013, 150, 149–155. [Google Scholar] [CrossRef] [PubMed]


| Advantages | Disadvantages |
|---|---|
| High-temperature thermal stability | High cost: 5 times higher than polymer membranes |
| High chemical stability: High corrosion resistance | |
| Long-term use | Easy to break due to high brittleness |
| High mechanical strength |
| Parameter | Case A | Case B | Case C |
|---|---|---|---|
| Turbidity | 10 NTU | 25 NTU | 10 NTU |
| DOC concentration | 2.5 ppm | 2.5 ppm | 8 ppm |
| Categories | Contents | |
|---|---|---|
| Membrane Type | MF ceramic membrane | 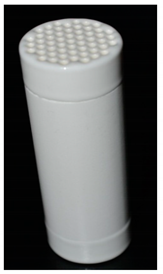 |
| Material | Ceramic (Al2O3) | |
| Type | Inner-pressure monolith | |
| Nominal pore size | 0.1 µm | |
| Membrane surface area | 0.035 m2 | |
| pH range | 0~14 | |
| Max. Operating pressure | 20 kgf/cm2 | |
| Manufactory | METAWATER (Tokyo, Japan) |
| Categories | Analyzers | Etc. |
|---|---|---|
| Turbidity | 2100N Turbidimeter, HACH (Loveland, CO, USA) | NTU (Nephelometric Turbidity Unit) |
| UV254 | UV-1800, Shimadzu (Kyoto, Japan) | Ultraviolet photometer |
| DOC | TOC-VCPH, Shimadzu (Kyoto, Japan) | NPOC (Non-purgeable organic carbon) |
| Temperature | Orion 3star, Thermo (Walthan, MA, USA) | Degrees celsius |
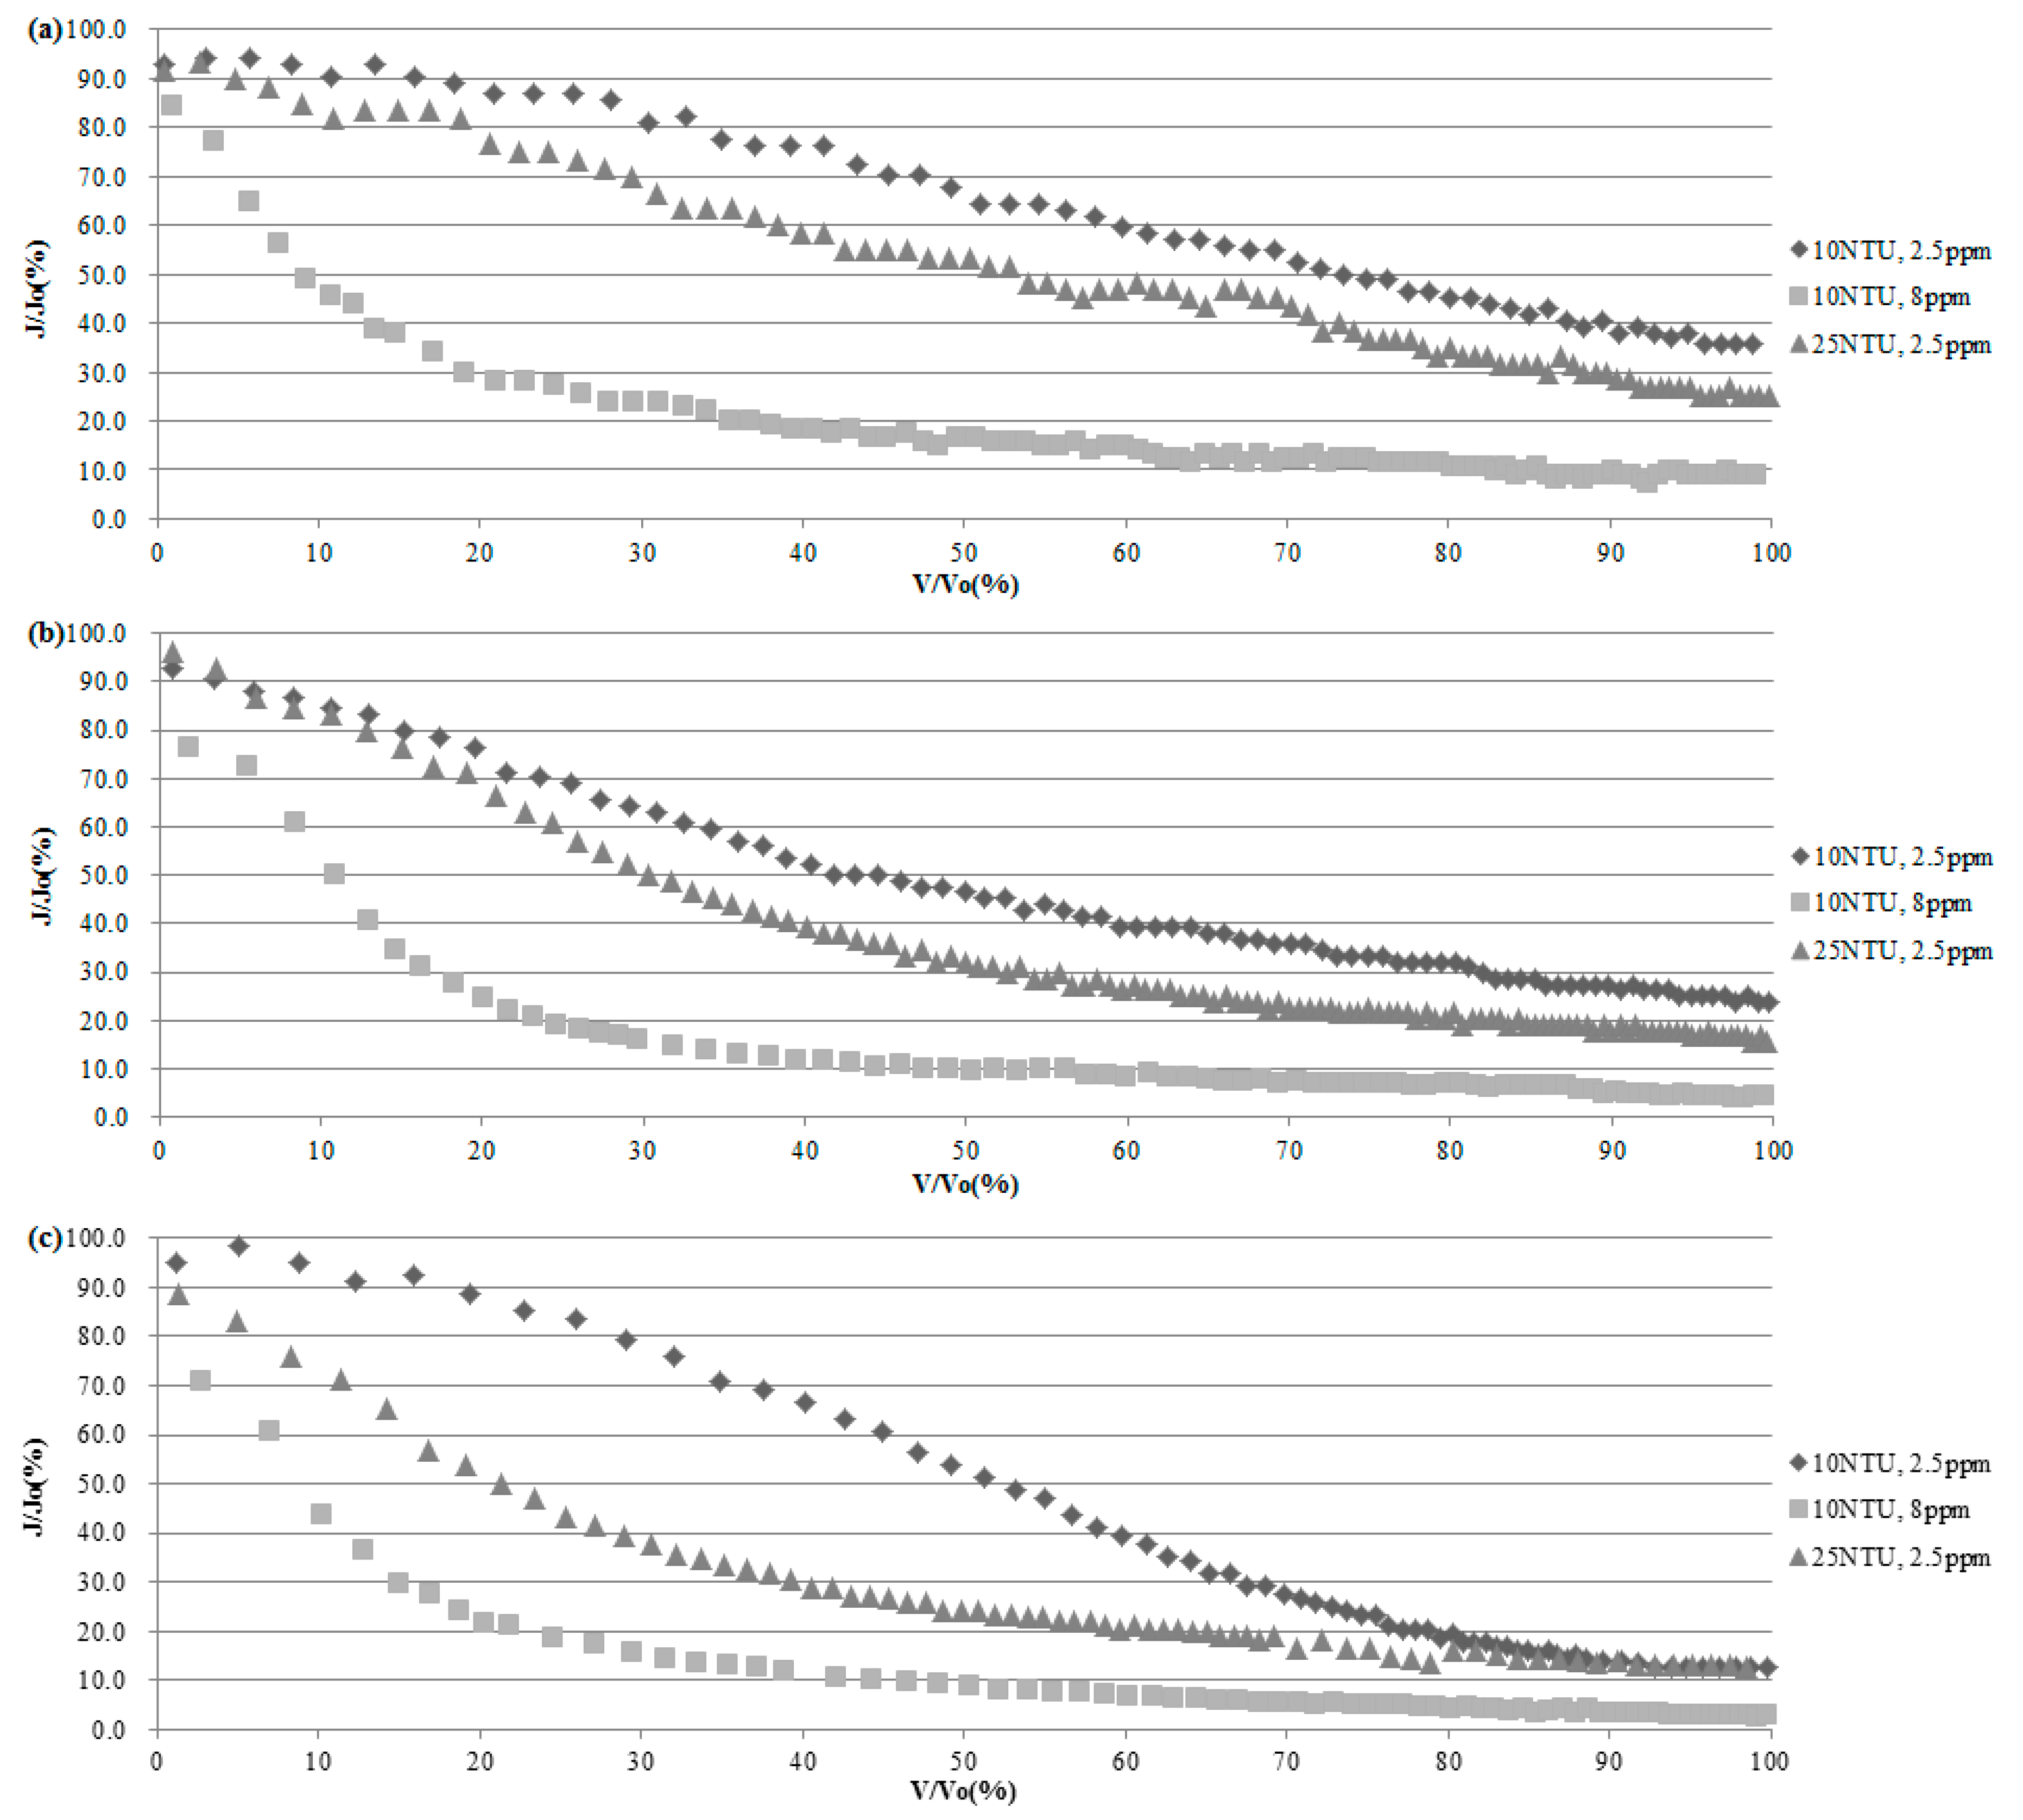
| Parameter | 10 NTU, DOC 2.5 ppm | 10 NTU, DOC 8 ppm | 25 NTU, DOC 2.5 ppm | ||||||
|---|---|---|---|---|---|---|---|---|---|
| 100 kPa | 200 kPa | 300 kPa | 100 kPa | 200 kPa | 300 kPa | 100 kPa | 200 kPa | 300 kPa | |
| Recovery rate of physical cleaning (%) | 66.7 | 38.1 | 32.4 | 50.0 | 43.1 | 18.6 | 22.2 | 19.0 | 12.1 |
| JT/J0 at the end of filtration (%) | 35.7 | 25.0 | 12.8 | 8.7 | 3.6 | 2.7 | 25.0 | 14.3 | 11.4 |
© 2018 by the authors. Licensee MDPI, Basel, Switzerland. This article is an open access article distributed under the terms and conditions of the Creative Commons Attribution (CC BY) license (http://creativecommons.org/licenses/by/4.0/).
Share and Cite
Park, S.; Kang, J.-S.; Lee, J.J.; Vo, T.-K.-Q.; Kim, H.-S. Application of Physical and Chemical Enhanced Backwashing to Reduce Membrane Fouling in the Water Treatment Process Using Ceramic Membranes. Membranes 2018, 8, 110. https://doi.org/10.3390/membranes8040110
Park S, Kang J-S, Lee JJ, Vo T-K-Q, Kim H-S. Application of Physical and Chemical Enhanced Backwashing to Reduce Membrane Fouling in the Water Treatment Process Using Ceramic Membranes. Membranes. 2018; 8(4):110. https://doi.org/10.3390/membranes8040110
Chicago/Turabian StylePark, Seogyeong, Joon-Seok Kang, Jeong Jun Lee, Thi-Kim-Quyen Vo, and Han-Seung Kim. 2018. "Application of Physical and Chemical Enhanced Backwashing to Reduce Membrane Fouling in the Water Treatment Process Using Ceramic Membranes" Membranes 8, no. 4: 110. https://doi.org/10.3390/membranes8040110
APA StylePark, S., Kang, J.-S., Lee, J. J., Vo, T.-K.-Q., & Kim, H.-S. (2018). Application of Physical and Chemical Enhanced Backwashing to Reduce Membrane Fouling in the Water Treatment Process Using Ceramic Membranes. Membranes, 8(4), 110. https://doi.org/10.3390/membranes8040110