The Effect of Chain Structures on the Crystallization Behavior and Membrane Formation of Poly(Vinylidene Fluoride) Copolymers


Abstract
:
1. Introduction
2. Results and Discussion
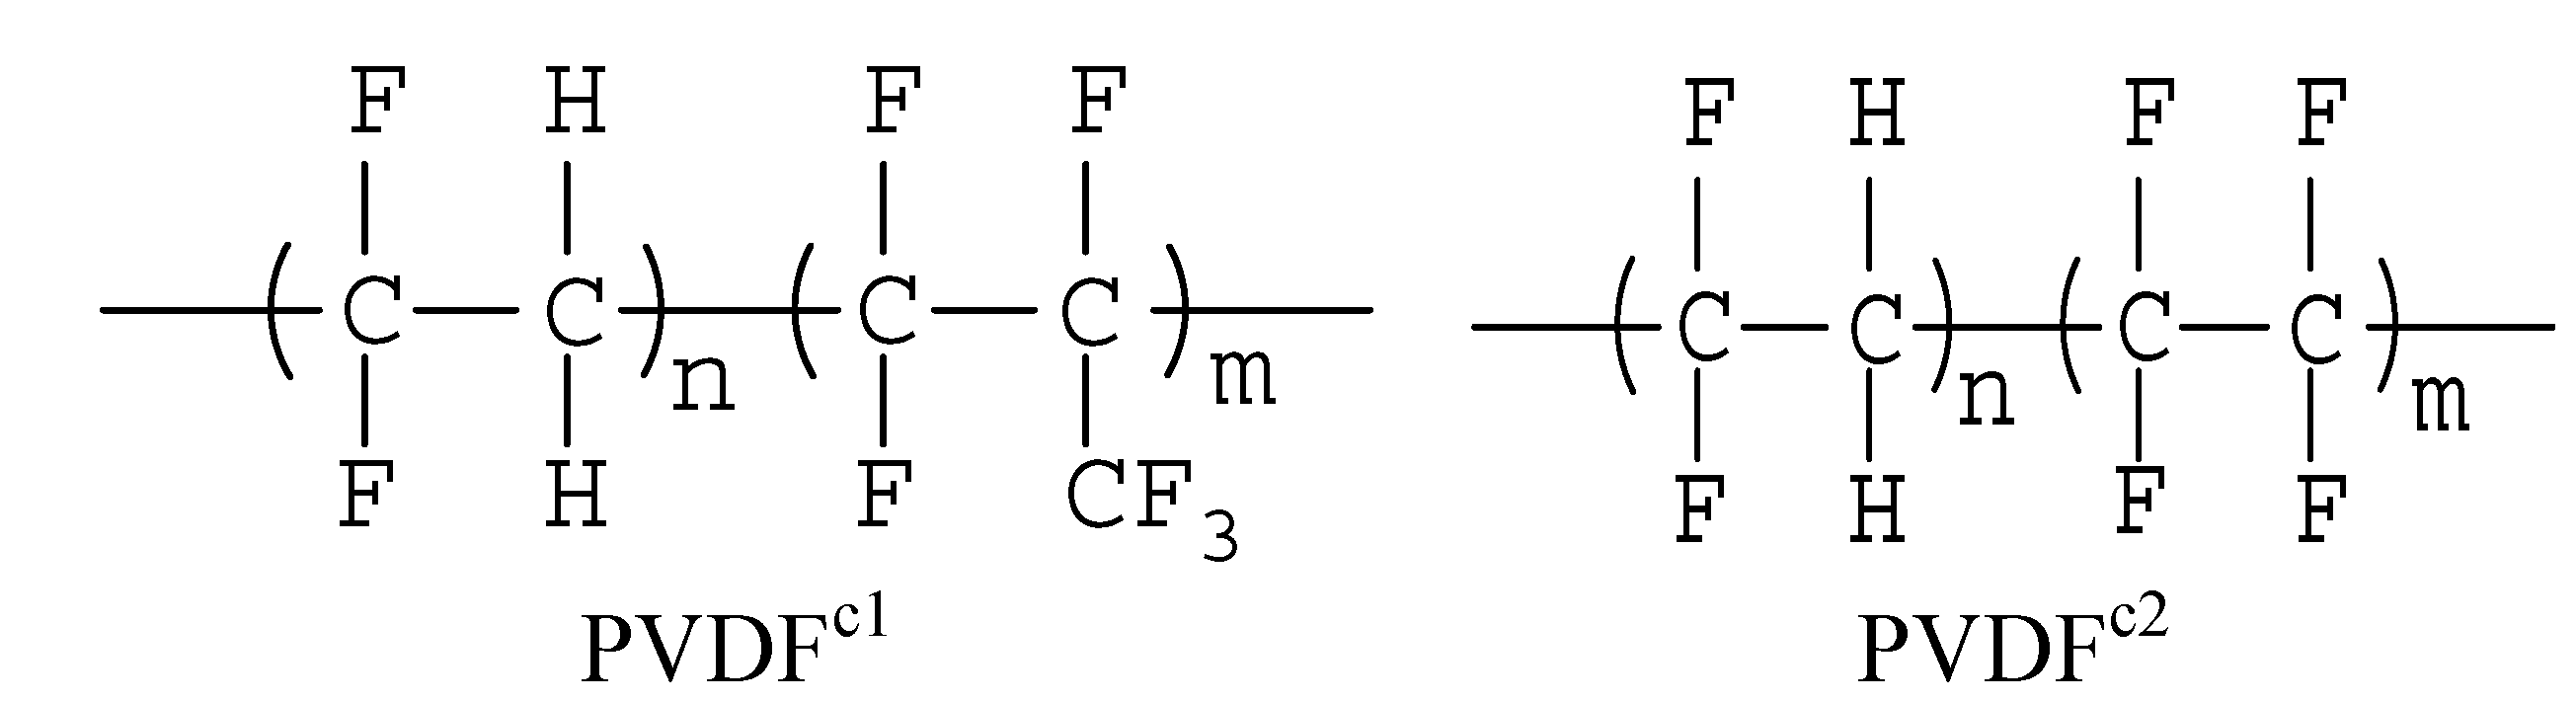
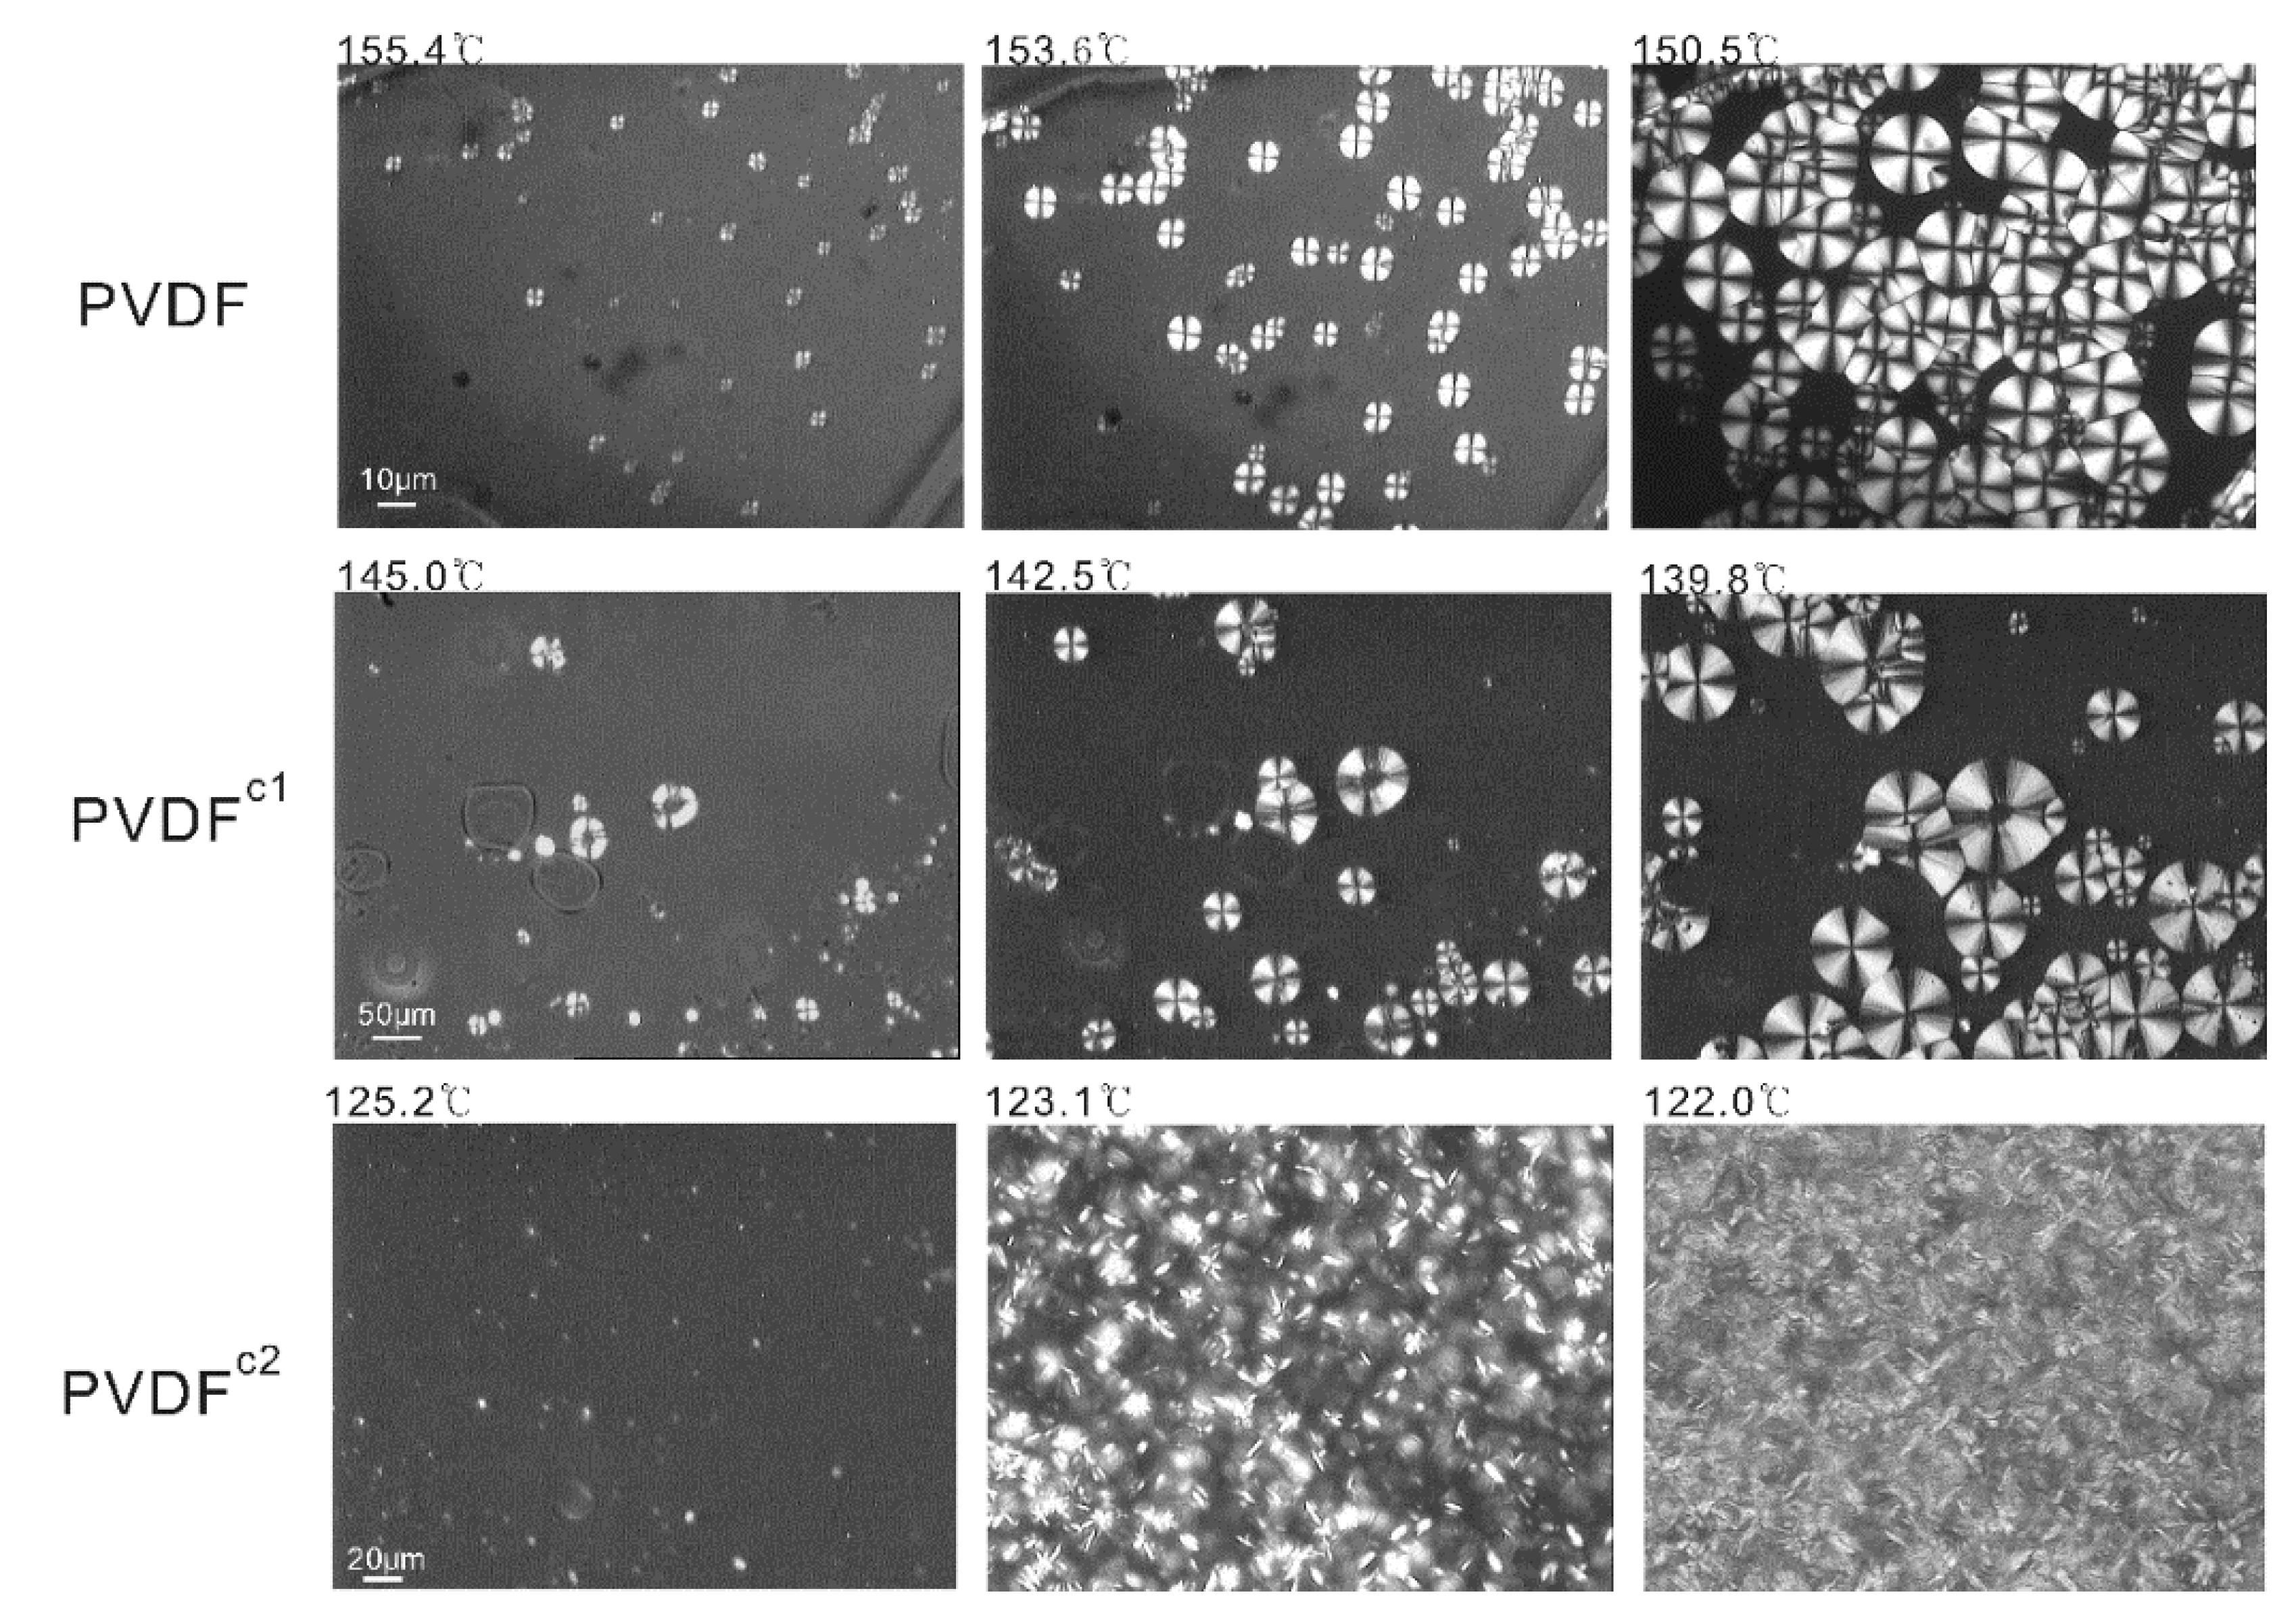
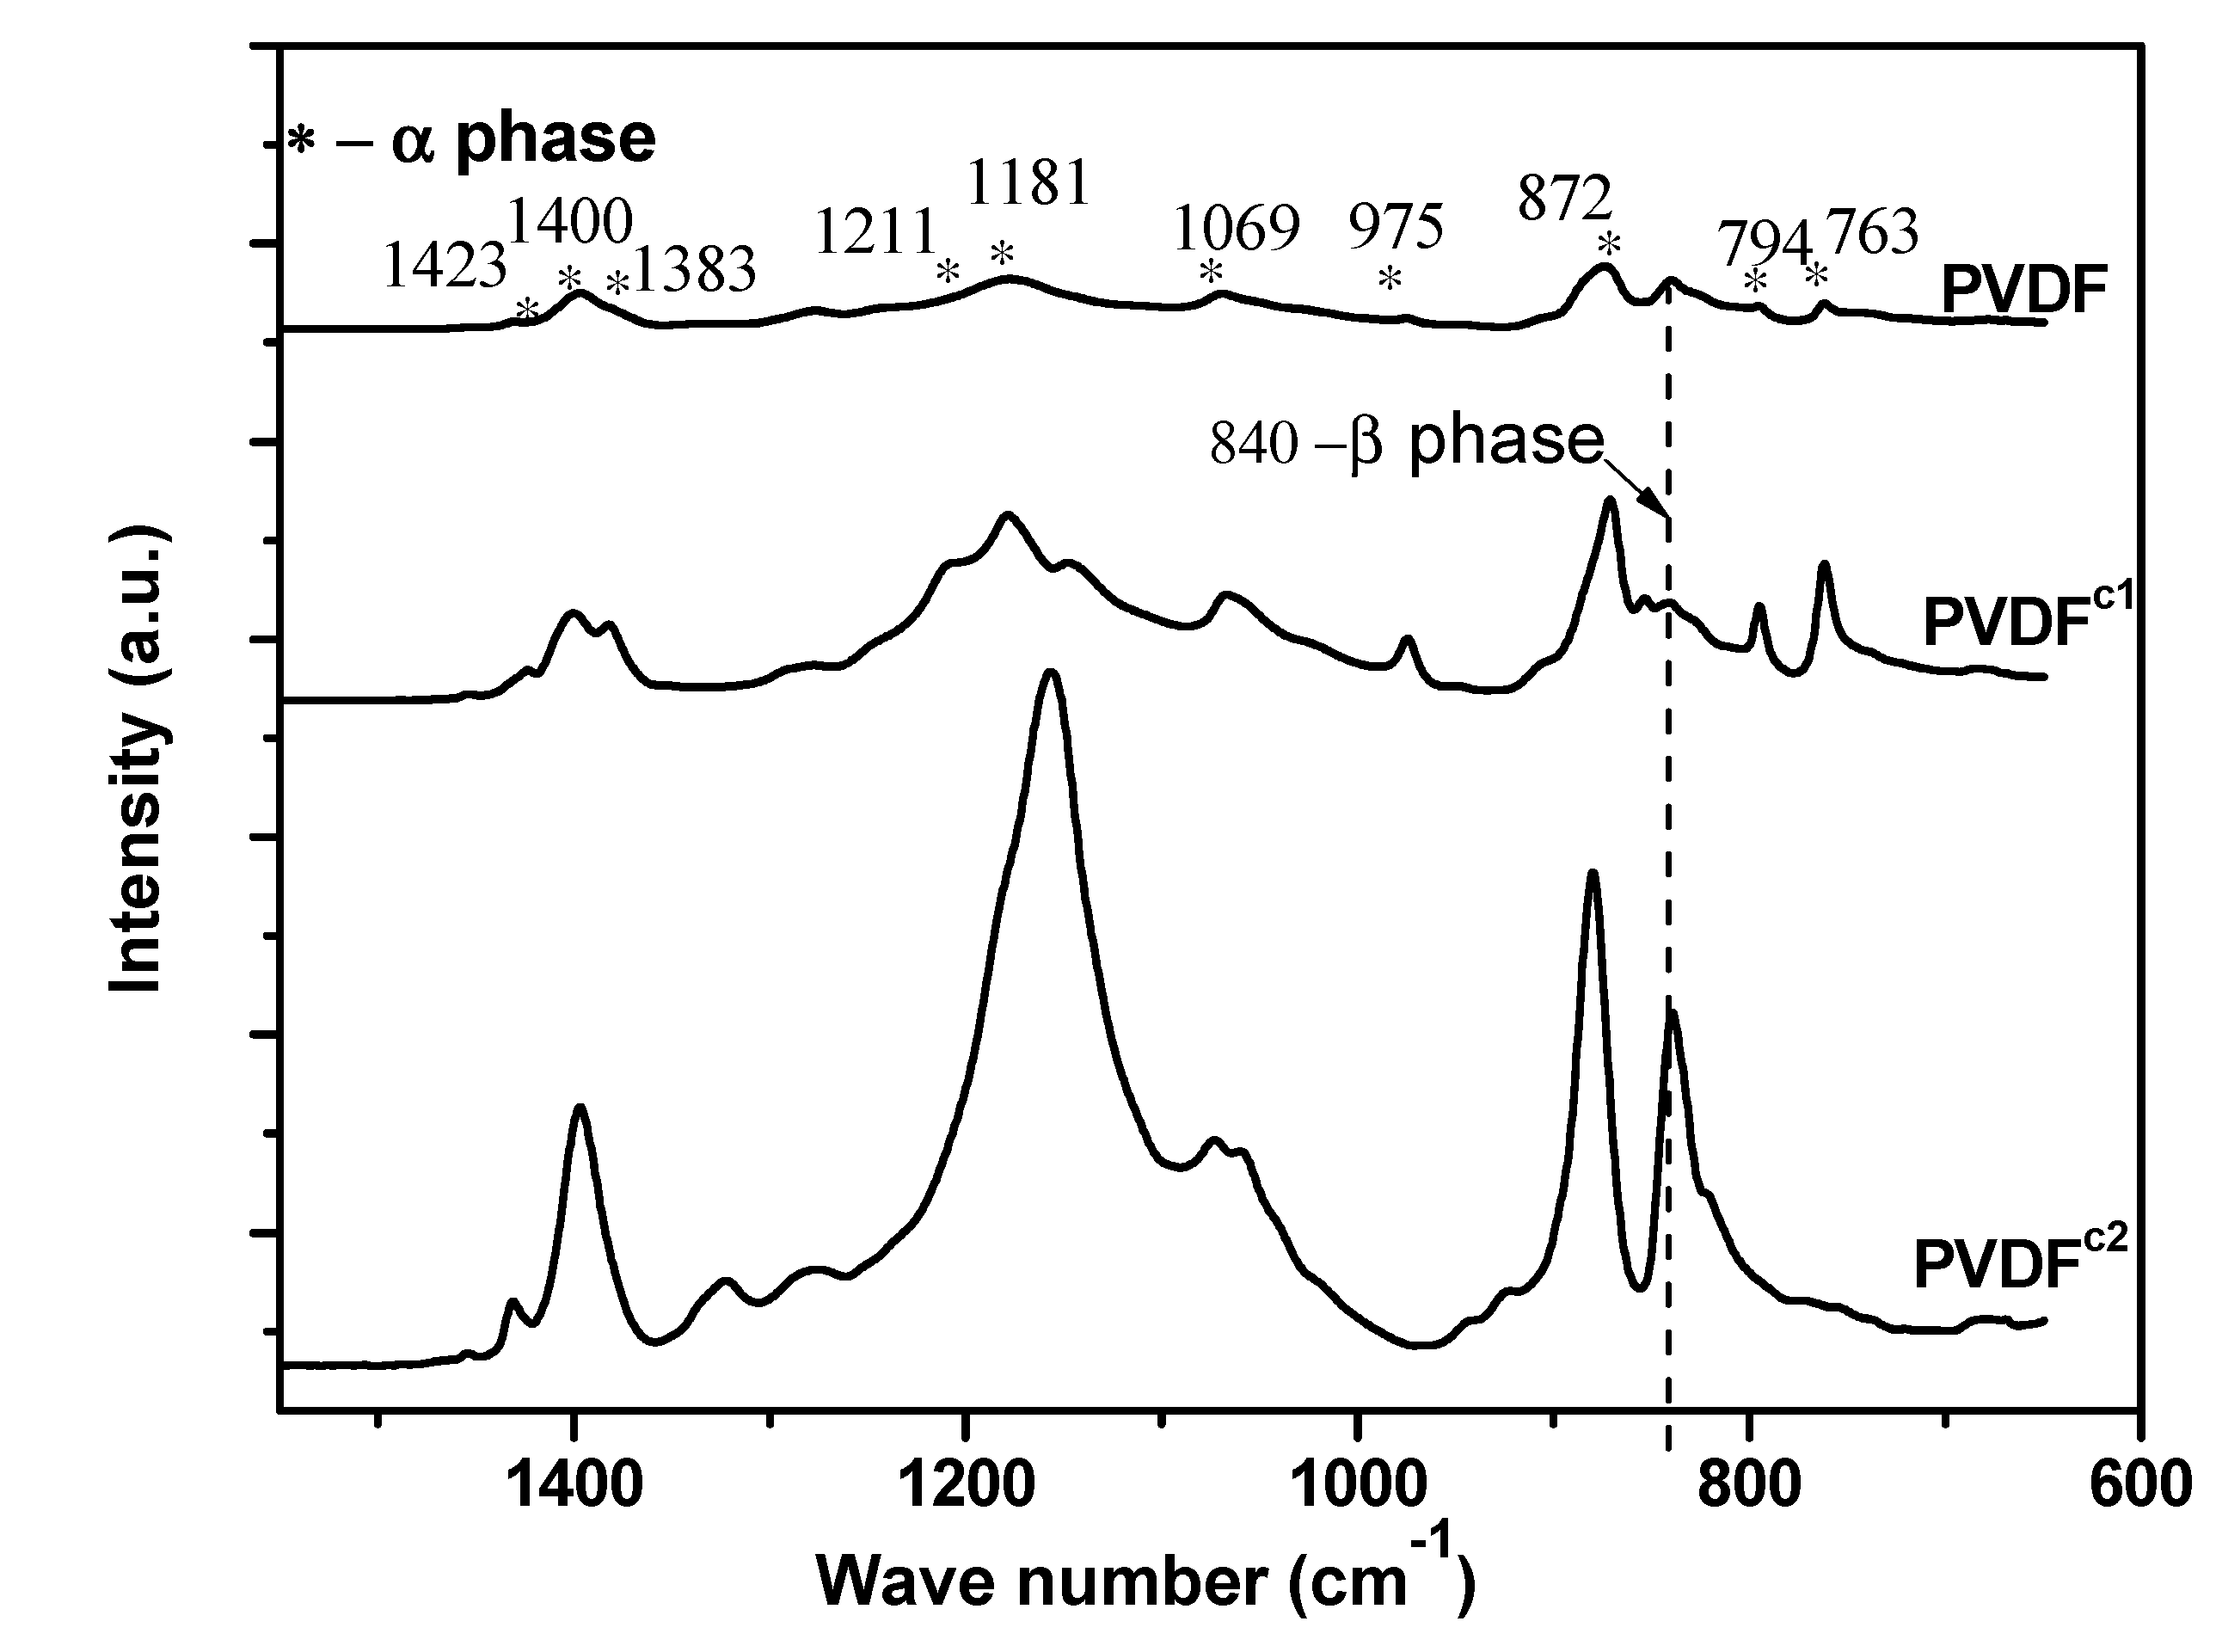
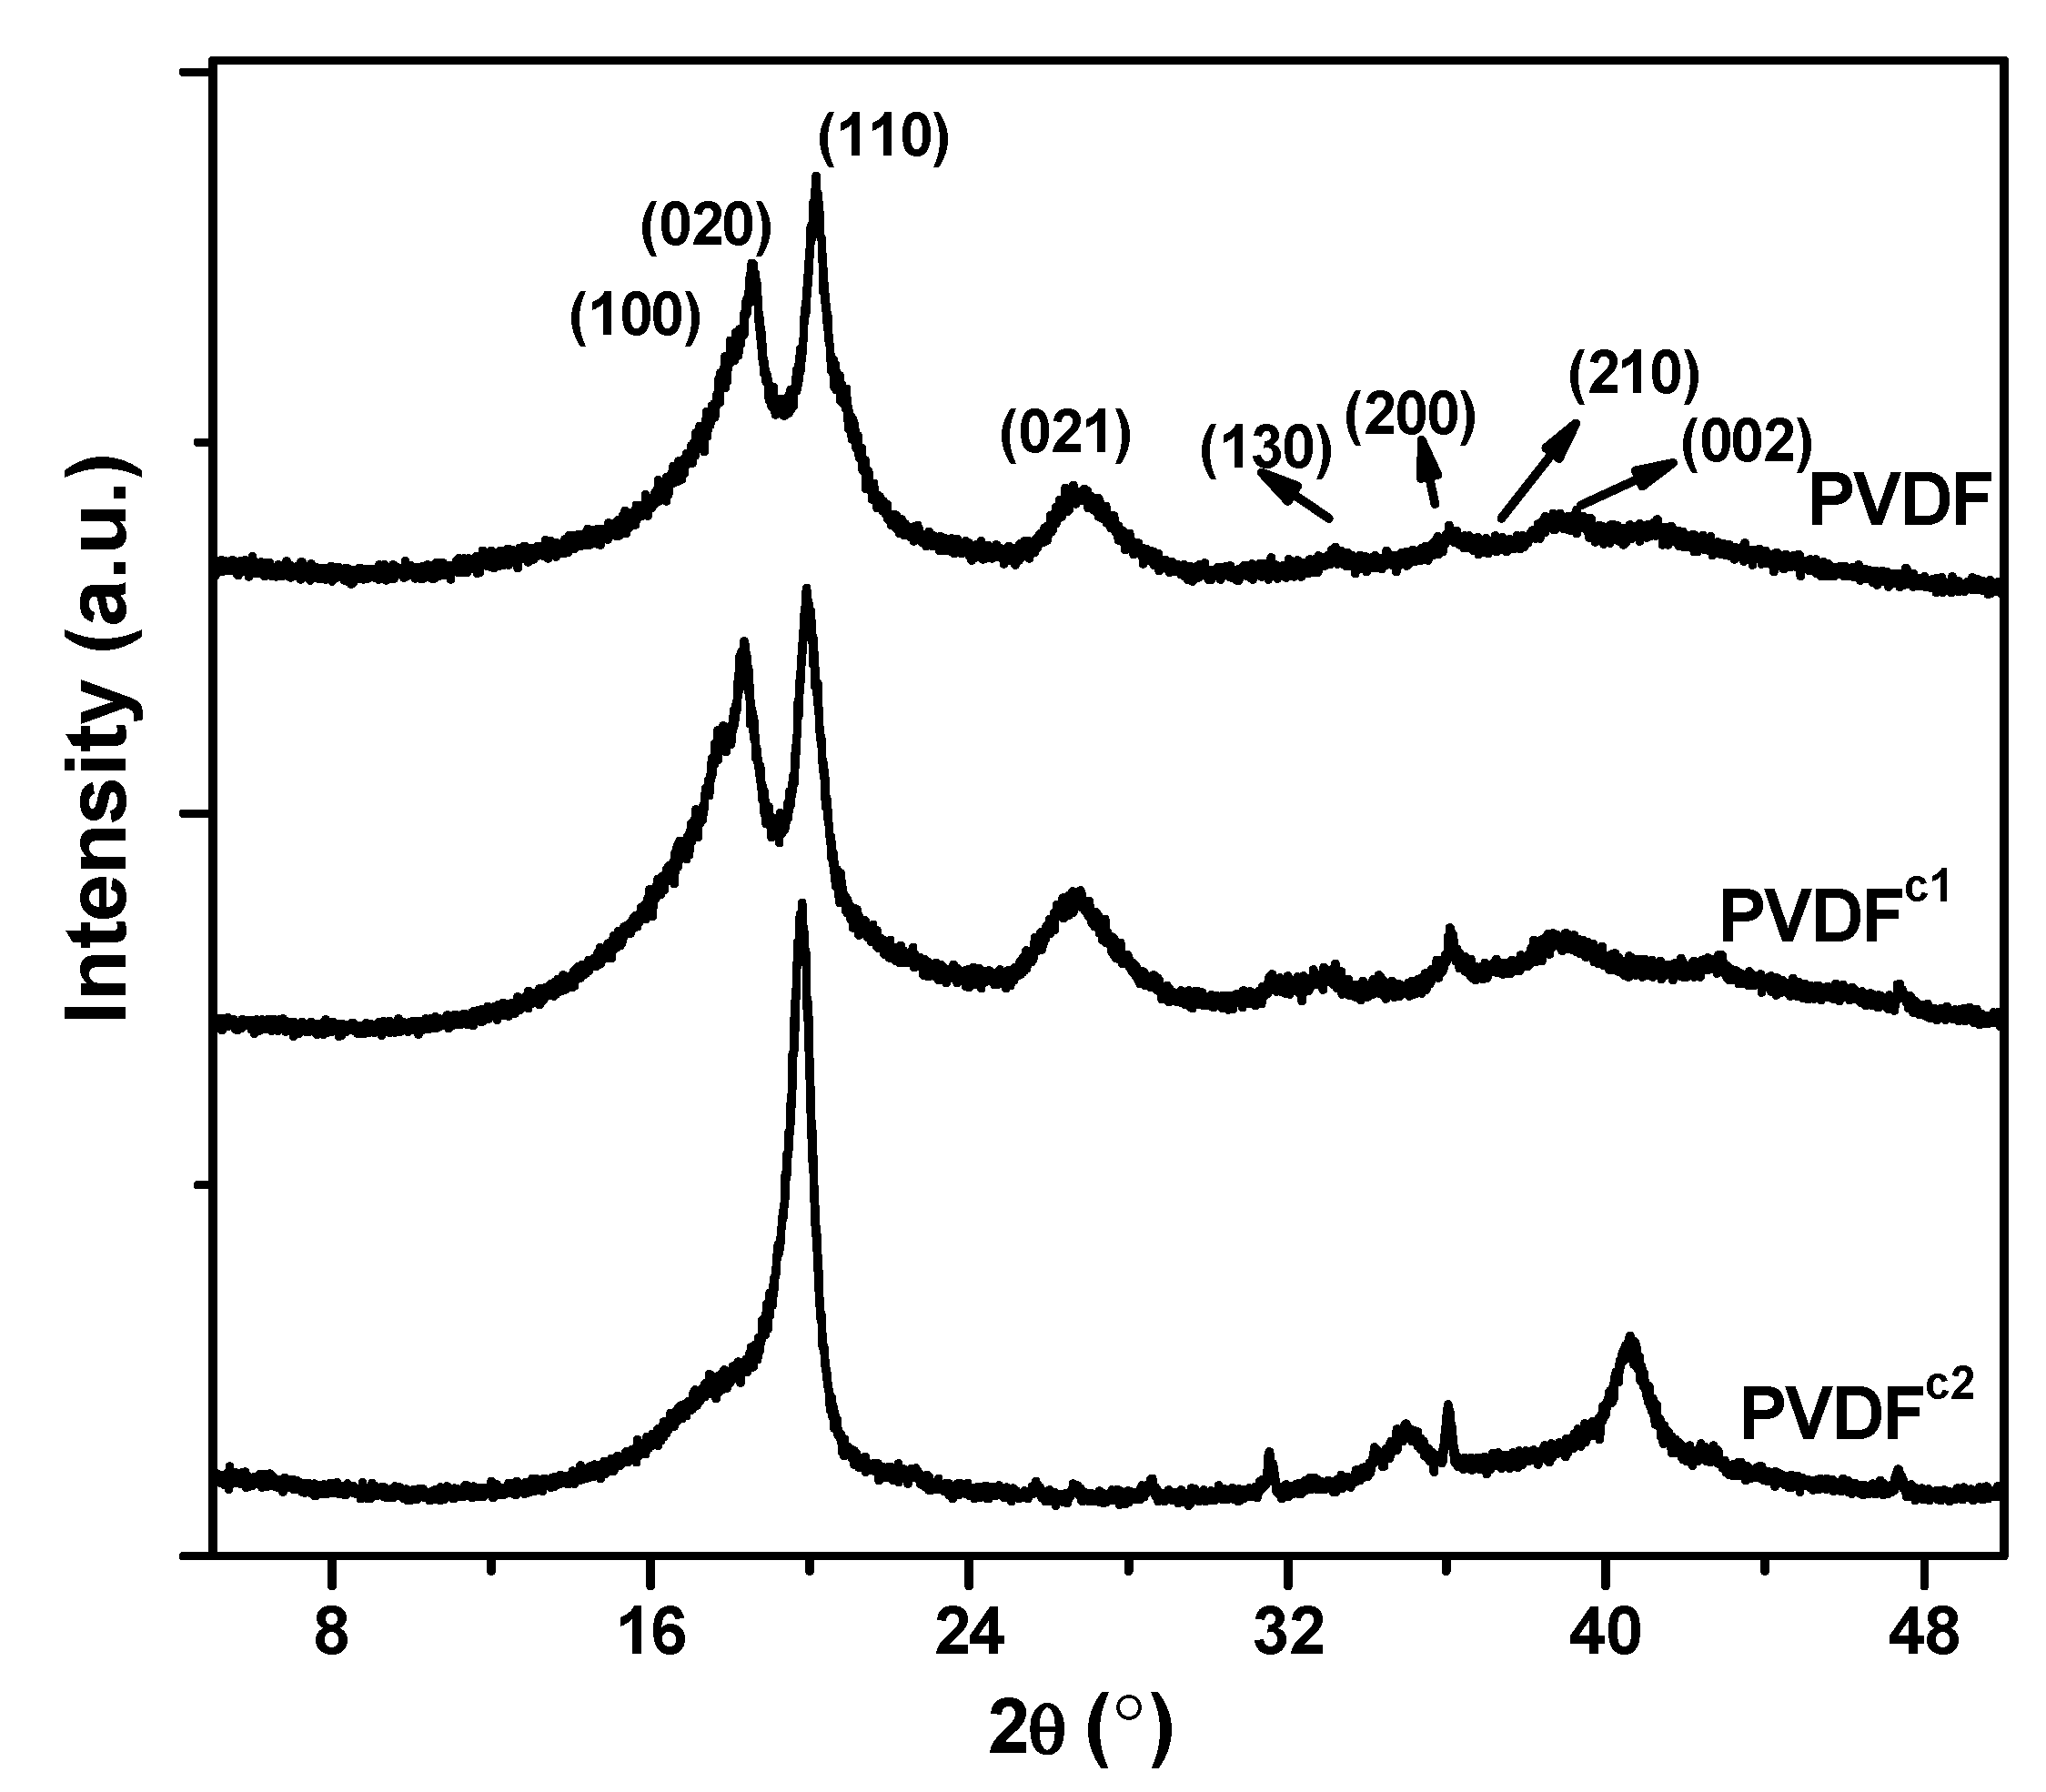
2.1. The Effect of Chain Structures on the Crystallization Behavior of PVDF Copolymers

| Sample | Tcon (°C) | Tcp (°C) | Tcf (°C) | ΔTc (°C) | Tmp (°C) * | ΔHm (J·g−1) | Xc (%) |
|---|---|---|---|---|---|---|---|
| PVDF | 141.3 | 138.1 | 135.8 | 3.2 | 174.2 | 49.8 | 47.7 |
| PVDFc1 | 133.9 | 129.2 | 126.0 | 4.7 | 162.8 | 29.2 | 27.9 |
| PVDFc2 | 117.5 | 116.2 | 113.8 | 1.3 | 141.0 | 37.8 | 37.2 |

| Materials | Solubility parameter δ (MPa1/2) [11] |
|---|---|
| PVDF | 19.2 |
| PVDFc1 | 13.5 * |
| PVDFc2 | 15.1 * |
| MS | 21.7 |
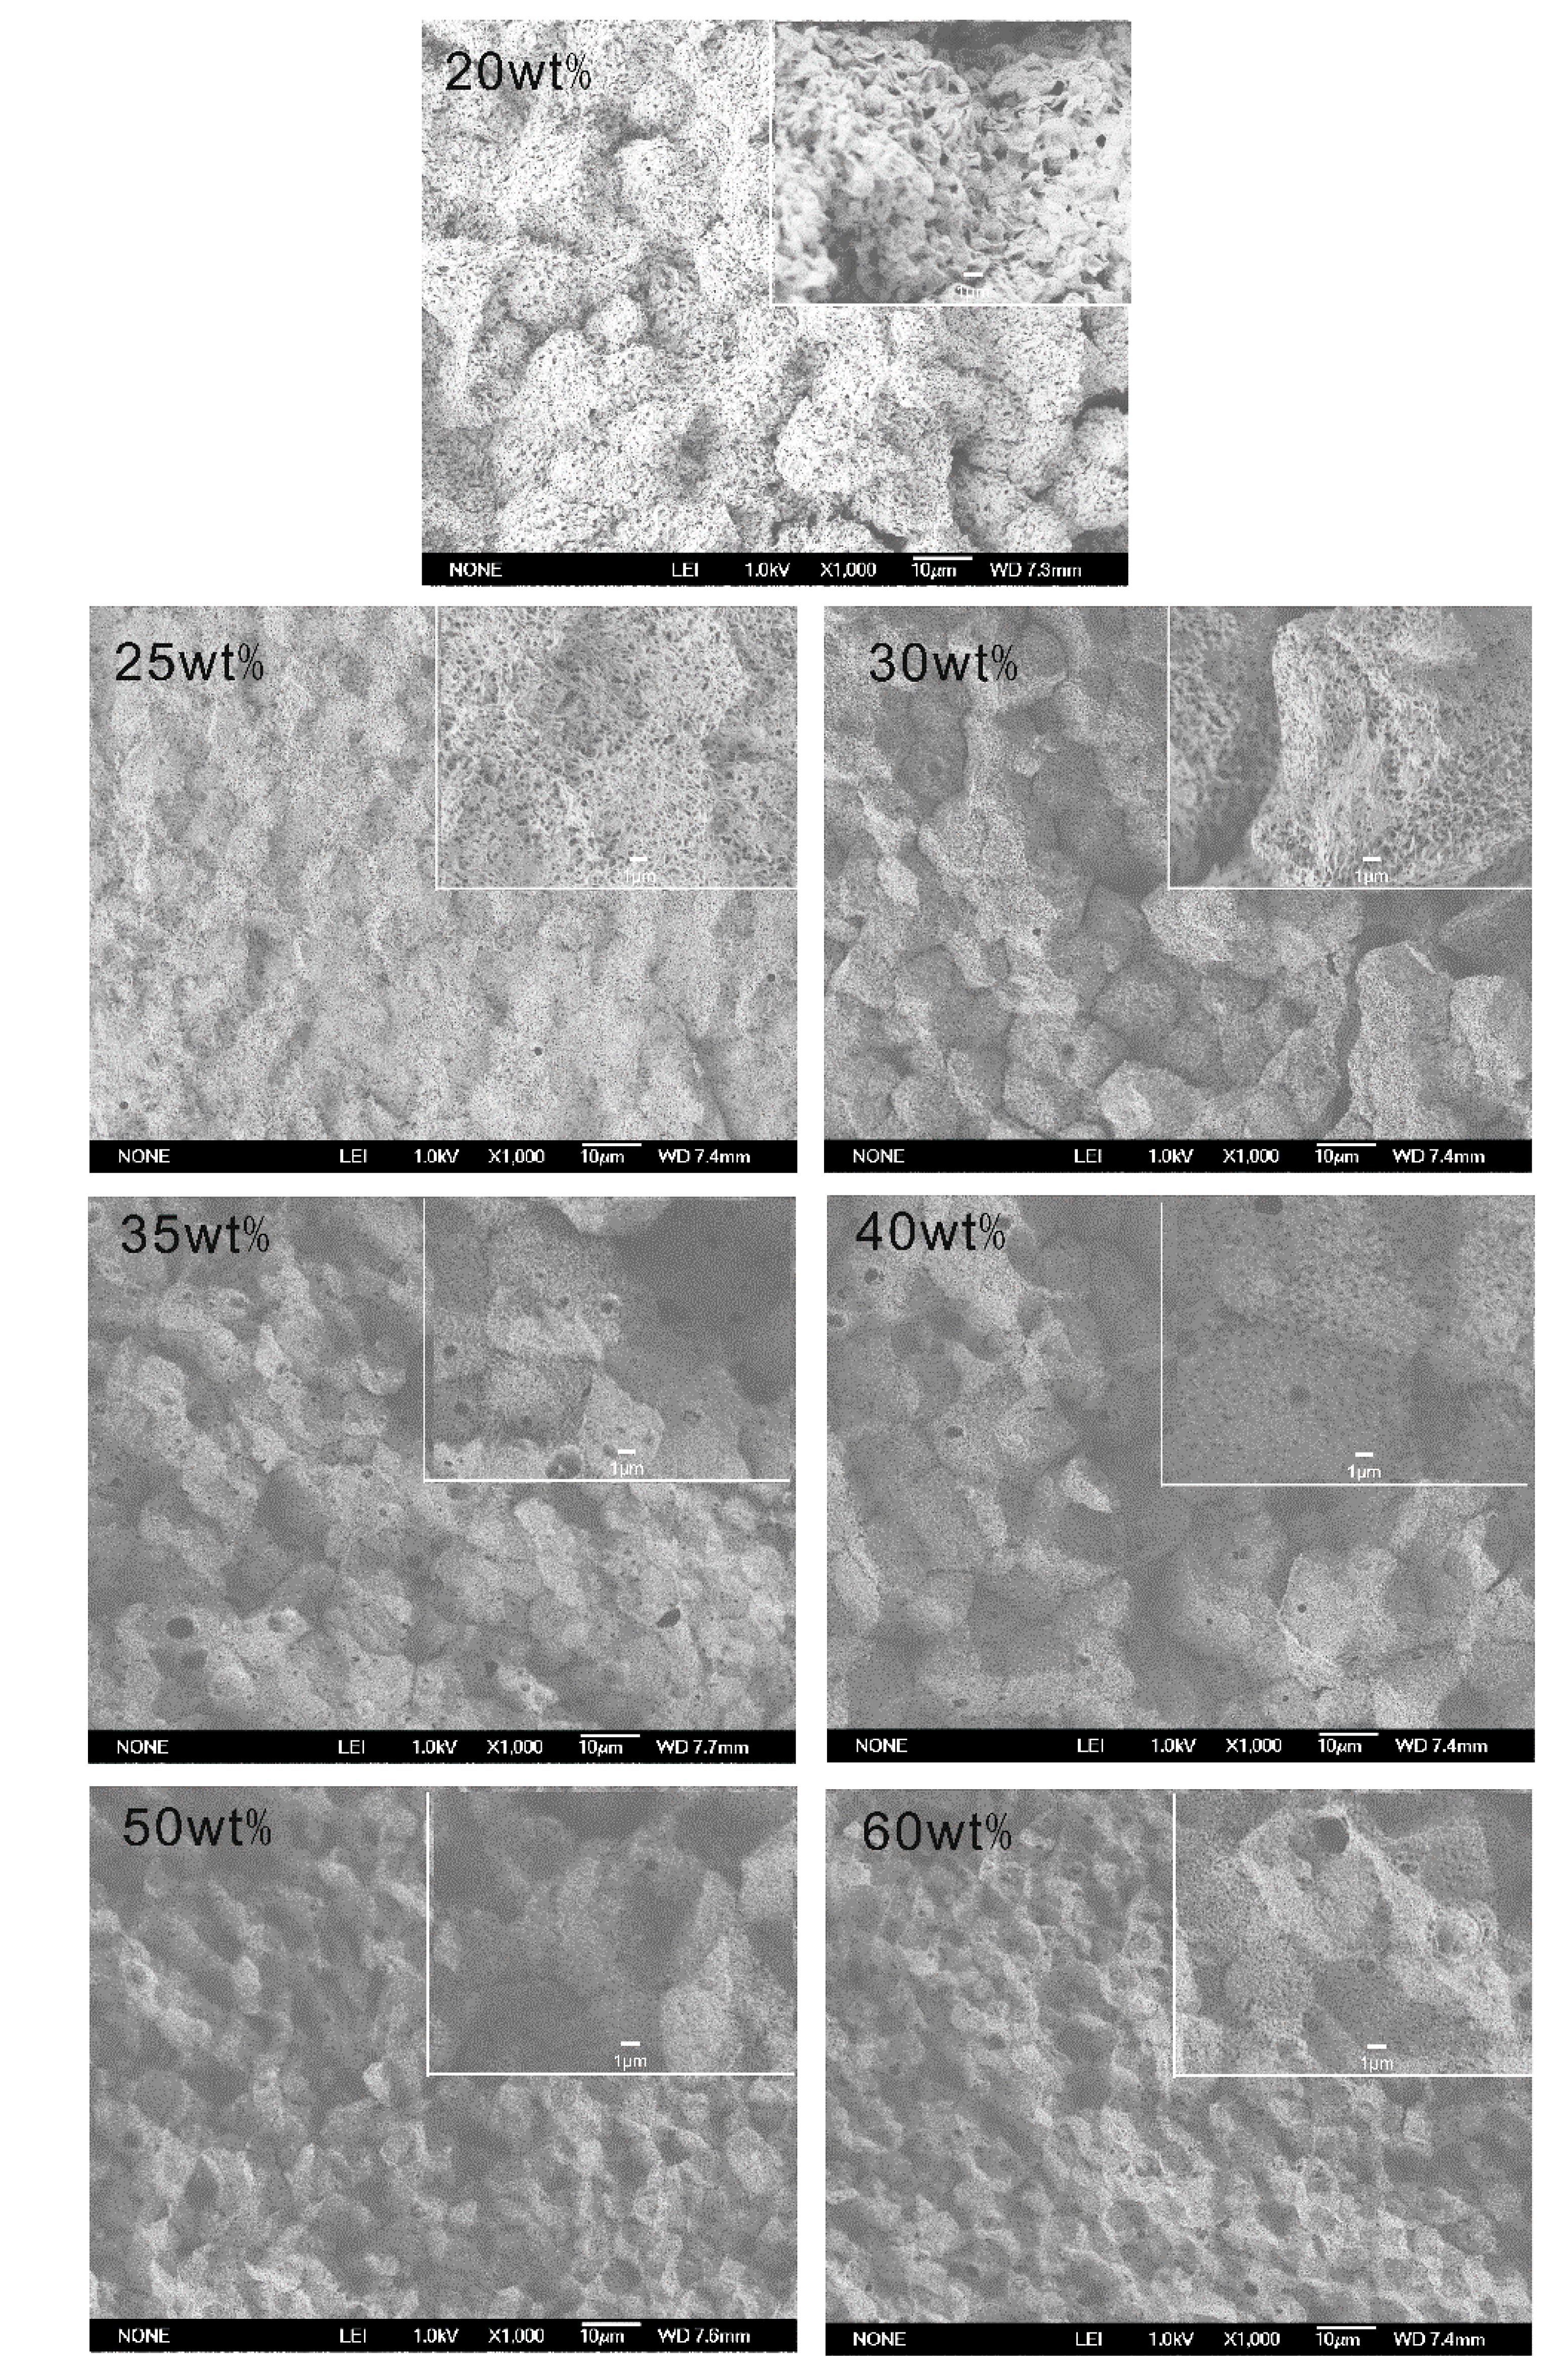
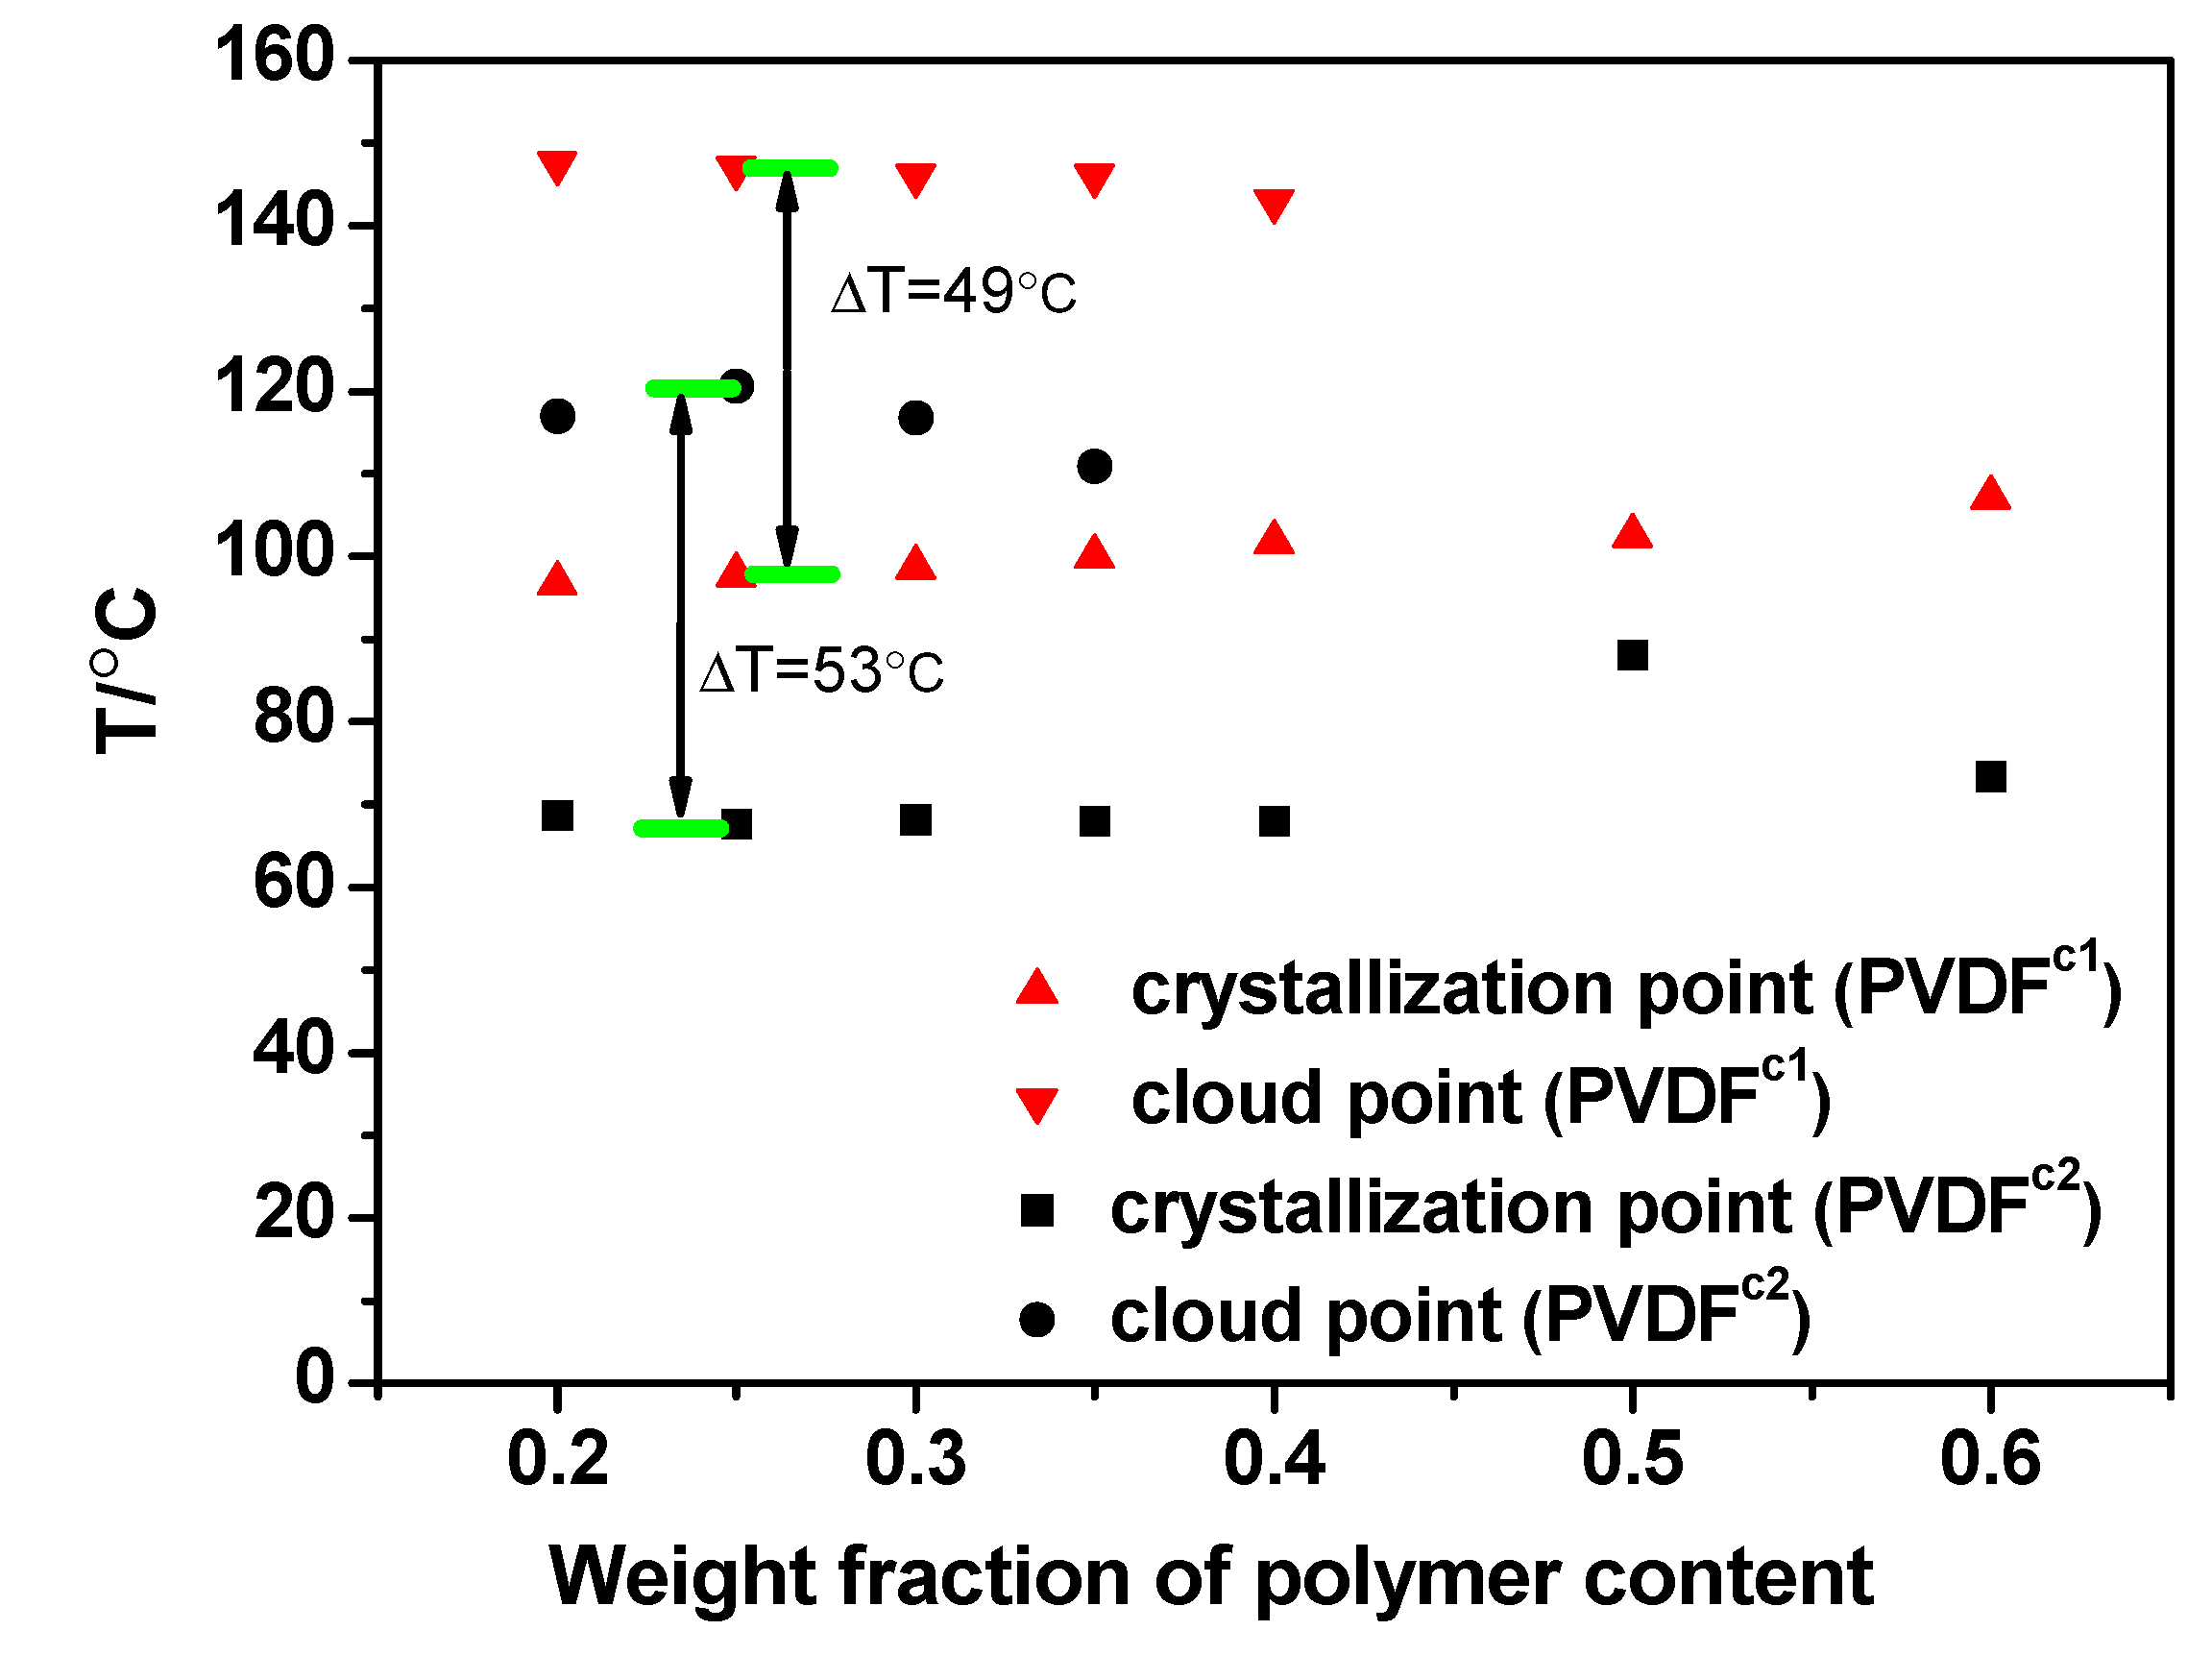
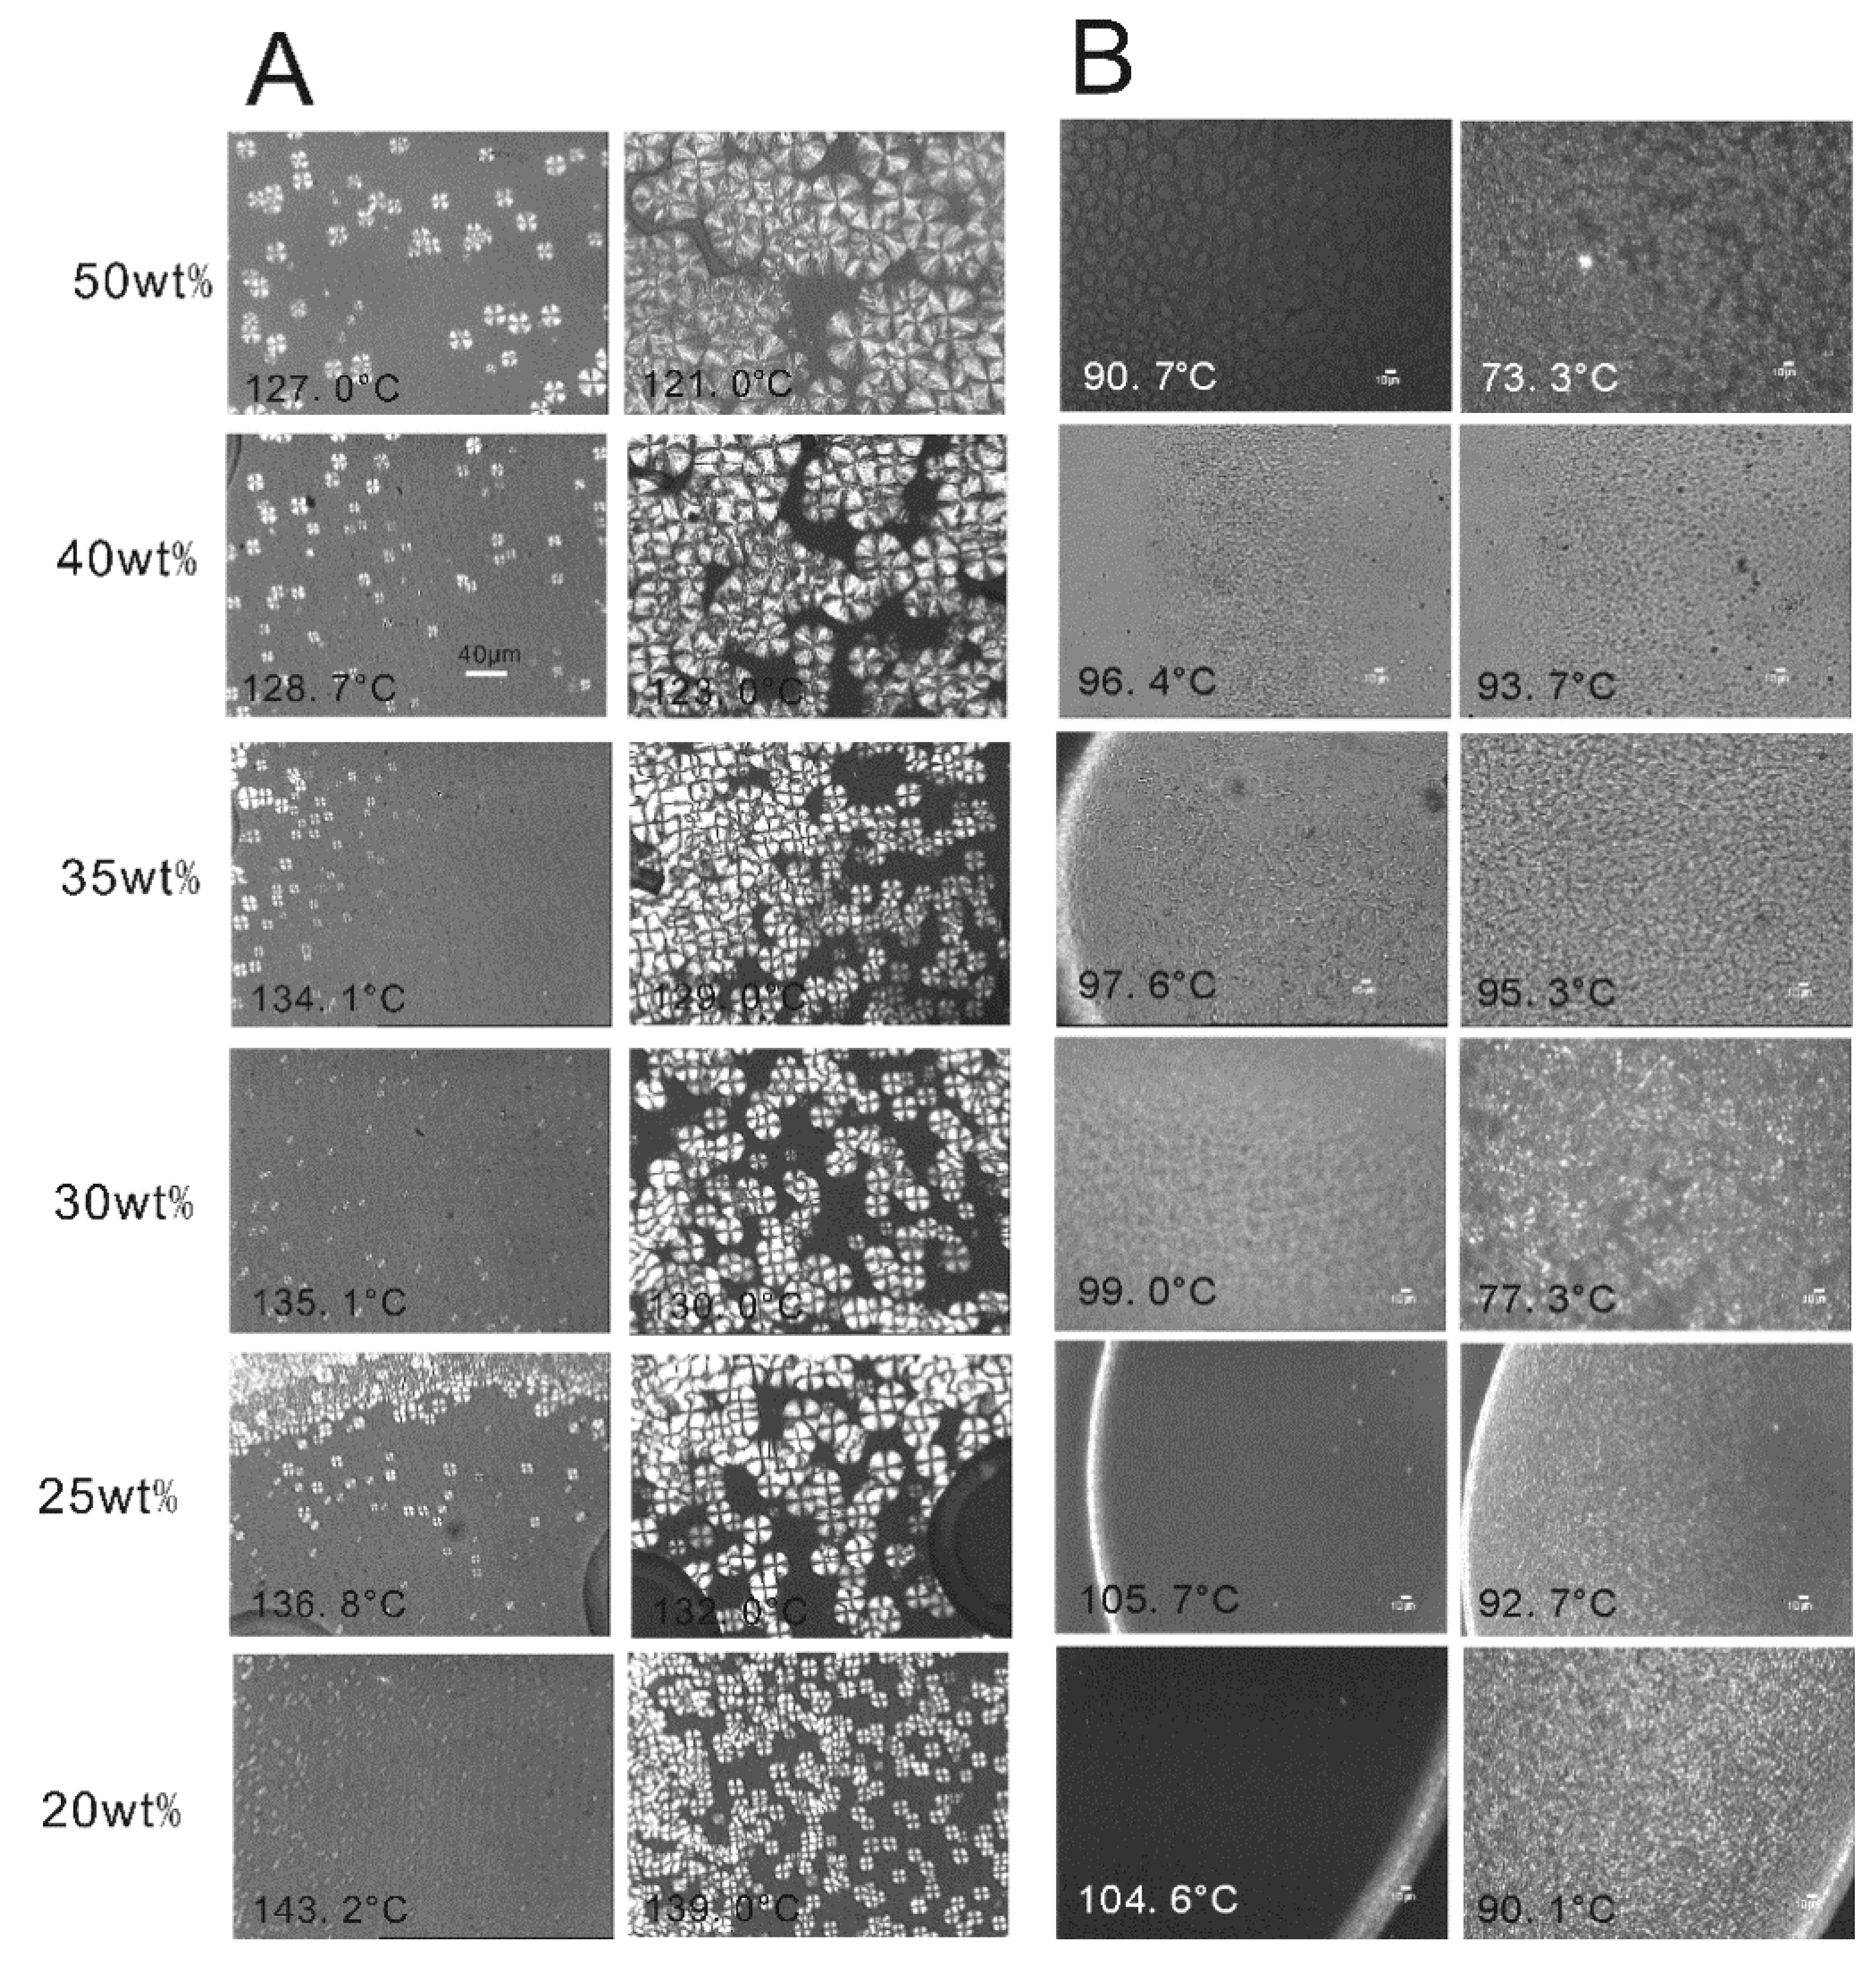
2.2. The Effect of Chain Structures on the Membrane Formation of PVDF Copolymers

3. Experimental Section
3.1. Materials
3.2. Sample Preparations
3.3. Characterization Techniques
4. Conclusions
- (1)
- The main molecular chain structure was changed by the HFP and TFE unit. The crystallization rate was improved by the copolymer with symmetrical units in PVDF chains, but hindered by asymmetrical units, compared with the neat PVDF. The symmetrical units in PVDF chains favored the β-crystals with fiber-like structures.
- (2)
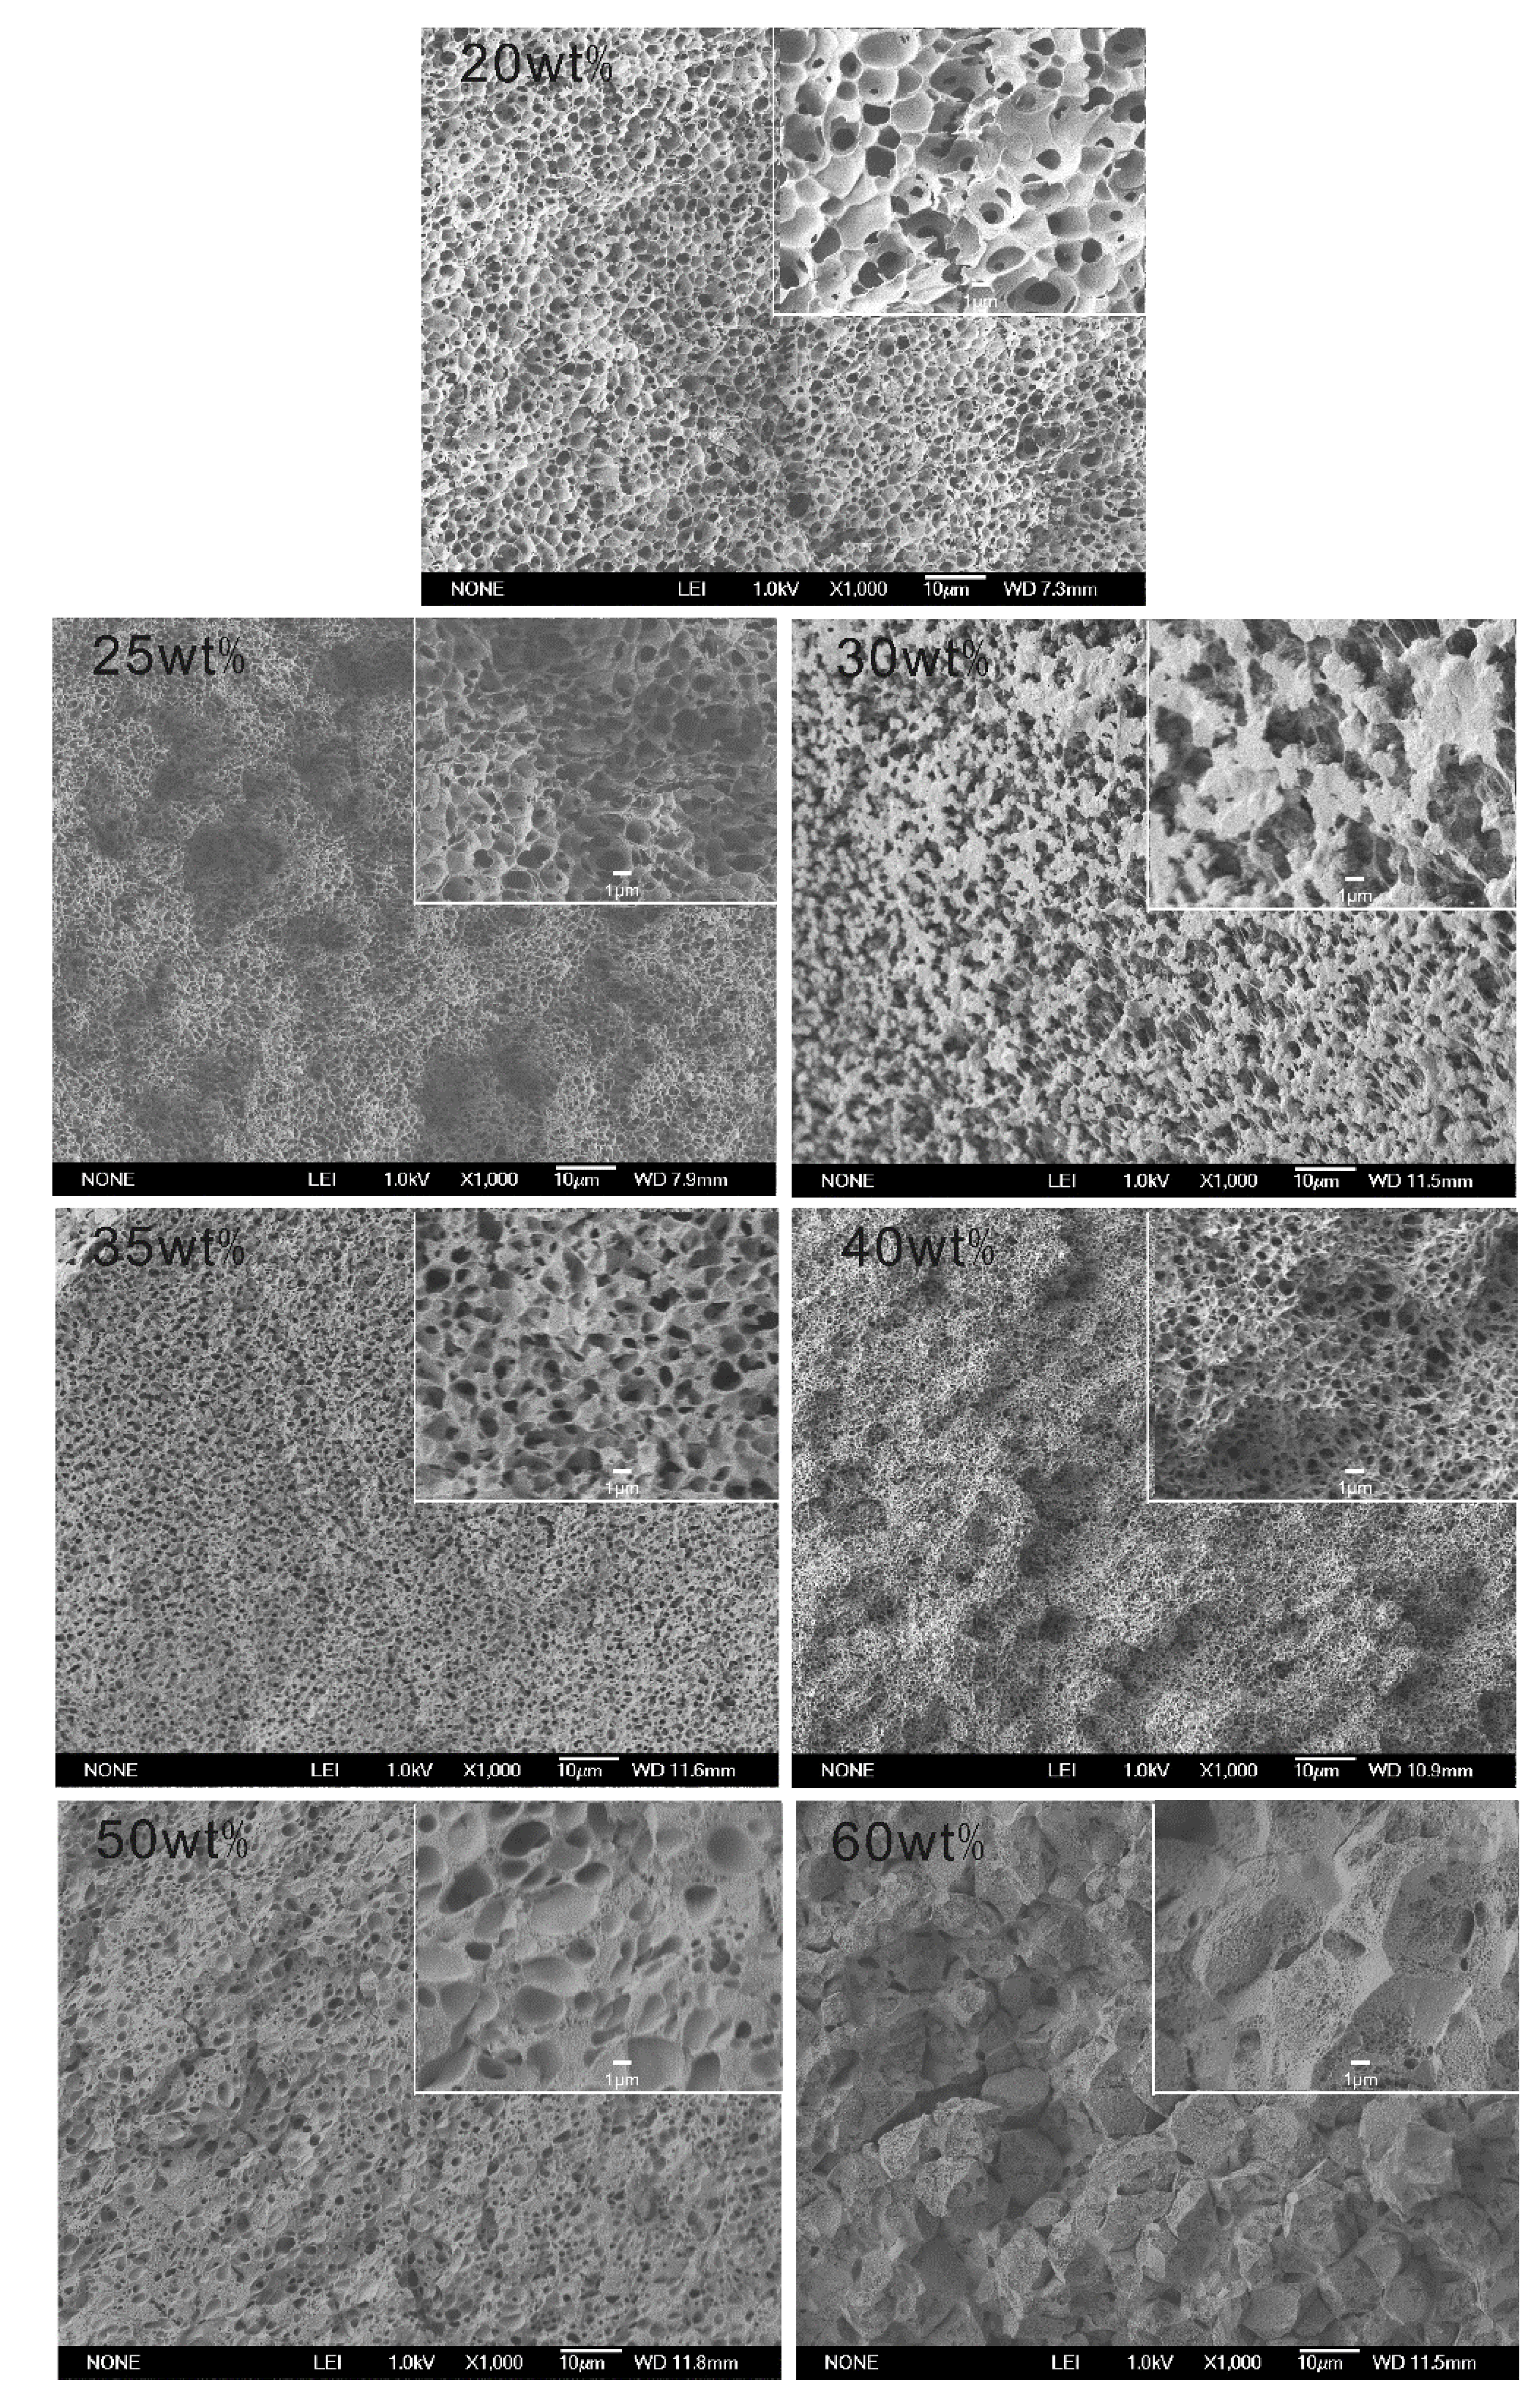
- The interaction between PVDF copolymer and MS was weaker than between homo-PVDF and MS, so that a wide L-L phase separation was observed. The phase diagram of co-PVDF/MS revealed that the monotectic point, φm, of PVDFc1 and PVDFc2 is around 50 wt% and 40 wt%, respectively. For the PVDFc1 membrane, mainly due to the presence of α-spherulites, the cross-section of the membrane was full of spherulites with small pores in it; while no significant spherulitic structures appeared in the PVDFc2 membrane, which is conducive to the form of the bicontinuous pore membrane.
- (3)
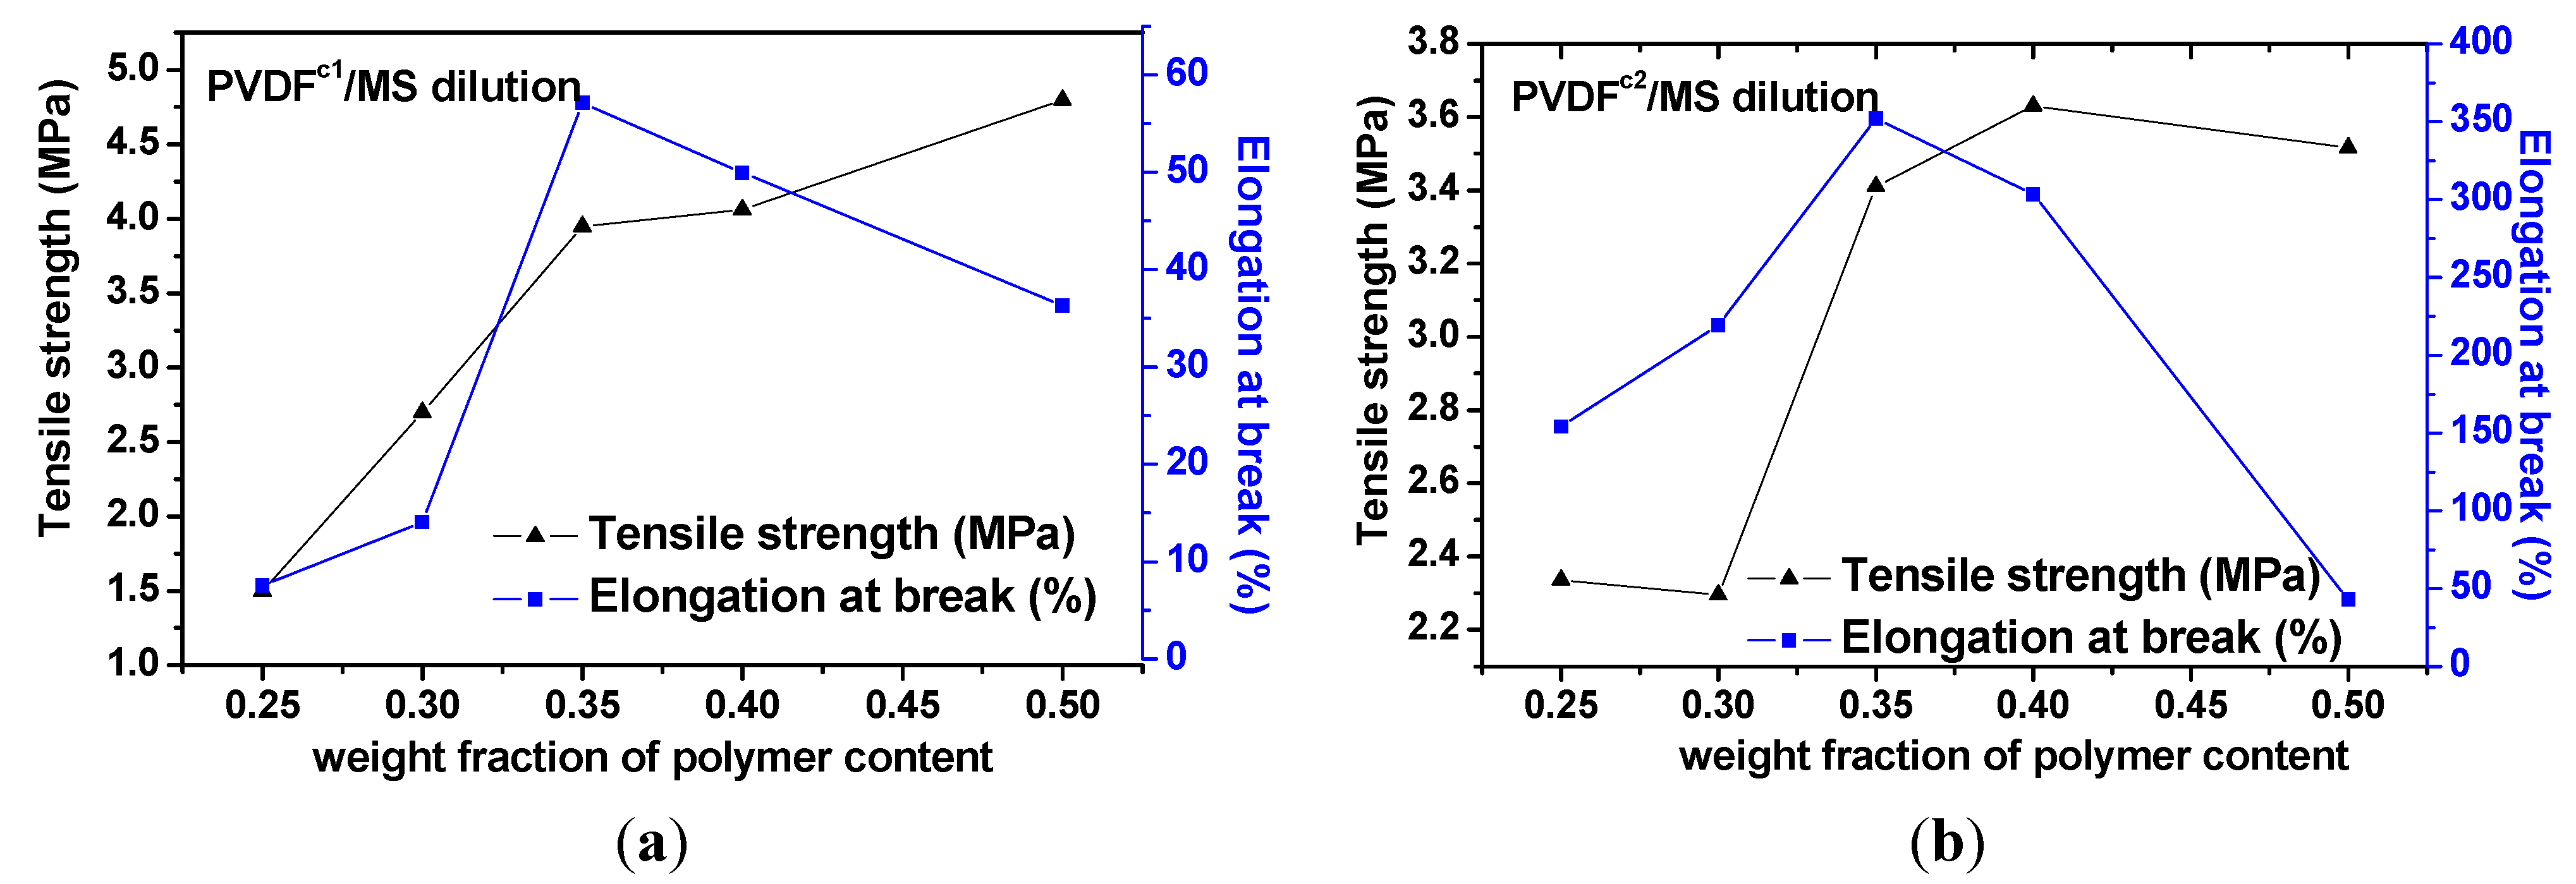
- The tensile strength for PVDFc1 and PVDFc2 membranes was increased with the polymer concentration increasing. The TFE unit in chains favored the β-PVDF crystals, which enhanced the performances of elongation at break of PVDFc2, but for the PVDFc1 membrane, the HFP unit maintained α-PVDF crystals, with no improvement of the elongation at break, compared with the homo-PVDF membrane.
Acknowledgments
Author Contributions
Conflicts of Interest
References
- Seiler, D.A. PVDF in the chemical process industry. In Modern Fluoropolymers; Scheirs, J., Ed.; Wiley: Chichester, UK, 1997; pp. 487–505. [Google Scholar]
- Van de Witte, P.; Dijkstra, P.J.; van den Berg, J.W.A.; Feijen, J. Phase separation processes in polymer solutions in relation to membrane formation. J. Membr. Sci. 1996, 117, 1–31. [Google Scholar] [CrossRef]
- Magalhães, R.; Durães, N.; Silva, M.; Silva, J.; Sencadas, V.; Botelho, G.; Gómez Ribelles, J.L.; Lanceros-Méndez, S. The role of solvent evaporation in the microstructure of electroactive β-poly(vinylidene fluoride) membranes obtained by isothermal crystallization. Soft Mater. 2010, 9, 1–14. [Google Scholar] [CrossRef]
- California, A.; Cardoso, V.F.; Costa, C.M.; Sencadas, V.; Botelho, G.; Gómez-Ribelles, J.L.; Lanceros-Mendez, S. Tailoring porous structure of ferroelectric poly(vinylidene fluoride-trifluoroethylene) by controlling solvent/polymer ratio and solvent evaporation rate. Eur. Polym. J. 2011, 47, 2442–2450. [Google Scholar] [CrossRef]
- Lovinger, A.J. Ferroelectric polymers. Science 1983, 220, 1115–1121. [Google Scholar]
- Lovinger, A.J.; Davis, D.D.; Cais, R.E.; Kometani, J.M. The role of molecular defects on the structure and phase transitions of poly(vinylidene fluoride). Polymer 1987, 28, 617–626. [Google Scholar] [CrossRef]
- Lloyd, D.R.; Kim, S.S.; Kinzer, K.E. Microporous membrane formation via thermally induced phase separation. II. Liquid liquid phase separation. J. Membr. Sci. 1991, 64, 1–11. [Google Scholar] [CrossRef]
- Lloyd, D.R.; Kinzer, K.E.; Tseng, H.S. Microporous membrane formation via thermally induced phase separation. I. Solid-liquid phase separation. J. Membr. Sci. 1990, 52, 239–261. [Google Scholar] [CrossRef]
- Ma, W.Z.; Chen, S.J.; Zhang, J.; Wang, X.L. Kinetics of thermally induced phase separation in the PVDF blend/methyl salicylate system and its effect on membrane structures. J. Macromol. Sci. B Polym. Phys. 2010, 50, 1–15. [Google Scholar]
- Ma, W.Z.; Chen, S.J.; Zhang, J.; Wang, X.L.; Miao, W.H. Morphology and crystallization behavior of poly(vinylidene fluoride)/poly(methyl methacrylate)/methyl salicylate, and benzophenone systems via thermally induced phase separation. J. Polym. Sci. B Polym. Phys. 2009, 47, 248–260. [Google Scholar] [CrossRef]
- Ma, W.Z.; Chen, S.J.; Zhang, J.; Wang, X.L.; Miao, W.H. Membrane formation of poly(vinylidene fluoride)/poly(methyl methacrylate)/diluents via thermally induced phase separation. J. Appl. Polym. Sci. 2009, 111, 1235–1245. [Google Scholar]
- Lin, Y.K.; Tang, Y.H.; Ma, H.Y.; Yang, J.; Tian, Y.; Ma, W.Z.; Wang, X.L. Formation of a bicontinuous structure membrane of polyvinylidene fluoride in diphenyl carbonate diluent via thermally induced phase separation. J. Appl. Polym. Sci. 2009, 114, 1523–1528. [Google Scholar] [CrossRef]
- Yang, J.; Li, D.W.; Lin, Y.K.; Wang, X.L.; Tian, F.; Wang, Z. Formation of a bicontinuous structure membrane of polyvinylidene fluoride in diphenyl ketone diluent via thermally induced phase separation. J. Appl. Polym. Sci. 2008, 110, 341–347. [Google Scholar]
- Ma, W.Z.; Wang, X.L.; Zhang, J. Effect of MMT, SiO2, CaCO3, and PTFE nanoparticles on the morphology and crystallization of poly(vinylidene fluorid). J. Polym. Sci. B Polym. Phys. 2010, 48, 2154–2164. [Google Scholar]
- Bosq, N.; Guigo, N.; Zhuravlev, E.; Sbirrazzuoli, N. Nonisothermal crystallization of polytetrafluoroethylene in a wide range of cooling rates. J. Phys. Chem. B 2013, 17, 3407–3415. [Google Scholar]
- Gregorio, R. Determination of the alpha, beta, and gamma crystalline phases of poly(vinylidene fluoride) films prepared at different conditions. J. Appl. Polym. Sci. 2006, 100, 3272–3279. [Google Scholar] [CrossRef]
- Kobayashi, M.; Tashiro, K.; Tadokoro, H. Molecular vibrations of three crystal forms of poly(vinylidene fluoride). Macromolecules 1975, 8, 158–171. [Google Scholar] [CrossRef]
- Davis, G.T.; McKinney, J.E.; Broadhurst, M.G.; Roth, S.C. Electric-field-induced phase changes in poly(vinylidene fluoride). J. Appl. Phys. 1978, 49, 4998–5002. [Google Scholar] [CrossRef]
- Ma, W.Z.; Zhang, J.; Wang, X.L. Formation of poly(vinylidene fluoride) crystalline phases from tetrahydrofuran/N,N-dimethylformamide mixed solvent. J. Mater. Sci. 2008, 43, 398–401. [Google Scholar] [CrossRef]
- Brandrup, J.; Immergut, E.H.; Grulke, E.A. Polymer Handbook; Wiley: New York, NY, USA, 1999. [Google Scholar]
- Kim, S.S.; Lloyd, D.R. Thermodynamics of polymer/diluent systems for thermally induced phase separation: 3. Liquid-liquid phase separation systems. Polymer 1992, 33, 1047–1057. [Google Scholar] [CrossRef]
- Ma, W.Z.; Zhang, J.; Wang, X.L. Effect of initial polymer concentration on the crystallization of poly (vinylidene fluoride)/poly (methyl methacrylate) blend from solution casting. J. Macromol. Sci. B Polym. Phys. 2007, 47, 139–149. [Google Scholar]
- Ma, W.Z.; Zhang, J.; van der Bruggen, B.; Wang, X.L. Formation of an interconnected lamellar structure in PVDF membranes with nanoparticles addition via solid-liquid thermally induced phase separation. J. Appl. Polym. Sci. 2013, 127, 2715–2723. [Google Scholar]
© 2014 by the authors; licensee MDPI, Basel, Switzerland. This article is an open access article distributed under the terms and conditions of the Creative Commons Attribution license (http://creativecommons.org/licenses/by/3.0/).
Share and Cite
Ma, W.; Yuan, H.; Wang, X. The Effect of Chain Structures on the Crystallization Behavior and Membrane Formation of Poly(Vinylidene Fluoride) Copolymers. Membranes 2014, 4, 243-256. https://doi.org/10.3390/membranes4020243
Ma W, Yuan H, Wang X. The Effect of Chain Structures on the Crystallization Behavior and Membrane Formation of Poly(Vinylidene Fluoride) Copolymers. Membranes. 2014; 4(2):243-256. https://doi.org/10.3390/membranes4020243
Chicago/Turabian StyleMa, Wenzhong, Haoge Yuan, and Xiaolin Wang. 2014. "The Effect of Chain Structures on the Crystallization Behavior and Membrane Formation of Poly(Vinylidene Fluoride) Copolymers" Membranes 4, no. 2: 243-256. https://doi.org/10.3390/membranes4020243
APA StyleMa, W., Yuan, H., & Wang, X. (2014). The Effect of Chain Structures on the Crystallization Behavior and Membrane Formation of Poly(Vinylidene Fluoride) Copolymers. Membranes, 4(2), 243-256. https://doi.org/10.3390/membranes4020243