1. Introduction
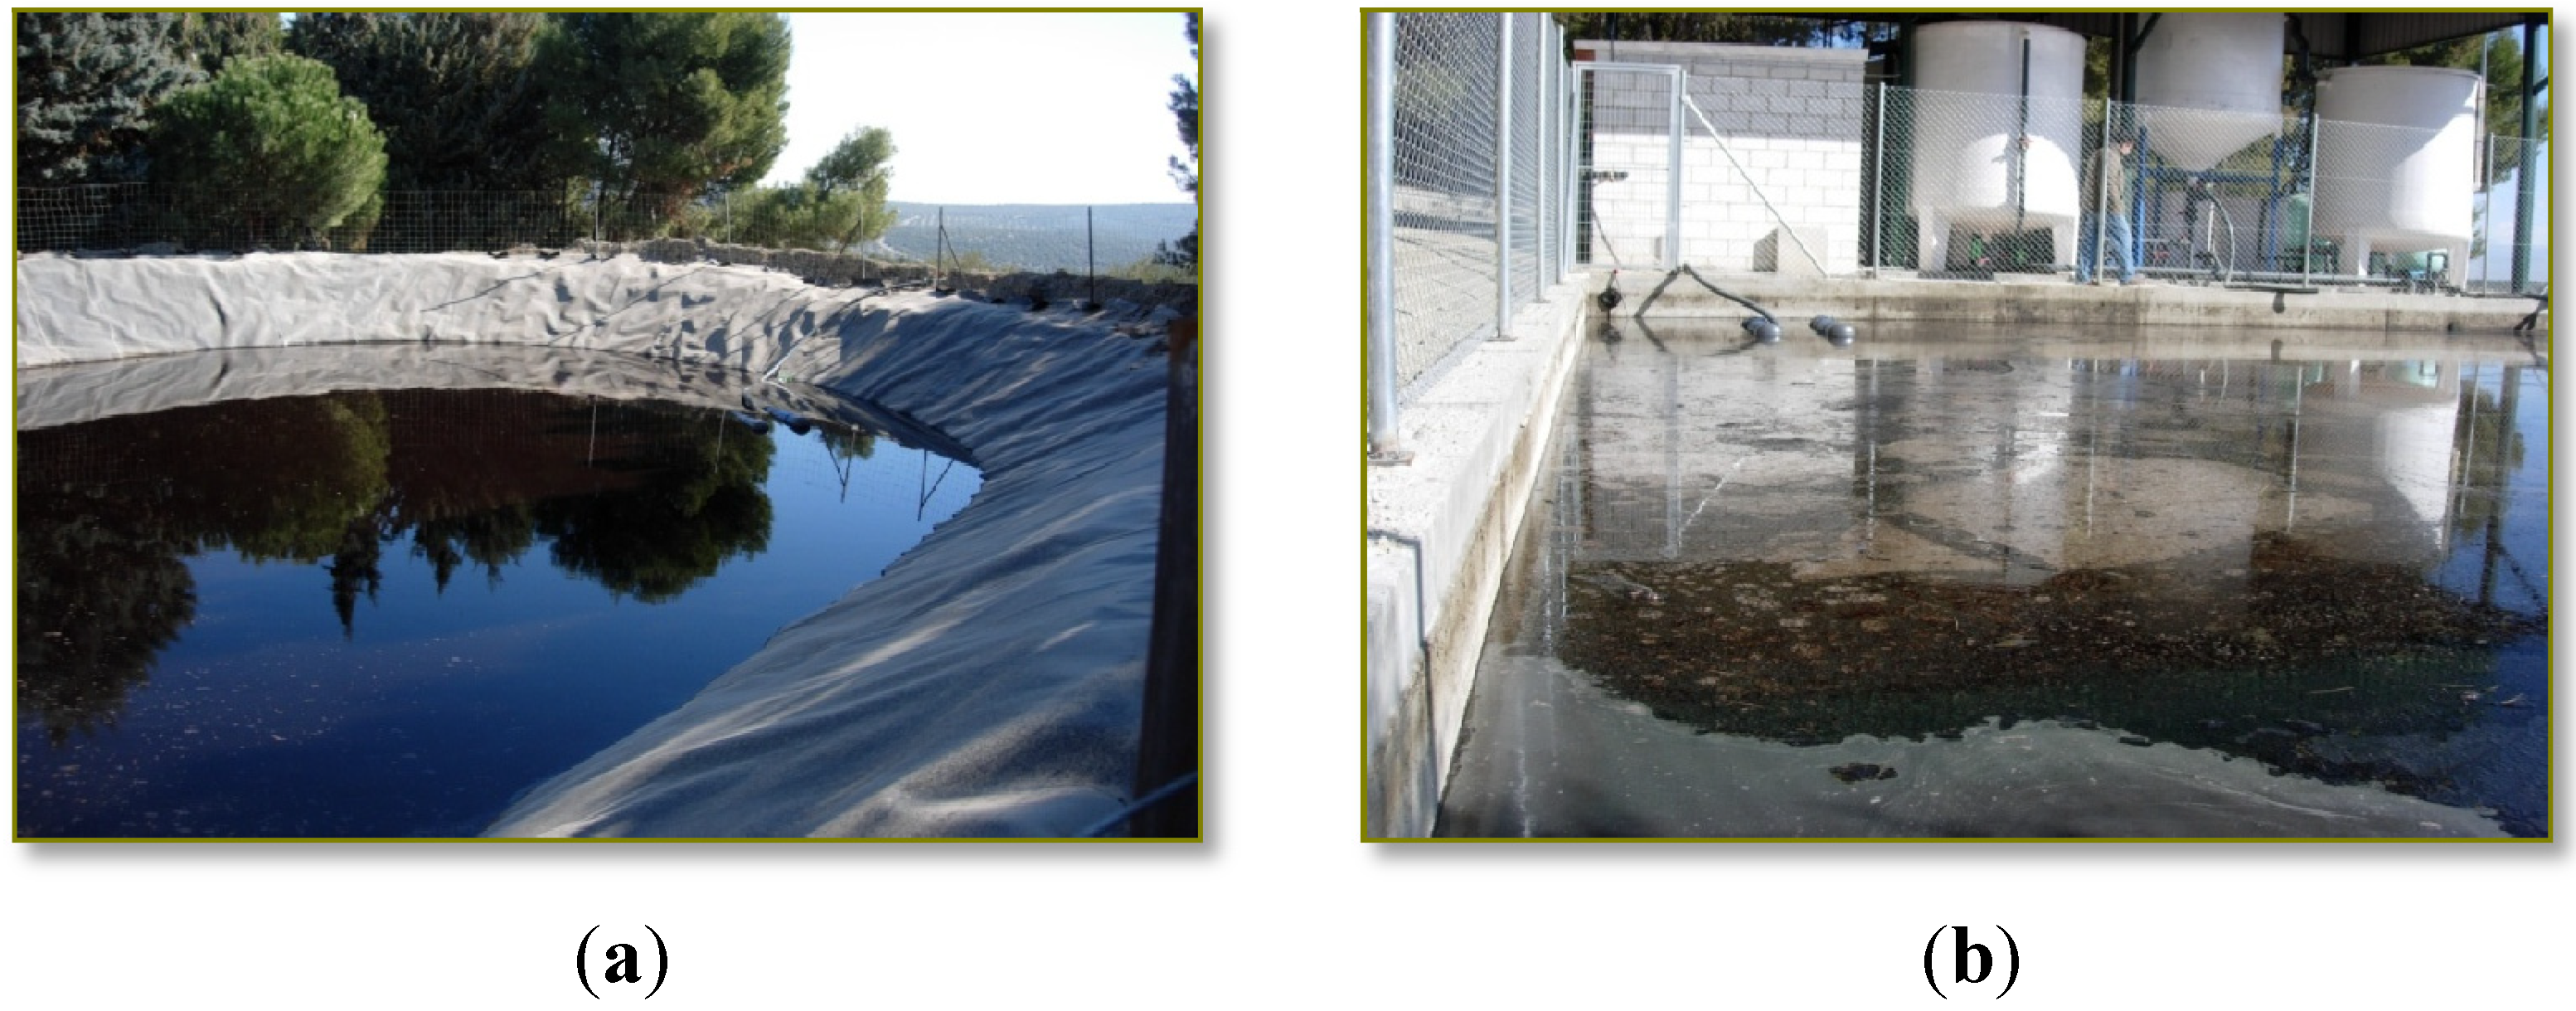
Two principal wastewater streams are nowadays by-produced in olive mills working with the two-phase system during the production process of olive oil: olives washing wastewater (OWW), which is produced during the olive-fruit washing procedure in the washing machines, and olive oil washing wastewater (OOW), which is derived in the olive oil extraction process during the washing of the olive oil in the vertical centrifuges (
Figure 1). The treatment of the liquid effluents generated during olive oil production in olive mills, together called olive mill wastewater (OMW-2), is currently still a hard task, due to multiple factors [
1,
2].
Figure 1.
Olives washing wastewater (OWW) (a) and olive oil washing wastewater (OOW) (b) storage and evaporation lagoons.
Figure 1.
Olives washing wastewater (OWW) (a) and olive oil washing wastewater (OOW) (b) storage and evaporation lagoons.
At the present, an average-sized olive oil factory working in continuous mode leads to a daily amount of up to 10–15 m
3 of OOW, in sum to 1 m
3 day
−1 of OWW. In order to get an idea of the dimensions of this, in Spain alone, this generates a total volume of more than 9 million m
3 of OMW-2 per year. Furthermore, the pollutants load of these effluents is extremely variable, not only owing to the extraction process, but also to edaphoclimatic and cultivation parameters, the type of the olives, their quality and maturity, and other factors [
1,
3]. These factors, in addition to small size and widespread geographical dispersion of olive oil factories, establish important difficulties for the management of these hazard effluents.
These wastewaters are highly phytotoxic and hazardous for water bodies, soil and aquifers due to the presence of aromatic compounds and a wide range of other organic pollutants, such as phenols, tannins and long-chain fatty acids, which are not suitable to be biologically managed. Due to the resistance of OMW-2 to microbial degradation [
3], biological treatment of OMW-2 is not applied on an industrial scale as it is not efficient. Within this context, advanced operation processes (AOPs) are required for the depuration of these bio-refractory wastewaters [
4,
5,
6,
7,
8,
9,
10,
11,
12,
13,
14,
15,
16].
Moreover, these effluents also exhibit high saline toxicity, and thus very significant electroconductivity (EC) values owing to the presence of a high concentration of inorganic compounds among which chloride, sulfate and phosphoric salts of potassium, calcium, iron, magnesium, sodium, copper and traces of other elements are common characteristics [
1]. This fact also makes it necessary to resort to advanced separation technologies in order to attempt complete depuration of OMW-2, since it is not viable to abate the high concentration of dissolved monovalent and divalent ions by conventional physicochemical treatments. In this regard, as regulations become more stringent, membranes technology offers many advantages compared with other separation processes [
17,
18].
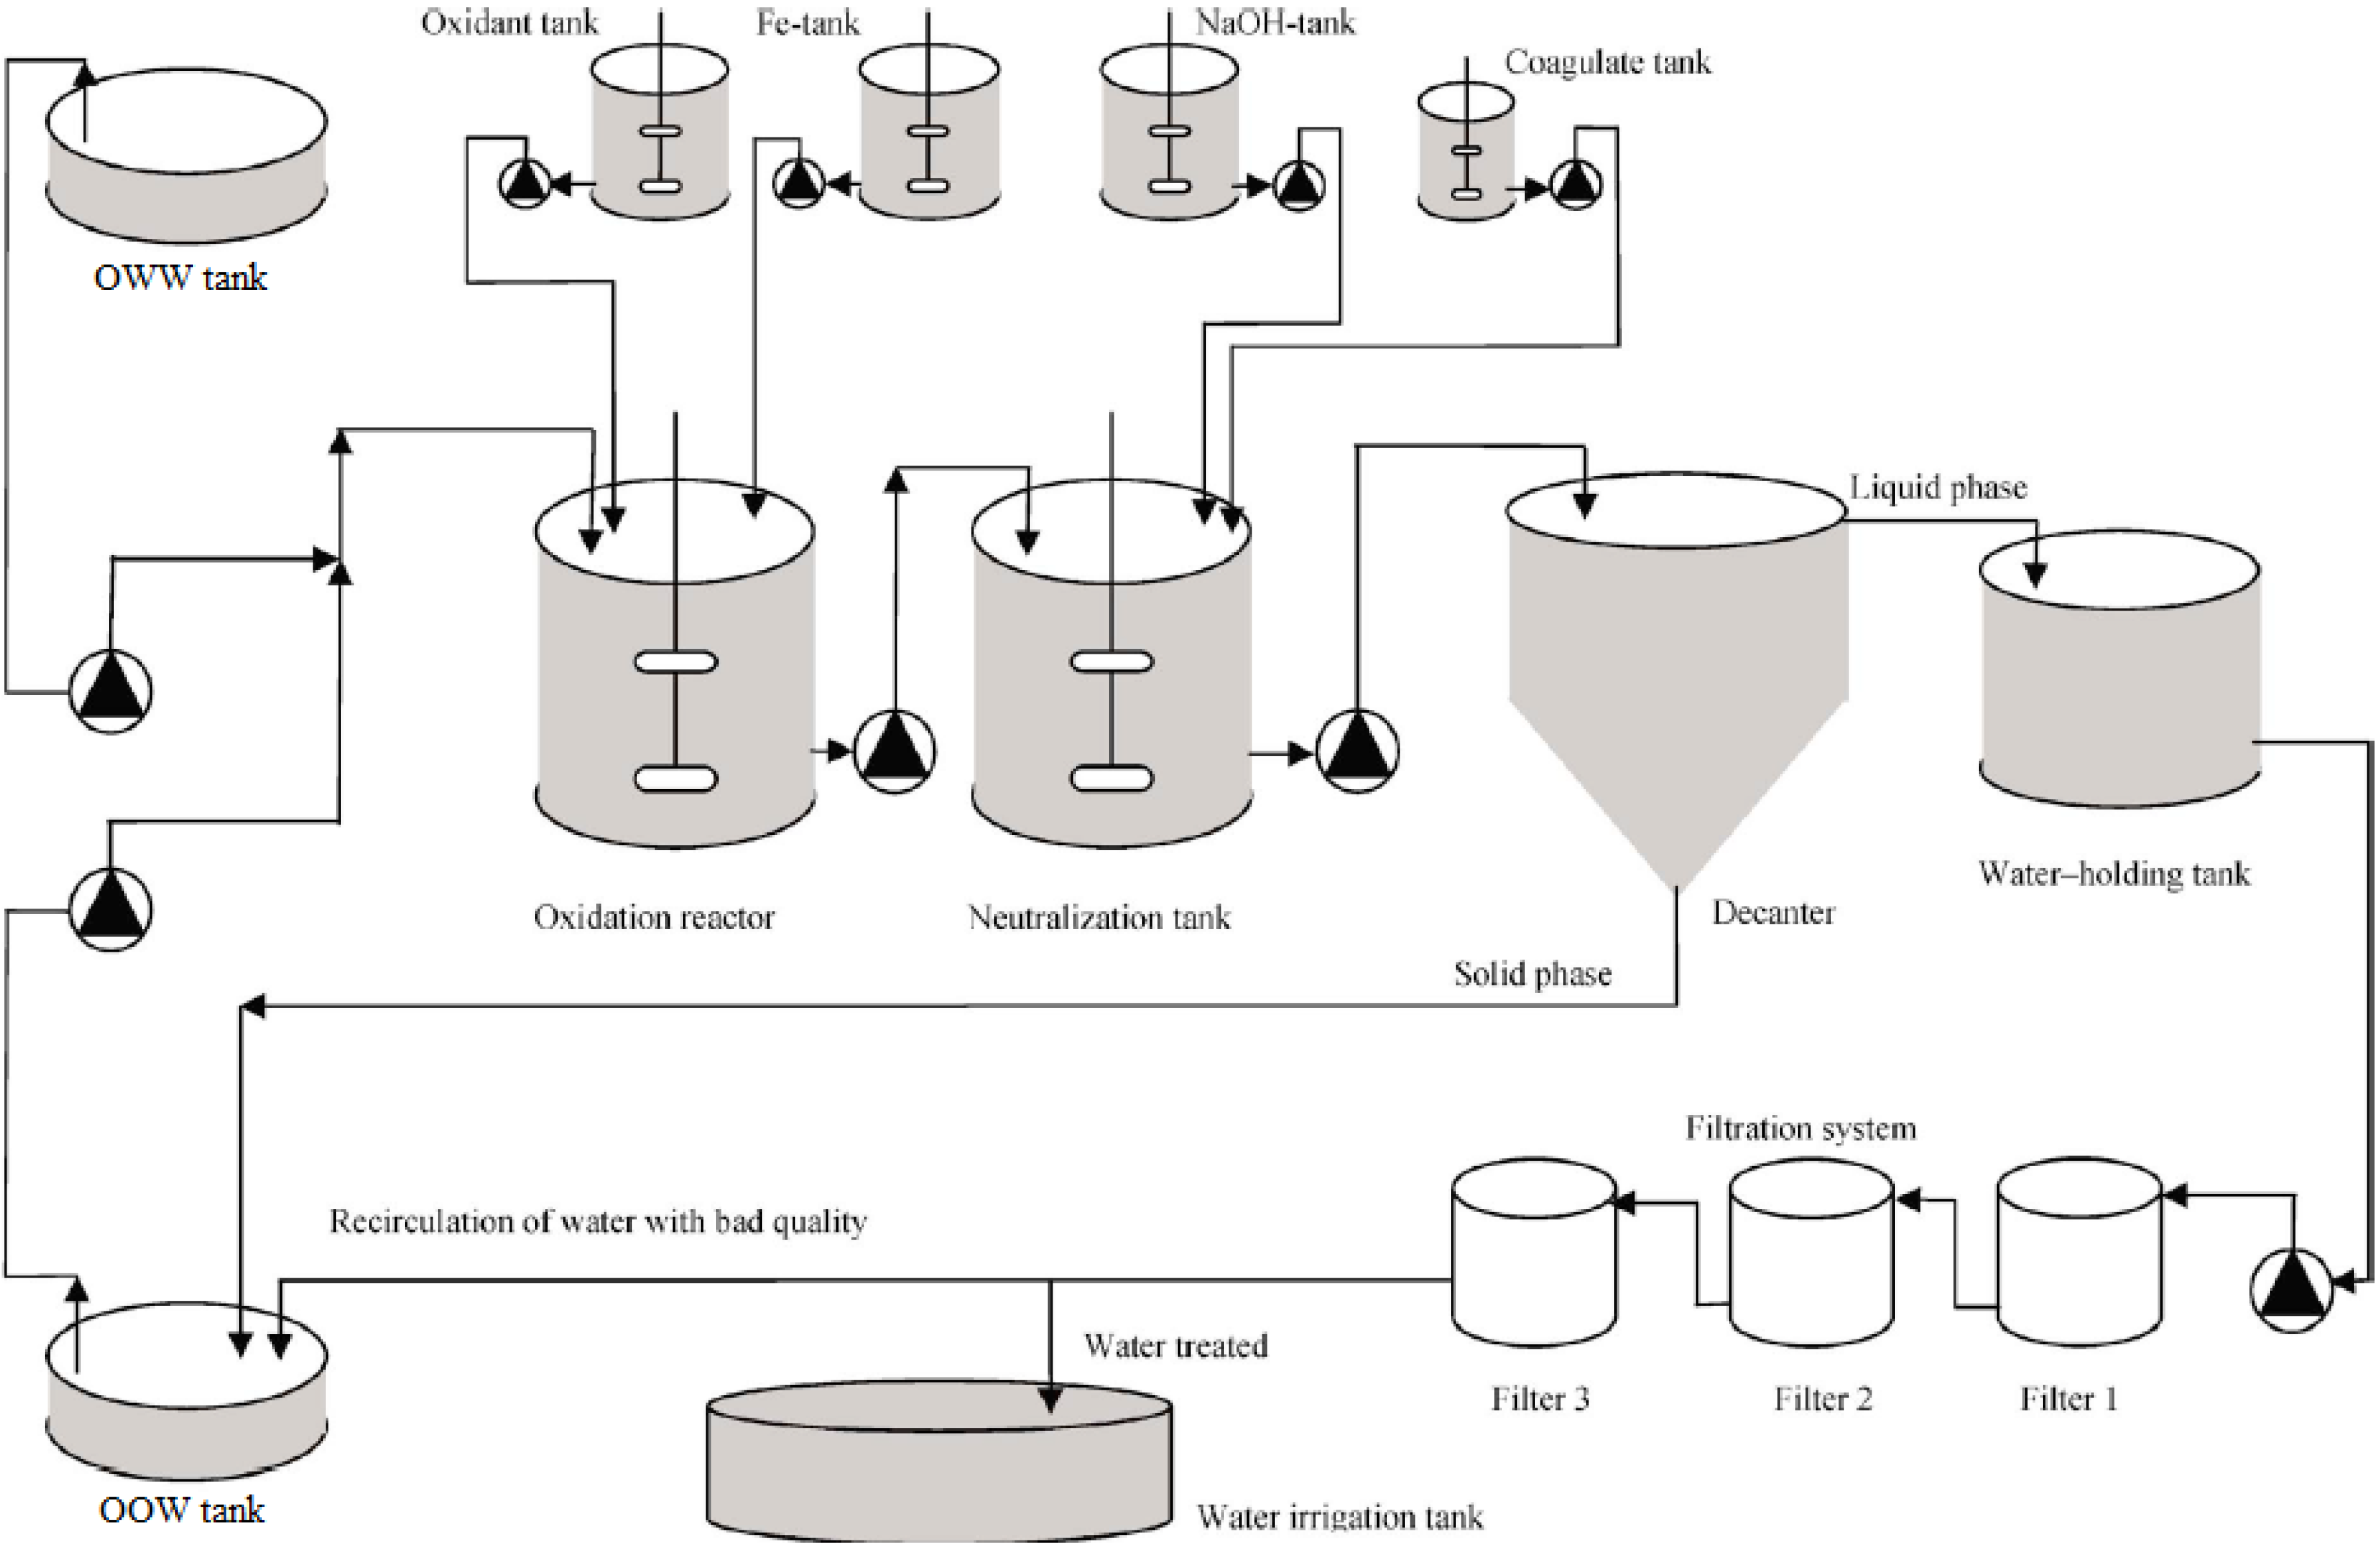
A secondary treatment for olive mill wastewater coming from factories working with the two-phase olive oil production process (OMW-2) has been recently set-up and transferred to an industrial scale in an olive oil mill in the premises of Baeza (Jaén, Spain) by the
Chemical and Biochemical Processes Technology Research Group of the University of Granada (Granada, Spain) (
Figure 2). The secondary treatment comprises Fenton-like oxidation, flocculation and filtration through olive stones. Fenton’s process appears to be the most economically advantageous AOP since it may be conducted at ambient temperature and pressure conditions, and also due its equipment simplicity and operational ease. Furthermore, the use of olive stones boosts the cost-effectiveness of the secondary treatment process as it is an abundant and renewable agricultural residue available at zero cost.
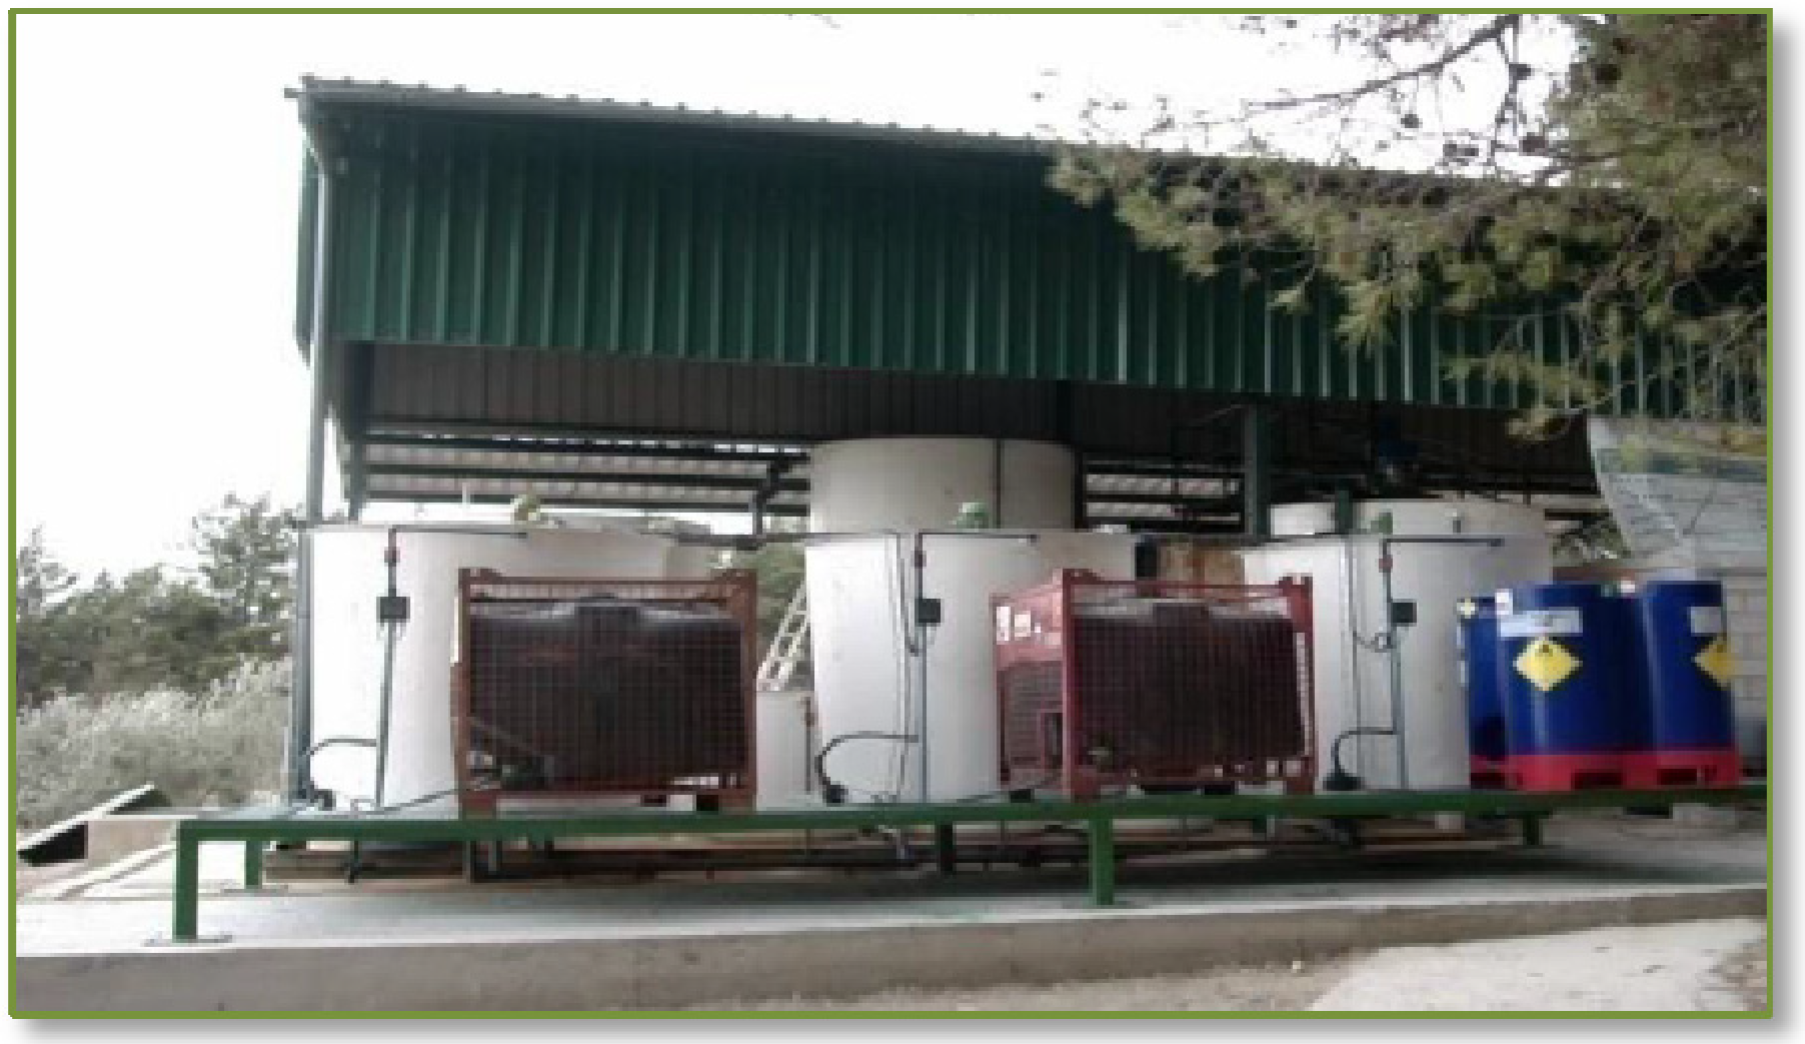
Figure 2.
The secondary treatment plant set-up in an olive oil mill located in Jaén (Spain).
Figure 2.
The secondary treatment plant set-up in an olive oil mill located in Jaén (Spain).
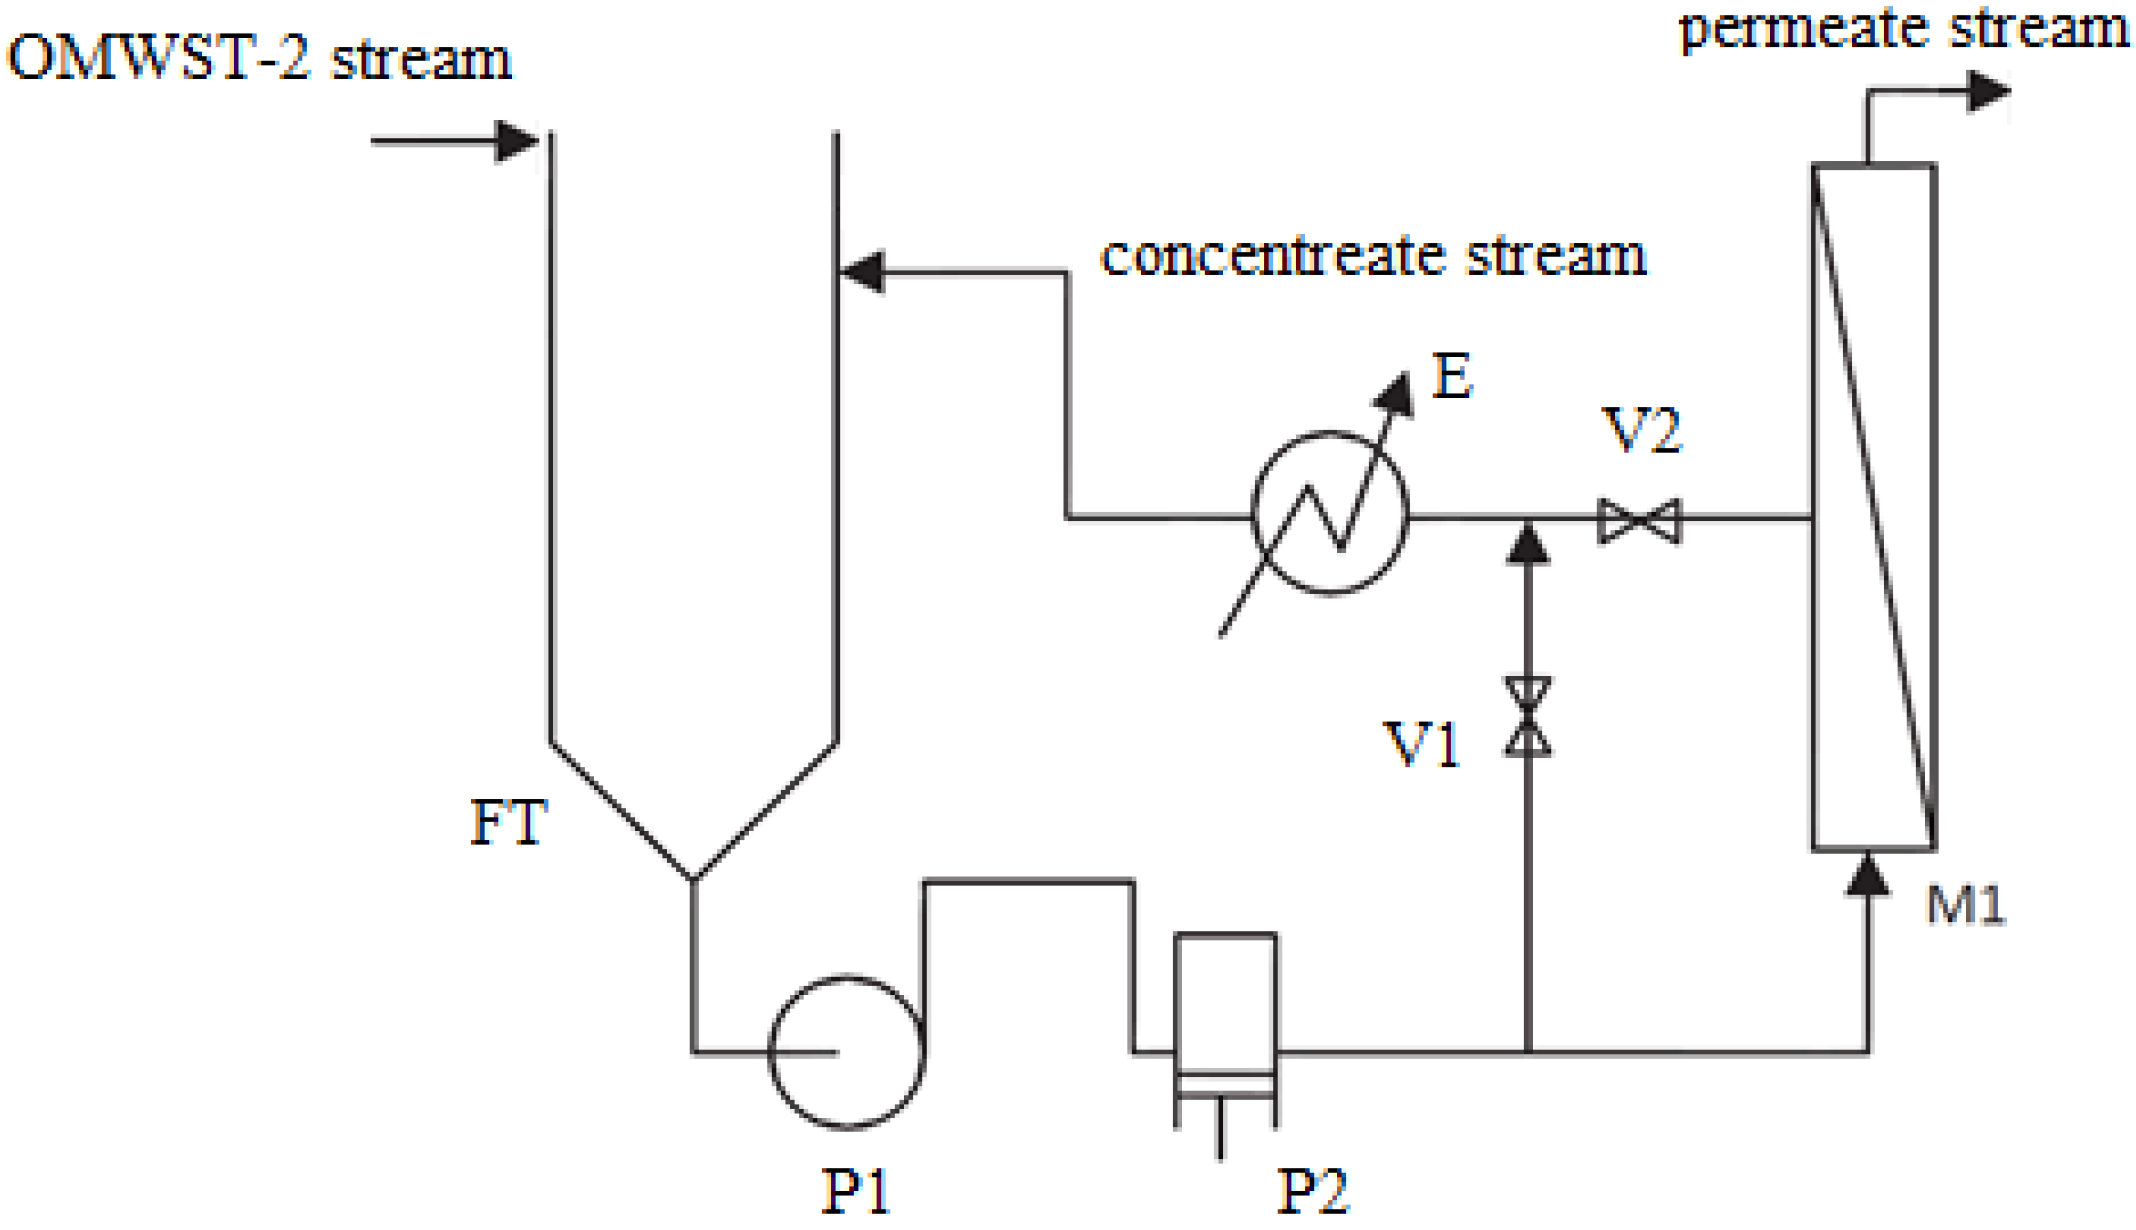
In this research work, ulterior purification of OMW-2 was intended with the goal of closing the loop of the industrial production process, pursuing the quality standards for reuse of the purified effluent in the proper olive washing machines. With this intention, modelization of the performance and preliminary cost analysis of a final reverse osmosis (RO) process was studied on a pilot scale.
3. Results and Discussion
The objective of this work was to close the loop of the industrial production process of an olive mill working with the two-phase extraction procedure in Baeza (Jaén, Spain). With this intention, optimization of a final RO operation to achieve the quality standards for reuse of the purified OMW-2 effluent in the proper olive washing machines was examined. Performance of the RO membrane module was modelized, including permeate flux and membrane rejection as function of the main operating variables, i.e., operating pressure and tangential velocity. Finally, membrane fouling and life-time service as well as simplified economical analysis of the RO process was studied.
Firstly, the effect of the net driving pressure of the system on the permeate flux of the selected RO membrane was studied by fitting the experimental data to the solution-diffusion model:
where
Jp is the permeate flux (L h
−1 m
−2),
K represents the permeability of the membrane (L h
−1 m
−2 bar
−1) and Δ
P − Δ
π (bar) is the net pressure (
PTM), that is the difference between the applied pressure (Δ
P) and the osmotic pressure (Δ
π) of the influent entering the RO membrane module.
The data regarding the dependence of the membrane permeability on the net driving pressure and tangential velocity are reported in
Table 4 in the form of pure water permeability (
Kw) and permeability with the OMWST-2 effluent (
K), obtained for ambient operating temperature (22 °C). The osmotic pressure of OMWST-2, equal to 1.5 bar at 22 °C, was calculated by means of Van’t Hoff equation
πf = Σ
ci,f·RT, where
ci,f is the feed molar concentration of ion
i (mol L
−1), R is the ideal gas constant (8.314 J K
−1 mol
−1) and T is the absolute temperature (K).
Table 4.
Permeability coefficients and resistances of the selected reverse osmosis (RO) membrane.
Table 4.
Permeability coefficients and resistances of the selected reverse osmosis (RO) membrane.
| vt, m s−1 | NRe | Kw, L h−1 m−2 bar−1 | Rm, m−1 | K, L h−1 m−2 bar−1 | RCP, m−1 |
|---|
| 2.55 | 1.3 × 10⁴ | 1.41 ± 0.1 | 2.6 × 10¹⁴ | 0.86 ± 0.1 | 1.9 × 10¹⁴ |
| 5.09 | 2.6 × 10⁴ | 1.41 ± 0.1 | 2.6 × 10¹⁴ | 0.90 ± 0.1 | 1.4 × 10¹⁴ |
Results withdrawn show a value of the pure water permeability coefficient (
Kw) of 1.41 L h
−1 m
−2 bar
−1, whereas
K measured with the secondary-treated effluent (OMWST-2) was equal to 0.86 L h
−1 m
−2 bar
−1 upon turbulent regime over the membrane (tangential velocity equal to
vt = 2.55 m s
−1, corresponding to Reynolds number
NRe = 1.3 × 10
4). The striking difference in the permeability coefficients between pure water and OMWST-2 (36.2%– 39.0% for
NRe = 1.3 × 10
4 − 2.6 × 10
4) shall be attributed to concentration polarization and fouling resistance taking place on the boundary region of the RO membrane (
Table 4) [
25,
26]. A guided focus on
Table 4 permits us to note that reduction of the concentration polarization (
RCP) on the RO membrane equal to 26.3% was provided upon an increment of the turbulence on the membrane to values of
NRe = 2.6 × 10
4.
Secondly, membrane fouling was examined by calculating the fouling index (
b) at every operating condition during diafiltration run time. With this purpose, the experimental permeate flux data were fitted with the threshold flux equation proposed by Field and Pearce (2011) [
27]:
where the variable
b is the reversible fouling index (h
−l) and
a the long-term irreversible fouling parameter (L h
−1 m
−2 bar
−1),
J0 is the initial permeate flux (L h
−1 m
−2) that can be easily calculated through Equation (1),
Jt is the permeate flux at a given time (L h
−1 m
−2) and
Jth represents the threshold flux (L h
−1 m
−2), being
b,
a and
Jth fitting parameters obtained simultaneously by a non-linear parameter estimation method [
28,
29,
30,
31]. The
b index takes into account the fouling developed on the membrane during operation time that can be periodically washed to recover the initial permeability (
K) of the membrane [
32,
33], meanwhile the
a parameter accounts for the irreversible fouling unavoidably attained on the membrane that makes the initial permeability to steadily decrease during the membrane service lifetime in a minor or major degree, thus establishing the module substitution periodicity.
Results are given in
Table 5, showing that medium operating pressure should be chosen (25 bar) upon turbulent regime over the membrane (5.09 m s
−1, that is
NRe = 2.6 × 10
4) to achieve significant steady state permeate flux (21.1 L h
−1 m
−2) and minimize membrane fouling (
b index equal to 0.32), ensuring less than 14.7% permeate flux drop and up to 90% feed recovery.
Table 5.
Results determined for the RO performance at several operating conditions.
Table 5.
Results determined for the RO performance at several operating conditions.
| vt, m s−1 | PTM, bar | T, °C | J0, L h−1 m−2 | Jss, L h−1 m−2 | −ΔJp, % | b, h−1 | Y, % |
|---|
| 2.55 | 35 | 22 | 32.1 | n.o. | 24.7 | 1.57 | 40 |
| 2.55 | 25 | 22 | 21.8 | 15.2 | 20 | 0.67 | 85 |
| 2.55 | 15 | 22 | 15.7 | 12.4 | 20.5 | 1.03 | 50 |
| 5.09 | 25 | 22 | 24.6 | 21.1 | 14.7 | 0.32 | 90 |
Finally, selectivity of the selected RO membrane was modelized by means of the Spiegler-Kedem model:
which allows prediction of the rejection efficiency of the solute
i (
Ri) as function of the net pressure (
PTM = Δ
P − Δ
π) as well as two parameters: the first is the reflection coefficient σ
i that indicates the maximum rejection capability of the RO membrane (0 < σ
i < 1) and the second is β
i which is a fitting constant [
32,
33]. Both parameters, estimated simultaneously by non-linear parameter estimation method, are reported in
Table 6 together with the rejection efficiency values achieved for EC and COD [
28,
29]. Accurate prediction of the experimental EC and COD rejection was attained by the Spiegler-Kedem model, and regression coefficients
R2 equal to 0.99 and 0.98 were obtained respectively. Minimum rejection coefficients for COD and EC equal to 99.1% and 98.1% were measured in the permeate stream. This ensured that the parametric values were maintained below standard limits established to reuse the regenerated effluent in the olives washing machines of the olive oil production process.
Table 6.
Coefficients for electroconductivity (EC) and chemical oxygen demand (COD) rejection.
Table 6.
Coefficients for electroconductivity (EC) and chemical oxygen demand (COD) rejection.
| Parameter | Rejection, % | σi | βi, bar |
|---|
| EC | 99.1–99.8 | 1 | 0.48 |
| COD | 98.1–99.2 | 1 | 0.63 |
A simplified economical balance of the treatment process was performed based on a daily amount of 10 m
3 OMW-2 on average. In our former studies [
6,
22], the secondary treatment process was presented as an economically advantageous AOP, providing high mineralization of the recalcitrant organic matter present in the raw effluent [
34]. Estimated operating costs of approximately 2.4 € m
−3 for conductive-diamond electrochemical oxidation, 8.5 € m
−3 for ozonation and 0.7 € m
−3 for Fenton-like process highlight the latter as the most cost-effective one. Furthermore, filtration through olive stones is costless [
23].
Under the best operating conditions studied for the final RO operation, significant steady-state permeate flux production was attained (21.1 L h
−1 m
−2) and the constant fouling parameter
a was estimated to be −0.08 L h
−2 m
−2 bar
−1. The
a parameter takes into account the irreversible fouling irretrievably attained on the RO membrane that steadily reduces its virgin permeability and therefore has direct implications in the module substitution periodicity. A membrane lifetime over 5 years can be ensured for a mean daily operating time equal to 10 h and taking into consideration that the olive oil campaign, when the OMW-2 is generated, lasts 90 days a year on average. The minimum required membrane area is equal to 47.4 m
2 for the daily volume of OMW-2 treated. This implies the need of two RO membrane modules of 32 m
2 surface each. The modules would work in parallel configuration: one in service, whereas the other would be in cleaning protocol when the diafiltration cycle finishes. This means an overdesign of 26% of the required membrane surface. Energy costs were fixed at 0.10 € kWh
−1, whereas membrane module and housing were equal to 22 € m
−2 and 380 €. Pumps, piping and instrumentation of the RO membrane plant represent approximately 50% of the membrane housing costs, whereas facility space needs and services represent 15% of total costs [
35,
36].
Finally, the total expenses of the whole integrated OMW-2 treatment process, taking into account the final purification of the effluent by the selected TFC RO membrane and the secondary treatment, are given in
Table 7, and the physicochemical characteristics of the final permeate stream are reported in
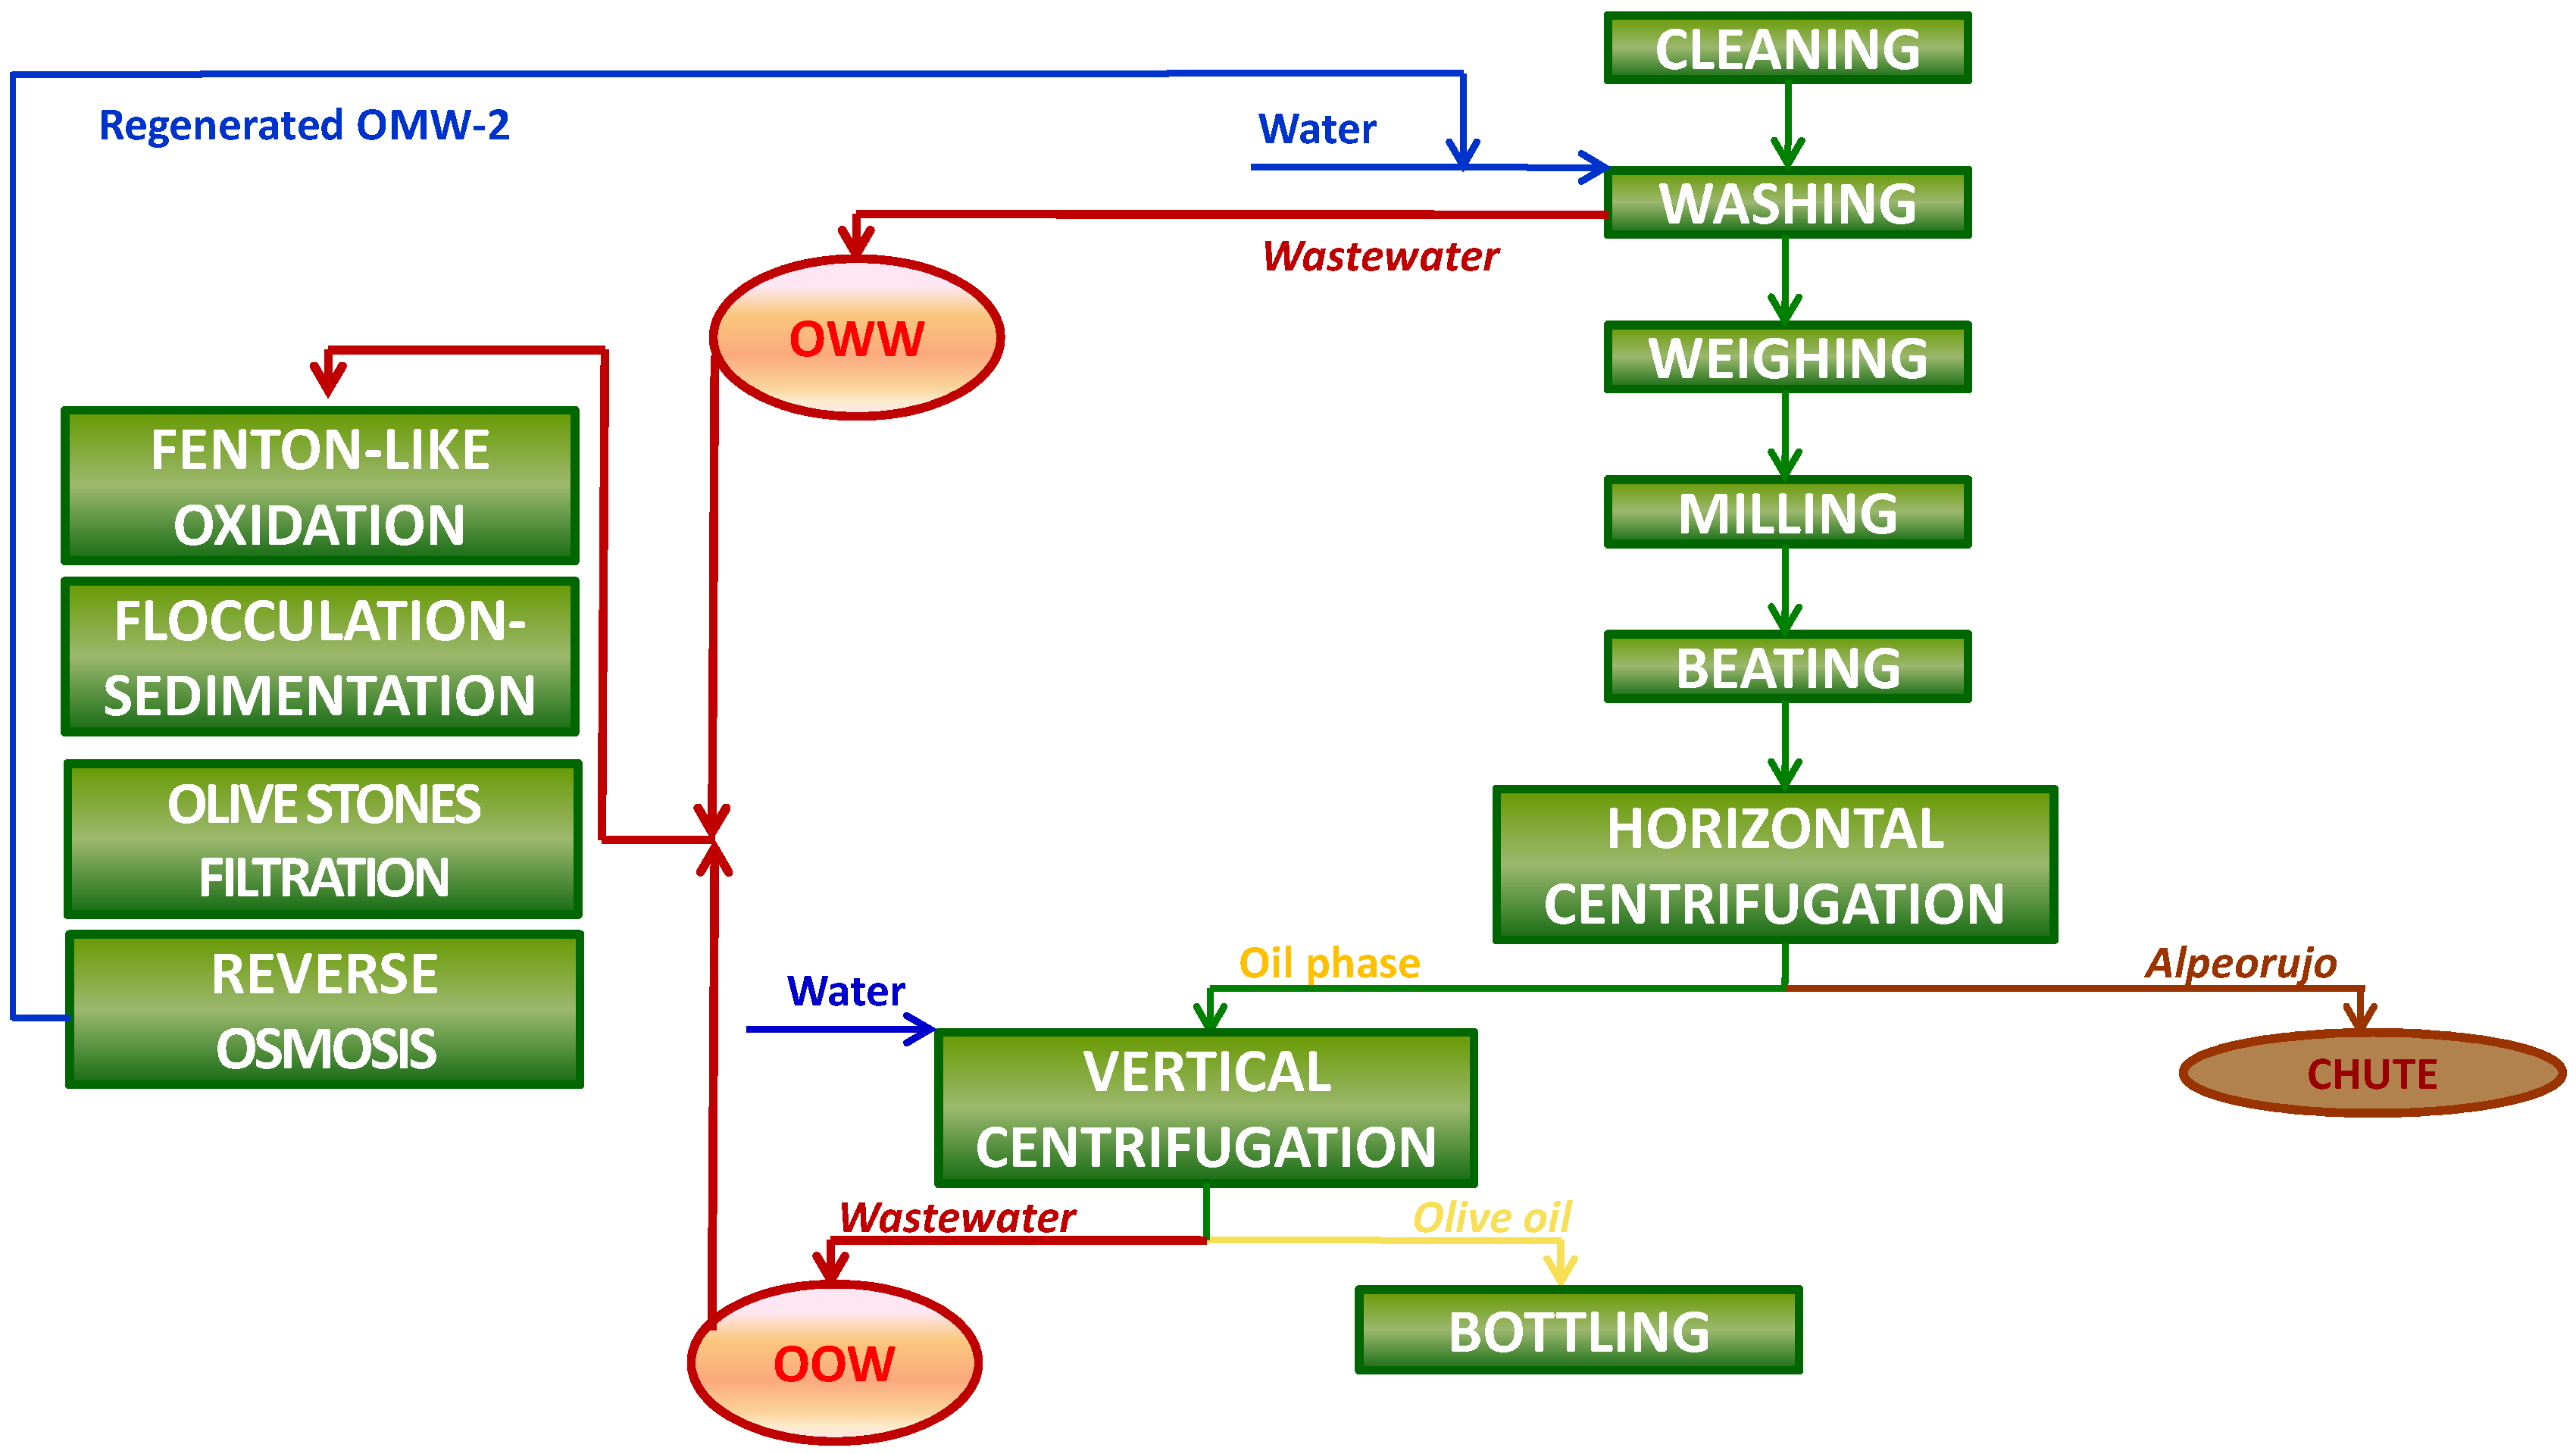
Table 8. The proposed integrated treatment permits us to close the loop of the olive oil production process (
Figure 5), rending it environmentally respectful (
Figure 6) and boosting its cost-effectiveness.
Table 7.
Cost evaluation of RO operation and whole integrated process.
Table 7.
Cost evaluation of RO operation and whole integrated process.
| Parameter | Cost, € m−3 |
|---|
| Membrane | 0.25 |
| Housing and piping | 0.22 |
| Current | 0.40 |
| Total costs of RO operation | 0.87 |
| Total costs of the integrated process | 1.57 |
Table 8.
Physicochemical composition of permeate stream.
Table 8.
Physicochemical composition of permeate stream.
| Parameter | Value in permeate stream |
|---|
| pH | 7.6–7.7 |
| EC, µS cm−1 | 95.0–97.0 |
| Tss, mg L−1 | 0 |
| COD, mg L−1 | 2.3–3.7 |
| Total phenols, mg L−1 | 0 |
| [Fe]Total, µg L−1 | 0 |
| [Cl−], mg L−1 | 15.5–20.7 |
| [Na+], mg L−1 | 11.1–16.7 |
Figure 5.
Integrated olive oil production process.
Figure 5.
Integrated olive oil production process.
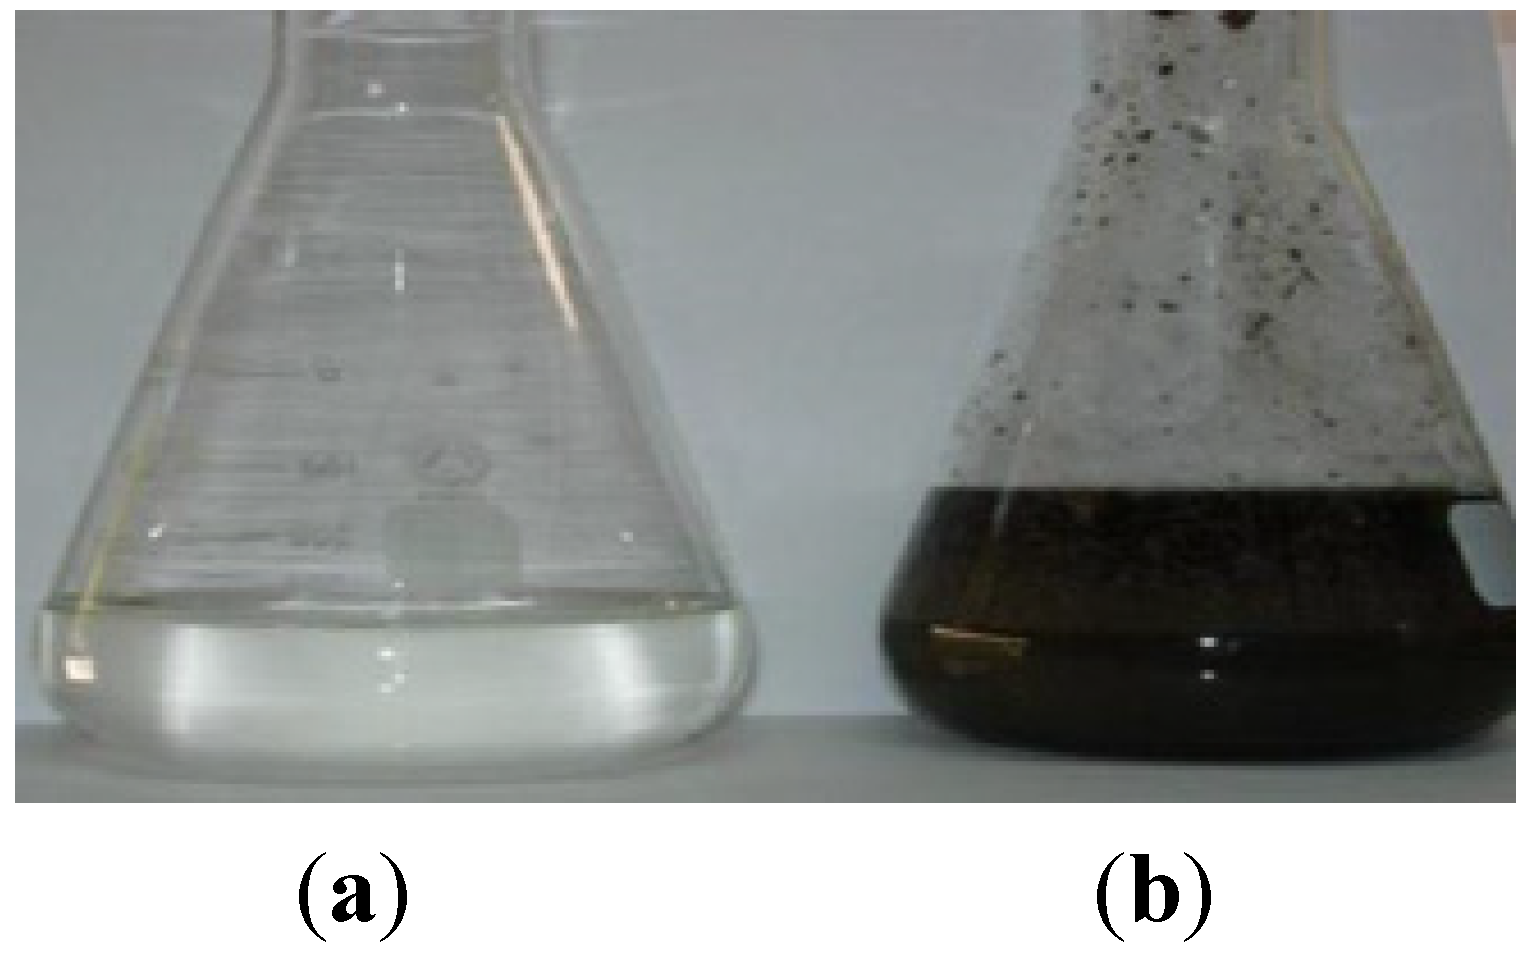
Figure 6.
Final treated OMW-2 (a) in contrast with raw OMW-2 (b).
Figure 6.
Final treated OMW-2 (a) in contrast with raw OMW-2 (b).

 ,
, 


