Abstract
The study investigates the performance of polyethersulfone (PES) ultrafiltration (UF) membranes modified with a coating of polymerizable bicontinuous microemulsion (PBM) for membrane bioreactor (MBR) applications. Two types of PBM-modified PES membranes—casting-coated and spray-coated—were compared with a commercial PES membrane. A laboratory side-stream MBR (ssMBR) was employed to treat model wastewater (MW) with activated sludge under aerobic conditions. The fouling propensity of the membranes in ssMBR was evaluated through the implementation of two protocols: (i) flux-step test to treat low-strength domestic model wastewater (DMW) and (ii) constant flux test to treat high-strength olive mill model wastewater (OMW). The findings indicated that both the commercial PES and PBM spray-coated PES membranes started to critically foul at 36 L m−2 h−1. The PBM spray-coated membranes showed enhanced fouling resistance in comparison to the PBM casting-coated membranes. The deposition of the biofouling layer was the thinnest on PBM spray-coated membranes, which can be attributed to the low surface charge and high hydrophilicity of the modified membrane surface. In contrast, deposition of a thicker fouling layer was found on the commercial PES membrane, which can be attributed to the relatively higher surface charge promoting organic adsorption. A comparison of the fouling trends exhibited by commercial PES and PBM spray-coated membranes in OMW treatment revealed that they have similar fouling tendencies. However, a notable distinction emerged when the PBM spray-coated membrane was observed to demonstrate a lower fouling propensity accompanied by comparatively thinner fouling layers. The results demonstrate that the PBM spray-coated membranes have enhanced fouling resistance and filtration efficacy in MBRs treating wastewater with diverse strengths, thereby affirming their potential for application in wastewater treatment systems.
1. Introduction
There is a growing interest today in advanced wastewater treatment (WT) technologies capable of producing high-quality effluents suitable for reuse [1,2]. In this regard, membrane bioreactors (MBRs) have gained attention due to their compact design, superior effluent quality, and ability to handle high mixed liquor suspended solids (MLSS) concentrations [3,4]. However, membrane fouling remains one of the most significant operational challenges for MBR technology in WT [5,6]. Membrane fouling leads to reduced membrane performance, increased energy demand, and consequently higher operational costs. Consequently, significant research has been conducted on antifouling and high-performance ultrafiltration (UF) membranes, focusing on materials and engineering surfaces. These modifications involve: (i) chemical surface modification [7], (ii) polymer blending [8], (iii) incorporation of nanomaterials such as TiO2 and graphene oxide [9,10], (iv) hydrophilization [11,12], (v) zwitterionic coatings [13,14], and (vi) engineered surface structures such as surface patterning [15].
Another promising technique is the modification using polymerizable bicontinuous microemulsion (PBM) materials. PBMs have recently emerged as a promising platform for engineering hydrophilic, antifouling, and functionally tailored membrane surface layers [16,17,18,19,20,21]. PBM-based coatings have been shown to enhance surface wettability, suppress organic adsorption, and improve chemical resistance—properties that are critical for achieving stable and sustainable wastewater treatment performance. Spray-coating methodologies enable the uniform application of microemulsion layers onto flat-sheet PES substrates, offering precise control over coating thickness while ensuring robust adhesion following polymerization [21,22]. The resulting PBM layer functions as an effective protective barrier that promotes flux recovery and mitigates membrane fouling. When applied to UF-grade PES coatings, it significantly increases hydrophilicity and produces smoother surface morphologies, thereby reducing foulant deposition and facilitating cleaning [21]. Moreover, PBM formulation can incorporate functional groups—such as hydroxyl or carboxyl moieties, that modulate electrostatic interactions with foulants, providing an additional mechanism for antifouling enhancement. Accordingly, elucidating the relationships among coating composition, microstructural characteristics, and MBR operational performance is essential for guiding the rational design of next-generation membranes.
A study by De et al. (2023) [21] assessed the influence of the PBM-coating method and demonstrated the potential of PBM spray-coated membranes over casting-coated and commercial UF PES membranes for use in MBRs. The critical flux was found to be approximately 40% higher for the PBM spray-coated membrane than the commercial PES membrane, using humic acid as a model foulant [21]. This study aims to build on these findings by investigating the performance of PBM spray-coated PES membrane under realistic conditions in a laboratory side-stream MBR (ssMBR) using model wastewaters (MW) such as low-strength domestic wastewater (DMW) and high-strength olive mill wastewater (OMW). Domestic wastewater is the most important type of wastewater worldwide and therefore offers great market potential for application. OMW is considered one of the most challenging industrial effluents for membrane filtration due to its high-fouling potential resulting from a combination of chemical, physical, and biological characteristics [23].
2. Materials and Methods
2.1. Membrane Preparation
The commercial Flat sheet Nadir® UP150 membrane (Mann+Hummel International GmbH, Ludwigsburg, Germany) was the first membrane sample tested in this study [24,25]. Its membrane surface was modified by application of a PBM layer to obtain 2 different samples—PBM casting-coated membranes and PBM spray-coated membranes [21]. A 4 µm thick casting layer of PBM was manually applied on the PES membrane surface using a spiral casting knife, TQC sheen AB3050 (Industrial Physics, Essen, Germany) to obtain the PBM casting-coated membrane [26]. The PBM was sprayed onto the PES membrane surface using a homemade spray-coating system to obtain the PBM spray-coated membrane [21]. The detailed preparation of the 3 different membrane samples for testing has been described in our previous work [21]. The PES membranes were modified in inert conditions. They were ready to be used after photopolymerization of the coated bicontinuous microemulsion by ultraviolet (UV) light (300 mW cm−2) within 1 min. The membrane sheets were cut with an active filtration area of 84 cm2 to fit the crossflow module of the laboratory side-stream MBR (ssMBR). The membrane cut-outs were wetted in deionized (DI) water for 3 h before installation in the ssMBR.
2.2. Laboratory Side-Stream MBR (ssMBR)
A stainless steel fermentor, BioStat® C-DCU from Satorius AG (Goettingen, Germany), was used as the ssMBR to perform experiments with MW [27,28]. All the data was monitored by the in-built sensors of the BioStat C-DCU system and collected by the supervisory control and data acquisition system. The 30 L bioreactor tank was filled with 20 L of activated sludge (Municipal Sewage Treatment Plant, Germersheim, Germany) to treat the MW. The prepared MW was slowly added to the bioreactor tank at a rate of 100 mL h−1, ensuring that the foam was contained within the tank (Figure 1). The MW was mixed with the sludge by a stirrer continuously rotating at 200 rpm. This prevented the settling of any excess sludge at the bottom of the bioreactor tank.
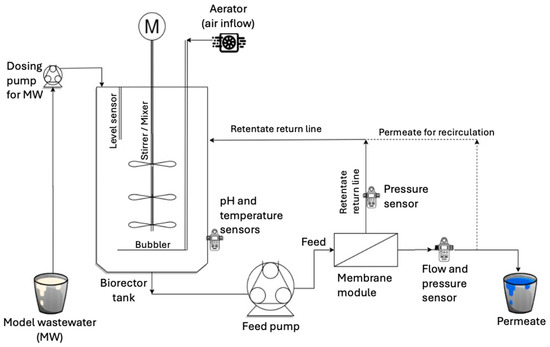
Figure 1.
Schematic illustration of laboratory ssMBR used to test the membrane performance.
The MBR was acclimated for 10 days, considering the hydraulic retention time (HRT) of 8.5 days. The HRT was long due to the low throughput associated with the small membrane size used in the membrane module. The MBR was operated with a recirculation flow rate of 28 L h−1, pH of 6.5–7.5, and within a temperature range of 20–24 °C. The MBR produced 2.0–2.5 L day−1 of permeate during its acclimation phase. Mixed liquor suspended solids (MLSS) concentration in the range of 4.0–6.0 g L−1 was maintained in the bioreactor tank during the experiments. The activated sludge was released after the experiments with one type of MW were completed. The MBR was cleaned with a 10% hydrogen peroxide (H2O2) solution, followed by thorough rinsing with water to remove any trace of chemicals or cleaning agent, before loading a fresh batch of activated sludge for treatment of MW.
2.3. Model Wastewater (MW) Preparation
A fresh batch of MW was prepared for the experiments, ensuring the MW characteristics were consistent. The DMW was prepared to replicate low-strength domestic wastewater, which is similar to diluted urban greywater (Table 1, Table 2, Table 3 and Table 4) [29,30]. The OMW was prepared to mildly replicate the characteristics of typical high-strength olive mill wastewater (Table 2, Table 3, Table 4 and Table 5). It comprised commonly found minerals in olive mill wastewater, such as potassium, ammonium, and chloride, in addition to 2 phenolic compounds—tannic acid (relatively higher molecular weight) and vanillic acid (relatively lower molecular weight) to increase the organic load of the MW (Table 3) [31,32,33,34]. The pH of the prepared DMW was 7.0 ± 0.5, whereas the pH of the prepared OMW was 5.2 ± 0.5. The wastewater samples were characterized using spectrophotometric cell tests (Spectroquant® NOVA 60A) for chemical oxygen demand (COD), ammonium (N-NH4+), nitrate (N-NO3–), and orthophosphate (P-PO43–) (Table 3). TOC-L CPH/CPN (Shimadzu, Darmstadt, Germany) was used to measure the total organic carbon (TOC).

Table 1.
Chemicals used for low-strength DMW preparation.
Table 2.
Chemicals used for high-strength OMW preparation.
Table 3.
Cell tests used for water analysis.
Table 4.
Chemical composition of low-strength DWM used in the experiments.
Table 5.
Chemical composition of high-strength OWM used in the experiments.
2.4. Characterization Methods for Membranes
The fouled membranes were lightly rinsed in DI water, ensuring that the large particulates from the sludge that had deposited on the surface of the fouled membranes were released. The fouling layer was retained on the membrane surface undisturbed. The membranes were then dried at room temperature before analyzing. The details of the characterization tools used to analyze the fouled membranes are described in our previous work (Table 6) [21].
Table 6.
List of tools used for membrane characterization.
2.5. Fouling Test in ssMBR
The membrane samples were subjected to 2 fouling test procedures in the laboratory ssMBR: (i) a flux-step test using low-strength DMW, and (ii) a constant flux test using high-strength OMW.
The flux-step protocol, adopted from the work of Clech and Jefferson et al. [35], produced data for comparing the fouling behavior of membranes by observing the changes in TMP at different flux levels. The ssMBR was initially operated at a constant flux of 12 L m−2 h−1 for 60 min to obtain a stable throughput. The flux was then increased in increments of 12 L m−2 h−1 at 25-min time intervals (see Section 3.2.1). Only ascending flux-step increments were carried out because critical fouling of the membranes resulted in: (i) an unstable recirculation flow in the ssMBR, and (ii) a steep increase in TMP (the rate of increase in TMP with respect to time, dP/dt ≥ 4 mbar min−1). The steep increase in the TMP indicated the start of critical membrane fouling and the onset of permeability loss, implying that the membrane should be cleaned [35]. The operating TMP safety threshold of the ssMBR was set to 2 bar to prevent any membrane damage during the test.
The constant flux test was conducted at 12 L m−2 h−1, and the increase in TMP of the membranes was observed until it reached the safety threshold of 2 bar (see Section 3.2.2).
3. Results and Discussion
3.1. Membrane Morphology and Properties
The characterization and pure water permeability (PWP) of the membranes are published in our previous work [21].
3.2. Fouling Experiments
3.2.1. Flux-Step Test with Low-Strength DMW
The commercial PES membrane has the lowest TMP (~80 mbar) of the 3 membranes at an initial flux of 12 L m−2 h−1 (Figure 2). Subsequently, the TMP of the PBM spray-coated membrane is marginally elevated (~90 mbar), followed by the PBM casting-coated membrane, with the highest initial TMP (~130 mbar). The modification of the PES membranes with an additional PBM-coated layer increased the inherent membrane resistance, which led to relatively higher TMP and reduced permeability [21].
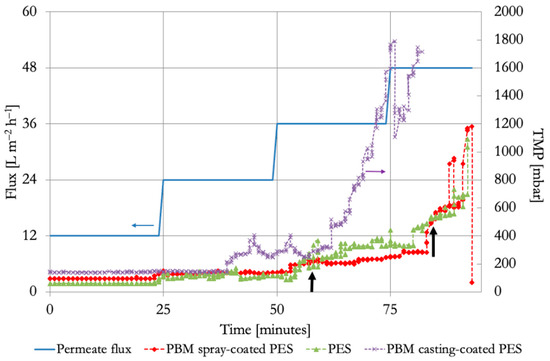
Figure 2.
Flux versus TMP curve from flux-step test in laboratory ssMBR treating low-strength DMW using commercial PES membrane, PBM casting-coated PES membrane, and PBM spray-coated PES membrane. Onset of critical fouling of commercial PES membrane (left black arrow) and PBM spray-coated membrane (right black arrow).
The initial permeability of the commercial PES membrane at a flux of 12 L m−2 h−1 was 152 L m−2 h−1 bar−1. The permeability of the PBM casting-coated membrane and PBM spray-coated membrane at a flux of 12 L m−2 h−1 was 90 L m−2 h−1 bar−1 and 130 L m−2 h−1 bar−1, respectively. This shows that the PBM coating causes loss in permeability even at low flux operation in MBR, while adding low-fouling benefits to the membrane.
At the flux-step of 24 L m−2 h−1, the commercial PES and PBM spray-coated PES membranes reached the same TMP of about 150 mbar, whereas the TMP of the PBM casting-coated membrane increased above 200 mbar. This shows that commercial PES and PBM spray-coated membranes are better suited for MBR applications than the PBM casting-coated membranes because the typical design flux range of a submerged MBR is 15–25 L m−2 h−1 [3,5]. At a flux step of 36 L m−2 h−1, the rate of increase in TMP (dP/dt) for all the membranes exceeded the threshold of 4 mbar min−1, indicating an inflection point on the dP/dt versus flux plot, when the membrane fouling escalates (Figure 3). The onset of critical fouling of the commercial PES, PBM casting-coated, and PBM spray-coated membranes was identified at 36 L m−2 h−1, 24 L m−2 h−1, and 36 L m−2 h−1, respectively (dP/dt ≥ 4 mbar min−1). This trend is similar to the critical fluxes of the membranes determined in our previous study [21]. This showed a 50% improvement in the performance of the PBM spray-coated membrane compared to the PBM casting-coated membrane with regard to critical flux. Despite having the same critical flux, the low-fouling behavior of the PBM spray-coated membrane is demonstrated by a lower dP/dt value than the commercial PES membrane.
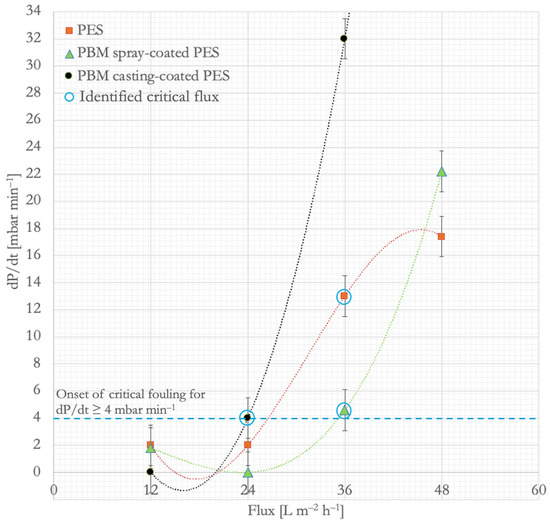
Figure 3.
Plot of dP/dt versus flux to identify the onset of critical fouling in commercial PES membrane, PBM casting-coated PES membrane, and PBM spray-coated PES membrane in a laboratory ssMBR treating low-strength DMW.
3.2.2. Constant Flux Test with High-Strength OMW
The severity of membrane fouling resulting from the treatment of high-strength OMW in ssMBR was evident from the linear increase in TMP with the passage of time while operating at a constant low flux of 12 L m−2 h−1 (Figure 4). The membranes fouled steadily such that the TMP reached 2 bar (safety threshold set point of the laboratory ssMBR) in less than 5 h during the constant flux test. Thus, a flux-step protocol could not be implemented in the ssMBR treating high-strength MW.
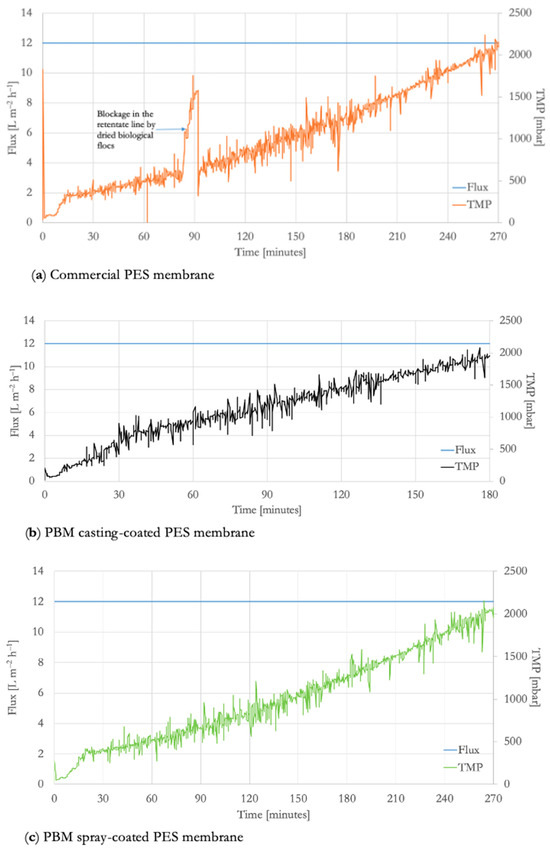
Figure 4.
Constant flux versus TMP curve of (a) commercial PES membrane, (b) PBM casting-coated PES membrane, and (c) PBM spray-coated PES membrane in a laboratory ssMBR treating high-strength OMW.
The TMP of the PBM casting-coated membrane increased to 2 bar within 2 h of operation, whereas the commercial PES and PBM spray-coated membranes operated for 4.5 h. The increase in TMP over a relatively shorter time duration is an indicator of membrane fouling [36], which implies that the PBM casting-coated membrane is not suitable for MBRs treating high-strength wastewater. The dP/dt of the PBM casting-coated membrane was 12 mbar min−1, whereas the dP/dt of the commercial PES and PBM spray-coated membrane was 7.5 mbar min−1. This corroborates the membrane fouling trends observed in experiments with humic acid solution in our previous study [21] and with low-strength DMW in the ssMBR (See Section 3.2.1), where the fouling progression of PBM spray-coated and commercial PES membranes is similar. This test confirms that the thickness of the added low-fouling layer represents a tradeoff in achieving effective performance in real scenarios of wastewater treatment using MBR.
3.3. Characterization of Fouled Membranes
The fouling layer on the membranes was visibly indicated by the biofouling layer deposited on the membrane surface (Figure 5 and Figure 6). It can be inferred from the visual impression of the fouled membranes that the PBM spray-coated membrane had fewer impurities on its surface than the commercial PES and PBM casting-coated membranes.
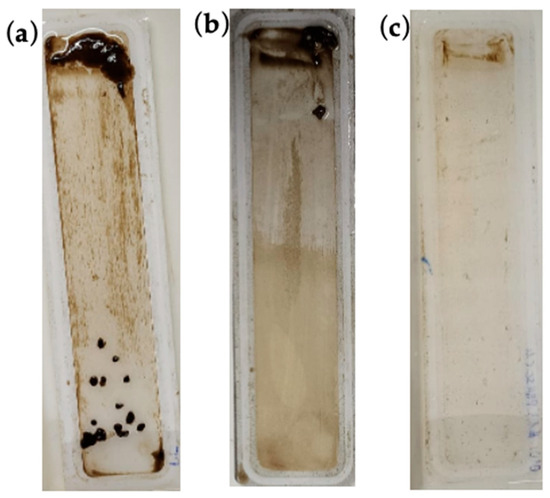
Figure 5.
Visual impression of (a) commercial PES membrane, (b) PBM casting-coated PES membrane, and (c) PBM spray-coated PES membrane fouled by treatment of low-strength DMW in laboratory ssMBR.
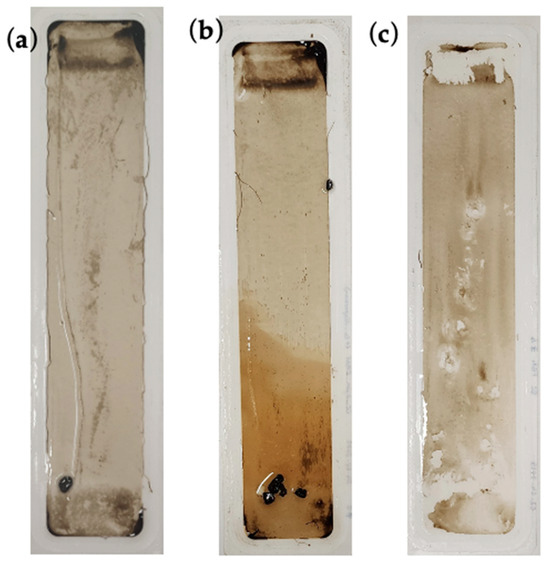
Figure 6.
Visual impression of (a) commercial PES membrane, (b) PBM casting-coated PES membrane, and (c) PBM spray-coated PES membrane fouled by treatment of high-strength OMW in laboratory ssMBR.
The larger particulates on the membrane are the biological flocs that comprise the activated sludge used in the bioreactor for degradation of the wastewater (feed). These biological flocs are composed of EPS, SMP, bacteria, etc., which are part of the MLSS (sludge characteristics) of the MBR [37]. The tendency of these biological flocs to adsorb on the PES and PBM casting-coated surface appeared greater than on the PBM spray-coated membrane, based on the visual appearance of the fouled membranes. The ochre yellowish shade on a portion of the PBM casting-coated membrane in Figure 6b is indicative of the fouling layer of OMW. The OMW inherently possessed a dark brown color due to the presence of tannic acid in its composition.
3.3.1. Detecting PBM on Fouled Membranes
The deposition of a fouling layer on the membranes was indicated by the attenuated absorbance amplitude in the ATR-FTIR spectral curve (Figure 7). The peaks of the fouled membranes were dampened by the presence of a fouling layer on the membrane surface. It is mostly clearly seen in the spectrum of the fouled PES membrane. Most of the absorbance peaks for the PBM-coated membranes were detected, but the overall spectrum of the fouled membranes differed from that of the unfouled membranes due to the presence of a fouling layer.
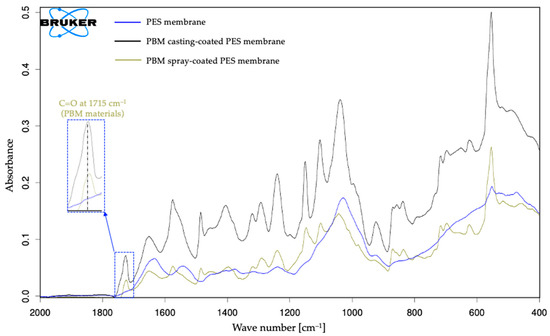
Figure 7.
ATR-FTIR spectra of commercial PES membrane, PBM casting-coated PES membrane, and PBM spray-coated PES membrane fouled by treatment of low-strength DMW in laboratory ssMBR.
The presence of PBM materials on the fouled membranes was confirmed by the IR absorbance peak at 1715 cm−1. These peaks are detectable within the wavenumber range of 1715–1726 cm−1. This slight shift in the peaks could be due to the C=O stretching caused by the attachment of the fouled compounds on the membrane surface.
3.3.2. CAM of Fouled Membranes
The degradation of MW by activated sludge in MBR produces a more hydrophobic biofouling layer comprising protein-rich components, lipids, amino acid residues, etc., [38,39]. The CA of the PES membrane fouled by DMW (83°) and OMW (77°) increased from its value in the unfouled or pristine state (73°), which shows that the fouled layer on the PES membrane was hydrophobic in nature. This indicates that the uncoated PES membrane is more susceptible to fouling caused by the hydrophobic fraction of wastewater [40].
On the contrary, the CA values of the fouled PBM-coated membranes were lower than their unfouled counterparts (Table 7 and Table 8). This highlights the low-fouling property of the PBM-coated membranes and indicates that the relatively hydrophilic PBM-coated surface is prone to reduced interaction with hydrophobic moieties.
Table 7.
CAM of membranes fouled with low-strength DMW in ssMBR.
Table 8.
CAM of membranes fouled with high-strength OMW in ssMBR.
The CA of the PBM-coated membranes fouled with OMW is higher than that with DMW, indicating that the biofouling caused by OMW is more severe than that caused by DMW. It was further confirmed by microscope images of the biofouling layer (Section 3.3.3).
3.3.3. SEM Images of Fouled Membranes
The biofouling layer dried on the membrane surface was visible under an SEM in the cross-sectional views (Figure 8, Figure 9, Figure 10 and Figure 11). The thickness of the biofouling layer by DMW (4.0 ± 0.8 µm) and OMW (3.0 ± 0.6 µm) was thickest on the commercial PES membrane. This can be attributed to the relatively high surface charge, which results in the deposition of organics [17].
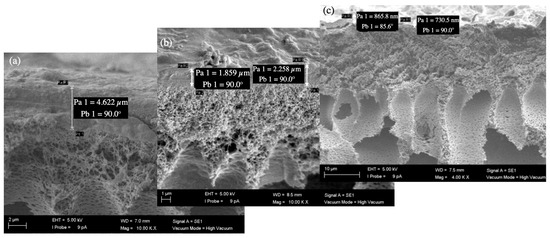
Figure 8.
SEM micrograph of the cross-section of (a) a commercial PES membrane (magnification 10,000x), (b) a PBM casting-coated PES membrane (magnification 10,000x), and (c) a PBM spray-coated PES membrane (magnification 4000x) fouled by low-strength DMW.
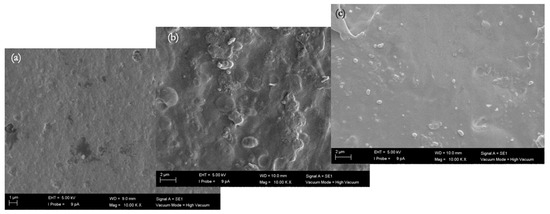
Figure 9.
SEM micrograph (magnification 10,000x) of the top-view of (a) a commercial PES membrane, (b) a PBM casting-coated PES membrane, and (c) a PBM spray-coated PES membrane fouled by low-strength DMW.
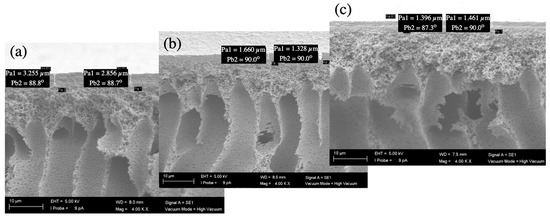
Figure 10.
SEM micrograph (magnification 4000x) of the cross-section of (a) a commercial PES membrane, (b) a PBM casting-coated PES membrane, and (c) a PBM spray-coated PES membrane fouled by high-strength OMW.
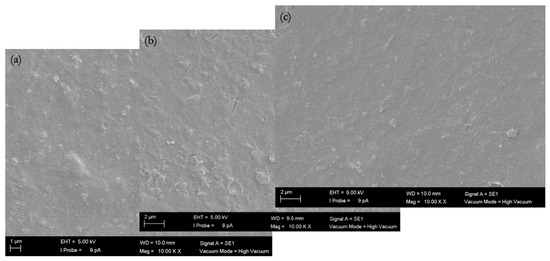
Figure 11.
SEM micrograph (magnification 10,000x) of the top-view of (a) a commercial PES membrane, (b) a PBM casting-coated PES membrane, and (c) a PBM spray-coated PES membrane fouled by high-strength OMW.
A thinner fouling layer was found to be deposited in the PBM casting-coated membrane fouled with DMW (2.1 ± 0.6 µm) and OMW (1.4 ± 0.2 µm). This showed the anti-fouling behavior of the PBM layer, attributed to its high hydrophilicity and low surface charge [17]. The PBM spray-coated membranes were least fouled, as evident from the thin fouling layer caused by DMW (0.7 ± 0.2 µm) and OMW (1.2 ± 0.3 µm) (Table 9). The efficacy of the spray-coated PBM layer is noticeable through the reduced thickness of biofouling in these SEM micrographs.
Table 9.
Thickness of the fouling layer obtained after fouling tests in ssMBR.
3.3.4. Permeate Quality
The PBM-coated membranes and commercial PES membranes produced satisfactory permeate quality (Table 10 and Table 11). The pH of the permeate produced was found to be consistent with the pH of the sludge in the MBR tank.
Table 10.
Permeate quality obtained after treatment of low-strength DWM.
Table 11.
Permeate quality obtained after treatment of high-strength OWM.
The rejection of the membranes is improved moderately by the application of spray-coated PBM. A thicker PBM layer offers higher rejection of the organics. Thus, improving the permeate quality of the wastewater treatment process.
4. Conclusions
This study advances our earlier work on PBM-coated PES membranes [21] by validating their performance under MBR operating conditions. The results confirm the advantages of the spray-coating approach, particularly in achieving a thin and effective PBM layer that enhances membrane performance without substantially compromising the permeability. The key findings of this study are as follows:
- Stable performance under variable wastewater strengths.
- Enhanced anti-fouling characteristics.
- Improved permeability at lower TMP.
- Comparable baseline performance with added benefits.
- Effectiveness of the spray-coating modification strategy.
PBM spray-coated membranes maintained prolonged operational stability during the treatment of both low-strength and high-strength MW, demonstrating suitability for diverse MBR applications. The PBM spray-coated membranes exhibited a noticeably thinner biofouling layer compared with PBM casting-coated and commercial PES membranes, indicating reduced fouling propensity. The reduced PBM coating thickness facilitated higher membrane permeability, contributing to lower operating TMP and suggesting the potential for decreased energy consumption during permeate extraction. While the commercial PES membrane performed similarly in terms of critical flux and overall filtration behavior, the PBM spray-coated membrane offered incremental improvements in fouling resistance. The results reinforce spray-coating as a practical and efficient approach for applying PBM coatings to UF membranes, providing a favorable balance between fouling mitigation and hydraulic performance. It offers a promising and operationally advantageous option for MBR-based WT. Future work will focus on evaluating the modified membranes in full-scale treatment facilities and on exploring further functional enhancements, including antibacterial and antiviral properties.
5. Patents
The composition of PBM used for membrane coating in this work is protected by a European patent granted in 2019 [41].
Author Contributions
Conceptualization: S.D., J.H., B.G. and A.F.; methodology: S.D., F.G. and J.H.; investigation: T.L.Q., S.D. and F.G.; writing—original draft preparation: S.D. and J.H.; writing—review and editing: S.D., J.H., F.G., A.F., R.M. and B.G.; supervision: A.F., B.G. and J.H. All authors have read and agreed to the published version of the manuscript.
Funding
This research received no external funding.
Data Availability Statement
The data presented in this study are available on request from the corresponding authors.
Conflicts of Interest
The authors declare no conflict of interest.
References
- Tang, C.J.; Zheng, P.; Chen, T.T.; Zhang, J.Q.; Mahmood, Q.; Ding, S.; Chen, X.G.; Chen, J.W.; Wu, D.T. Enhanced nitrogen removal from pharmaceutical wastewater using SBA-ANAMOX process. Water Res. 2011, 45, 201–210. [Google Scholar] [CrossRef]
- Kesari, K.K.; Soni, R.; Jamal, Q.M.S.; Tripathi, P.; Lal, J.A.; Jha, N.K.; Siddiqui, M.H.; Kumar, P.; Tripathi, V.; Ruokolainen, J. Wastewater treatment and reuse: A review of its application and health implications. Water Air Soil Pollution 2021, 232, 208. [Google Scholar] [CrossRef]
- Meng, F.; Chae, S.-R.; Drews, A.; Kraume, M.; Shin, H.-S.; Yang, F. Recent advances in membrane bioreactors: Configurations and operating conditions. Crit. Rev. Environ. Sci. Technol. 2017, 47, 543–600. [Google Scholar]
- Kim, J.; Wu, B.; Jeong, S.; Jeong, S.; Kim, M. Recent advances of membrane-based hybrid membrane bioreactors for wastewater reclamation. Front. Membr. Sci. Technol. 2024, 3, 1361433. [Google Scholar] [CrossRef]
- Le Clech, P.; Chen, V.; Fane, T.A.G. Fouling in membrane bioreactors used in wastewater treatment. J. Membr. Sci. 2006, 284, 17–53. [Google Scholar] [CrossRef]
- Du, X.; Shi, Y.; Jegatheesan, V.; Haq, I.U. A review on the mechanism, impacts and control methods of membrane fouling in MBR systems. Membranes 2020, 10, 24. [Google Scholar] [CrossRef]
- Upadhyaya, L.; Qian, X.; Wickramasinghe, S.R. Chemical modification of membrane surface—Overview. Curr. Opin. Chem. Eng. 2018, 20, 13–18. [Google Scholar] [CrossRef]
- Mu, Y.; Feng, H.; Wang, S.; Zhang, S.; Luan, J.; Zhang, M.; Yu, Z.; Wang, G. Combined strategy of blending and surface modification as an effective route to prepare antifouling ultrafiltration membranes. J. Colloid Interface Sci. 2021, 589, 1–12. [Google Scholar] [CrossRef] [PubMed]
- Bae, T.H.; Tak, T.M. Effect of TiO2 nanoparticles incorporation on fouling mitigation of ultrafiltration membranes for activated sludge filtration. J. Membr. Sci. 2005, 249, 1–8. [Google Scholar] [CrossRef]
- Murcia, M.D.; Hidalgo, A.M.; Gómez, M.; León, G.; Gómez, E.; Martínez, M. Ultrafiltration membranes modified with reduced graphene oxide: Effect on methyl green removal from aqueous solution. Materials 2023, 16, 1369. [Google Scholar] [CrossRef] [PubMed]
- Liu, F.; Hashim, N.A.; Liu, Y.; Abed, M.R.M.; Li, K. Progress in production and modification of PVDF membrane. J. Membr. Sci. 2011, 375, 1–27. [Google Scholar] [CrossRef]
- Li, L.; Zhang, J.; Tian, Y.; Zhang, J.; Zhan, W.; Zhao, J.; Ding, Y.; Zuo, W. Hydrophilic modification of polyvinylidene fluoride membranes by ZnO atomic layer deposition using nitrogen dioxide/diethylzinc functionalization. J. Membr. Sci. 2016, 514, 241–249. [Google Scholar] [CrossRef]
- Bernards, M.T.; Mast, D. Zwitterionic polymer brushes for antifouling membrane surfaces. J. Mater. Chem. B 2013, 1, 36–45. [Google Scholar]
- Huang, L.; Zhao, S.; Wang, Z.; Wang, J. Zwitterion-modified UF for improved antifouling in MBRs. Sep. Purif. Technol. 2015, 156, 572–583. [Google Scholar] [CrossRef]
- Tripathi, B.P.; Chung, J.S. Surface-structured and patterned membranes for improved antifouling. J. Membr. Sci. 2013, 448, 135–148. [Google Scholar]
- Hoinkis, J.; Deowan, S.; Panten, V.; Figoli, A.; Huang, R.; Drioli, E. Membrane bioreactor (MBR) technology—A promising approach for industrial water reuse. Procedia Eng. 2012, 33, 234–241. [Google Scholar] [CrossRef]
- Galiano, F. Preparation and Characterization of Polymersiable Bicontinuous Microemulsion Membranes for Water Treatment Application. Ph.D. Thesis, University of Calabria, Cosenza, Italy, 2013. Available online: http://hdl.handle.net/10955/995 (accessed on 10 November 2025).
- Deowan, S.A. Development of Membrane Bioreactor (MBR) Process Applying Novel Low Fouling Membranes. Ph.D. Thesis, University of Calabria, Cosenza, Italy, 2013. Available online: http://hdl.handle.net/10955/772 (accessed on 10 November 2025). [CrossRef]
- Galiano, F.; Schmidt, S.A.; Ye, X.; Kumar, R.; Mancuso, R.; Curcio, E.; Gabriele, B.; Hoinkis, J.; Figoli, A. UV-LED induced bicontinuous microemulsions polymerisation for surface modification of commercial membranes—Enhancing the antifouling properties. Sep. Purif. Technol. 2018, 194, 149–160. [Google Scholar] [CrossRef]
- Gukelberger, E.; Hitzel, C.; Mancuso, R.; Galiano, F.; Bruno, M.D.L.; Simonutti, R.; Gabriele, B.; Figoli, A.; Hoinkis, J. Viscosity modification of polymerizable bicontinuous microemulsion by controlled radical polymerization for membrane coating applications. Membranes 2020, 10, 246. [Google Scholar] [CrossRef] [PubMed]
- De, S.; Heer, J.; Sankar, S.; Geiger, F.; Gukelberger, E.; Galiano, F.; Mancuso, R.; Gabriele, B.; Figoli, A.; Hoinkis, J. Study on UF PES membranes spray-coated with polymerizable bicontinuous microemulsion materials for low-fouling behavior. Membranes 2023, 13, 893. [Google Scholar] [CrossRef]
- Vatanpour, V.; Mehrabi, Z.; Behroozi, A.H.; Kose-Mutlu, B.; Kaya, R.; Koyuncu, I. Spray-coating technique in the fabrication and modification of membranes: A review. Sep. Purif. Technol. 2025, 378, 3. [Google Scholar] [CrossRef]
- Cifuentes-Cabezas, M.; Bohórquez-Zurita, J.; Gil-Herrero, S.; Vincent-Vela, M.; Mendoza-Roca, J.; Álvarez-Blanco, S. Deep study on fouling modelling of ultrafiltration membranes used for OMW treatment: Comparison between semi-empirical models, response surface, and artificial neural networks. Food Bioprocess Technol. 2023, 16, 2126–2146. [Google Scholar] [CrossRef]
- Mann+Hummel. Product Specification–NADIR® UP150 P Ultrafiltration Membrane. Available online: https://water-membrane-solutions.mann-hummel.com/en.html (accessed on 10 November 2025).
- Mann+Hummel. Product Specification–BIO-CEL® L-2 Submerged MBR Module for Wastewater Treatment, Membrane Characteristics. Available online: https://water-membrane-solutions.mann-hummel.com/en.html (accessed on 10 November 2025).
- TQC Sheen. Datasheet–Spiral Bar Coated AB3050. Available online: www.industrialphysics.com (accessed on 10 November 2025).
- Sartorius, A.G. Technical Datasheet—Biostat® D-DCU. Available online: https://www.sartorius.com/download/10102/broch-biostat-d-dcu-sbi1512-e-data.pdf (accessed on 10 November 2025).
- Sandadi, S.; Pedersen, H.; Bowers, J.S.; Rendeiro, D. A comprehensive comparison of mixing, mass transfer, Chinese hamster ovary cell growth, and antibody production using Rushton turbine and marine impellers. Bioprocess Biosyst. Eng. 2011, 34, 819–832. [Google Scholar] [CrossRef] [PubMed]
- Eriksson, E.; Auffarth, K.; Henze, M.; Ledin, A. Characteristics of grey wastewater. Urban Water 2002, 4, 85–104. [Google Scholar] [CrossRef]
- Rahman, A.; Hasan, M.; Meerburg, F.; Jimenez, J.A.; Miller, M.W.; Bott, C.B.; Al-Omari, A.; Murthy, S.; Shaw, A.; De Clippeleir, H.; et al. Moving forward with A-stage and high-rate contact-stabilization for energy efficient water resource recovery facility: Mechanisms, factors, practical approach, and guidelines. J. Water Process Eng. 2020, 36, 101329. [Google Scholar] [CrossRef]
- Balice, V.; Cera, O. Acidic phenolic fraction of the olive vegetation water determined by a gas chromatographic method. Grasas Aceites 1984, 35, 178–180. [Google Scholar]
- Hamdi, M. Future prospects and constraints of olive mill wastewaters use and treatment: A review. Bioprocess Eng. 1993, 8, 209–214. [Google Scholar] [CrossRef]
- Khatib, A.; Aqra, F.; Yaghi, N.; Subuh, Y.; Hayeek, B.; Musa, M.; Basheer, S.; Sabbah, I. Reducing the environmental impact of olive mill wastewater. Am. J. Environ. Sci. 2009, 5, 1–6. [Google Scholar] [CrossRef]
- Salvemini, F. Composizione chimica e valutazione biologica di un mangime ottenuto essicando tercamente le acque di vegetazione delle olive. Riv. Sostanze Grasse 1985, 112, 559–564. [Google Scholar]
- Clech, P.L.; Jefferson, B.; Chang, I.S.; Judd, S.J. Critical flux determination by the flux-step method in a submerged membrane bioreactor. J. Membr. Sci. 2003, 227, 81–93. [Google Scholar] [CrossRef]
- Deng, L.; Guo, W.; Ngo, H.H.; Du, B.; Wei, Q.; Tran, N.H.; Nguyen, N.C.; Chen, S.S.; Li, J. Effects of hydraulic retention time and bioflocculant addition on membrane fouling in a sponge-submerged membrane bioreactor. Bioresour. Technol. 2016, 210, 11–17. [Google Scholar] [CrossRef]
- Díez, B.; Rosal, R. A critical review of membrane modification techniques for fouling and biofouling control in pressure-driven membrane processes. Nanotechnol. Environ. Eng. 2020, 5, 15. [Google Scholar] [CrossRef]
- Ladewig, B.; Al-Shaeli, M. Fouling in Membrane Bioreactors. In Fundamentals of MBRs; Springer Nature Singapore: Singapore, 2017; pp. 39–85. [Google Scholar] [CrossRef]
- Flemming, H.-C.; Schaule, G.; Griebe, T.; Schmitt, J.; Tamachkiarowa, A. Biofouling—The Achilles heel of membrane processes. Desalination 1997, 113, 215–225. [Google Scholar] [CrossRef]
- Platkowska-Siwied, A.; Bodzek, M. Influence of natural organic matter on fouling and ultrafiltration membranes properties—AFM analysis. Ecol. Chem. Eng. A 2012, 19, 1561–1570. [Google Scholar] [CrossRef]
- Figoli, A.; Hoinkis, J.; Gabriele, B.; De Luca, G.; Galiano, F.; Deowan, S.A. Bicontinuous Microemulsion Polymerised Coating for Water Treatment. European Patent EP3049178, 8 April 2020. [Google Scholar]


Disclaimer/Publisher’s Note: The statements, opinions and data contained in all publications are solely those of the individual author(s) and contributor(s) and not of MDPI and/or the editor(s). MDPI and/or the editor(s) disclaim responsibility for any injury to people or property resulting from any ideas, methods, instructions or products referred to in the content. |
© 2026 by the authors. Licensee MDPI, Basel, Switzerland. This article is an open access article distributed under the terms and conditions of the Creative Commons Attribution (CC BY) license.