

Location and Dynamics of Nymphaeol A in a Complex Membrane


Abstract
1. Introduction
2. Materials and Methods
2.1. Molecular Dynamics Simulation
2.2. Molecular Dynamics Specifications
2.3. Molecular Dynamics Analysis
3. Results
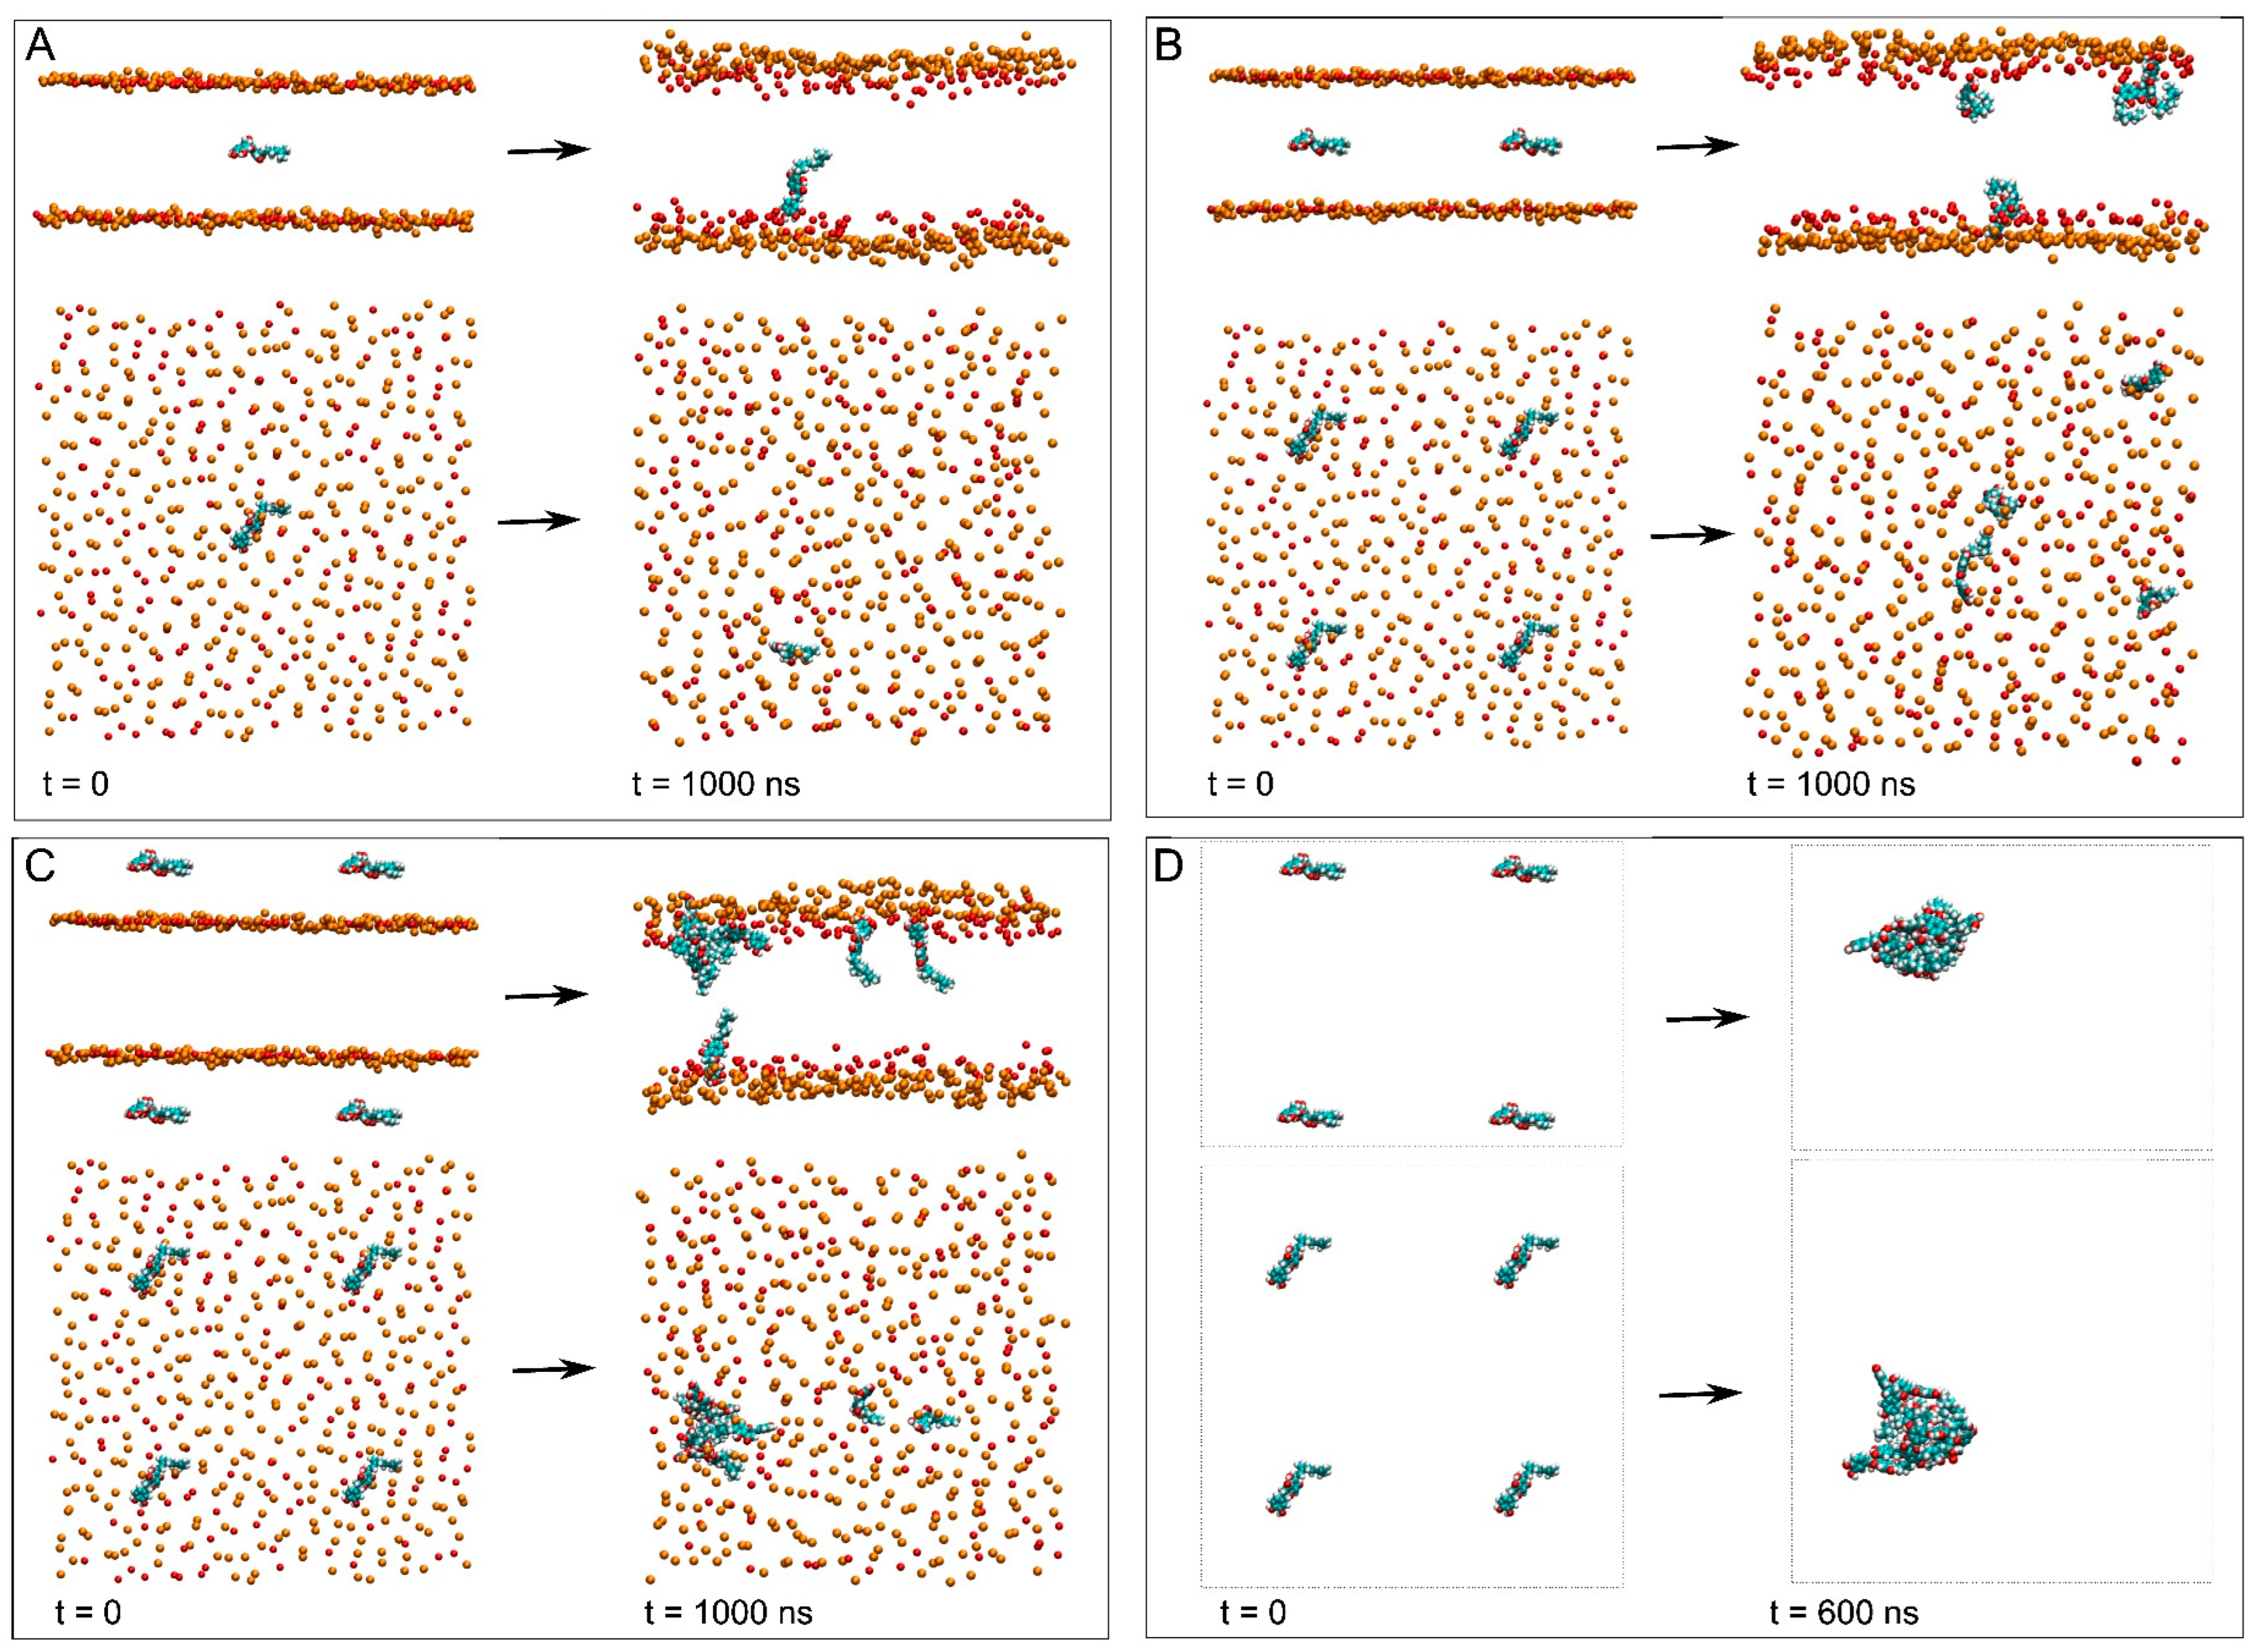
3.1. NYA in Water
3.2. Membrane Systems
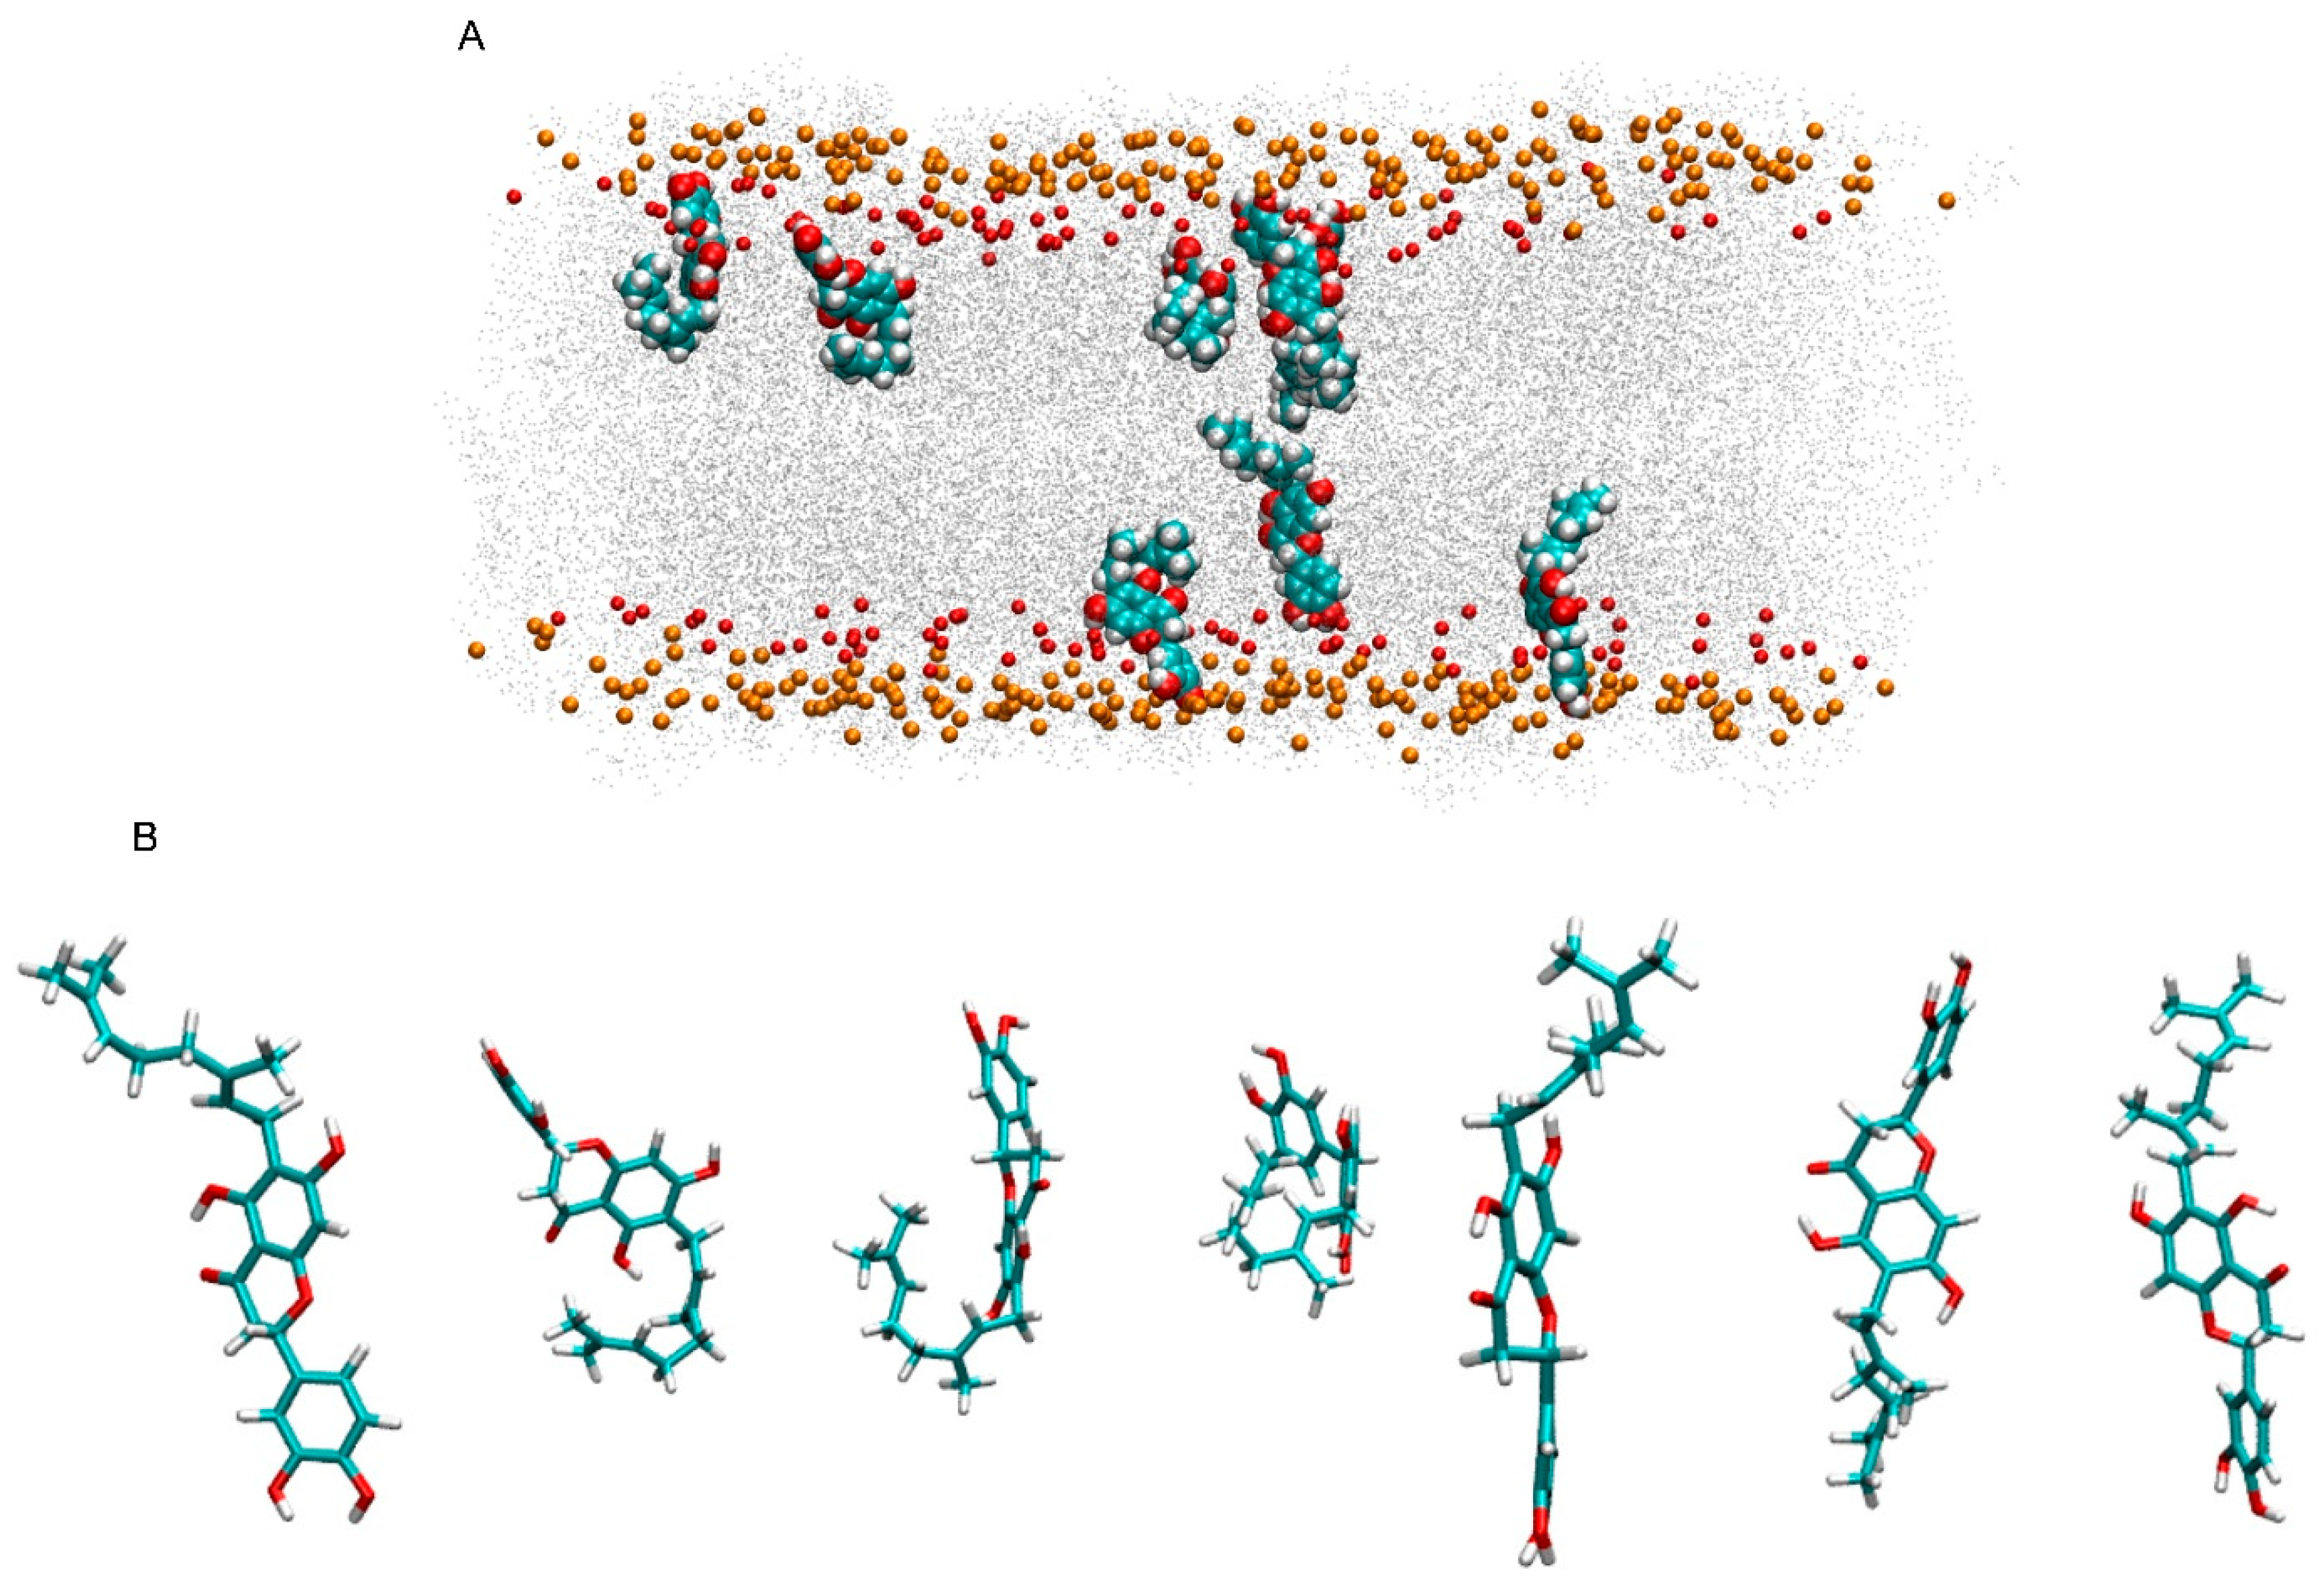
3.3. NYA Inside the Membrane
3.4. Angles Formed Between NYA and the Membrane
3.5. Lipid Density Profiles
3.6. Phospholipid Hydrocarbon Chain Order in the Presence of NYA
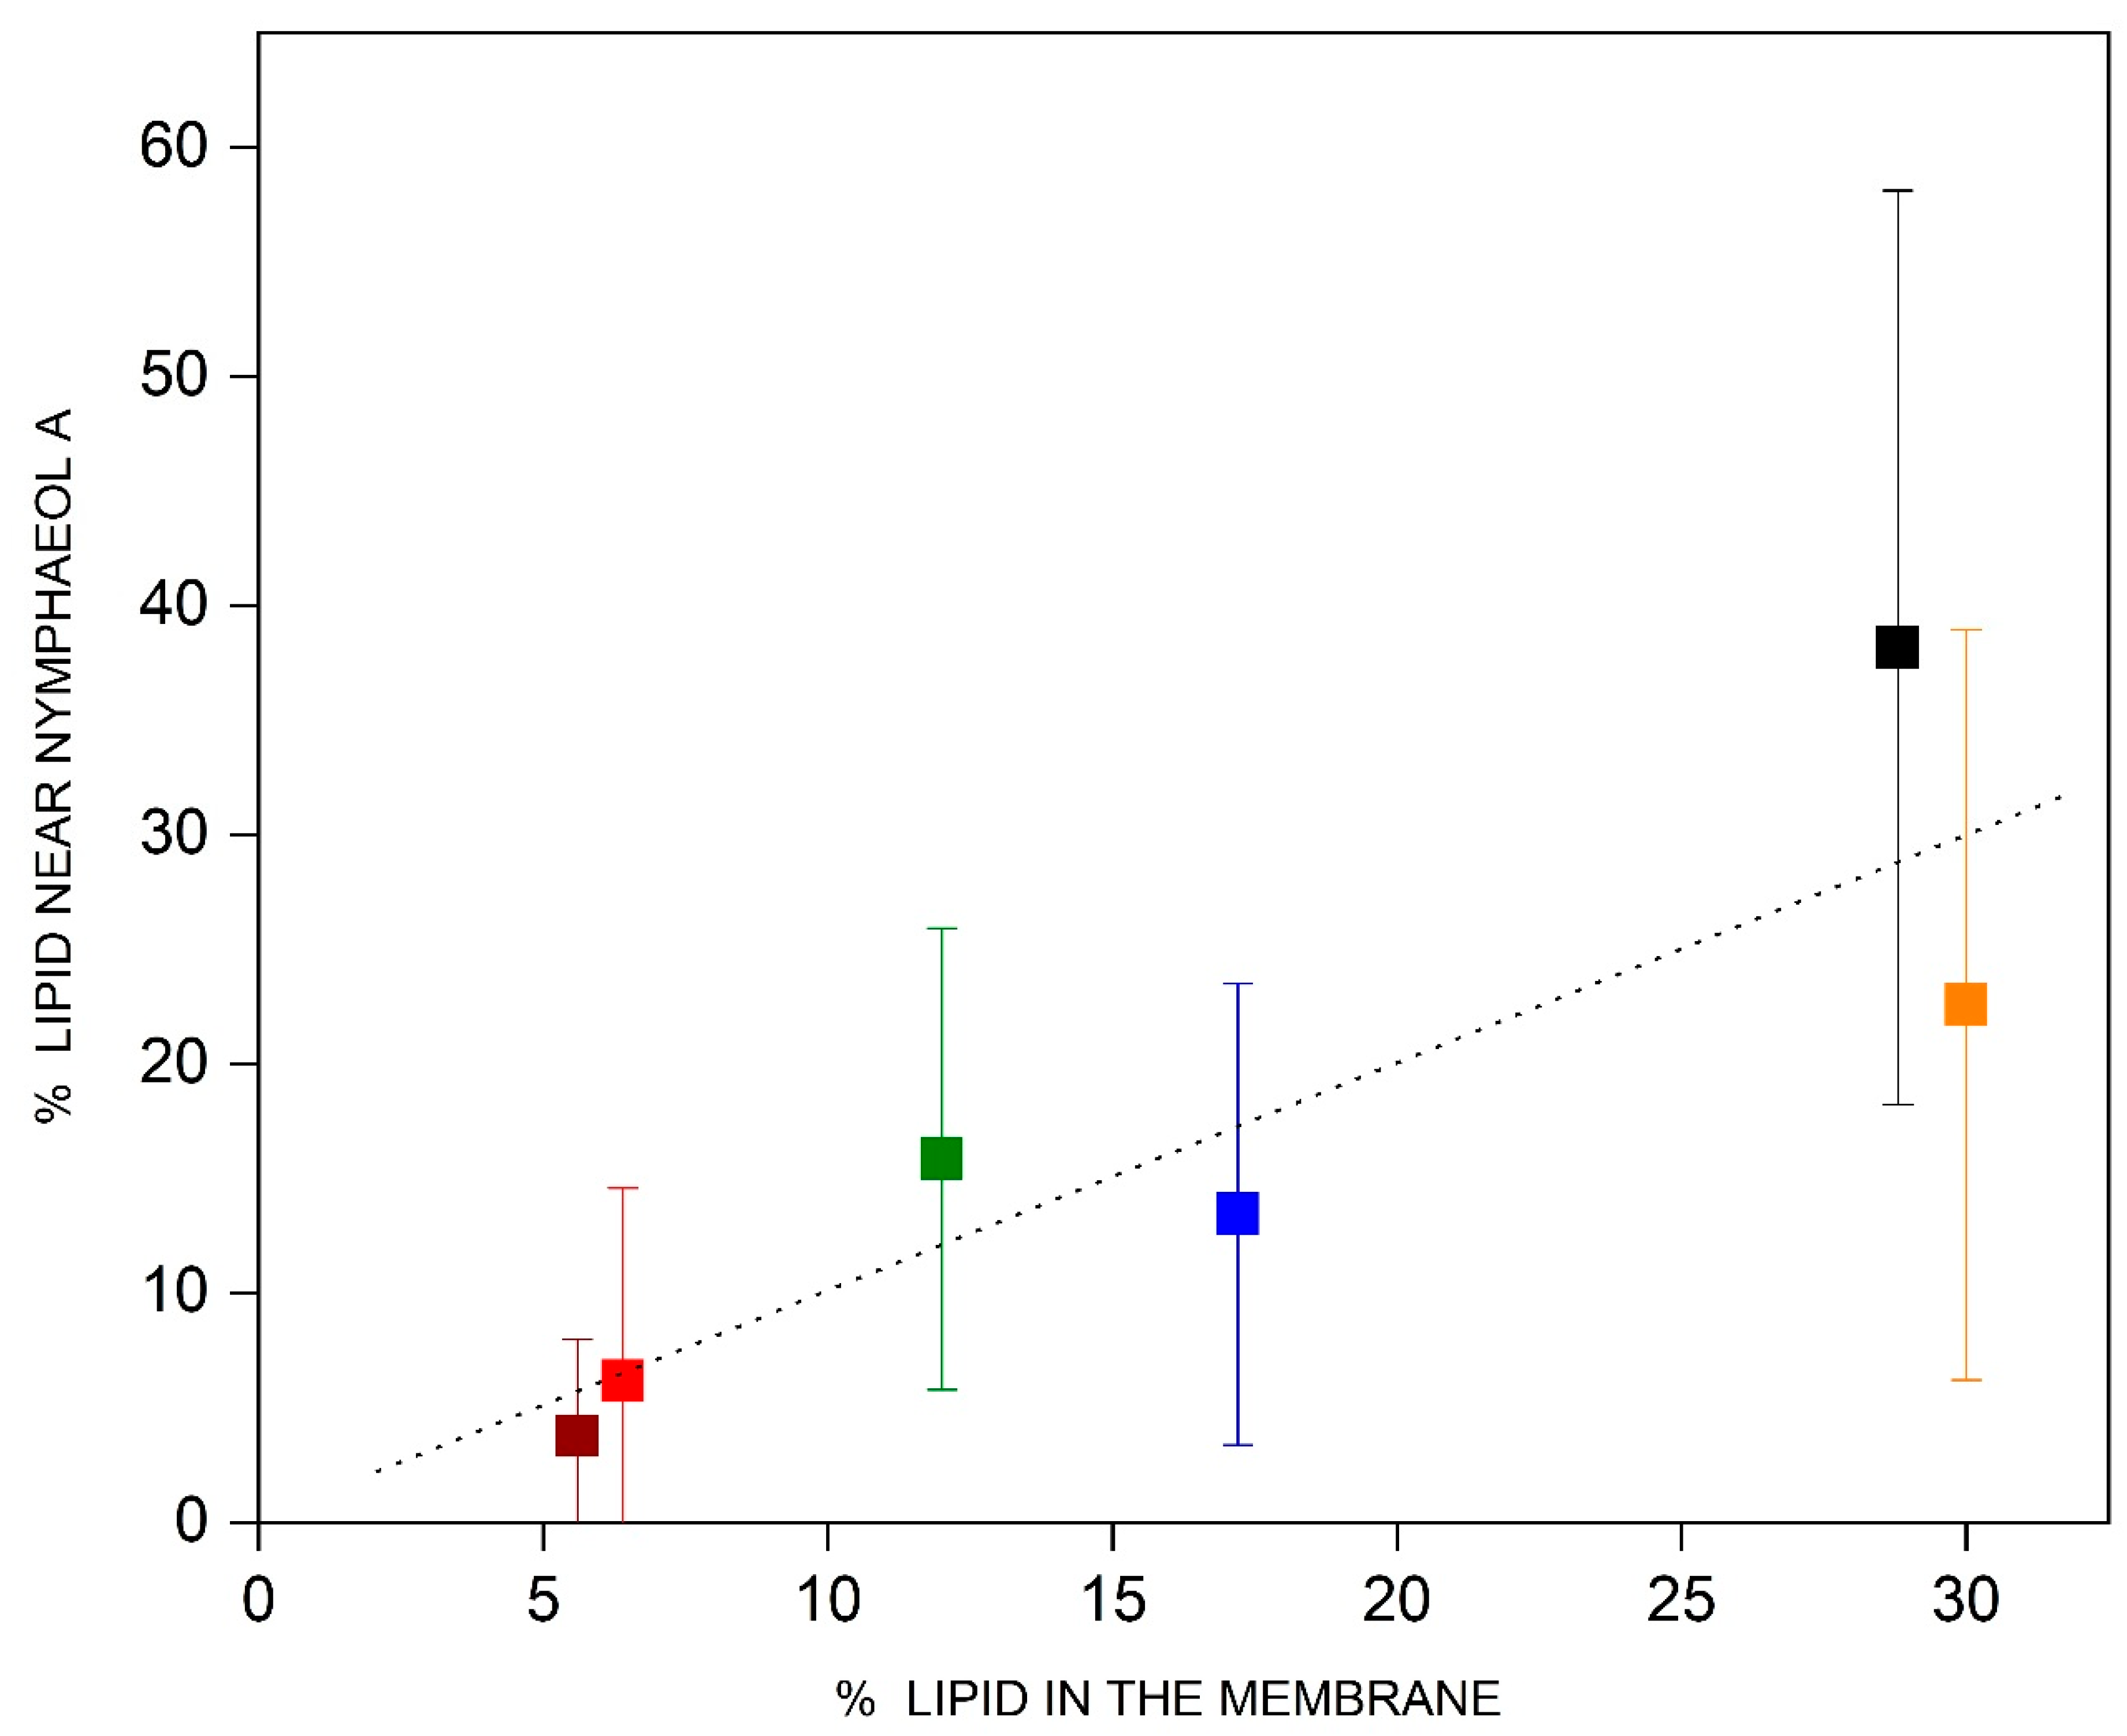
3.7. Lipid Molecules near NYA
3.8. Diffusion Coefficients
3.9. Hydrogen Bonds
4. Discussion
5. Conclusions
Supplementary Materials
Funding
Institutional Review Board Statement
Data Availability Statement
Acknowledgments
Conflicts of Interest
Abbreviations
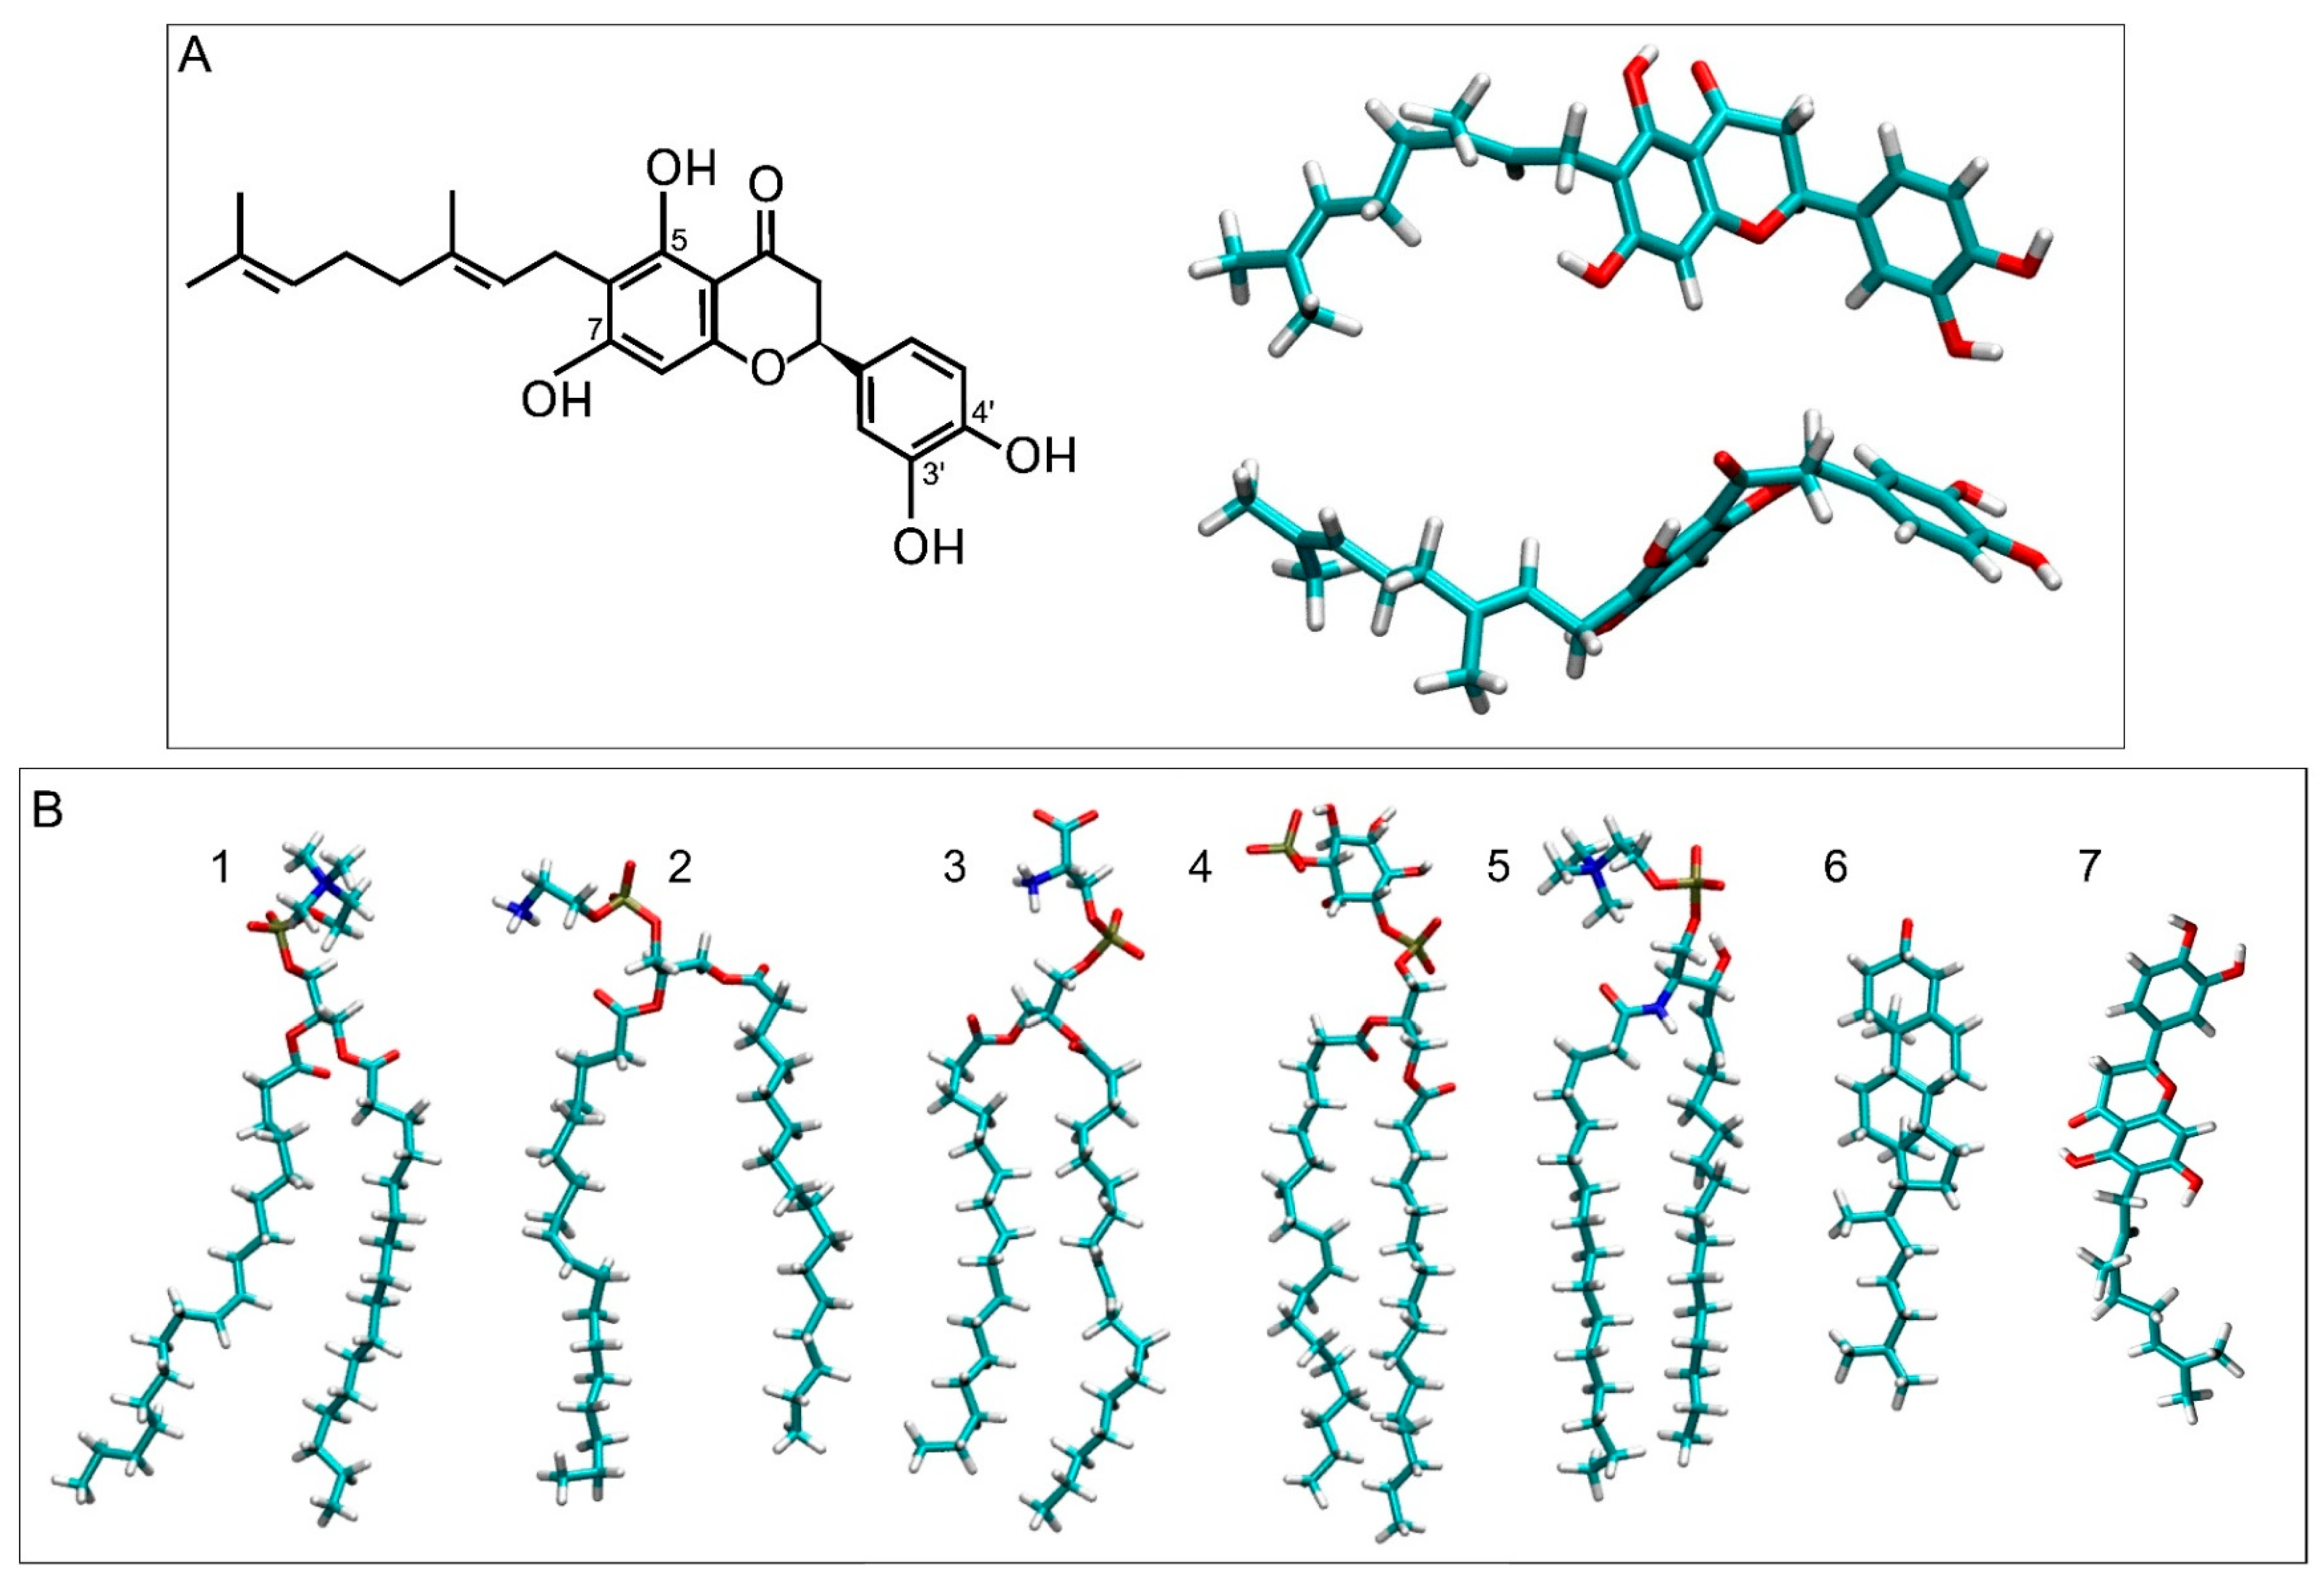
| NYA | 6-geranyl-3′,4′,5,7-tetrahydroxyflavanone |
| CHOL | cholesterol |
| PI-3P | 1-palmitoyl-2-oleoyl-sn-glycero-3-phosphoinositol-3-phosphate |
| POPC | 1-palmitoyl-2-oleoyl-sn-glycero-3-phosphocholine |
| POPE | 1-palmitoyl-2-oleoyl-sn-glycero-3-phosphoethanolamine |
| POPS | 1-palmitoyl-2-oleoyl-sn-glycero-3-phospho-L-serine |
| PSM | N-palmitoyl-D-erythro-sphingosylphosphorylcholine |
| z-COM | z-axis center-of-mass (z direction normal to the bilayer plane) |
References
- Arung, E.T.; Syafrizal; Kusuma, I.W.; Paramita, S.; Amen, Y.; Kim, Y.U.; Naibaho, N.M.; Ramadhan, R.; Ariyanta, H.A.; Fatriasari, W.; et al. Antioxidant, anti-inflammatory and anti-acne activities of stingless bee (Tetragonula biroi) propolis. Fitoterapia 2023, 164, 105375. [Google Scholar] [CrossRef] [PubMed]
- Nam, S.H.; Yamano, A.; Kim, J.A.; Lim, J.; Baek, S.H.; Kim, J.E.; Kwon, T.G.; Saito, Y.; Teruya, T.; Choi, S.Y.; et al. Prenylflavonoids isolated from Macaranga tanarius stimulate odontoblast differentiation of human dental pulp stem cells and tooth root formation via the mitogen-activated protein kinase and protein kinase B pathways. Int. Endod. J. 2021, 54, 1142–1154. [Google Scholar] [CrossRef] [PubMed]
- Shahinozzaman, M.; Taira, N.; Ishii, T.; Halim, M.A.; Hossain, M.A.; Tawata, S. Anti-Inflammatory, Anti-Diabetic, and Anti-Alzheimer’s Effects of Prenylated Flavonoids from Okinawa Propolis: An Investigation by Experimental and Computational Studies. Molecules 2018, 23, 2479. [Google Scholar] [CrossRef] [PubMed]
- Massaro, C.F.; Simpson, J.B.; Powell, D.; Brooks, P. Chemical composition and antimicrobial activity of honeybee (Apis mellifera ligustica) propolis from subtropical eastern Australia. Naturwissenschaften 2015, 102, 68. [Google Scholar] [CrossRef]
- Tsuchiya, I.; Hosoya, T.; Ushida, M.; Kunimasa, K.; Ohta, T.; Kumazawa, S. Nymphaeol-A Isolated from Okinawan Propolis Suppresses Angiogenesis and Induces Caspase-Dependent Apoptosis via Inactivation of Survival Signals. Evid. Based Complement. Altern. Med. 2013, 2013, 826245. [Google Scholar] [CrossRef]
- Zakaria, I.; Ahmat, N.; Jaafar, F.M.; Widyawaruyanti, A. Flavonoids with antiplasmodial and cytotoxic activities of Macaranga triloba. Fitoterapia 2012, 83, 968–972. [Google Scholar] [CrossRef]
- Chen, C.N.; Hsiao, C.J.; Lee, S.S.; Guh, J.H.; Chiang, P.C.; Huang, C.C.; Huang, W.J. Chemical modification and anticancer effect of prenylated flavanones from Taiwanese propolis. Nat. Prod. Res. 2012, 26, 116–124. [Google Scholar] [CrossRef]
- Ebner, D.W.; Woods, D.C.; Tran, T.D. Bioactive Polyphenolic Compounds from Propolis of Tetragonula carbonaria in the Gibberagee Region, New South Wales, Australia. Foods 2025, 14, 965. [Google Scholar] [CrossRef] [PubMed]
- Amalia, N.R.; Budhy, T.I.; Ridwan, R.D.; Rianti, D.; Bramantoro, T.; Luthfi, M.; Ramadhani, N.F.; Pramusita, A.; Putranti, N.A.R.; Nugraha, A.P.; et al. Propolis nanoemulsion extract from celebes stingless bee (Tetragonula biroi) phytochemistry and antibacterial analysis to periodontopathogen bacteria. J. Oral Biol. Craniofacial Res. 2025, 15, 576–584. [Google Scholar] [CrossRef]
- Balasubramaniam, A.K.; Elangovan, A.; Rahman, M.A.; Nayak, S.; Swain, D.; Babu, H.P.; Narasimhan, A.; Monga, V. Propolis: A comprehensive review on the nature’s polyphenolic wonder. Fitoterapia 2025, 183, 106526. [Google Scholar] [CrossRef]
- Deniz, F.S.S.; Orhan, I.E.; Filipek, P.A.; Ertas, A.; Gstir, R.; Jakschitz, T.; Bonn, G.K. Evaluation of the Anti-Aging Properties of Ethanolic Extracts from Selected Plant Species and Propolis by Enzyme Inhibition Assays and 2D/3D Cell Culture Methods. Pharmaceuticals 2025, 18, 439. [Google Scholar] [CrossRef] [PubMed]
- Martinotti, S.; Bonsignore, G.; Ranzato, E. Propolis: A Natural Substance with Multifaceted Properties and Activities. Int. J. Mol. Sci. 2025, 26, 1519. [Google Scholar] [CrossRef]
- Nguyen, B.C.Q.; Yoshimura, K.; Kumazawa, S.; Tawata, S.; Maruta, H. Frondoside A from sea cucumber and nymphaeols from Okinawa propolis: Natural anti-cancer agents that selectively inhibit PAK1 in vitro. Drug Discov. Ther. 2017, 11, 110–114. [Google Scholar] [CrossRef]
- Kumazawa, S.; Murase, M.; Momose, N.; Fukumoto, S. Analysis of antioxidant prenylflavonoids in different parts of Macaranga tanarius, the plant origin of Okinawan propolis. Asian Pac. J. Trop. Med. 2014, 7, 16–20. [Google Scholar] [CrossRef]
- Kumazawa, S.; Nakamura, J.; Murase, M.; Miyagawa, M.; Ahn, M.R.; Fukumoto, S. Plant origin of Okinawan propolis: Honeybee behavior observation and phytochemical analysis. Naturwissenschaften 2008, 95, 781–786. [Google Scholar] [CrossRef] [PubMed]
- Kumazawa, S.; Ueda, R.; Hamasaka, T.; Fukumoto, S.; Fujimoto, T.; Nakayama, T. Antioxidant prenylated flavonoids from propolis collected in Okinawa, Japan. J. Agric. Food Chem. 2007, 55, 7722–7725. [Google Scholar] [CrossRef] [PubMed]
- Kumazawa, S.; Goto, H.; Hamasaka, T.; Fukumoto, S.; Fujimoto, T.; Nakayama, T. A new prenylated flavonoid from propolis collected in Okinawa, Japan. Biosci. Biotechnol. Biochem. 2004, 68, 260–262. [Google Scholar] [CrossRef]
- Sood, B.; Patel, P.; Keenaghan, M. Coenzyme Q10. In StatPearls; Disclosure: Preeti Patel declares no relevant financial relationships with ineligible companies. Disclosure: Michael Keenaghan declares no relevant financial relationships with ineligible companies; Treasure Island (FL) Ineligible Companies: Treasure Island, FL, USA, 2024. [Google Scholar]
- Cores, A.; Carmona-Zafra, N.; Clerigue, J.; Villacampa, M.; Menendez, J.C. Quinones as Neuroprotective Agents. Antioxidants 2023, 12, 1464. [Google Scholar] [CrossRef]
- Gasmi, A.; Bjorklund, G.; Mujawdiya, P.K.; Semenova, Y.; Piscopo, S.; Peana, M. Coenzyme Q10 in aging and disease. Crit. Rev. Food Sci. Nutr. 2024, 64, 3907–3919. [Google Scholar] [CrossRef]
- Jomova, K.; Raptova, R.; Alomar, S.Y.; Alwasel, S.H.; Nepovimova, E.; Kuca, K.; Valko, M. Reactive oxygen species, toxicity, oxidative stress, and antioxidants: Chronic diseases and aging. Arch. Toxicol. 2023, 97, 2499–2574. [Google Scholar]
- Rizzo, A.M.; Berselli, P.; Zava, S.; Montorfano, G.; Negroni, M.; Corsetto, P.; Berra, B. Endogenous antioxidants and radical scavengers. Adv. Exp. Med. Biol. 2010, 698, 52–67. [Google Scholar] [PubMed]
- Orsucci, D.; Mancuso, M.; Ienco, E.C.; LoGerfo, A.; Siciliano, G. Targeting mitochondrial dysfunction and neurodegeneration by means of coenzyme Q10 and its analogues. Curr. Med. Chem. 2011, 18, 4053–4064. [Google Scholar] [CrossRef]
- Bentinger, M.; Brismar, K.; Dallner, G. The antioxidant role of coenzyme Q. Mitochondrion 2007, 7, S41–S50. [Google Scholar] [CrossRef] [PubMed]
- Wilson, D.M., III; Cookson, M.R.; Van Den Bosch, L.; Zetterberg, H.; Holtzman, D.M.; Dewachter, I. Hallmarks of neurodegenerative diseases. Cell 2023, 186, 693–714. [Google Scholar] [CrossRef]
- Ingolfsson, H.I.; Melo, M.N.; van Eerden, F.J.; Arnarez, C.; Lopez, C.A.; Wassenaar, T.A.; Periole, X.; de Vries, A.H.; Tieleman, D.P.; Marrink, S.J. Lipid organization of the plasma membrane. J. Am. Chem. Soc. 2014, 136, 14554–14559. [Google Scholar] [CrossRef] [PubMed]
- Perricone, U.; Gulotta, M.R.; Lombino, J.; Parrino, B.; Cascioferro, S.; Diana, P.; Cirrincione, G.; Padova, A. An overview of recent molecular dynamics applications as medicinal chemistry tools for the undruggable site challenge. Medchemcomm 2018, 9, 920–936. [Google Scholar] [CrossRef]
- Villalain, J. Location and interaction of idebenone and mitoquinone in a membrane similar to the inner mitochondrial membrane. Comparison with ubiquinone 10. Free Radic. Biol. Med. 2024, 222, 211–222. [Google Scholar] [CrossRef]
- Villalain, J. Bisphenol F and Bisphenol S in a Complex Biomembrane: Comparison with Bisphenol A. J. Xenobiot. 2024, 14, 1201–1220. [Google Scholar] [CrossRef]
- Phillips, J.C.; Hardy, D.J.; Maia, J.D.C.; Stone, J.E.; Ribeiro, J.V.; Bernardi, R.C.; Buch, R.; Fiorin, G.; Henin, J.; Jiang, W.; et al. Scalable molecular dynamics on CPU and GPU architectures with NAMD. J. Chem. Phys. 2020, 153, 044130. [Google Scholar] [CrossRef]
- Best, R.B.; Zhu, X.; Shim, J.; Lopes, P.E.; Mittal, J.; Feig, M.; Mackerell, A.D., Jr. Optimization of the additive CHARMM all-atom protein force field targeting improved sampling of the backbone ϕ, ψ and side-chain χ1 and χ2 dihedral angles. J. Chem. Theory Comput. 2012, 8, 3257–3273. [Google Scholar] [CrossRef]
- Vanommeslaeghe, K.; Hatcher, E.; Acharya, C.; Kundu, S.; Zhong, S.; Shim, J.; Darian, E.; Guvench, O.; Lopes, P.; Vorobyov, I.; et al. CHARMM general force field: A force field for drug-like molecules compatible with the CHARMM all-atom additive biological force fields. J. Comput. Chem. 2010, 31, 671–690. [Google Scholar] [CrossRef] [PubMed]
- Klauda, J.B.; Venable, R.M.; Freites, J.A.; O’Connor, J.W.; Tobias, D.J.; Mondragon-Ramirez, C.; Vorobyov, I.; MacKerell, A.D., Jr.; Pastor, R.W. Update of the CHARMM all-atom additive force field for lipids: Validation on six lipid types. J. Phys. Chem. B 2010, 114, 7830–7843. [Google Scholar] [CrossRef] [PubMed]
- Ozu, M.; Alvarez, H.A.; McCarthy, A.N.; Grigera, J.R.; Chara, O. Molecular dynamics of water in the neighborhood of aquaporins. Eur. Biophys. J. 2013, 42, 223–239. [Google Scholar] [CrossRef]
- Wu, E.L.; Cheng, X.; Jo, S.; Rui, H.; Song, K.C.; Davila-Contreras, E.M.; Qi, Y.; Lee, J.; Monje-Galvan, V.; Venable, R.M.; et al. CHARMM-GUI Membrane Builder toward realistic biological membrane simulations. J. Comput. Chem. 2014, 35, 1997–2004. [Google Scholar] [CrossRef]
- Murzyn, K.; Rog, T.; Jezierski, G.; Takaoka, Y.; Pasenkiewicz-Gierula, M. Effects of phospholipid unsaturation on the membrane/water interface: A molecular simulation study. Biophys. J. 2001, 81, 170–183. [Google Scholar] [CrossRef] [PubMed]
- Villalain, J. Localization and Aggregation of Honokiol in the Lipid Membrane. Antioxidants 2024, 13, 1025. [Google Scholar] [CrossRef] [PubMed]
- van Meer, G.; Voelker, D.R.; Feigenson, G.W. Membrane lipids: Where they are and how they behave. Nat. Rev. Mol. Cell Biol. 2008, 9, 112–124. [Google Scholar] [CrossRef]
- Esposito, D.L.; Nguyen, J.B.; DeWitt, D.C.; Rhoades, E.; Modis, Y. Physico-chemical requirements and kinetics of membrane fusion of flavivirus-like particles. J. Gen. Virol. 2015, 96, 1702–1711. [Google Scholar] [CrossRef]
- Humphrey, W.; Dalke, A.; Schulten, K. VMD: Visual molecular dynamics. J. Mol. Graph. 1996, 14, 33–38. [Google Scholar] [CrossRef]
- Guixa-Gonzalez, R.; Rodriguez-Espigares, I.; Ramirez-Anguita, J.M.; Carrio-Gaspar, P.; Martinez-Seara, H.; Giorgino, T.; Selent, J. MEMBPLUGIN: Studying membrane complexity in VMD. Bioinformatics 2014, 30, 1478–1480. [Google Scholar] [CrossRef]
- Galiano, V.; Villalain, J. Aggregation of 25-hydroxycholesterol in a complex biomembrane. Differences with cholesterol. Biochim. Biophys. Acta Biomembr. 2020, 1862, 183413. [Google Scholar] [CrossRef] [PubMed]
- Villalain, J. Envelope E protein of dengue virus and phospholipid binding to the late endosomal membrane. Biochim. Biophys. Acta Biomembr. 2022, 1864, 183889. [Google Scholar] [CrossRef]
- Villalain, J. Epigallocatechin-3-gallate location and interaction with late endosomal and plasma membrane model membranes by molecular dynamics. J. Biomol. Struct. Dyn. 2019, 37, 3122–3134. [Google Scholar] [CrossRef]
- Villalain, J. Bergamottin: Location, aggregation and interaction with the plasma membrane. J. Biomol. Struct. Dyn. 2023, 41, 12026–12037. [Google Scholar] [CrossRef] [PubMed]
- Villalain, J. Procyanidin C1 Location; Interaction, and Aggregation in Two Complex Biomembranes. Membranes 2022, 12, 692. [Google Scholar] [CrossRef]
- Giorgino, T. Computing 1-D atomic densities in macromolecular simulations: The Density Profile Tool for VMD. Comput. Phys. Commun. 2014, 185, 317–322. [Google Scholar] [CrossRef]
- Baylon, J.L.; Tajkhorshid, E. Capturing Spontaneous Membrane Insertion of the Influenza Virus Hemagglutinin Fusion Peptide. J. Phys. Chem. B 2015, 119, 7882–7893. [Google Scholar] [CrossRef]
- Giorgino, T. Computing diffusion coefficients in macromolecular simulations: The Diffusion Coefficient Tool for VMD. J. Open Source Softw. 2019, 4, 1698. [Google Scholar] [CrossRef]
- Kandt, C.; Ash, W.L.; Tieleman, D.P. Setting up and running molecular dynamics simulations of membrane proteins. Methods 2007, 41, 475–488. [Google Scholar] [CrossRef] [PubMed]
- Anezo, C.; de Vries, A.H.; Höltje, H.D.; Tieleman, D.P.; Marrink, S.J. Methodological issues in lipid bilayers simulations. J. Phys. Chem. B 2003, 107, 9424–9433. [Google Scholar] [CrossRef]
- Bera, I.; Klauda, J.B. Molecular Simulations of Mixed Lipid Bilayers with Sphingomyelin, Glycerophospholipids, and Cholesterol. J. Phys. Chem. B 2017, 121, 5197–5208. [Google Scholar] [CrossRef]
- Mukhopadhyay, P.; Monticelli, L.; Tieleman, D.P. Molecular dynamics simulation of a palmitoyl-oleoyl phosphatidylserine bilayer with Na+ counterions and NaCl. Biophys. J. 2004, 86, 1601–1609. [Google Scholar] [CrossRef]
- Tsai, H.H.; Lee, J.B.; Li, H.S.; Hou, T.Y.; Chu, W.Y.; Shen, P.C.; Chen, Y.Y.; Tan, C.J.; Hu, J.C.; Chiu, C.C. Geometrical effects of phospholipid olefinic bonds on the structure and dynamics of membranes: A molecular dynamics study. Biochim. Biophys. Acta 2015, 1848, 1234–1247. [Google Scholar] [CrossRef]
- Bockmann, R.A.; Hac, A.; Heimburg, T.; Grubmuller, H. Effect of sodium chloride on a lipid bilayer. Biophys. J. 2003, 85, 1647–1655. [Google Scholar] [CrossRef]
- Tieleman, D.P.; Marrink, S.J.; Berendsen, H.J. A computer perspective of membranes: Molecular dynamics studies of lipid bilayer systems. Biochim. Biophys. Acta 1997, 1331, 235–270. [Google Scholar] [CrossRef]


| Systems | 1 | 2 | 3 | 4 | |
|---|---|---|---|---|---|
| Nymphaeol A | 1 | - | - | - | |
| Nymphaeol A | - | 4 | - | - | |
| Nymphaeol A | - | - | 8 | - | |
| Nymphaeol A | - | - | - | 8 | |
| MD time (ns) | 1000 | 1000 | 1000 | 600 | |
| POPC | 28.8% | 144 | 144 | 144 | - |
| POPE | 17.2% | 86 | 86 | 86 | - |
| PI-3P | 5.6% | 28 | 28 | 28 | - |
| POPS | 6.4% | 32 | 32 | 32 | - |
| PSM | 12% | 60 | 60 | 60 | - |
| CHOL | 30% | 150 | 150 | 150 | - |
| ATOMS | 166,370 | 166,547 | 166,234 | 167,176 | |
| H2O | 36,413 | 36,413 | 36,230 | 55,464 | |
| H2O/LIPID | 72.8 | 72.8 | 72.5 | - | |
| Na+ | 219 | 219 | 219 | 156 | |
| Cl− | 103 | 103 | 103 | 156 | |
| DIMENSIONS x/y/z (Å) | 128/129/120 | 128/129/120 | 128/129/120 | 128/129/120 | |
Disclaimer/Publisher’s Note: The statements, opinions and data contained in all publications are solely those of the individual author(s) and contributor(s) and not of MDPI and/or the editor(s). MDPI and/or the editor(s) disclaim responsibility for any injury to people or property resulting from any ideas, methods, instructions or products referred to in the content. |
© 2025 by the author. Licensee MDPI, Basel, Switzerland. This article is an open access article distributed under the terms and conditions of the Creative Commons Attribution (CC BY) license (https://creativecommons.org/licenses/by/4.0/).
Share and Cite
Villalaín, J. Location and Dynamics of Nymphaeol A in a Complex Membrane. Membranes 2025, 15, 163. https://doi.org/10.3390/membranes15060163
Villalaín J. Location and Dynamics of Nymphaeol A in a Complex Membrane. Membranes. 2025; 15(6):163. https://doi.org/10.3390/membranes15060163
Chicago/Turabian StyleVillalaín, José. 2025. "Location and Dynamics of Nymphaeol A in a Complex Membrane" Membranes 15, no. 6: 163. https://doi.org/10.3390/membranes15060163
APA StyleVillalaín, J. (2025). Location and Dynamics of Nymphaeol A in a Complex Membrane. Membranes, 15(6), 163. https://doi.org/10.3390/membranes15060163